Embed Size (px)
Citation preview

PFG 2/2015, 0117–0127 ArticleStuttgart, April 2015
© 2015 E. Schweizerbart'sche Verlagsbuchhandlung, Stuttgart, Germany www.schweizerbart.deDOI: 10.1127/pfg/2015/0258 1432-8364/15/0258 $ 2.75
Multi-temporal Analysis of RapidEye Data to DetectNatural Vegetation Phenology During Two GrowingSeasons in the Northern Negev, Israel
Stefanie elSte, Cornelia GläSSer, ivo Walther & ChriStian Götze, Halle (Saale)
Keywords: RapidEye, phenology, natural vegetation, semi-arid, multi-temporal analysis
of these ecosystems. Phenology has proven tobe a very suitable tool for this because it com-prises “the study of the timing of recurring bi-ological events, the causes of their timing withregard to biotic and abiotic forces, and the in-terrelation among phases of the same or dif-ferent species” (Lieth 1974). Due to the spatialcoverage as well as financial and time relat-ed savings, remote sensing techniques provedto be very suitable for these kinds of analy-ses. For example until now especially dense
1 Introduction
The characteristic feature of arid and semi-aridecosystems is their high temporal and spatialvariability regarding precipitation (BLümeL
2013). Therefore, they are very vulnerable toadditional climate extremes in terms of cli-mate change (SchLeSinger et al. 1990). Henceit is important to monitor this vegetation in re-lation to climate to notice changes in their de-velopment for the management and protection
Summary: This study focused on the analysis ofsemi-arid natural vegetation phenology in theNorthern Negev in Israel during the two growingseasons in 2010/2011 and 2012/2013 with differentprecipitation patterns. The objective was to developa methodology based on vegetation indices to de-tect the characteristic phenological cycles of threetypes of vegetation, annual grasses, perennialshrubs and biological soil crusts, with multi-tempo-ral RapidEye data. For the first time the usage ofRapidEye’s high temporal resolution as well as itsred edge band enabled a detailed detection of thisphenology in semi-arid environments. In doing so,the vegetation indices differed in their suitabilityfor the different vegetation types. One could benefitfrom the Normalized Difference Vegetation Index(NDVI) for annual plants, the Normalized Differ-ence Red Edge Index (NDRE) for perennial plantsand the Modified Normalized Difference Vegeta-tion Index (MNDVI) for biological soil crusts. Thespatial distribution of the vegetation is illustratedby combining the three indices during their maxi-mal photosynthetic activity.
Zusammenfassung: Multitemporale Analyse vonRapidEye-Daten zur Untersuchung der phänologi-schen Entwicklung natürlicher Vegetation zweierVegetationsperioden in der nördlichen Negev, Isra-el. In vorliegender Studie wurde die phänologischeEntwicklung semiarider, natürlicher Vegetation imNorden der Wüste Negev während zwei Vegetati-onsperioden mit sehr unterschiedlichen Nieder-schlagsverhältnissen anhand von RapidEye-Datenuntersucht. Ziel ist die Entwicklung einer Methodeauf der Basis von Vegetationsindizes wie demNDVI, welche die charakteristischen phänologi-schen Zyklen der Vegetation ermittelt: einjährigeGräser, mehrjährige Büsche sowie biologischeKrusten. Die hohe temporale Auflösung der Rapid-Eye-Daten sowie der RedEdge Kanal ermöglichtenzum ersten Mal eine detaillierte Erfassung der Phä-nologie in diesem Gebiet. Die Indizes eignen sichdabei für die Vegetationstypen unterschiedlich gut.So konnten für mehrjährige Pflanzen der NDREsowie der MNDVI für biologische Krusten Infor-mationsgewinne liefern. Die räumliche Verbrei-tung der Vegetation wird durch die Kombinationjener Indizes, die die maximale photosynthetischeAktivität der Vegetationstypen widerspiegeln, dar-gestellt.

118 Photogrammetrie • Fernerkundung • Geoinformation 2/2015
id areas (Danin 1996). Dry conditions forcethese organisms into a latent state; only whenthey have some water they become physiologi-cally active and turn green due to their pho-tosynthetic activity (Danin 1996). Because ofthis very sensitive response to moisture, Kar-nieLi (2003) found that they are the first to be-come physiologically active at the beginningof the growing season when the first rainfalloccurred (Fig. 1). At this point annuals andperennials are still dormant, because water isonly available at the soil surface. The seeds ofannual vegetation in the deeper soil layers re-quire water to germinate, so they will not be-come active until more precipitation is avail-able, which occurs in the middle of the rainyseason. After the annuals fulfilled their devel-opment and become dry organic matter, pe-rennial plants start to become active at the endof the growing season, when water is availablefor their deeper roots.
From the remote sensing point of view itis very difficult to discriminate photosyn-thetically active biological soil crusts fromvital grasses and shrubs because their spec-tral signatures resemble each other (WeBer
et al. 2008). KarnieLi et al. (1999) discoveredthat phycobilin pigments in the crusts causea stronger reflection in the blue region of theelectromagnetic spectrum which facilitatesthe discrimination. When dry, their spectralsignature resembles soil (KarnieLi et al. 1999).
The objective of this study was to developa methodology to detect this characteristicnatural vegetation phenology based on veg-etation indices due to the different spectralcharacteristics of the vegetation types. Timeseries of RapidEye datasets with a high tem-poral resolution were analyzed for two sea-sons. 2010/2011 was a relatively dry seasonand 2012/2013 reached nearly the annual aver-age for the study area. The comparison of thephenology of these seasons should reveal thesensitive reaction of the vegetation to differentprecipitation patterns.
2 Study Area
Sayaret Shaked Park, a heterogeneous land-scape formed by loessial soils, is an areaof one km2 located in the Northern Negev
time series of NOAA AVHRR data were usedin semi-arid environments like the North-ern Negev because of its very high temporalresolution (SchmiDt & KarnieLi 2000, Wang
& tenhunen 2004). Contrarily, Landsat datawould provide more spatial details due to itsbetter spatial resolution but is limited con-cerning phenological analyses in very sen-sitive ecosystems in arid regions because ofits coarser temporal resolution (eLmore et al.2000). Consequently, a combination of hightemporal and spatial resolution data is need-ed to detect important phenological events aswell as changes in the spatial distribution ofvegetation especially in heterogeneous land-scapes like the Northern Negev. With the de-velopment of multi-sensor satellite systemssuch as RapidEye, the temporal resolution ofhigh spatial resolution optical sensors has in-creased remarkably. Therefore, multi-tempo-ral RapidEye data has been successfully ap-plied to classify vegetation units or differentplant parameter (SchuSter et al. 2012).
The Northern Negev is characterized bysparse natural vegetation cover that consistsof annual grasses, perennial shrubs and bio-logical soil crusts (KarnieLi 2003). KarnieLi
(2003) described that each of these vegetationtypes exhibit their own typical phenology inrelation to precipitation (Fig. 1). In the follow-ing these different phenologies are referred toas phenological cycles. In contrast to shrubsand grasses, biological soil crusts consist ofcyanobacteria, algae, mosses, fungi and li-chens (Danin 1996). These microphytes aretypically representative in arid and semi-ar-
Fig. 1: Phenology of different vegetation typesduring the growing season in the Negev, Israel(after Karnieli 2003).

Stefanie Elste et al., Multi-temporal Analysis of RapidEye Data 119
time series of RapidEye data were required.Hence, images were ordered every 10 days,but due to meteorological and technical con-ditions the scenes were sometimes limited.Finally, as shown in Fig. 2, for the season2010/2011 nine and for 2012/2013 thirteencloud-free images were used.
Preprocessing of the data included ortho-rectification of Level 1B data and an atmo-spheric correction with ATCOR® 2 of everyimage (richter & SchLäpfer 2012). Further-more, the geometric correction of the datawas improved by additional co-registrationbecause the spatial location of the scenes waspartly inaccurate. This is caused by the smallnumber of ground control points which var-ies from region to region and influences thespatial accuracy (BLacKBriDge 2013). In addi-tion to the satellite images, daily precipitationdata for the two seasons was available fromthe Ben-Gurion University weather station.During a field campaign in spring 2013 dif-ferent kinds of reference data were gatheredfrom various test sites, which were selectedseparately for areas with predominantly cov-erage of annual grasses, perennial bushes andbiological soil crusts. The data contained pho-tos of vegetation coverage during the growingseason, field mapping for the vegetation index(VI) analysis and GPS data, which served asreference pixel for each type of vegetation.
Due to their simple and robust application,vegetation indices, which proved to be verysuitable for remote sensing of vegetation, werechosen for the multi-temporal analysis (chu-
with center coordinates of 31°16’11’’ N and34°39’10’’ E in Israel. The annual mean pre-cipitation is 200 mm and mainly concentratesbetween November and April and constitutessemi-arid climatic conditions (KarnieLi et al.2002). During this rainy period, later referredto as growing season, vegetation get photo-synthetically active due to better moistureconditions (cLimate Service center 2.0 2014).The climatic and topographic conditions leadto a heterogeneous mosaic of perennial shrubs(e.g. Noaea mucronata, Thymelea hirsute), an-nual grasses (e.g. Stipa capensis, Avena bar-bata) and biological soil crusts which consistmostly of cyanobacteria (Burgheimer et al.2006). While shrubs and grasses settle pre-dominantly on sinks and slopes, the crustscover the whole soil surface (Burgheimer etal. 2006), which leads to a lot of transitionzones. One part of the park is closed off tolivestock grazing since 1987 (KarnieLi et al.2002) and represents a research area of theLong Term Ecological Research Programme(LTER) and the Experimentation in Ecosys-tem Research Programme (ExpeER). There-fore, it is possible to study the natural vegeta-tion in a small undisturbed ecosystem. Never-theless, very dry consecutive years led to thedeath of numerous perennial shrubs recently,which partly destabilizes the ecosystem (Sher
et al. 2012).
3 Data and Methodology
To cope with the sparseness and heterogene-ity of the vegetation cover in Shaked Park,RapidEye data was chosen for the multi-tem-poral analysis because it combines high tem-poral with high spatial resolution. The fiveidentical earth observation satellites locatedin a sun-synchronous orbit in approx. 630 kmheight record information in five multispectralbands with a temporal resolution of 1 to 5.5days and a spatial resolution of 6.5 m (BLacK-BriDge 2013). Designed predominantly foragriculture and forestry, RapidEye providesadditional information for vegetation applica-tions by the red edge channel from 690 nm –730 nm (BLacKBriDge 2013) (Tab. 1).
To characterize the seasonal phenology ofthe three vegetation types, temporal dense
Tab. 1: Spectral band widths of the RapidEyesensor.
Multispectral bands Band widths
Blue 440 nm – 510 nm
Green 520 nm – 590 nm
Red 630 nm – 685 nm
Red Edge 690 nm – 730 nm
NIR 760 nm – 850 nm

120 Photogrammetrie • Fernerkundung • Geoinformation 2/2015
erence pixels were averaged and visualized asVI curves and analyzed in relation to precipi-tation. These temporal profiles proved to be avery useful tool in phenological research withremote sensing data (förSter et al. 2012, raS-muSSen 1997, oDenWeLLer & JohnSon 1984,JuStice et al. 1985). Knowledge-based, ac-cordingly to Fig. 1, the slopes and local maxi-ma – as indicators of photosynthetic activity –in the graphs were assigned to the phenologi-cal cycles of the vegetation types. During thisprocess it was investigated which VI showsthe best result to characterize the phenologyof each vegetation type. Finally, the index im-ages with the maximal photosynthetic activityfor each type of vegetation were chosen andcombined in a false colour composite to illus-trate their spatial distribution.
4 Results
This section shows the results of the multi-temporal analyses. We determined the typicalphenological cycles for the two growing sea-sons 2010/2011 and 2012/2013 with multi-tem-poral remote sensing data as a function of timeand precipitation. A dotted line between eachindex value shall help to interpret the graphsin Figs. 3 and 4.
vieco & huete 2010). The NDVI (1) (rouSe etal. 1974) was selected as the basic VI since upto now it is proved as suitable tool for vegeta-tion analysis in numerous studies (pettoreLLi
2013). To test whether the red edge band pro-vides additional information for this study, theNDRE was used (2), where the NIR band ofthe NDVI formula is replaced by the red edgeband (BarneS et al. 2000). The red edge spec-tral region is also very sensitive for mappingstressed vegetation (eiteL et al. 2011). Fur-thermore, the specific spectral features of bio-logical soil crusts lead to the application of theMNDVI (3), where the blue band is integratedin the original NDVI formula (SimS & gamon
2002).
NIR REDNDVINIR RED
−=+
(1)
+Red Edge REDNDRERed Edge RED
−= (2)
2NIR REDMNDVI
NIR RED BLUE−=
+ −(3)
After preprocessing, each VI was calculat-ed for every reference pixel of the test sites.For each vegetation type the values of the ref-
Fig. 2: Acquisition dates of RapidEye data in relation to precipitation.

Stefanie Elste et al., Multi-temporal Analysis of RapidEye Data 121
of the 19th January was acquired briefly afterrainfall occurred (Fig. 2). Consequently, thisscene is very suitable to discriminate the phe-nological cycle of the crusts from the annu-al vegetation phenological cycle which startsabout one month later than the cycle of the soilcrusts. Since this increase cannot be found inthe NDVI curve, it indicates a benefit of theadditional blue spectral band of the MNDVIto detect the physiological activity of the soilcrusts. After this increase it also reaches itsmaximum in March and declines until May,similar to the NDVI of the annuals. This sup-ports the assumption of the peak of the phe-nological cycle of the annuals during March2011, because annuals appear on these sitestoo and cover the spectral signal of the crustsdue to their more intensive coverage at thistime.
Noticeably there is no further increase ofthese two indices at the end of the growingseason and therefore no sign of the activity ofperennial plants. In contrast to that, there is aslight increase in the curve of the NDRE forareas with predominantly perennial vegeta-tion cover from the beginning until the middleof May with a clearer decrease at the end ofJuly. Unfortunately there is no RapidEye im-age in June which could confirm this assump-tion. Even though this is just a slight indica-tion of the phenological cycle of the perenni-als it is an important sign of their activity inregards to this very dry year and the plant’s
4.1 Vegetation Period 2010/2011
Multi-temporal index profiles for the grow-ing season 2010/2011 are illustrated in Fig. 3.Based on our research it is observed thatcrusts got photosynthetically active relative-ly late, because significant rainfall did notoccur until the end of December. Therefore,the growing season started in late Decemberand ended in July. The NDVI of annual plantsstayed constant from December until the mid-dle of January although considerably rainfalloccurred during December and the beginningof January. Subsequently it increases rapid-ly to its peak from February until March be-cause the red portion of the electromagneticspectrum declines and the NIR increases dueto the photosynthetic activity. Afterwards, theNDVI declines to the level at the beginning inMay and June as a result of reduction of pho-tosynthetic activity which leads to a relativelystronger reflectance in the red spectral region.Based on the explanations to Fig. 1 a peak ofphotosynthetic activity in the middle of thegrowing season suggests the phenological cy-cle of annual vegetation.
At the beginning of the growing season theMNDVI shows a different behaviour in com-parison to the NDVI of the annuals, becauseit increases to the middle of January whenthe NDVI stood constant. This is an impor-tant indication of the photosynthetic activityof the crusts, because the RapidEye image
Fig. 3: Multi-temporal index profiles of the growing season 2010/2011.

122 Photogrammetrie • Fernerkundung • Geoinformation 2/2015
cycles and the growing season in general incomparison to 2010/2011. Accordingly to theprevious period, the multi-temporal profilesof the three VI are illustrated in relation toprecipitation in Fig. 4. As consequence of thedifferent precipitation pattern the vegetationtypes are active from November until May. Inthis figure relatively similar courses of the in-dex profiles with slight differences can be rec-ognized.
As seen in the previous season 2010/2011,the different behaviour of the NDVI of the an-nuals and the MNDVI of the crusts at the be-ginning of the growing season is repeating butoccurs earlier. The NDVI stays constant fromthe middle of October until the middle of No-vember although significant rainfall occurredjust two days before the RapidEye image inNovember was recorded. In the meantime theMNDVI of the crusts increases due to the sen-sitive reaction of these organisms to moisture.Again the combined analysis of these two in-dices proved to be suitable to discriminate thebeginning of the phenological cycle of the bi-ological soil crusts from the annual grasses.The MNDVI further increases from that pointuntil the 17th January. Three days after thisRapidEye image was taken, the MNDVI de-clines due to the missing precipitation whichleads to a decline of the photosynthetic activ-ity of the crusts. This would not be the caseif the annuals were already active so that this
partly critical health status due to the droughtfrom 2008 until 2010 (Sher et al. 2012). Fur-thermore, the fact that only the NDRE showsthe indication of this cycle it can be reasonedthat the red edge channel contributes to an im-proved detection of their photosynthetic activ-ity in Shaked Park.
In summary the phenological cycles for bi-ological soil crusts and annuals of the grow-ing season 2010/2011 could be detected com-pletely with the datasets. The phenologicalcycle of the annuals from the middle of Janu-ary until May with a peak from February untilMarch could be determined completely whilethe crust cycle started at the end of Decem-ber, due to the precipitation, with a peak in themiddle of January. Contrarily to the annuals,a clear end of the cycle of crusts could not bedetermined because the MNDVI does not de-cline before the annuals started to germinate.The start and end of the phenological cycle ofthe perennials was more complicated to de-termine because their scarce distribution andcritical health status led to a very low signal ofphotosynthetic activity in this very dry year.
4.2 Vegetation Period 2012/2013
The phenological cycles for natural vegetationduring the growing season 2012/2013 differin the timing as well as in the duration of the
Fig. 4: Multi-temporal index profiles of the growing season 2012/2013.

Stefanie Elste et al., Multi-temporal Analysis of RapidEye Data 123
explanation for that is the early beginning ofthe precipitation season that leads to a stron-ger signal of the photosynthetic activity of thebiological soil crusts which superimposed thatof the annuals so that the NDVI increases atthat early stage of this season.
Similar to the previous season (2010/2011)the phenological cycle of perennial vegeta-tion cannot be extracted from the multi-tem-poral profiles of the NDVI and MNDVI but isshown more clearly in the NDRE profile. Atthe end of the growing season the NDRE fallsnot directly after the decline since the peak ofthe annuals in March. From the end of Marchuntil the beginning of April it stays almostconstant before it declines until May which isagain an indication of the activity of perennialplants.
All in all the existent RapidEye images al-lowed the complete detection of the pheno-
point of time represents the end of the pheno-logical cycle of the crusts. After this declinethe MNDVI reaches its peak in March beforeit declines until May due to the photosyntheticactivity of the annuals which superimpose thesignal of the crusts because of their dense cov-erage at this point of time.
In contrast to that, the NDVI of the annualsstarts to increase continuously from the mid-dle of November to February where it reachesits maximum until March before it declinesat the end of April almost to the base level.Consequently, it does not decline in Januarylike the MNDVI. This is a clear sign of thephotosynthetic activity of the annuals at thattime. However, it is not definitely clear whenthe phenological cycle of the annuals startsbecause the NDVI increases already from thebeginning of the growing season 2010/2011which is unusual for these plants. A potential
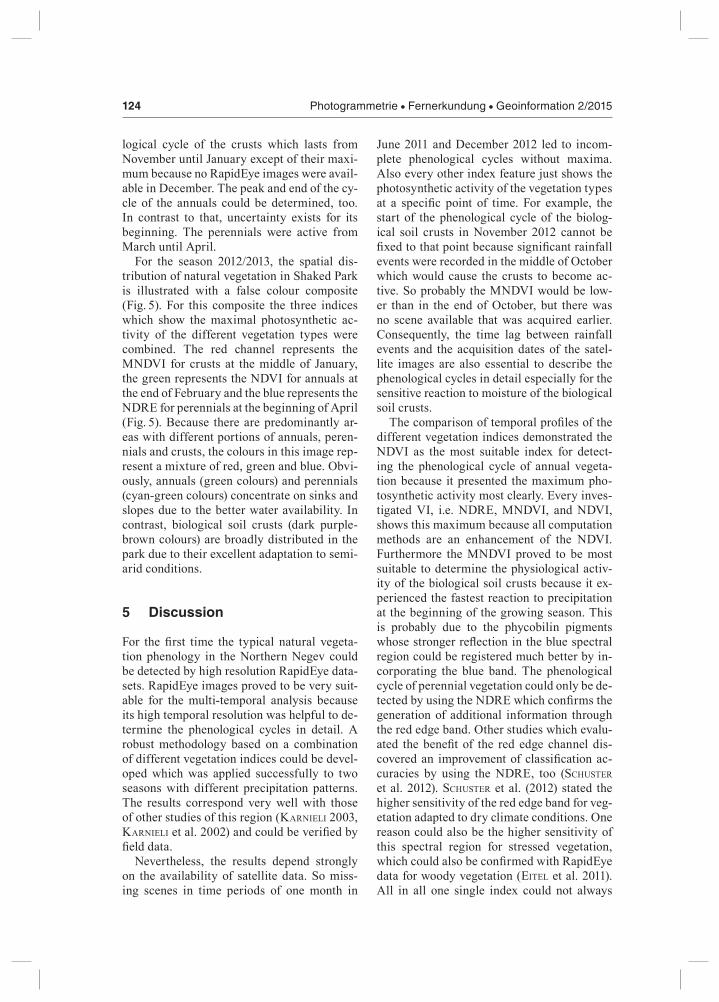
Fig. 5: False colour composite of index images of RapidEye data which show the maximal photo-synthetic activity of each vegetation type in Shaked Park.
124 Photogrammetrie • Fernerkundung • Geoinformation 2/2015
June 2011 and December 2012 led to incom-plete phenological cycles without maxima.Also every other index feature just shows thephotosynthetic activity of the vegetation typesat a specific point of time. For example, thestart of the phenological cycle of the biolog-ical soil crusts in November 2012 cannot befixed to that point because significant rainfallevents were recorded in the middle of Octoberwhich would cause the crusts to become ac-tive. So probably the MNDVI would be low-er than in the end of October, but there wasno scene available that was acquired earlier.Consequently, the time lag between rainfallevents and the acquisition dates of the satel-lite images are also essential to describe thephenological cycles in detail especially for thesensitive reaction to moisture of the biologicalsoil crusts.The comparison of temporal profiles of the
different vegetation indices demonstrated theNDVI as the most suitable index for detect-ing the phenological cycle of annual vegeta-tion because it presented the maximum pho-tosynthetic activity most clearly. Every inves-tigated VI, i.e. NDRE, MNDVI, and NDVI,shows this maximum because all computationmethods are an enhancement of the NDVI.Furthermore the MNDVI proved to be mostsuitable to determine the physiological activ-ity of the biological soil crusts because it ex-perienced the fastest reaction to precipitationat the beginning of the growing season. Thisis probably due to the phycobilin pigmentswhose stronger reflection in the blue spectralregion could be registered much better by in-corporating the blue band. The phenologicalcycle of perennial vegetation could only be de-tected by using the NDRE which confirms thegeneration of additional information throughthe red edge band. Other studies which evalu-ated the benefit of the red edge channel dis-covered an improvement of classification ac-curacies by using the NDRE, too (SchuSter
et al. 2012). SchuSter et al. (2012) stated thehigher sensitivity of the red edge band for veg-etation adapted to dry climate conditions. Onereason could also be the higher sensitivity ofthis spectral region for stressed vegetation,which could also be confirmed with RapidEyedata for woody vegetation (eiteL et al. 2011).All in all one single index could not always
logical cycle of the crusts which lasts fromNovember until January except of their maxi-mum because no RapidEye images were avail-able in December. The peak and end of the cy-cle of the annuals could be determined, too.In contrast to that, uncertainty exists for itsbeginning. The perennials were active fromMarch until April.
For the season 2012/2013, the spatial dis-tribution of natural vegetation in Shaked Parkis illustrated with a false colour composite(Fig. 5). For this composite the three indiceswhich show the maximal photosynthetic ac-tivity of the different vegetation types werecombined. The red channel represents theMNDVI for crusts at the middle of January,the green represents the NDVI for annuals atthe end of February and the blue represents theNDRE for perennials at the beginning of April(Fig. 5). Because there are predominantly ar-eas with different portions of annuals, peren-nials and crusts, the colours in this image rep-resent a mixture of red, green and blue. Obvi-ously, annuals (green colours) and perennials(cyan-green colours) concentrate on sinks andslopes due to the better water availability. Incontrast, biological soil crusts (dark purple-brown colours) are broadly distributed in thepark due to their excellent adaptation to semi-arid conditions.
5 Discussion
For the first time the typical natural vegeta-tion phenology in the Northern Negev couldbe detected by high resolution RapidEye data-sets. RapidEye images proved to be very suit-able for the multi-temporal analysis becauseits high temporal resolution was helpful to de-termine the phenological cycles in detail. Arobust methodology based on a combinationof different vegetation indices could be devel-oped which was applied successfully to twoseasons with different precipitation patterns.The results correspond very well with thoseof other studies of this region (KarnieLi 2003,KarnieLi et al. 2002) and could be verified byfield data.
Nevertheless, the results depend stronglyon the availability of satellite data. So miss-ing scenes in time periods of one month in

Stefanie Elste et al., Multi-temporal Analysis of RapidEye Data 125
growing seasons showed the shifting of phe-nological events due to the different precipita-tion patterns which emphasizes their role asimportant indicators of climate change andecosystem stability in a very vulnerable semi-arid environment. RapidEye datasets provedto be very suitable for the multi-temporal anal-ysis of phenological analyses in semi-arid en-vironments especially with regards to its hightemporal resolution and the gain of additionalinformation with the NDRE provided by thered edge band. The time-series allowed thedetection of natural vegetation phenology af-ter the scheme of (Fig. 1) in both seasons, butuncertainties exist for perennial shrubs due totheir scattered distribution and critical healthstatus. Also the transition between the startand end of the phenological cycles is highlyvariable because of their spatial overlap. Fu-ture work will aim on the adaption of the ap-proach to other sensors like WorldView-2 witha better spatial resolution of 2 m which canimprove the detection of the perennial shrubs.
Acknowledgements
We thank the DLR for providing data fromthe RapidEye Science Archive (RESA proj-ect no. 597). Financial support by the Trans-national Access to Research Infrastructuresactivity in the 7th Framework Programme ofthe EC under the ExpeER project for conduct-ing the research is gratefully acknowledged.We also want to thank Prof. arnon KarnieLi,ALexanDer goLDBerg and nataLia panov ofthe Remote Sensing Laboratory of the Ben-Gurion University of the Negev for the verygood cooperation. Furthermore we are grate-ful for the support of a research stay in Israelin the framework of the PROMOS programmeof the DAAD.
References
BarneS, e.m., cLarKe, t.r., richarDS, S.e., co-Laizzi, p.D., haBerLanD, J., KoStrzeWSKi, m.,WaLLer, p., choi, c., riLey, e., thompSon, t.,LaScano, r.J., Li, h. & moran, m.S., 2000: Co-incident detection of crop water stress, nitrogenstatus and canopy density using ground-basedmultispectral data. – roBert, p.c., ruSt, r.h. &
represent the whole natural vegetation phenol-ogy. In this study the NDRE in 2012/2013 wasthe only situation where this VI shows all phe-nological cycles together. Probably high pre-cipitation during this season led to a stronggrowth of the plants and therefore a strongspectral signal, but to be sure further analysesare required. Hence a combined analysis withthe three proposed VI is recommended.
Furthermore, the sensitive reaction of thenatural vegetation to different precipitationpatterns could be revealed by comparing thetiming and duration of the cycles for each sea-son. The variations of the durations of the cy-cles were less compared to variations in tim-ing. Due to the earlier onset of precipitationin the growing season 2012/2013, the pheno-logical cycles in this season started about onemonth prior to the average. For instance, thecycle of biological soil crusts started in the2012/2013 season in the middle of November,while in the previous season the start was dat-ed in the middle of January 2011. In general,the complete phenological development pat-tern is shifted to earlier dates by one month.This clearly demonstrates the good adaptionof desert plants to the highly temporal variablemoisture conditions.
6 Conclusion and Outlook
For the first time high resolution RapidEye im-ages allowed a detailed multi-temporal analy-sis concerning phenological events in a semi-arid region in Israel with high variability inprecipitation. To detect the characteristic nat-ural vegetation phenology a robust methodol-ogy based on a combination of the vegetationindices NDVI, MNDVI and NDRE was de-veloped, which can be applied independentlyto the distribution and quantity of precipita-tion. Each of these three indices turned out tobe suitable for one particular type of vegeta-tion: the MNDVI for biological soil crusts, theNDVI for annual grasses and the NDRE forperennial vegetation. Furthermore, the meth-odology allows analyses of the spatial distri-bution of this natural vegetation by combiningthe index images of the scene of the respectivemaximal activity of each component in a falsecolour composite. The comparison of two

126 Photogrammetrie • Fernerkundung • Geoinformation 2/2015
KarnieLi, a., 2003: Natural vegetation phenologyassessment by ground spectral measurements intwo semi-arid environments. – InternationalJournal of Biometeorology 47 (4): 179–187.
Lieth, h., 1974: Phenology and seasonality mode-ling. – Ecological Studies 8, Springer, NewYork, NY, USA.
oDenWeLLer, J.B. & JohnSon, K.i., 1984: CropIdentification Using Landsat Temporal-SpectralProfiles. – Remote Sensing of Environment 14(1–3): 39–54.
pettoreLLi, n., 2013: The Normalized DifferenceVegetation Index. – First Edition, 208 p., OxfordUniversity Press, New York, NY, USA.
raSmuSSen, m.S., 1997: Operational yield forecastusing AVHRR NDVI data: Reduction of envi-ronmental and inter-annual variability. – Inter-national Journal of Remote Sensing 18 (5):1059–1077.
richter, r. & SchLäpfer, D., 2012: Atmospheric/Topographic Correction for Satellite Imagery(ATCOR-2/3 User Guide). – http://www.dlr.de/eoc/Portaldata/60/Resources/dokumente/5_tech_mod/atcor3_manual_2012.pdf (13.5.2014).
rouSe, J.W., haaS, r.h., ScheLL, J.a., Deering,D.W. & harLan, J.c., 1974: Monitoring the ver-nal advancement and retrogradiation (green-wave effect) of natural vegetation. – NASA/GFSC Type III, Final Report, Greenbelt, MD,USA.
SchLeSinger, W.h., reynoLDS, J.f., cunningham,g.L., huenneKe, L.f., JarreLL, W.m., virginia,r.a. & WhitforD, W.g., 1990: Biological Feed-backs in Global Desertification. – Science 247(4946): 1043–1048.
SchmiDt, h. & KarnieLi, a., 2000: Remote Sensingof the seasonal variability of vegetation in asemi-arid environment. – Journal of Arid Envi-ronments 45: 43–59.
SchuSter, c., förSter, m. & KLeinSchmit, B., 2012:Testing the red edge channel for improving land-use classifications based on high-resolutionmulti-spectral satellite data. – InternationalJournal of Remote Sensing 33 (17): 5583–5599.
Sher, y., zaaDy, e., roonen, z. & neJiDat, a.,2012: Nitrification activity and levels of inor-ganic nitrogen in soils of a semi-arid ecosystemfollowing a drought-induced shrub death. – Eu-ropean Journal of Soil Biology 53: 86–93.
SimS, D.a. & gamon, J.a., 2002: Relationships be-tween leaf pigment content and spectral reflec-tance across a wide range of species, leaf struc-tures and developmental stages. – Remote Sens-ing of Environment 81 (2–3): 337–354.
Wang, Q. & tenhunen, J.D., 2004: Vegetation map-ping with multitemporal NDVI in North EasternChina Transect (NECT). – International Journal
LarSon, W.e. (eds.): Fifth International Confer-ence on Precision Agriculture: 1–15, Blooming-ton, IL, USA.
BLacKBriDge, 2013: Satellite Imagery ProductSpecifications. –http://www.blackbridge.com/rapideye/upload/RE_Product_Specifications_ENG.pdf (3.2.2014).
BLümeL, W.D., 2013: Wüsten – Entstehung, Kenn-zeichen, Lebensraum. – First Edition, 327 p., Ul-mer, Stuttgart.
Burgheimer, J., WiLSKe, B., maSeyK, K., KarnieLi,a., zaaDy, e., yaKir, D. & KeSSeLmeier, J.,2006: Ground and space spectral measurementsfor assessing the semi-arid ecosystem phenologyrelated to CO2 fluxes of biological soil crusts. –Remote Sensing of Environment 101 (1): 1–12.
chuvieco, e. & huete, a., 2010: Fundamentals ofSatellite Remote Sensing. – 436 p., CRC Press,Boca Raton, FL, USA.
cLimate Service center 2.0, 2014: http://www.climate-service-center.de/033626/in-dex_0033626.html.de (17.12.2014).
Danin, a., 1996: Plants of desert dunes. – Adapta-tion of desert organisms, 177 p., Springer, Ber-lin.
eiteL, J.u.h., vierLing, L.a., LitvaK, m.e., Long,D.S., SchuLtheSS, u., ager, a.a., KrofchecK,D.J. & StoSchecK, L., 2011: Broadband, red-edge information from satellites improves earlystress detection in a New Mexico conifer wood-land. – Remote Sensing of Environment 115(12): 3640–3646.
eLmore, a.J., muStarD, J.f., manning, S.J. & Lo-BeLL, D.B., 2000: Quantifying VegetationChange in Semiarid Environments: Precisionand Accuracy of Spectral Mixture Analysis andthe Normalized Difference Vegetation Index. –Remote Sensing of Environment 73 (1): 87–102.
förSter, S., KaDen, K., förSter, m. & itzerott, S.,2012: Crop type mapping using spectral-tempo-ral profiles and phenological information. –Computers and Electronics in Agriculture 89:30–40.
JuStice, c.o., toWnShenD, J.r.g., hoLBen, B.n. &tucKer, c.J., 1985: Analysis of the phenology ofglobal vegetation using meteorological satellitedata. – International Journal of Remote Sensing6 (8): 1271–1318.
KarnieLi, a., KiDron, g.J., gLäSSer, c. & Ben-Dor, e., 1999: Spectral Characteristics of Cya-nobacteria Soil Crust in Semiarid Environments.– Remote Sensing of Environment 69 (1): 67–75.
KarnieLi, a., gaBai, a., ichoKu, c., zaaDy, e. &ShachaK, m., 2002: Temporal dynamics of soiland vegetation spectral responses in a semi-aridenvironment. – International Journal of RemoteSensing 23 (19): 4073–4087.

Stefanie Elste et al., Multi-temporal Analysis of RapidEye Data 127
Address of the Authors:
Stefanie eLSte, B.Sc., Prof. Dr. corneLia gLäSSer,ivo WaLther, B.Sc. & Dr. chriStian götze, Mar-tin-Luther-University Halle-Wittenberg, Instituteof Geosciences and Geography, Department of Re-mote Sensing and Cartography, Von-Seckendorff-Platz 4, D-06120 Halle (Saale), Tel.: +49-0345-55-26020, e-mail: [email protected],[email protected], [email protected], [email protected].
Manuskript eingereicht: Juni 2014Angenommen: Dezember 2014
of Applied Earth Observation and Geoinforma-tion 6 (1): 17–31.
WeBer, B., oLehoWSKi, c., Knerr, t., hiLL, J.,DeutScheWitz, K., WeSSeLS, D.c.J., eiteL, B. &BüDeL, B., 2008: A new approach for mapping ofBiological Soil Crusts in semi-desert areas withhyperspectral imagery. – Remote Sensing of En-vironment 112 (5): 2187–2201.