Embed Size (px)
Citation preview
https://doi.org/10.15388/NA.2019.6.10Nonlinear Analysis: Modelling and Control, Vol. 24, No. 6, 1019–1033
eISSN: 2335-8963ISSN: 1392-5113
Multi-objective optimization and decision visualizationof batch stirred tank reactor based on spherical catalystparticles
Antanas Žilinskasa,1, Romas Baronasb,2, Linas Litvinasa,1, Linas Petkeviciusb,2
aInstitute of Data Science and Digital Technologies, Vilnius University,Akademijos str. 4, LT-08412 Vilnius, [email protected] of Computer Science, Vilnius University,Didlaukio str. 47, LT-08303 Vilnius, Lithuania
Received: May 9, 2019 / Revised: July 15, 2019 / Published online: November 8, 2019
Abstract. This paper presents a Bayesian approach rooted algorithm oriented to the properties ofmulti-objective optimization problems. The performance of the developed algorithm is comparedwith several other multi-objective optimization algorithms. The approach is applied to the multi-objective optimization of a batch stirred tank reactor based on spherical catalyst microreactors. Themicrobioreactors are computationally modeled by a two-compartment model based on reaction–diffusion equations containing a nonlinear term related to the Michaelis–Menten enzyme kinetics.A two-stage visualization procedure based on the multi-dimensional scaling is proposed and appliedfor the visualization of trade-off solutions and for the selection of favorable configurations of thebioreactor.
Keywords: multi-objective optimization, multi-dimensional scaling, microreactor, reaction–diffusion.
1 Introduction
Bioreactors, based on microparticles containing immobilized enzyme, permit a specificsubstrates conversion to a certain product, a use of small volumes of samples and reagents,reduced costs, short processing time and system compactness [18, 29]. For the develop-ment and improvement of highly efficient and productive bioreactors usually a number ofphysical and biochemical characteristics should be measured and considered [13, 18, 35].
With the aid of computer tools, the efforts for the design and optimization of bio-processes and bioelectronic devices can be remarkably reduced [33]. The multi-objectiveoptimization of bioprocesses and biosystems has been successfully applied in different
1The author was supported by the Research Council of Lithuania, grant No. S-MIP-17-61.2The author was supported by the Research Council of Lithuania, grant No. S-MIP-17-98.
c© 2019 Authors. Published by Vilnius University PressThis is an Open Access article distributed under the terms of the Creative Commons Attribution Licence,which permits unrestricted use, distribution, and reproduction in any medium, provided the original author andsource are credited.
1020 A. Žilinskas et al.
applications, particularly, for increasing the productivity and yield of bioreactors [22]and for the optimal design of amperometric biosensors [5]. The importance of the multi-objective optimization in chemical and biochemical engineering permanently increasesdue to the development of new methods sustained by increased computational resources[21, 32].
Multi-objective optimization tools provide a mechanism to obtain a certain number oftrade-off solutions, known as Pareto-optimal solutions [25]. Establishing an efficient ap-proach to find a set of solutions with good trade-off among different objectives has a greatpractical significance, as these allow engineers to gain insight into the key characteristicsof potentially good configurations before moving on to more detailed simulations and pi-lot commercial tests [16,22,32]. Trade-off curves as a visualisation of trade-off solutionsare widely used for learning and making decisions when designing products [23].
Multi-objective optimization models are often developed on a basis of mathematicalmodeling and numerical simulation of the processes [21, 22, 24, 32, 33]. The selectionof multi-objective optimization methods to tackle with those problems depends on themathematical model of the considered reactor [10, 24]. For the models of relatively lowcomputational complexity are appropriate metaheuristic algorithms, e.g., genetic algo-rithms and particle swarm optimization [10, 12, 17, 19, 26].
However, the mathematical models of bioreactors based on an array of enzyme-loadedparticles are described by transient nonlinear partial differential equations and the nu-merical solution often requires long lasting computations [2–4, 14, 34]. In such cases,the objective functions of the respective optimization problem is so called expensive,and Bayesian approach-based methods can be most appropriate for those optimizationproblems [24, 25].
This paper presents a Bayesian approach rooted algorithm oriented to the properties ofmulti-objective optimization problems [5]. The performance of the developed algorithmis compared with several other multi-objective optimization algorithms. The approachis applied to the multi-objective optimization of a batch stirred tank reactor based onspherical catalyst microreactors [4]. The following three objectives were optimized: thereactor operation time and the substrate and enzyme amounts. A two-stage visualizationprocedure based on the multi-dimensional scaling is proposed and applied for the visu-alization of trade-off solutions and for the selection of favorable configurations of thebioreactor [37, 38].
2 Mathematical model
2.1 Model domain
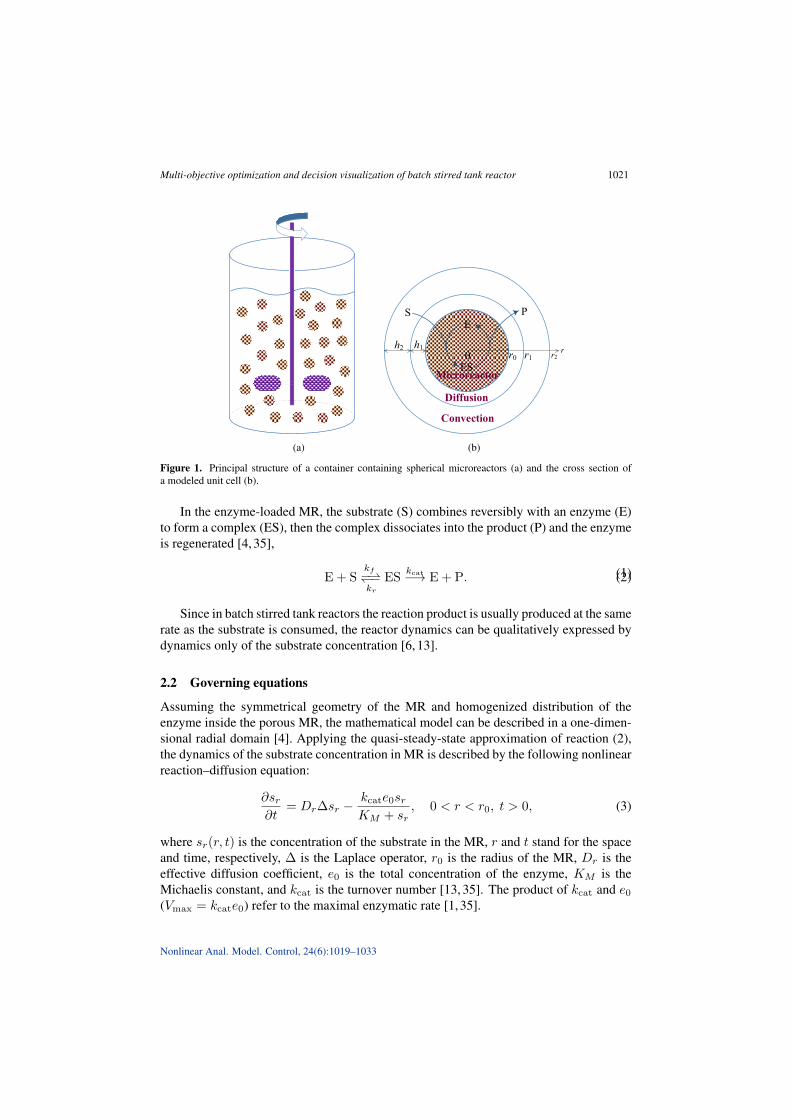
A batch stirred tank reactor containing an array of identical spherical microbioreactorsplaced is considered (see Fig. 1(a)). Assuming a uniform distribution of the microreactors,a unit cell can be considered [3, 4]. An enzyme-loaded microreactor (MR) occupies thecenter of the unit cell. The principal structure of the cross section of the modeled unit cellis presented in Fig. 1(b).
http://www.journals.vu.lt/nonlinear-analysis
Multi-objective optimization and decision visualization of batch stirred tank reactor 1021
(a) (b)
Figure 1. Principal structure of a container containing spherical microreactors (a) and the cross section ofa modeled unit cell (b).
In the enzyme-loaded MR, the substrate (S) combines reversibly with an enzyme (E)to form a complex (ES), then the complex dissociates into the product (P) and the enzymeis regenerated [4, 35],
(1)E + Skf−⇀↽−kr
ESkcat−→ E + P. (2)
Since in batch stirred tank reactors the reaction product is usually produced at the samerate as the substrate is consumed, the reactor dynamics can be qualitatively expressed bydynamics only of the substrate concentration [6, 13].
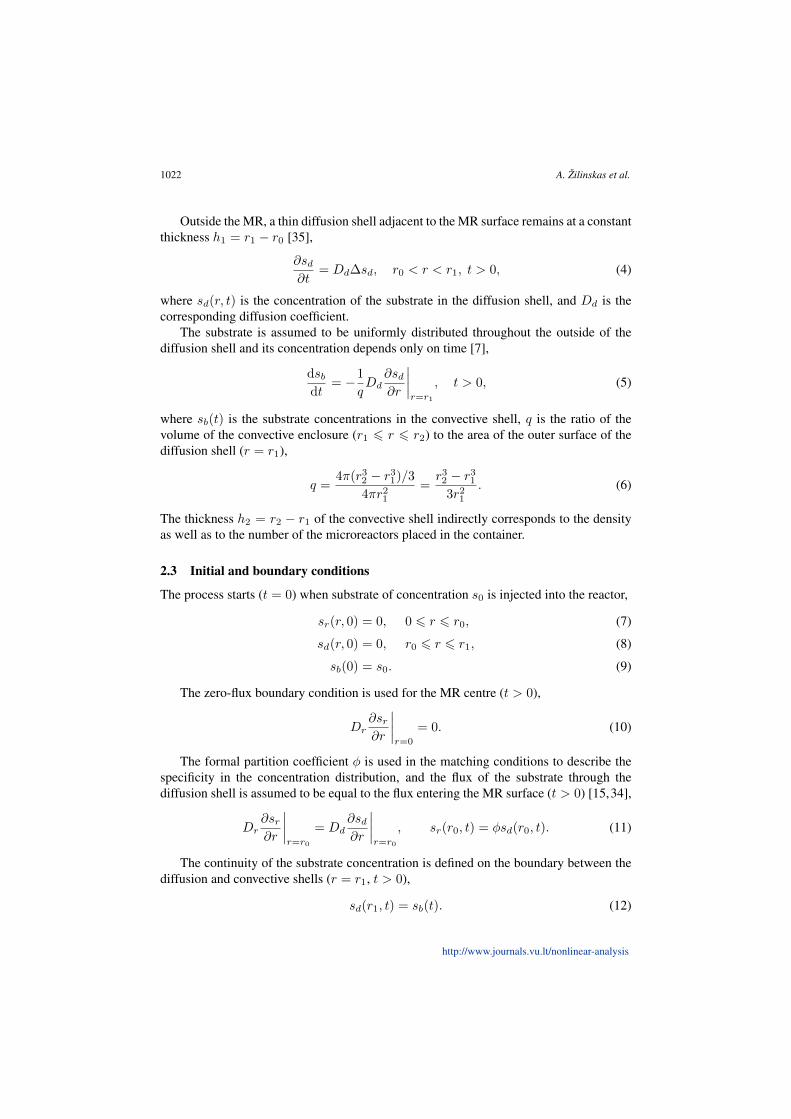
2.2 Governing equations
Assuming the symmetrical geometry of the MR and homogenized distribution of theenzyme inside the porous MR, the mathematical model can be described in a one-dimen-sional radial domain [4]. Applying the quasi-steady-state approximation of reaction (2),the dynamics of the substrate concentration in MR is described by the following nonlinearreaction–diffusion equation:
∂sr∂t
= Dr∆sr −kcate0srKM + sr
, 0 < r < r0, t > 0, (3)
where sr(r, t) is the concentration of the substrate in the MR, r and t stand for the spaceand time, respectively, ∆ is the Laplace operator, r0 is the radius of the MR, Dr is theeffective diffusion coefficient, e0 is the total concentration of the enzyme, KM is theMichaelis constant, and kcat is the turnover number [13, 35]. The product of kcat and e0(Vmax = kcate0) refer to the maximal enzymatic rate [1, 35].
Nonlinear Anal. Model. Control, 24(6):1019–1033
1022 A. Žilinskas et al.
Outside the MR, a thin diffusion shell adjacent to the MR surface remains at a constantthickness h1 = r1 − r0 [35],
∂sd∂t
= Dd∆sd, r0 < r < r1, t > 0, (4)
where sd(r, t) is the concentration of the substrate in the diffusion shell, and Dd is thecorresponding diffusion coefficient.
The substrate is assumed to be uniformly distributed throughout the outside of thediffusion shell and its concentration depends only on time [7],
dsbdt
= −1
qDd
∂sd∂r
∣∣∣∣r=r1
, t > 0, (5)
where sb(t) is the substrate concentrations in the convective shell, q is the ratio of thevolume of the convective enclosure (r1 6 r 6 r2) to the area of the outer surface of thediffusion shell (r = r1),
q =4π(r32 − r31)/3
4πr21=r32 − r31
3r21. (6)
The thickness h2 = r2 − r1 of the convective shell indirectly corresponds to the densityas well as to the number of the microreactors placed in the container.
2.3 Initial and boundary conditions
The process starts (t = 0) when substrate of concentration s0 is injected into the reactor,
sr(r, 0) = 0, 0 6 r 6 r0, (7)
sd(r, 0) = 0, r0 6 r 6 r1, (8)
sb(0) = s0. (9)
The zero-flux boundary condition is used for the MR centre (t > 0),
Dr∂sr∂r
∣∣∣∣r=0
= 0. (10)
The formal partition coefficient φ is used in the matching conditions to describe thespecificity in the concentration distribution, and the flux of the substrate through thediffusion shell is assumed to be equal to the flux entering the MR surface (t > 0) [15,34],
Dr∂sr∂r
∣∣∣∣r=r0
= Dd∂sd∂r
∣∣∣∣r=r0
, sr(r0, t) = φsd(r0, t). (11)
The continuity of the substrate concentration is defined on the boundary between thediffusion and convective shells (r = r1, t > 0),
sd(r1, t) = sb(t). (12)
http://www.journals.vu.lt/nonlinear-analysis
Multi-objective optimization and decision visualization of batch stirred tank reactor 1023
3 Multi-objective optimization problem
3.1 Problem statement
A minimization of time-cost is often sought by designers of biotechnological processes[18,31]. The batch time required to achieve a certain conversion of the reactants is usuallyassumed as the main characteristic of the process duration [13]. The reactor should convertas much substrate as possible within the shortest possible time.
In some applications of bioreactors, enzymes are available only in microgram to mil-ligram quantities and are very expensive [13, 35]. In such applications, the minimizationof the enzyme usage is of crucial importance. In the case of biocatalytic microreactorshown in Fig. 1(b), the amount of the enzyme loaded into the MR is equal to the productof the initial enzyme concentration e0 and the microreactor volume (Vr = 4πr30/3).The amount of enzyme loaded into all the microreactors placed into the container equalse0VrN , where N is the number of microreactors.
For the optimization, without losing generality, the volumetric density NV of mi-croreators placed in the container (NV = N/V ) can be used instead of the total numberN = 3V/(4πr32) of microreactors. Thus, the amount of enzyme used inNV microreactors(used per volume unit of the container) equals e0VrNV = e0VrN/V = e0 · 4πr30/3 ·3/(4πr32) = e0r
30/r
32 . Accordingly, the amount of the substrate in the bulk per volume
unit of the container can be expressed as follows: sb · 4π(r32− r31)/3 · 3/(4πr32) = sb(r32−r31)/r32 .
The optimal design of the batch reactor mathematically is stated as a multi-objectiveoptimization problem with three objective functions,
ϕ1(r0, e0, s0, r2) = t0.9 ={t: sb(t) = 0.1s0
},
ϕ2(r0, s0, r2) = 0.9sor32 − (r0 + h1)3
r32,
ϕ3(r0, e0, r2) =e0r
30
r32,
(13)
where ϕ1(·) stands for the batch time t0.9 required to convert 90% of the initial amountof the substrate [4], ϕ2(·) is the amount of the substrate per volume unit converted tothe product, and ϕ3(·) is the total amount of the enzyme used per volume unit of thereactor. The first and third objectives should be minimized while the second one shouldbe maximized.
The appropriate intervals of the decision variables for the optimal design problem aregiven in Table 1. Assuming the highly stirred reactor, the thickness h1 of the diffusionshell can be assumed as a constant parameter [3, 4]. The radius r2 of the unit cell can beexpressed via (independent) decision variables r0, h2, and the parameter h1 as follows:r2 = r0 + h1 + h2.
Additionally, only reactor configurations with reasonable batch time were considered.If the time required to convert 90% of the initial amount of the substrate is less thanthe time limit Tmax = 104 seconds (i.e., t0.9 6 104 s), the reactor configuration was
Nonlinear Anal. Model. Control, 24(6):1019–1033
1024 A. Žilinskas et al.
Table 1. Decision variables x = (x1, x2, x3, x4)T for the bioreactordesign problem.
Variable Description Range Unitsx1 r0 MR radius [10−4, 10−3] mx2 h2 Convective shell thickness [10−4, 10−3] mx3 e0 Enzyme concentration [10−8, 10−4] Mx4 s0 Substrate concentration [10−5, 10−1] M
considered as acceptable [4, 13, 35]. Otherwise the problem solution was excluded froma further analysis.
The following typical values of the model parameters were kept constant [1,11,13,35]:
Dd = 6 · 10−10 m2s−1, Dr = 2 · 10−10 m2s−1, φ = 0.7,
h1 = 6 · 10−5 m, KM = 10−2 M, kcat = 25 s−1.(14)
3.2 Optimization algorithm
A main challenge of the three-objective (13) optimization problem is the computationalcomplexity of the objective function ϕ1(x), the computation of which includes the nu-merical integration of the transient nonlinear governing equations [4]. Because of thenonlinearity of the initial boundary value problem (3)–(12), the bioreactor action wassimulated numerically using the finite difference method with explicit scheme [3, 4].Although explicit difference schemes have the strict stability limitations, these schemeshave a convenient algorithm of the calculation and are simple for programming [8]. Thecomputation of a single value of ϕ1(x) using computer with Intel Xeon X5650 2.66GHzprocessor can take up to 10 minutes.
For the solution of applied black-box multi-objective optimization prevail meta-heu-ristic methods [12, 30]. However, the objective functions of the considered problem arecomputationally expensive, and the solution of this problem by a meta-heuristic methodwould take prohibitive long computing time. For such, so called expensive, objectivefunctions, Bayesian methods proved to be efficient [25]. On the other hand, the inherentcomplexity of standard implementations of Bayesian methods limits the number of valuesof the objective functions which can be processed. The modest number of iterationsseems sufficient for the solution of various applied problems, e.g., up to 60 evaluationsof values of the objective functions in [24], 100 function evaluations in [27], and 200functions evaluations in [20]. However, such a number of function values is not sufficientfor the appropriate representation of the Pareto front of the considered three-objectiveoptimization problem. Therefore, a partition based implementation of the P-algorithm wasimplemented. The P-algorithm is a Bayesian approach rooted algorithm defined by themaximum probable improvements at each iteration. The improvement means a correctionof the approximation of the Pareto front, and the improvement probability is computedwith respect to the accepted statistical model of objective functions. The developed imple-mentation is based on the theoretical multi-objective method proposed in [36] and adaptsthe implementation of the single-objective P-algorithm proposed in [9]. The implementa-tion of the P-algorithm in [9] is based on the rectangular partition of the feasible region,
http://www.journals.vu.lt/nonlinear-analysis
Multi-objective optimization and decision visualization of batch stirred tank reactor 1025
where a hyper-rectangle for the bisection is selected according to maximum probabilityof the improvement of the estimate of global minimum. In the newly developed multi-objective generalization, the selection criterion is the probability of the correction of theapproximation of the Pareto front. The computational burden of the proposed algorithmis essentially lower than that of standard implementations of Bayesian algorithms. Thefurther reduction of computational burden is planned by the replacing the rectangularpartition with the simplicial partition; see, e.g., [39].
The optimization algorithm, as well as the bioreactor simulation algorithm, was im-plemented in C++ [4, 5, 28]. The computing time referenced below is measured experi-menting using computer with Intel Xeon X5650 2.66GHz processor.
3.3 Numerical example
The following bi-objective minimization problem is solved to illustrate the performanceof the developed algorithm by comparison its testing results with the testing results ofseveral other multi-objective optimization algorithms:
minx∈[0,1]2
f(x), f1(x) = (x1 − 1)x22 + 1, f2(x) = x2. (15)
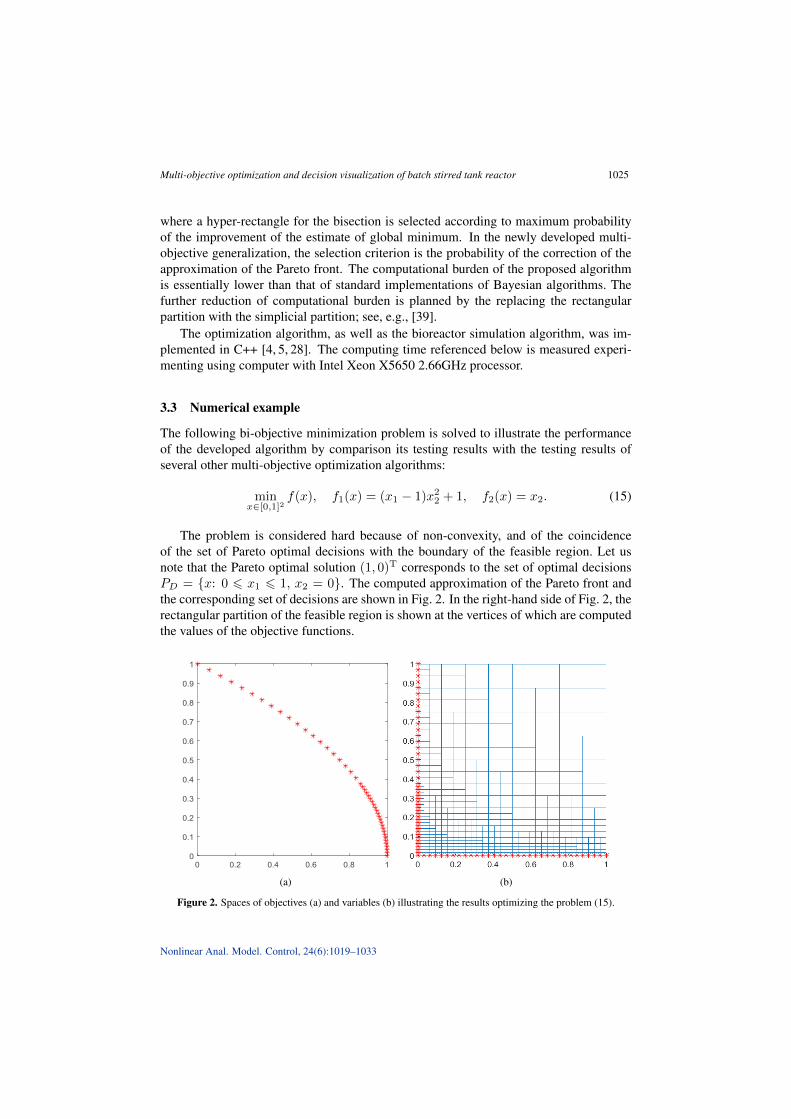
The problem is considered hard because of non-convexity, and of the coincidenceof the set of Pareto optimal decisions with the boundary of the feasible region. Let usnote that the Pareto optimal solution (1, 0)T corresponds to the set of optimal decisionsPD = {x: 0 6 x1 6 1, x2 = 0}. The computed approximation of the Pareto front andthe corresponding set of decisions are shown in Fig. 2. In the right-hand side of Fig. 2, therectangular partition of the feasible region is shown at the vertices of which are computedthe values of the objective functions.
(a) (b)
Figure 2. Spaces of objectives (a) and variables (b) illustrating the results optimizing the problem (15).
Nonlinear Anal. Model. Control, 24(6):1019–1033
1026 A. Žilinskas et al.
Table 2. Summary of the results of numerical examples.
Method NFE ε NGEN NP HV UDGenetic algorithm 500 500 104 0.312 1.116Monte Carlo 500 67 0.300 1.277Nonuniform covering 515 0.0675 29 0.306 0.210Multiobjective trisection 498 0.0630 68 0.308 0.175Proposed algorithm 500 45 0.333 0.129
The performance metrics of the proposed algorithm are presented in Table 2, wherethe performance of metrics of several other algorithms are also presented for compari-son [25]. The following notation is used in Table 2: NFE-number of evaluations of theobjective functions, ε – tolerance of the termination condition, NGEN-number of genera-tion in the termination criterion of the genetic algorithm, HV-hypervolume computed withrespect to the reference point (1, 1)T, NP-number of found non-dominated solutions, UD-uniformity of distribution of points approximating the Pareto front. For the convenienceof readers the definition of the metric UD follows [25]:
UD =
√√√√ k∑i=1
(di − d)2, d =1
k
k∑i=1
di,
where k is the number of found non-dominated points, and di is the minimum distancefrom the point of the set of non-dominated points indexed by i to the other point of thisset, i = 1, . . . , k.
3.4 Solution of the three-objective optimization problem
The considered optimization problem is three-objective (13) with four decision variables(Table 1). The variables in the problem description were defined in physical units. Theequations of the mathematical model are well conceivable when variables are presentedin natural units, however, the feasible values of variable in this case differ in severalorders. Since the transition to the logarithmic scale facilitates the proper partitioning ofthe feasible region by the considered optimization algorithm, the variables should be re-scaled. The new variables are: x = (x1, . . . , x4)T, x1 = lg r0, x2 = lg e0, x3 = lg s0,and x4 = lg h2, and the potential feasible region is
A = {x: − 4 6 x1, x4 6 −3, −8 6 x2 6 −4, −5 6 x3 6 −1}. (16)
The optimization algorithm uses internal scales, where the variables vary in the inter-val [0, 1]. We used the term “potential” in the definition ofA since some infeasible subsetsof A remain not defined explicitly. The infeasibility is determined during the simulationof the bioreactor action, meaning that the reactions in bioreactor are not completed duringthe time limit Tmax, i.e., t0.9 > Tmax. Since a returned undefined function value cancrash optimization process, the algorithm computing the objective functions was stoppedby reaching the predefined bioreactor batch time t0.9 = Tmax and returned the values ofthe objective functions corresponding to the maximum feasible simulation time.
http://www.journals.vu.lt/nonlinear-analysis
Multi-objective optimization and decision visualization of batch stirred tank reactor 1027
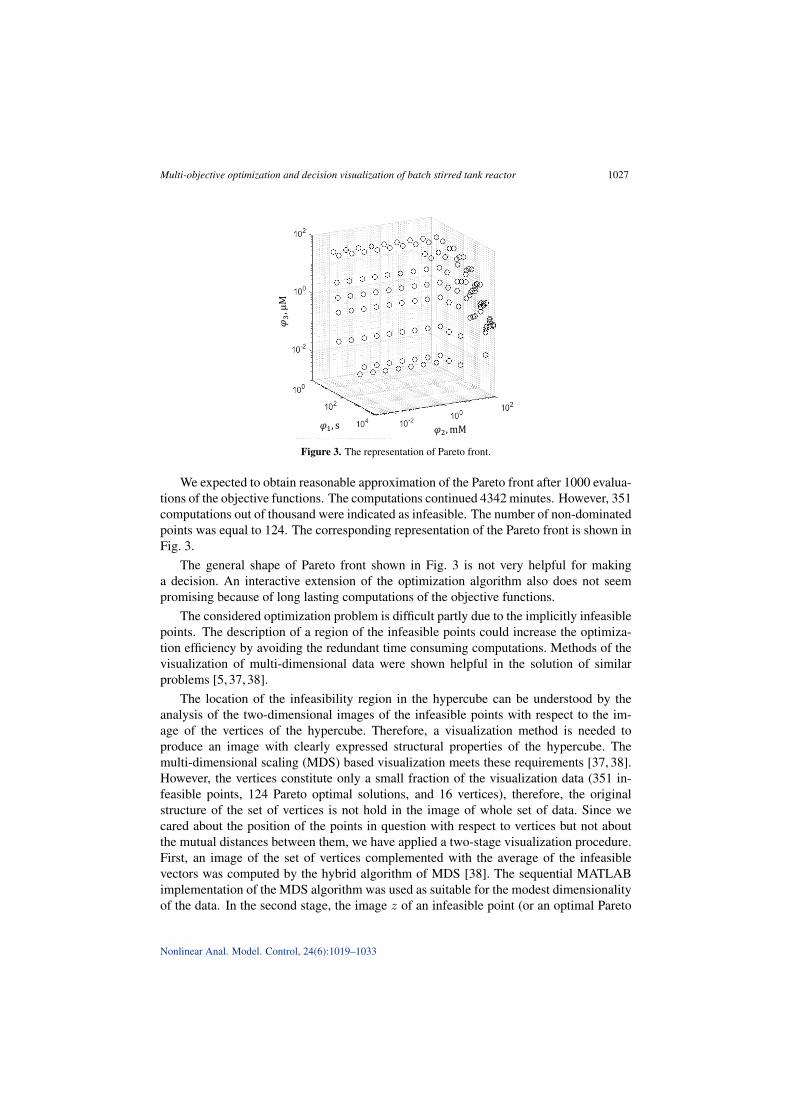
𝜑3,μM
𝜑2, mM
𝜑1, s
Figure 3. The representation of Pareto front.
We expected to obtain reasonable approximation of the Pareto front after 1000 evalua-tions of the objective functions. The computations continued 4342 minutes. However, 351computations out of thousand were indicated as infeasible. The number of non-dominatedpoints was equal to 124. The corresponding representation of the Pareto front is shown inFig. 3.
The general shape of Pareto front shown in Fig. 3 is not very helpful for makinga decision. An interactive extension of the optimization algorithm also does not seempromising because of long lasting computations of the objective functions.
The considered optimization problem is difficult partly due to the implicitly infeasiblepoints. The description of a region of the infeasible points could increase the optimiza-tion efficiency by avoiding the redundant time consuming computations. Methods of thevisualization of multi-dimensional data were shown helpful in the solution of similarproblems [5, 37, 38].
The location of the infeasibility region in the hypercube can be understood by theanalysis of the two-dimensional images of the infeasible points with respect to the im-age of the vertices of the hypercube. Therefore, a visualization method is needed toproduce an image with clearly expressed structural properties of the hypercube. Themulti-dimensional scaling (MDS) based visualization meets these requirements [37, 38].However, the vertices constitute only a small fraction of the visualization data (351 in-feasible points, 124 Pareto optimal solutions, and 16 vertices), therefore, the originalstructure of the set of vertices is not hold in the image of whole set of data. Since wecared about the position of the points in question with respect to vertices but not aboutthe mutual distances between them, we have applied a two-stage visualization procedure.First, an image of the set of vertices complemented with the average of the infeasiblevectors was computed by the hybrid algorithm of MDS [38]. The sequential MATLABimplementation of the MDS algorithm was used as suitable for the modest dimensionalityof the data. In the second stage, the image z of an infeasible point (or an optimal Pareto
Nonlinear Anal. Model. Control, 24(6):1019–1033
1028 A. Žilinskas et al.
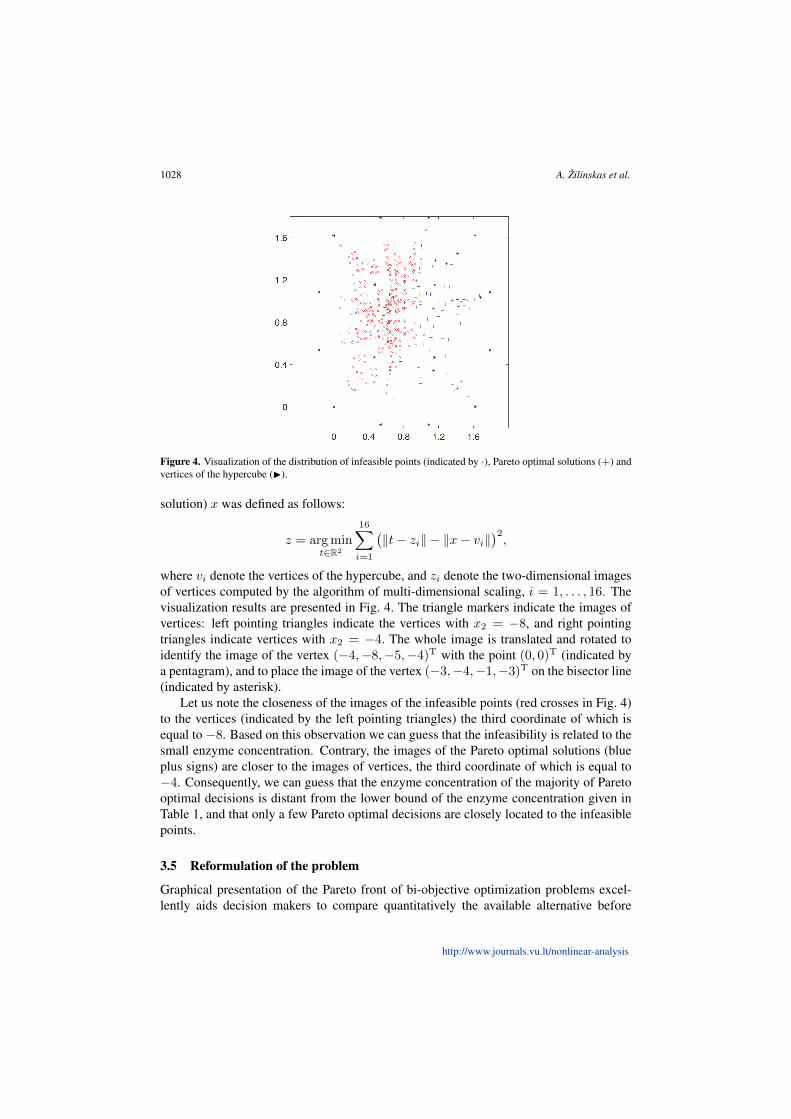
Figure 4. Visualization of the distribution of infeasible points (indicated by ·), Pareto optimal solutions (+) andvertices of the hypercube (I).
solution) x was defined as follows:
z = arg mint∈R2
16∑i=1
(‖t− zi‖ − ‖x− vi‖
)2,
where vi denote the vertices of the hypercube, and zi denote the two-dimensional imagesof vertices computed by the algorithm of multi-dimensional scaling, i = 1, . . . , 16. Thevisualization results are presented in Fig. 4. The triangle markers indicate the images ofvertices: left pointing triangles indicate the vertices with x2 = −8, and right pointingtriangles indicate vertices with x2 = −4. The whole image is translated and rotated toidentify the image of the vertex (−4,−8,−5,−4)T with the point (0, 0)T (indicated bya pentagram), and to place the image of the vertex (−3,−4,−1,−3)T on the bisector line(indicated by asterisk).
Let us note the closeness of the images of the infeasible points (red crosses in Fig. 4)to the vertices (indicated by the left pointing triangles) the third coordinate of which isequal to −8. Based on this observation we can guess that the infeasibility is related to thesmall enzyme concentration. Contrary, the images of the Pareto optimal solutions (blueplus signs) are closer to the images of vertices, the third coordinate of which is equal to−4. Consequently, we can guess that the enzyme concentration of the majority of Paretooptimal decisions is distant from the lower bound of the enzyme concentration given inTable 1, and that only a few Pareto optimal decisions are closely located to the infeasiblepoints.
3.5 Reformulation of the problem
Graphical presentation of the Pareto front of bi-objective optimization problems excel-lently aids decision makers to compare quantitatively the available alternative before
http://www.journals.vu.lt/nonlinear-analysis
Multi-objective optimization and decision visualization of batch stirred tank reactor 1029
decision making. However, in the case of three objective problems, similar 3D graphs areuseful rather for a qualitative illustration of the Pareto front than for the tradeoff betweenpotential decisions. Fortunately, the considered problem (13) and (16) can be reducedto several bi-objective problems. The structure of the considered optimization problemis favorable to reformulation which not only reduces the number of objectives but alsothe number of variables. The idea is following. Let fix several favorable values of thirdobjective function, and compute and draw the Pareto fronts of the modified, bi-objective,optimization problems. An appropriate solution can be found by interpolating betweenthe drawn fronts.
Let us reformulate the original optimization problem by introducing a new indepen-dent variable r2. h2 becomes dependent and is expressed through variables r2, r0 andconstant parameter h1, h2 = r2 − r0 − h1. Instead of functions φ(·), we will considertheir (decimal) logarithms
minx∈A
F (x), F (x) =(f1(x), −f2(x), f3(x)
)T,
f1(x) = lgϕ1(x),
f2(x) = lgϕ2(x) = lg 0.9 + x3 + lg(103x4 −
(10x1 + h1
)3 )− 3x4,
f3(x) = lgϕ3(x) = x2 + 3x1 − 3x4,
(17)
where x1 = lg r0, x2 = lg e0, x3 = lg s0 and x4 = lg r2.The feasible region is expressed by the bounds defined for the original independent
variables,
A ={x: −4 6 x1 6 −3, −8 6 x2 6 −4, −5 6 x3 6 −1,
lg(2.6)− 4 6 x4 6 lg(2.06)− 3}.
Let us fix an appropriate value of f3(·), E = f3(x). The last equation of (17) can berewritten in the form
x4 = x1 +x2 − E
3,
meaning that the number of independent variables can be reduced to three, and the opti-mization problem (17) can be reduced to the following bi-objective parametric minimiza-tion problem:
minx∈X
F (x), F (x) =(f1(x), −f2(x)
)T, x = (x1, x2, x3)T, (18)
where the feasible region X of three independent variables is defined as follows:
X =
{x: 4 6 x1 6 −3, −8 6 x2 6 −4, −5 6 x3 6 −1,
E
3− 4 + lg(2.6) 6 x1 +
x23
6E
3− 3 + lg(2.06)
}.
Nonlinear Anal. Model. Control, 24(6):1019–1033
1030 A. Žilinskas et al.
The reformulated problem is more convenient for an analysis since the number ofvariables and objectives is smaller than in the original problem. The time-consuming com-putation of the first objective f1(·) remains the main difficulty of the problem. However,an acceptable solution can be achieved with smaller number of the evaluations of theobjective functions because of the reduced dimensionality.
3.6 Analysis of optimal solutions
Three multi-objective optimization problem (18) was solved with the following threevalues of the parameter E: −7, −6.5, −6, where E denotes a fixed value of f3(·). Thesevalues of E corresponds to the following relatively high values of the enzyme amount ϕ3
required per volume unit of the reactor: 10−7, 10−6.5 and 10−6 M.The multi-objective optimization algorithm used for the three objective optimization
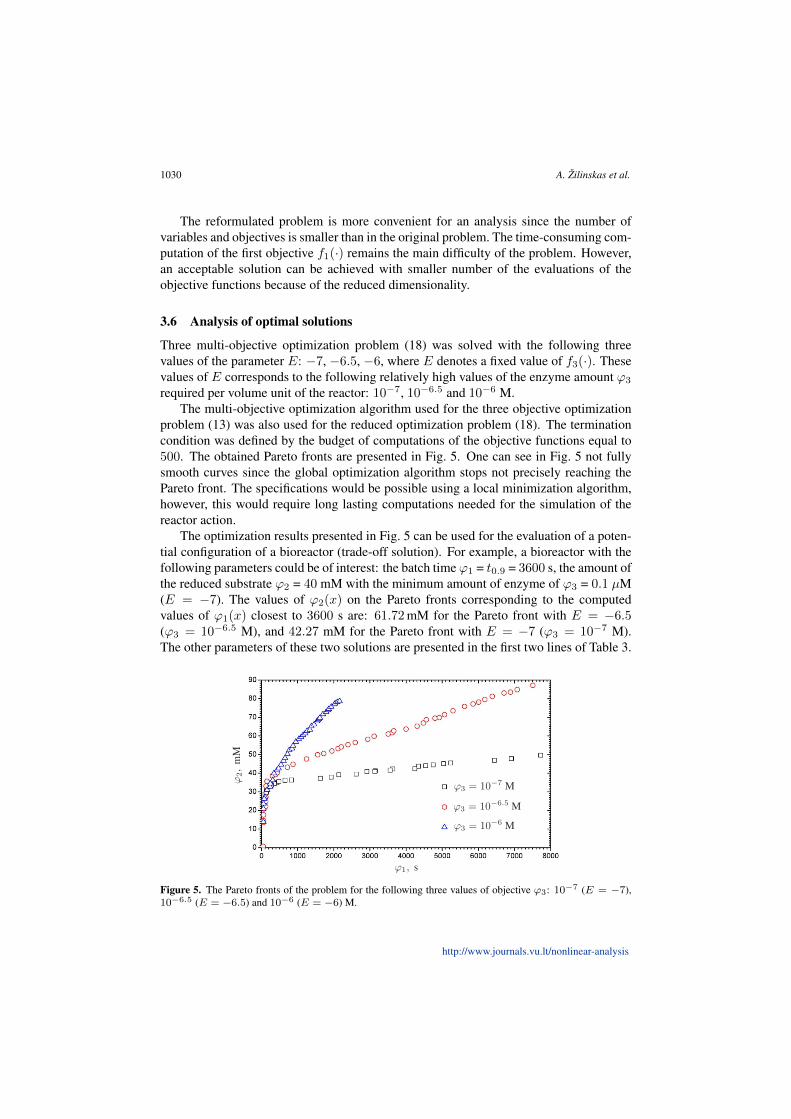
problem (13) was also used for the reduced optimization problem (18). The terminationcondition was defined by the budget of computations of the objective functions equal to500. The obtained Pareto fronts are presented in Fig. 5. One can see in Fig. 5 not fullysmooth curves since the global optimization algorithm stops not precisely reaching thePareto front. The specifications would be possible using a local minimization algorithm,however, this would require long lasting computations needed for the simulation of thereactor action.
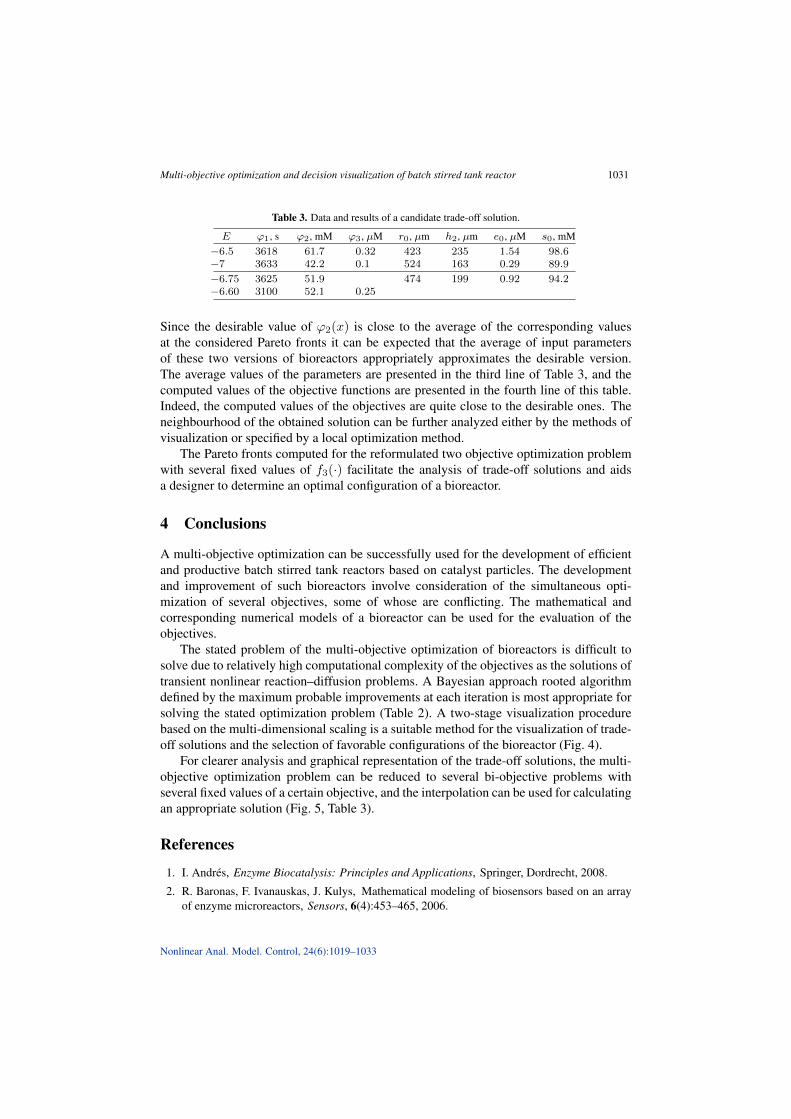
The optimization results presented in Fig. 5 can be used for the evaluation of a poten-tial configuration of a bioreactor (trade-off solution). For example, a bioreactor with thefollowing parameters could be of interest: the batch time ϕ1 = t0.9 = 3600 s, the amount ofthe reduced substrate ϕ2 = 40 mM with the minimum amount of enzyme of ϕ3 = 0.1 µM(E = −7). The values of ϕ2(x) on the Pareto fronts corresponding to the computedvalues of ϕ1(x) closest to 3600 s are: 61.72 mM for the Pareto front with E = −6.5(ϕ3 = 10−6.5 M), and 42.27 mM for the Pareto front with E = −7 (ϕ3 = 10−7 M).The other parameters of these two solutions are presented in the first two lines of Table 3.
Figure 5. The Pareto fronts of the problem for the following three values of objective ϕ3: 10−7 (E = −7),10−6.5 (E = −6.5) and 10−6 (E = −6) M.
http://www.journals.vu.lt/nonlinear-analysis
Multi-objective optimization and decision visualization of batch stirred tank reactor 1031
Table 3. Data and results of a candidate trade-off solution.
E ϕ1, s ϕ2, mM ϕ3, µM r0, µm h2, µm e0, µM s0, mM−6.5 3618 61.7 0.32 423 235 1.54 98.6−7 3633 42.2 0.1 524 163 0.29 89.9
−6.75 3625 51.9 474 199 0.92 94.2−6.60 3100 52.1 0.25
Since the desirable value of ϕ2(x) is close to the average of the corresponding valuesat the considered Pareto fronts it can be expected that the average of input parametersof these two versions of bioreactors appropriately approximates the desirable version.The average values of the parameters are presented in the third line of Table 3, and thecomputed values of the objective functions are presented in the fourth line of this table.Indeed, the computed values of the objectives are quite close to the desirable ones. Theneighbourhood of the obtained solution can be further analyzed either by the methods ofvisualization or specified by a local optimization method.
The Pareto fronts computed for the reformulated two objective optimization problemwith several fixed values of f3(·) facilitate the analysis of trade-off solutions and aidsa designer to determine an optimal configuration of a bioreactor.
4 Conclusions
A multi-objective optimization can be successfully used for the development of efficientand productive batch stirred tank reactors based on catalyst particles. The developmentand improvement of such bioreactors involve consideration of the simultaneous opti-mization of several objectives, some of whose are conflicting. The mathematical andcorresponding numerical models of a bioreactor can be used for the evaluation of theobjectives.
The stated problem of the multi-objective optimization of bioreactors is difficult tosolve due to relatively high computational complexity of the objectives as the solutions oftransient nonlinear reaction–diffusion problems. A Bayesian approach rooted algorithmdefined by the maximum probable improvements at each iteration is most appropriate forsolving the stated optimization problem (Table 2). A two-stage visualization procedurebased on the multi-dimensional scaling is a suitable method for the visualization of trade-off solutions and the selection of favorable configurations of the bioreactor (Fig. 4).
For clearer analysis and graphical representation of the trade-off solutions, the multi-objective optimization problem can be reduced to several bi-objective problems withseveral fixed values of a certain objective, and the interpolation can be used for calculatingan appropriate solution (Fig. 5, Table 3).
References
1. I. Andrés, Enzyme Biocatalysis: Principles and Applications, Springer, Dordrecht, 2008.
2. R. Baronas, F. Ivanauskas, J. Kulys, Mathematical modeling of biosensors based on an arrayof enzyme microreactors, Sensors, 6(4):453–465, 2006.
Nonlinear Anal. Model. Control, 24(6):1019–1033
1032 A. Žilinskas et al.
3. R. Baronas, J. Kulys, L. Petkevicius, Modelling the enzyme catalysed substrate conversion ina microbioreactor acting in continuous flow mode, Nonlinear Anal. Model. Control, 23(3):437–456, 2018.
4. R. Baronas, J. Kulys, L. Petkevicius, Computational modeling of batch stirred tank reactorbased on spherical catalyst particles, J. Math. Chem., 57(1):327–342, 2019.
5. R. Baronas, A. Žilinskas, L. Litvinas, Optimal design of amperometric biosensors applyingmulti-objective optimization and decision visualization, Electrochim. Acta, 211:586–594,2016.
6. L.A. Belfiore, Transport Phenomena for Chemical Reactor Design, John Wiley & Sons,Hoboken, NJ, 2003.
7. C.M. Bidabehere, J.R. García, U. Sedran, Transient effectiveness factor in porous catalystparticles. Application to kinetic studies with batch reactors, Chem. Eng. Res. Des., 118:41–50,2017.
8. D. Britz, R. Baronas, E. Gaidamauskaite, F. Ivanauskas, Further comparisons of finite differ-ence schemes for computational modelling of biosensors, Nonlinear Anal. Model. Control,14(4):419–433, 2009.
9. J. Calvin, G. Gimbutiene, W.O. Phillips, A. Žilinskas, On convergence rate of a rectangularpartition based global optimization algorithm, J. Glob. Optim., 71:165–191, 2018.
10. A. Darvishi, A. Bakhtyari, M.R. Rahimpour, A sensitivity analysis and multi-objective optimi-zation to enhance ethylene production by oxidative dehydrogenation of ethane in a membrane-assisted reactor, Chin. J. Chem. Eng., 26(9):1879–1895, 2018.
11. M.E. Davis, R.J. Davis, Fundamentals of Chemical Reaction Engineering, McGraw-Hill, NewYork, 2003.
12. K. Deb, Multi-Objective Optimization Using Evolutionary Algorithms, Wiley, 2009.
13. P.M. Doran, Bioprocess Engineering Principles, 2nd ed., Academic Press, Waltham, MA,2013.
14. F. Ebrahimi, E. Kolehmainen, A. Laari, H. Haario, D. Semenov, I. Turunen, Determination ofkinetics of percarboxylic acids synthesis in a microreactor by mathematical modeling, Chem.Eng. Sci., 71:531–538, 2012.
15. B. Godongwana, Effectiveness factors and conversion in a biocatalytic membrane reactor,PLoS One, 11(4):e0153000, 2016.
16. I. Hashem, D. Telen, P. Nimmegeers, F. Logist, J.Van Impe, A novel algorithm for fast repre-sentation of a Pareto front with adaptive resolution: Application to multi-objective optimizationof a chemical reactor, Comput. Chem. Eng., 106:544–558, 2017.
17. C-Y. Hsu, B-S. Chen, Systematic design of a metal ion biosensor: A multi-objective optimiza-tion approach, PLoS One, 11(11):e0165911, 2016.
18. J. Iqbal, S. Iqbala, C.E. Müller, Advances in immobilized enzyme microbioreactors in capillaryelectrophoresis, Analyst, 138(11):3104–3116, 2013.
19. J. Ju, Y. Han, S. Kim, Design optimization of structural parameters for highly sensitive photoniccrystal label-free biosensors, Sensors, 13(3):3232–3241, 2018.
20. P. Koch, T. Wagner, M. Emmerich, T. Bäck, W. Konen, Efficient multi-criteria optimization onnoisy machine learning problems, Appl. Soft Comput., 29:357–370, 2015.
http://www.journals.vu.lt/nonlinear-analysis
Multi-objective optimization and decision visualization of batch stirred tank reactor 1033
21. K.F. Koledina, S.N. Koledin, A.P. Karpenko, I.M. Gubaydullin, M.K. Vovdenko, Multi-objective optimization of chemical reaction conditions based on a kinetic model, J. Math.Chem., 57:484–493, 2019.
22. F. Logist, P. M. M. Van Erdeghem, J. F. Van Impe, Efficient deterministic multiple objectiveoptimal control of (bio)chemical processes, Chem. Eng. Sci., 64:2527 – 2538, 2009.
23. M. Maksimovic, A. Al-Ashaab, R. Sulowski, E. Shehab, Knowledge visualization in productdevelopment using trade-off curves, in 2012 IEEE International Conference on IndustrialEngineering and Engineering Management, 10 to 13 December 2012, Hong Kong, IEEE, 2012,pp. 708–711.
24. S. Olofsson, M. Mehrian, R. Calandra, L. Geris, M.P. Deisenroth, R. Misener, Bayesian multi-objective optimisation with mixed analytical and black-box functions: Application to tissueengineering, IEEE Trans. Biomed. Eng., 66(3):727–739, 2019.
25. P. Pardalos, A. Žilinskas, J. Žilinskas, Non-Convex Multi-Objective Optimization, Springer,2017.
26. N. Patel, N. Padhiyar, Multi-objective dynamic optimization study of fed-batch bio-reactor,Chem. Eng. Res. Des., 119:160–170, 2017.
27. V. Picheny, Multiobjective optimization using gaussian process emulators via stepwiseuncertainty reduction, Stat. Comput., 25:1265–1280, 2015.
28. W.H. Press, S.A. Teukolsky, W.T. Vetterling, B.P. Flannery, Numerical Recipes: The Art ofScientific Computing, 3rd ed., Cambridge Univ. Press, Cambridge, 2007.
29. D. Schäpper, M.N.H.Z. Alam, N. Szita, A. Eliasson Lantz, K. V. Gernaey, Application of mi-crobioreactors in fermentation process development: A review, Anal. Bioanal. Chem., 395(3):679–695, 2009.
30. Y. Sergeyev, D. Kvasov, M. Mukhametzhanov, On the efficiency of nature-inspired meta-heuristics in expensive global optimization with limited budget, Sci Rep, 8:453, 2018.
31. T. Skybová, M. Pribyl, P. Hasal, Mathematical model of decolourization in a rotating discreactor, Biochem. Eng. J., 93:151–165, 2015.
32. S. Taras, A. Woinaroschy, An interactive multi-objective optimization framework for sustain-able design of bioprocesses, Comput. Chem. Eng., 43:10–22, 2012.
33. D. Telen, F. Logist, E. Van Derlinden, I. Tack, J. Van Impe, Optimal experiment design fordynamic bioprocesses: A multi-objective approach, Chem. Eng. Sci., 78:82–97, 2012.
34. M. Velkovsky, R. Snider, D.E. Cliffel, J.P. Wikswo, Modeling the measurements of cellularfluxes in microbioreactor devices using thin enzyme electrodes, J. Math. Chem., 49(1):251–275, 2011.
35. J. Villadsen, J. Nielsen, G. Lidén, Bioreaction Engineering Principles, 3rd ed., Monographsin Electrochemistry, Springer, New York, 2011.
36. A. Žilinskas, A statistical model-based algorithm for black-box multi-objective optimisation,Int. J. Syst. Sci., 45(1):82–92, 2014.
37. A. Žilinskas, E.S. Fraga, A. Mackute, Data analysis and visualisation for robust multi-criteriaprocess optimisation, Comput. Chem. Eng., 30(6-7):1061–1071, 2006.
38. A. Žilinskas, J. Žilinskas, Parallel hybrid algorithm for global optimization of problems occur-ring in MDS based visualization, Comput. Math. Appl., 52(1–2):211–224, 2006.
39. J. Žilinskas, M. Dür, Depth-first simplicial partition for copositivity detection, with an appli-cation to maxclique, Optim. Method Softw., 26(3):499–510, 2011.
Nonlinear Anal. Model. Control, 24(6):1019–1033