Embed Size (px)
Citation preview

Journal of Earthquake Engineering, 12:555–583, 2008Copyright © A.S. Elnashai & N.N. AmbraseysISSN: 1363-2469 print / 1559-808X onlineDOI: 10.1080/13632460701572872
555
UEQE1363-24691559-808XJournal of Earthquake Engineering, Vol. 00, No. 0, November 2007: pp. 1–33Journal of Earthquake Engineering
Multi-Criteria Decision Making for Seismic Retrofitting of RC Structures
N. Caterino et al. NICOLA CATERINO1, IUNIO IERVOLINO2, GAETANO MANFREDI2, and EDOARDO COSENZA2
1Dipartimento per le Tecnologie, Università degli Studi di Napoli Parthenope, Naples, Italy2Dipartimento di Analisi e Progettazione Strutturale, Università degli Studi di Napoli Federico II, Naples, Italy
The upgrading of existing structures that are not adequate to withstand seismic demand is a widelyadopted and effective approach aimed at risk reduction. Nowadays, many are feasible retrofit strat-egies, employing traditional and/or innovative materials, and several options are available to pro-fessionals. Each one has different performances in respect to some criteria, i.e., technical and/oreconomical, by which each alternative can be evaluated. The selection of the most suitable retrofitstrategy for a particular structure may be not straightforward since, in many applications, there isno alternative which clearly emerges among others as the best one according to the whole of the cri-teria considered.
Multi-Criteria Decision Making (MCDM) methods are decision-support procedures used inmany fields allowing the evaluation and comparison of a set of alternatives when many evaluationcriteria are involved. Ranking the alternative solutions leads to the identification of the optimalsolution, which better performs in respect to all relevant goals. This article discusses how suchmethodological framework may be applied to the seismic retrofit of sub-standard structures. Theprocedure is presented via an application to an under-designed reinforced concrete (RC) building.Four different seismic upgrading alternative strategies, reflecting common as well as innovative ret-rofit approaches, are designed to get the required performance level and compared by using theTOPSIS – MCDM method.
Keywords Seismic Retrofit; Multi-Criteria Decision Making; Reinforced Concrete; Fiber-ReinforcedPlastics; Steel Bracing; Base Isolation
1. Introduction
Existing structures in southern Europe may be inadequate in respect to the seismic perfor-mance required by the codes in force. Many of them were designed without any earth-quake resistance criterion, because they were built prior to earthquake resistant buildingcodes; others were designed to resist horizontal actions but without the principles of thecapacity design or are built at a site in an area where the seismic hazard has been reevalu-ated and increased. For those cases listed, the seismic upgrading, aimed at improving theseismic performance of the structure in a way such that the seismic capacity is larger thanthe estimated demand, may be more convenient than demolition and re-construction.
Received 20 December 2006; accepted 13 June 2007.Address correspondence to Nicola Caterino, Dipartimento per le Tecnologie, Università degli Studi di Napoli
Parthenope, Centro Direzionale di Napoli, Isola C4, 80143 Naples, Italy; E-mail: [email protected]

556 N. Caterino et al.
In recent years, innovative technologies, along with traditional solutions, havebecome available to the practitioners to satisfy the structural goals of retrofit, eitherenhancing the seismic capacity or reducing the demand. These options may be significantlydifferent in respect of various aspects such as costs, time, structural performances,architectural impact, occupancy disruption, etc. The relative relevance of criteria is strictlydependent on the specific application and, moreover, they often represent trade-offs.Therefore, the choice of the retrofit strategy may be a not straightforward task. In the caseof critical facilities, as well as for architectural heritage-belonging construction, a quanti-tative tool supporting the decision on the most suitable retrofit solution may provide aconsistent basis for intervention design and construction management. Multi-CriteriaDecision Making (MCDM) methods may be helpful in the matter. They are commonlyemployed to solve similar problems occurring in several fields (i.e., marketing choices,resources allocation planning, natural resources management, medical treatmentselection), when the selection among a set of alternative solutions requires accounting formany criteria.
This article discusses the application of an MCDM method, known as TOPSIS (Tech-nique for Order Preference by Similarity to Ideal Solution: Hwang and Yoon, 1981), forthe selection of the optimal retrofit strategy in the case of an under-designed RC building.The decision process is made of the following eight steps which also reflect the structureof the article: (1) assessment of the un-retrofitted structure; (2) definition of the set ofalternatives; (3) design of the retrofit options; (4) selection of the evaluation criteria; (5)relative weighting of the criteria; (6) evaluation of the alternatives; (7) application of thechosen MCDM method to rank the alternatives and to identify the best retrofit solution;and (8) sensitivity analysis to investigate the stability of the solution in respect to theweights of the criteria.
Some of the procedure’s steps require choices which are, to a certain extent, subjec-tive; this includes the relative weighting of the criteria and the qualitative evaluations ofthe alternatives. In these cases, the role of who has to choose the retrofit solution, the deci-sion maker (DM), is important. The eigenvalue approach proposed by Saaty [1980] isused to give overall consistency to the subjective choices. Starting from linguistic judge-ments expressed by the DM, this approach allows the definition of the relative importanceon the final decision of each criterion as well as obtaining the quantitative evaluations ofcriteria in respect of qualitative alternatives. Furthermore, a consistency measure of theDM’s judgments ensures that no intolerable conflicts exist among them and that the finaldecision is logically sound and not a result of random prioritization [Shapira and Goldenberg,2005].
As it will be clear in the following, criteria weights may be determinant for the finalselection as they amplify or de-amplify the evaluation of the solutions in respect of eachcriterion by means of its relative importance. Therefore, a sensitivity analysis on the finalresult may give a quantitative measure of the actual sensitivity of the results of applicationof the MCDM method to the criteria weights.
The structure considered in the application is a three-story RC structure built at theEuropean Laboratory for Structural Assessment (ELSA) of the Joint Research Center(JRC) in Ispra, Italy. This building, realized and tested for the EU project SPEAR [Far-dis and Negro, 2005], is considered here as a case study, being representative of pre-seismic code constructions in southern Europe. It is supposed to be located inPomigliano d’Arco (Naples, Italy); in 2003 [OPCM 3274], seismic classification wasgiven to this site, and hence it may be representative of a situation in which existingstructures are actually strongly deficient in terms of seismic performance and the retrofitmay be required.

Multi-Criteria Decision Making for Seismic Retrofitting of RC Structures 557
In the following, the nonlinear assessment of the un-retrofitted structure is presentedfirst; then four alternatives, reflecting different seismic retrofit approaches, are designed.Three of these aim at enhancing the seismic capacity of the building according to distinctphilosophies: (i) improving deformation capacity by columns’ confinement with GlassFiber Reinforced Plastics; (ii) increasing strength and stiffness by adding steel bracing;(iii) enhancing both ductility and strength by concrete jacketing of selected columns;whereas the fourth one (iv) intends to reduce the seismic demand via base isolation. Con-sequently, the solutions are ranked via the TOPSIS procedure, which allows the finalchoice of the retrofit strategy suitable for the case examined and evaluation of the stabilityof the results to the judgment process.
2. Description and Seismic Assessment of the Un-Retrofitted Structure
The SPEAR structure is three stories, the inter-story height is 3.0 m, an RC buildingdesigned for gravity loads only according to the design code in force in Greece between1954 and 1995 [NEAK, 1995; NKOS, 1995]. The standard floor and the elevation view ofthe building are presented in Fig. 1. All the columns have square cross section (250 × 250mm2), except column C6 which is 750 × 250 mm2. The beams’ depth is 500 mm; the slabthickness is 150 mm. The frame can be defined as a weak column-strong beam systemand, therefore, it is far from the capacity design principles. The center of stiffness at eachfloor is away from the centre of mass, this irregularity causes torsion, while the structurecan be considered regular in elevation.
Longitudinal smooth steel reinforcement is made of four f 12 mm bars for the col-umns (except C6 in which two rows of three f 12 mm bars close to the opposite sides ofthe section and two intermediate rows of two bars of the same diameter are present); thebeams’ reinforcement is composed by two f 12 mm diameter bars at the top of the section(“montage”); two f 20 mm bars are added at top over column C3 in beams B9 and B10;two bottom bars (three in B4) continue straight to the supports; some other 12 mm diame-ter bottom bars are bent up towards the supports. Stirrups are smooth f 8 mm bars and are200 mm spaced in the beams, and 250 mm in the columns. They are not continued in thejoints. The confinement provided by this arrangement may be considered to be poor.
FIGURE 1 Standard floor plan and 3D view of the SPEAR building.
B11
C9
C8
B12
5.0
m5.
5 m
4.0
m
6.0 m
XY
C6B5
3.0 mB6 C7
0.7
B7
5.0 m
B10
B3
C3B4
B9
B1
C1
3.0 m
B2
6.0
m
B8
C4
1.7 m
C5 C2

558 N. Caterino et al.
Table 1 summarizes the assumed material properties and stress-strain relationshipsfor steel [Jeong and Elnashai, 2005]. The compressive strength of concrete is 25 MPa. Themodel proposed by Mander et al. [1988] for the stress-strain behavior is adopted, assumingan ultimate strain equal to 0.004. Design gravity loads on slabs are 0.5 kN/m2 for finishingand 2.0 kN/m2 for live loads. Story masses are calculated by dividing the gravity loads(sum of dead loads and 30% of live loads) by the acceleration of gravity (g).
A finite elements model is implemented for the structure considered using theSAP2000NL 8.2.3 structural analysis software [C.S.I., 2005], beam-type elements areused. Slabs are omitted but their contribution to stiffness and strength is taken into accountby assuming for the beams a T-shaped section (the effective flange width is assumed to bethe beam width plus 7% of the clear span of the beam on either side of the web as in Far-dis, 1994) and introducing a diaphragm-type constraint between all the joints of the samefloor, which renders each floor behaving as a rigid body with no in-plane deformations.Columns at the first floor are assumed to be fully restrained at their base.
The modal analysis of the frame as built highlights that all mode shapes have signifi-cant translational components along X and Y axes, and rotational around Z, showing thatthe building is strongly torsionally unbalanced. The predominant modes are along X forthe first mode (T1 = 0.52 s), along Y for the second mode (T2 = 0.46 s) and torsionalaround Z axis for the third mode (T3 = 0.37 s).
In order to assess the building’s seismic capacity and compare it with the demand1, alumped plasticity model was developed for the site where the structure is supposed to belocated. It is obtained by introducing, at both ends of each element, a plastic hinge thenonlinear moment-rotation behavior of which is defined starting from the moment-curva-ture diagram of the corresponding section and adopting the expressions provided by thecode. The latter allows the conversion of the curvatures (at yield and ultimate) into thecorresponding chord rotations of the element.
A nonlinear static analysis (pushover) of this model is performed according to theprocedure provided by the mentioned norm. A lateral force pattern proportional to theproduct of floor masses and the first mode along the considered axis (Fig. 2) is used topush the structure along the +X, −X, +Y, −Y directions,. Recording at each step of theanalysis the base shear is acting on the structure (Fb) and the roof displacement (dc), that isthe displacement of the center of masses at the last floor, and the so-called capacity curveis obtained.
1The seismic demand, according to the recent Italian seismic code [OPCM 3274, 2003; OPCM3431, 2005], is defined in terms of elastic response spectrum, for which a specific shape is assignedwith reference to the ground type at the site. This shape is anchored to a design value of the peakground acceleration on rock (ag) and amplified by a soil factor (S). The site considered classified asmoderate seismicity and the site class is C according to the code, therefore ag and S are 0.25 g and 1.25,respectively.
TABLE 1 Steel properties [Jeong and Elnashai, 2005]
Bar diameter [mm]
Yield strength [MPa]
Ultimate strength [MPa]
Young’s modulus [MPa]
Post-yield stiffness [MPa]
Ultimate strain
12 459 571 206000 650 0.17420 377 567 206000 1147 0.168

Multi-Criteria Decision Making for Seismic Retrofitting of RC Structures 559
Figure 3 shows the capacity (or pushover) curves along the four directions with thefurther indication of the attainment of the limit states (LS) defined in the OPCM 3431[2005]: (a) significant damage (SD), (b) damage limitation (DL), and (c) near collapse(NC). The DL limit state (b) is attained when the maximum interstory drift ratio is 0.005;(a) corresponds to the attainment of 3/4 of the ultimate rotation in at least one of the plastichinges. In the following, the NC (c) (attainment of the full value of ultimate rotation) limitstate will be not considered.
The seismic assessment is carried out comparing the seismic capacity and the demandby the so-called N2 method [Fajfar, 2000]. The capacity of the structure is represented bythe force-displacement curve obtained by the nonlinear static analysis. The base shearforces and roof displacements are converted to the spectral accelerations and spectraldisplacements of an equivalent single-degree-of-freedom (SDOF) system, respectively.These spectral values define the capacity spectrum. The demands of the earthquakeground motion are defined by inelastic spectra. The acceleration-displacement responsespectrum (ADRS) format is used, in which spectral accelerations are plotted againstspectral displacements. The intersection of the capacity spectrum and the demandspectrum defines the performance point for the structure. In Fig. 4 with reference to the
FIGURE 2 Shape of the lateral force pattern assumed for the pushover analysis along theX and Y directions (forces value normalized by the one at the top).
XZ
YZ
1.000
0.808
0.407
0.755
0.333
1.000
FIGURE 3 SPEAR building: pushover curves. Comparison between displacement capac-ity and code’s demand at each limit state, for each of the four directions −X, +X, −Y, +Y.
NC SD DL NC DL SD
NC
NC SD
SDDL DL
–7 –6 –5 –4 –3 –2 –1 0 1 2 3 4 5 6 7Roof displacement dc [cm] Roof displacement dc [cm]
–7 –6 –5 –4 –3 –2 –1 0 1 2 3 4 5 6 7
Bas
e sh
ear
F b [
kN]
Bas
e sh
ear
F b [k
N]
0
50
100
150
200
250
300
350
400
SD d
eman
d
SD d
eman
d
SD d
eman
d
SD d
eman
d
DL
dem
and
DL
dem
and
DL
dem
and
DL
dem
and
0
50
100
150
200
250
300
350
400
–X +X –Y +Y

560 N. Caterino et al.
+X direction for both DL and SD limit states the application of N2 for the building consid-ered herein is given. From the figure it is possible to conclude that the building does notsatisfy the SD LS and barely withstand the DL limit state. The other six performance veri-fications of the total eight (4 directions × 2 limit states) are, for sake of brevity, reported inFig. 3 as a graphical comparison in terms of displacement capacity and correspondinginelastic demand, both referred to the original, multi-degree-of-freedom, system.
In order to improve the structure’s behavior in respect of the significant damage limitstate (see right panel of Fig. 4), several strategies may be chosen. Aiming at improving thecapacity it is possible to enhance the global displacement capacity, the global strength, ora combination of the two. A different approach consists of reducing the seismic demandon the structure.
3. Definition and Design of a Finite Group of Alternatives
A retrofit strategy denotes an approach aiming at improving the seismic performance of anexisting structure. A retrofit system is, instead, the specific method and technology used toimplement the selected strategy [ATC-40, 1996; Fib bulletin No. 24, 2003]. Someso-called technical strategies modify the demand and/or the response parameters of thebuilding. They include system completion (for structures having the basic features of anearthquake resistant building but lacking some seismic detailing), system strengtheningand/or stiffening, enhancing deformation capacity, enhancing energy dissipation capacityand reducing the seismic demand. In addition, a number of alternative management strate-gies may also be considered. They concern approaches like destination change, or demoli-tion, or the way in which a certain technical strategy can be implemented (e.g., temporaryretrofit or phased interventions, while the structure is occupied or vacant, including exte-rior or interior interventions, and so on).
Focusing on the technical strategies, it is important to note that each one can becarried out in several different manners. For example, there is more than one way to addconfinement to RC elements (by innovative techniques, i.e., using fiber-reinforced com-posite materials, or traditional, as steel or concrete jacketing) or to enhance the strength.Also, the systems able to reduce the seismic demand through the improvement of theenergy dissipation capacity of the building include several different specific techniques, aswell as those aiming at the base isolation. Therefore, several options are available forupgrading an existing structure and the decision maker has to select the most suitable one.Furthermore, it is hardly possible to define the best retrofit solution in absolute terms, and
FIGURE 4 Assessment done by the N2 method for the +X direction and for the DL (left)and DS (right) limit states.
0
1
1
2
2
3
3
4
0.00 0.02 0.04 0.06 0.08 0.00 0.05 0.10 0.15 0.20
Sd [m] Sd [m]
S a [
m/s
2 ]
S a [m
/s2 ]
Elastic spectrumInelastic spectrumBilinearized capacity curve
0
1
2
3
4
5
6
7
8
9Elastic spectrumInelastic spectrumBilinearized capacity curve

Multi-Criteria Decision Making for Seismic Retrofitting of RC Structures 561
the selection process strongly depends on the case under consideration. In order to makesuch a choice, a set of feasible alternative interventions has to be defined. Depending onthe specific features of the structure and on its seismic deficiencies shown during theassessment, it will be more appropriate to include in the set of alternatives some of thealternatives rather than others. Each retrofit option has to be designed to a certain detaillevel in order to be effectively compared with others.
For the MCDM application included in this article, a group of four alternatives isconsidered, three of those aiming at a seismic capacity enhancement, the fourth one giv-ing seismic demand reduction. In the following they will be indicated as alternatives A1,A2, A3, and A4, respectively. Solution A1 consists of confinement by Glass Fiber Rein-forced Plastics (GFRP) of columns and joints and results in an increase of the buildingdeformation capacity; A2 provides a global strength and stiffness enhancement by add-ing steel bracing; A3 is the concrete jacketing of selected columns, which gives animprovement of both strength and ductility. The retrofit philosophy of these first threeoptions can be graphically explained by means of the schematic representation in Figure5 (adapted from Sugano, 1996) where (a), (b), and (c) are three different ways, practi-cally corresponding to alternatives A1, A2 and A3 respectively, by which it is possible tolead the point (in the unsafe region) representing the original state of the building intothe safe region. Finally, the seismic demand reduction is referred to as alternative A4and it is achieved by base isolation of the structure which lengthens the structure’s fun-damental period of vibration, and further adds supplemental damping. In the followingsections, a brief description of the design and performance evaluation of each of the fouralternative interventions is given.
3.1. Alternative A1: Confinement by Glass Fiber Reinforced Plastic
This first alternative is designed to increase the global deformation capacity of thebuilding through adding confinement to columns and strengthening external joints withGlass Fiber Reinforced Plastic (GFRP). In general, this purpose can be achieved byusing composites in two different ways: the first one consists of establishing a correcthierarchy of strength by relocating the potential plastic hinges; the second one aims atincreasing the ductility of plastic hinges without modifying their location [CNR-DT200, 2004]. The latter approach is adopted here. The detailed description of the composite
FIGURE 5 Different types of capacity improvement (adapted from Sugano, 1996).
Originalstate
Ductility
(b)
(c)
(a)
Requiredseismicperformance
UNSAFEREGION
SAFEREGION
Stre
ngth

562 N. Caterino et al.
intervention2 design is reported in Cosenza et al., [2005]. Two superimposed fabric layersof mono-directional glass fibers (weight 900 gr/m2, thickness 0.48 mm/layer, tensilestrength 2,560 MPa, longitudinal modulus of elasticity 80.7 GPa) are used for all col-umns, except for C6 which is strengthened by two layers of balanced four-directionalglass fabric (weight 1,140 gr/m2, thickness 0.11 mm/layer, tensile strength 2,600 MPa,tensile modulus of elasticity 73.0 GPa) that increase the shear capacity of this column.GFRP sheets cover a partial length (related to the local plastic hinge length) of the col-umns at both ends, except for C6 which is wrapped along its full length. The Spoelstraand Monti [1999] model, for the stress-strain behavior of concrete confined by FRP,was adopted. Confined concrete ultimate strain (0.007; 0.006 only for column C6) wasevaluated according to the CNR-DT 200 [2004] provisions as a function of the non con-fined concrete ultimate strain, concrete strength, and lateral confinement. The moment-curvature relationships of wrapped sections show a significant increase in ductility,especially for those with a high value of axial load. The increase in strength is not sig-nificant, as expected. These effects reflect on the global behavior of the building, asshown in Fig. 6 (left side) where the comparison among the four pushover curves corre-sponding to the as-built and retrofitted by GFRP structure is given (the last point of thecurves corresponds to the attainment of the SD limit state). The N2 method is adopted tocompare the seismic demand (D in the right side of Fig. 6) to the capacity (C). From theperformance assessment it is possible to conclude that the retrofit option A1 achieves thecapacity improvement philosophy (a) described in the previous section, since it leadsthe building to a safe state by enhancing only its deformation capacity, without chang-ing the global strength.
3.2. Alternative A2: Steel Bracing
The retrofit option A2 aims at increasing the global strength of the structure and atreducing the eccentricity between the center of stiffness and the center of masses. It doesnot induce any significant variation of displacement capacity. It consists of introducingconcentric diagonal braces, as shown in Fig. 7. The chosen steel (Fe430) has yield andultimate strengths equal to 275 and 430 MPa, respectively. The cross section selected for
2The structure retrofitted in such way was actually tested at the ELSA laboratory for theSPEAR project mentioned above.
FIGURE 6 Pushover curves (SD limit state) comparison between as-built and retrofittedby GFRP structure (left). Comparison between seismic demand (D) and capacity (C) at theSD limit state of the structure upgraded by alternative A1 and pushed along the +Xdirection (right).
0
50
100
150
200
250
300
350
400
450
–12 –10 –8 –6 –4 –2 0 2 4 6 8 10 12 14 16
Roof displacement dc [cm]
Bas
e sh
ear
F b [k
N]
As builtGFRP
0123456789
0.00 0.05 0.10 0.15 0.20
Sd [m]
S a [m
/s2 ]
Elastic spectrumInelastic spectrumBilinearized capacity curve
C
+Y
+X –X
–Y
D

Multi-Criteria Decision Making for Seismic Retrofitting of RC Structures 563
the diagonal elements is L-shaped (65 mm × 100 mm; 7 mm width). This choice was madeaccording to the design criteria described by the last Italian seismic code for steelstructures and imposing the use of only one cross section type for all braces, for practicalreasons.
The design of the intervention was based on the following considerations: bracing oftwo parallel frames in each direction (X and Y) is needed to give a sufficient regularity inplan of stiffness, and thus to try to decouple the oscillation modes in the two directions; itis better to brace alternate bays so that, in case of an intense ground motion, the nodalactions due to the diagonal elements is distributed among a larger number of columns;bracing is provided in each story of the building so that the latter remains regular in eleva-tion. According to the recommendations of the Fib bulletin No. 24 [2003], the diagonalbraces are supplemented with a steel frame anchored to the surrounding concrete members(columns and beams). The horizontal steel elements (plates with section 250 × 15 mm2)assist RC beams in resisting load effects and act as collector elements for the transfer ofinertia forces to the bracing system. Vertical steel elements, with C-shaped cross section(280 mm height, 95 mm width), assist the existing RC columns [Caterino, 2006].
The comparison among the pushover curves of the original building and its configura-tion retrofitted by alternative A2 is shown in Fig. 8a. Even by comparing the bilinearizedcapacity curves relative to the as-built and upgraded by A2 structure (pushed up to the SDlimit state attainment along the +X direction, assumed as an example; see Fig. 8b) with theelastic spectrum representing the seismic demand, it is possible to conclude that thedesigned intervention achieves the capacity improvement philosophy (b) described in Fig. 5,since it leads the structure to a safe state by enhancing only its global strength, withoutchanging the lateral displacement capacity.
3.3. Alternative A3: Concrete Jacketing
Columns C1, C3, and C4 are selected to be strengthened by a concrete jacket 75 mm thickat each story (average concrete strength Rcm = 50 MPa, 8 longitudinal bars with diameter16 mm, stirrups with diameter 8 mm and 150 mm spacing, 100 mm close to the joints) inorder to reduce the eccentricity between the centers of strengths and masses, with theconsequent reduction of harmful torsional effects in the seismic response. Figure 9 showsthe location of the center of masses and that of the strengths (measured by the yielding
FIGURE 7 Bracing configuration: plan (a) and 3D (b).
(a) (b)

564 N. Caterino et al.
moment of the columns) for the original structure (GM and GS, respectively) and for theone with the three jacketed columns (G′M and G′S, respectively). An increase of strengthand ductility of the jacketed sections is furthermore obtained (the ultimate concrete strainis assumed 0.004 for the jacket, as for the core concrete). This reflects on the globalbehavior of the building, as shown by the pushover curves reported in Fig. 10 (left panel).It is important to observe that RC jacketing has to be considered as a global intervention,since the longitudinal reinforcement of the jackets passes through holes drilled in the slaband additional concrete is cast in the beam-column joints.
FIGURE 8 Pushover curves (SD limit state) comparison between as-built and retrofittedby steel bracing structure (left). Comparison between seismic demand and capacity at theSD limit state of the structure upgraded by alternative A2 and pushed along the +Xdirection (right).
0
300
600
900
1200
1500
1800
–5 –4 –3 –2 –1 0 1 2 3 4 5
Roof displacement dc [cm] Sd [m]
S a [m
/s2 ]
Bas
e sh
ear
F b
[kN
]As builtSteel bracing
0
2
4
6
8
10
12
0.00 0.05 0.10 0.15 0.20
Elastic spectrum
Bilinear. capacity curve (steel bracing)
Bilinear. capacity curve (as-built)
–Y
–X
–X
–Y +Y
+X
+Y
+X
FIGURE 9 Centers of masses and strengths, for both original and retrofitted by RC jack-ets structure (left); cross section of a jacketed column (right).
X
B3
Y
C5 C1
B1
B11
C9
B12
C8 B5
C6
B10
C3B4
B6 C7
B8
C4
B7
C2
B2
B9
G 'MGM
GS
G 'S
400 mm
400
mm
250
mm
250 mm
core
jacket

Multi-Criteria Decision Making for Seismic Retrofitting of RC Structures 565
As for the previous retrofit alternatives, the N2 method is adopted to compare theseismic demand with the capacity. In the right panel of Fig. 10, the verification of the SDlimit state in the +X direction is carried out. The seismic demand (D) results to be practi-cally coincident with the capacity (C), also for the other three directions.
3.4. Alternative A4: Base Isolation
This retrofit option is designed to reduce the seismic demand to a lower-level adequate tothe present capacity of the structure. This purpose is achieved by lengthening the period ofvibration and by enhancing the energy dissipation capacity through a base isolationsystem constituted of 9 (1 for each column) high-damping rubber bearing (HDRB)devices characterized by an effective damping ratio (x) equal to 10%. The superstructurecapacity (0.287 g, expressed in terms of spectral acceleration) is determined starting fromthe pushover analysis of the original building and compared to the demand imposed by thecode for the site considered (ag = 0.25 g). In this way, the so-called “minimum isolatedperiod” (that is the value of the period above which the capacity of the structure results tobe greater than the seismic demand) Tis,min = 1.11 s is evaluated (Fig. 11, left) by compar-ing the superstructure capacity to the elastic demand represented by the elastic acceleration
FIGURE 10 Pushover curves (SD limit state) comparison between as-built and retrofit-ted by A3 structure (left). Comparison between seismic demand and capacity at the SDlimit state of the structure upgraded by alternative A3 and pushed along the +X direction(right).
0100
200
300400
500600
700
–8 –6 –4 –2 0 2 4 6 8Top displacement [cm]
Bas
e sh
ear
[kN
]As built
Concrete jacketing
0123456789
0.00 0.05 0.10 0.15 0.20Sd [m]
S a [m
/s2 ]
Elastic spectrumBilinear. capacity curve(concrete jacketing)
Bilinear. capacity curve(as-built)
Inelastic spectrum
–Y–X +X
+Y +X
+Y–Y
–X
D = C
FIGURE 11 Evaluation of the “minimum isolated period” and layout of the selecteddevices (Types 1 and 2).
0
0.1
0.2
0.3
0.4
0.5
0.6
0.7
0.8
0.9
0 0.5 1 1.5 2
T [s]
S a [
g]
1.11 s
Elastic spectrum ag = 0.25 g
capacity 0.287g
Superstructure
with ξ = 5%with ξ = 10%

566 N. Caterino et al.
spectrum corresponding to a damping ratio equal to 10%. A selection of two differenttypes of device, each of those characterized by a different lateral stiffness value Kh (Type1: “soft” rubber, diameter 400 mm, Kh = 480 kN/m; Type 2: “normal” rubber, diameter300 mm, Kh = 710 kN/m) allows the isolation of the building by a period of vibrationgreater than Tis,min (T1 = 1.39 s). The rational disposition of the isolators also providescentering of the elastic stiffnesses of the isolated structure with consequent decoupling ofthe X and Y oscillation modes.
The analysis of the structure is carried out via a modal response spectrum analysisaccording to the mentioned Italian seismic code. Two levels of verification of the SD andDL limit states is needed. The first level refers to the superstructure and it is analogous tothe assessment of a fixed-base building in seismic area (strength of each element for theSD limit state, interstory drift ratio for the DL limit state). The second check is related tothe devices. In this case, the SD limit state is considered attained if the demand in terms ofhorizontal displacement reaches a limit threshold according to the devices’ producer. TheDL limit state verification of the isolators is assumed to be automatically satisfied if theDS limit state is satisfied [OPCM 3431, 2005].
Since the PGA values needed for the attainment of the SD and DL limit states in thesuperstructure are larger than those relative to the isolator units, the global capacity of theisolated building will be referred to the latter. Furthermore, given the definition of DL forthe devices, the PGA capacity values at the SD and DL assume the same value. Finally, itis important to underline that the superstructure remains elastic up to the SD limit stateattainment.
4. Definition of the Evaluation Criteria
After the definition and design of the retrofit options (Steps 2 and 3 of the MCDMprocedure), choosing the evaluation criteria (Step 4) must be done. Criteria can be gener-ally defined as different points of view from which the same solution can be evaluated.According to Thermou and Elnashai [2002], criteria can be grouped into two categories:economical/social and technical criteria. Only the criteria that may have a significantinfluence on the final decision should be considered. They depend on the specific featureof the building and on its destination. Since the building under examination is supposed tobe for residential use and the DM is assumed to be the owner, the criteria in the followingTable 2 have been selected.
Therefore, obviously, the total cost to be beared for the realization of each alternativehas to be taken into account to compare the retrofit options (criterion C1). But, in amulti-criteria approach, the deferred expenses to be incurred during the economic life of
TABLE 2 Evaluation criteria
Group Symbol Description
Economical / Social C1 Installation costC2 Maintenance costC3 Duration of works/disruption of useC4 Functional compatibility
Technical C5 Skilled labour requirement/needed technology levelC6 Significance of the needed intervention at foundationsC7 Significant Damage riskC8 Damage Limitation risk

Multi-Criteria Decision Making for Seismic Retrofitting of RC Structures 567
the building and needed to preserve its original functionality also have to be considered(criterion C2). The time span necessary to realize each intervention, as well as the disruptionof normal building activities it causes, are of course other important aspects to take intoaccount. In the case under examination, the duration of the retrofit installation is consideredto cause disruption of use of the building. Furthermore, the functional compatibility ofeach retrofit option to the existing building also has to play a decisive role in the proceduresince it concerns the architectonical impact that an intervention implies. Only a qualitativeevaluation of alternatives in respect of this criterion (C4) will be possible and thus itsconversion into quantitative terms will be needed.
Alternatives may be discriminate with respect to the skilled labor requirement and thetechnology level needed for their realization (criterion C5). It is appropriate to take intoaccount, by means of a specific criterion (C6), the size of the eventual intervention atfoundation for each alternative, since the generally considerable difficulty of realizationand costs.
Seismic performance of the upgraded building according to one of the retrofit optionsis taken into account by evaluating the risk of SD LS attainment (criterion C7), and the riskof non structural damage to repair, during the economic life of the structure (criterion C8).Other details about criteria and the specific way of measuring the alternatives’ perfor-mances according to them will be discussed in the following sections.
Besides the described criteria, others could be considered in the procedure. For exam-ple, an additional criterion may be related to the reparability of the retrofitting buildingafter the occurrence of an earthquake inducing the attainment of the SD limit state.3
5. Weighting the Evaluation Criteria
A quantitative evaluation of the relative importance (weight) of each criterion to the finaldecision is needed. The weights will amplify or de-amplify the evaluations of the alterna-tives in order to reflect how much each criterion is important relatively to the others in thechoice of the best solution. Therefore this step, necessarily involving DM’s choices,requires special attention.
The approach used herein to compute weights wi of the criteria Ci (i = 1, 2, ..., 8) isproposed by Saaty [1980] and is based on pairwise comparisons of criteria and eigenval-ues theory. It requires the DM expressing his opinion about a pairwise comparison at atime. In particular, with reference to two generic criteria Cj and Ck (j, k = 1, 2, ..., 8), theDM has to define the relative importance of Cj in respect of Ck choosing among 17 possi-bilities. Each choice is a linguistic phrase, such as those reported in the second column ofTable 3. Then, adopting the linear scale shown in the same table, the linguistic statementcan be converted into a crisp number ajk, which is an element of the following set:
The value of ajk can be considered as a rough estimate of the wj/wk ratio. Therefore,ajk is equal to 1 when criteria Cj and Ck are judged to be equally important; greater than 1,if Cj is considered to be more important than Ck (ajk∈{2, ..., 9}); lower than 1, if Cj isconsidered to be less important than Ck (ajk∈{1/9, ..., 1/2}). In the last row of Table 3 isunderlined that two criteria have to be compared one time only since it should be assumed
3For example, the building retrofitted by base isolation may be repaired through the replace-ment of some or all the devices, since the superstructure is likely to remain elastic.
{1/9, 1/8, 1/7, 1/6, 1/5, 1/4, 1/3, 1/2, 1, 2, 3, 4, 5, 6, 7, 8, 9} (5.1)

568 N. Caterino et al.
akj = 1/ajk. After defining all the ajk values4, they can be assembled into the matrix (A),which results to be a symmetric square matrix of order n (n = 8 herein because 8 is thenumber of compared criteria). For the case under consideration, 28 comparisons betweencriteria in terms of relative importance have been performed, simulating a likely behaviorof the DM, and the A matrix given in Eq. (5.2) was obtained.
A brief clarification about some of the adopted ajk values in (5.2) is given here to fur-ther discuss the weighting process. It is assumed that the owner considers the reduction ofthe maintenance costs (C2) moderately more important than the installation cost (C1)because the former implies additional undesirable disruption of use; then, by adopting thelinear scale in Table 3, it has to be assumed a12 = 1/3. The installation cost (C1) is consid-ered to be as important as the duration of works (C3) since the latter results in a monetaryloss (e.g. rent revenue) and therefore a13 was chosen equal to 1. The functional compatibil-ity (C4) is considered to be very important with respect to all other criteria (a4k ≥ 1, k = 1,..., 8). In fact, because of the residential destination of the structure and its moderate exten-sion, the building results to be very sensitive to even the small architectonical impact thatan intervention may have on the normal use of the spaces.
The criterion concerning the significance of the needed intervention at foundation(C6) is also assumed to be generally important (a6k ≥ 1, k = 1, 2, 3, 5, ..., 8), since the cor-responding evaluation should account for the additional time, cost and disruption to besustained. For example, the DM strongly prefers that a retrofit technique requires a smallintervention at the foundations even if it implies workers with a high degree of specialization
4The comparison of a criterion with itself obviously leads to a value ajj equal to 1. Therefore,the DM has to carry out only n(n-1)/2 pairwise comparisons.
TABLE 3 Scale of relative importance [Saaty, 1980]
Intensity of Importance Definition
1 Equal importance3 Moderate importance of one to another5 Essential or strong importance7 Demonstrated importance9 Extreme importance2, 4, 6, 8 Intermediate values between the two adjacent judgementsReciprocal of above If criterion j compared to k gives one of the above, then k,
when compared to j, gives its reciprocal
A = ⎡⎣ ⎤⎦ =a
/ / / /
/
/ / / /
ij
1 1 3 1 1 5 4 1 3 4 1 3
3 1 3 1 2 6 1 6 1
1 1 3 1 1 5 4 1 3 4 1 3
5 2 5 1 6 2 55 2
1 4 1 6 1 4 1 6 1 1 6 1 2 1 5
3 1 3 1 2 6 1 5 3
1 4 1 6 1 4 1 5 2 1 5 1 1 3
3 1 3
/ / / / / / /
/
/ / / / / /
11 2 5 1 3 3 1/ /
⎡
⎣
⎢⎢⎢⎢⎢⎢⎢⎢⎢⎢⎢
⎤
⎦
⎥⎥⎥⎥⎥⎥⎥⎥⎥⎥⎥
(5.2)

Multi-Criteria Decision Making for Seismic Retrofitting of RC Structures 569
(criterion C5); therefore, a65 = 6. On the other hand, criterion C6 is judged to be only mod-erately more important than the installation cost, duration of works, and limited damagerisk (a61 = a63 = a68 = 3), and it is assumed as important as maintenance costs (a62 = 1).
Criterion C5, regarding the skilled labor requirement and the technology level, is con-sidered less important than the others (a5k ≤1, k = 1, ..., 8), for the reasons above, that is,the owner prefers that the retrofit has better performance in terms of compatibility, costs,duration of works, even if the installation team has to be more specialized. Criterion C7(significant damage risk) is considered less relevant than C8 (limited damage risk) sincethe design target of the alternatives was the SD limit state and it is satisfied by all solu-tions. Therefore, it is assumed that the owner is more interested in reducing the expectedloss related to the repair in case of DL limit state occurrence; consequently, a78 = 1/3.
After all the pairwise comparisons have been performed and the A matrix has beenfilled, a consistency measurement of the DM’s judgments is needed, as will be discussedin the next section. If the comparisons among criteria are carried out in a perfectly consis-tent manner, each ajk value is exactly equal to the ratio wj/wk between the weights of crite-ria Cj and Ck, respectively. In this ideal case, the A matrix has rank equal to 1 and l = n =8 is its principal right eigenvalue. Moreover, it is also easy to show that the vector (W) ofrelative weights w1, w2, ..., w8 is the principal right eigenvector.
In the more realistic case, ajk deviates from the ratio wj/wk and the eigenvalues changeconsequently. In particular, the maximum eigenvalue lmax results to be greater than n (butclose to it) while the other eigenvalues are close to zero. It is reasonable to assume the vec-tor W equal to the eigenvector that corresponds to lmax. In other words, W has to satisfythe equation A W = lmax W. In the case under examination, it results lmax = 8.447 and thevector W results to be the following:
Weights wi can be used to rank the criteria with reference to their relative importanceas shown in Table 4. Furthermore, the pie chart in Fig. 12 represents the shares of impor-tance that the DM has defined via the pairwise comparisons. As anticipated previously,the weights have a significant influence on the final solution of the decisional problem andrepresent a subjective part of the procedure. For example, for the case under consideration,it results that the alternatives with the best evaluations in respect to criteria C4 and C6(which are relatively the most important) will be favored, whereas the evaluations accord-ing to criteria C5 and C7 will play a less critical role in the final decision. Therefore special
W={w } { . , . , . , . , . , . , . , . }.i = 0 073 0 172 0 073 0 280 0 026 0 201 0 035 0 141 (5.3)
TABLE 4 Ranking of criteria according to their weight
Ranking order Weights wi Criteria Description
I 0.280 C4 Functional compatibilityII 0.201 C6 Intervention at foundationIII 0.172 C2 Maintenance costIV 0.141 C8 Limited damage riskV-VI 0.073 C1, C3 Installation cost, Duration of worksVII 0.035 C7 Significant Damage riskVIII 0.026 C5 Skilled labor requirement

570 N. Caterino et al.
care is required in expressing the weighting judgements in a consistent manner, and inensuring that the final solution is stable, i.e., it does not change for slight modifications ofthe weights’ values.
5.1. Consistency Check of the Comparisons Among Criteria
A consistency measurement of the pairwise comparisons described may be useful toensure that no intolerable conflicts exist and that the final decision is logically sound andnot a result of random prioritization [Shapira and Goldenberg, 2005]. In case of a nonsuccessful check for consistency, the procedure aimed to draw up the A matrix has to beredone, in a more careful and coherent manner.
The pairwise comparisons can be considered conducted in a “perfectly” consistentway when the following condition is verified: if Ci is defined to be more important than Cjby a factor aij, and Cj is assumed to be more important than Ck by a factor ajk, then Cishould be more important than Ck by the factor aik = aij ajk. In this ideal case, in fact, itresults aij = wi/ wj and ajk = wj/ wk; therefore, aik = wi/wk = (wi/wj) (wj/wk) = aijajk. Sincethe DM (adopting the Saaty’s procedure described in the previous section) arbitrarilyassigns aij values, without any mathematical constraint, they generally deviate from the wi/wj ratios, and the perfect consistency is not achieved. In these cases, a degree of consis-tency has to be evaluated and then compared with a limit value considered acceptable,depending on the number (n) of compared elements.
First of all, the so-called “Consistency Index” (CI) has to be calculated as follows:
Then the CI has to be normalized by the “Random Consistency Index” (RCI) definedas an average random consistency measure depending on n (0, 0, 0.58, 0.90, 1.12, 1.24,1.32, 1.41, 1.45 for n = 1, 2, ..., 9, respectively). In this way, the so-called “ConsistencyRatio” (CR) is obtained. In general, pairwise comparisons can be considered consistentenough if CR is less than 5% if n = 3, 9% if n = 4, 10% if n > 4. Otherwise, as mentioned,it is necessary to re-examine the pairwise judgements until acceptable consistency isachieved.
For the case under examination, since for n = 8 it is RCI = 1.41, the A matrix can beconsidered consistent enough since it results CR = 4.5% < 10% as per Eq. (5.5);
FIGURE 12 Shares of relative importance of criteria.
C8 (14.1%)
C7 (3.5%)
C6 (20.1%)
C4 (28%)C5 (2.6%)
C1 (7.3%)
C2 (7.2%)
C3 (7.3%)
CIn
n.max=
−−
l1
(5.4)
CRCI
RCI
n
n 1
1
RCI
.
.. %.max= =
−−
⋅ =−
−⋅ =
l 8 447 8
8 1
1
1 414 5 (5.5)

Multi-Criteria Decision Making for Seismic Retrofitting of RC Structures 571
6. Evaluation of the Retrofit Alternatives
The sixth step of the decision making procedure consists of evaluating the alternativeupgrading solutions in respect to the considered criteria.
C1 – installation cost: The total cost to be sustained for the realization of each alternative5
include: all the materials and labor needed for the necessary demolitions (of structuraland non structural elements); the realization of the “core” of each intervention; andthe subsequent reconstruction of the non structural elements and finishings. Figure 13reports the cost corresponding to these three categories, showing that the cost of thelabour needed before and after the structural intervention properly defined, may besignificant. The total values result to be 23,096 € for A1, 53,979 € for A2, 11,175 €for A3, and 74,675 € for A4.
C2 – maintenance cost: Since the application of composite materials to structures is rela-tively recent, the durability and, consequently, the maintenance needs are still openissues. Given the not easy predictability of the necessary maintenance interventionsduring the economic life of the building (conventionally assumed to be 50 years), it isconsidered more realistic to compare the retrofit alternatives in terms of health’s mon-itoring cost to be sustained. For the alternative A1 (GFRP), it is assumed that aninstrumental inspection is needed every 10 years.
For the option A2 (steel braces), an anticorrosive treatment it is considered neces-sary every 20 years, independently on the results of the periodic inspections to be per-formed every 5 years. The corresponding cost is then included into the evaluation ofA2 according to the criterion in exam.
For A3 (RC jacketing), an inspection every 5 years and an instrumental examina-tion every 10 years are considered.
For A4 (base isolation), according to the instructions given by the HDRB devices’producer, it is assumed that “normal” and “in-depth” inspections are alternativelyrequired every 5 years (starting with an “in-depth” inspection right after the installation
5Excluding intervention at foundation; the same applies to criteria C2 and C3.
FIGURE 13 Installation cost: shares and total amount for each retrofit option.
21 1 3719
39
63
4
13
4
8
0
10
20
30
40
50
60
70
80
retrofit alternatives
inst
alla
tion
cost
s [1
03 €
]
Demolitions Intervention core Reconstruction
A1 A2 A3 A4
23
54
11
75

572 N. Caterino et al.
of the isolation system). Moreover, the replacement of a single isolator unit every 10years is considered, as suggested by the producers, in order to test it and assess theevolution of its mechanical properties.
Figure 14 shows the trend of the maintenance costs for each of the four options underexamination. The total maintenance costs, accounting for a 4% revaluation rate, resultsin the following: 23,206 €(A1); 115,037 € (A2); 40,353 € (A3); 97,884 € (A4).
C3 – duration of works/disruption of use: The time span needed to install each interven-tion is calculated by analyzing the time span required for each stage (beginning fromthe demolitions up to the finishings realization) and considering a team of four work-men (two of those are specialized workers). By assuming that each working day iscomposed by 8 hours, it results A1: 33 days; A2: 122 days; A3: 34 days; A4: 119 days.
C4 – functional compatibility and C5 – skilled labor requirement: The quantitativeevaluations according to these qualitative criteria will be done apart (Sec. 6.2).
C6 – significance of the needed intervention at foundations: In a rigorous approach, foreach retrofit option, the assessment of the substructure should be performed. For prac-tical reasons, a synthetic evaluation of alternatives according to C6 is done instead. Itconsists in calculating a “global” parameter equal to the maximum ratio, measured foreach column at the foundation level, between axial load due to the seismic action plusgravity loads and that due to the gravity loads only. It results A1: 2.90; A2: 15.18; A3:2.97; A4: 2.65. As expected, the intervention with steel braces leads to a significantincrease of the demand at foundation, due to the large nodal action transferred fromthe steel elements to the existing RC frame when the design earthquake is considered.
C7 – significant damage risk and C8 – damage limitation risk: The performances mea-surement with respect of these criteria will be done separately in the next sub-sectionin order to give the right space they need to be explained in an as much as possiblecomplete manner.
6.1. Evaluation of Alternatives According to Criteria C7 and C8
Criteria C7 (Significant Damage risk) and C8 (Damage Limitation risk) are related to theseismic capacity of the building being defined as the ground motion intensity (measuredby the peak ground acceleration, PGA) at which a certain limit state is attained. For
FIGURE 14 Maintenance costs during the economic life of the building, for each retrofitoption.
23
115
40
98
0
20
40
60
80
100
120
140
0 5 10 15 20 25 30 35 40 45 50years
mai
nten
ance
cos
ts [
103
€]
A1–GFRP
A2–steel bracing
A3–RC jacketing
A4–base isolation
Multi-Criteria Decision Making for Seismic Retrofitting of RC Structures 573
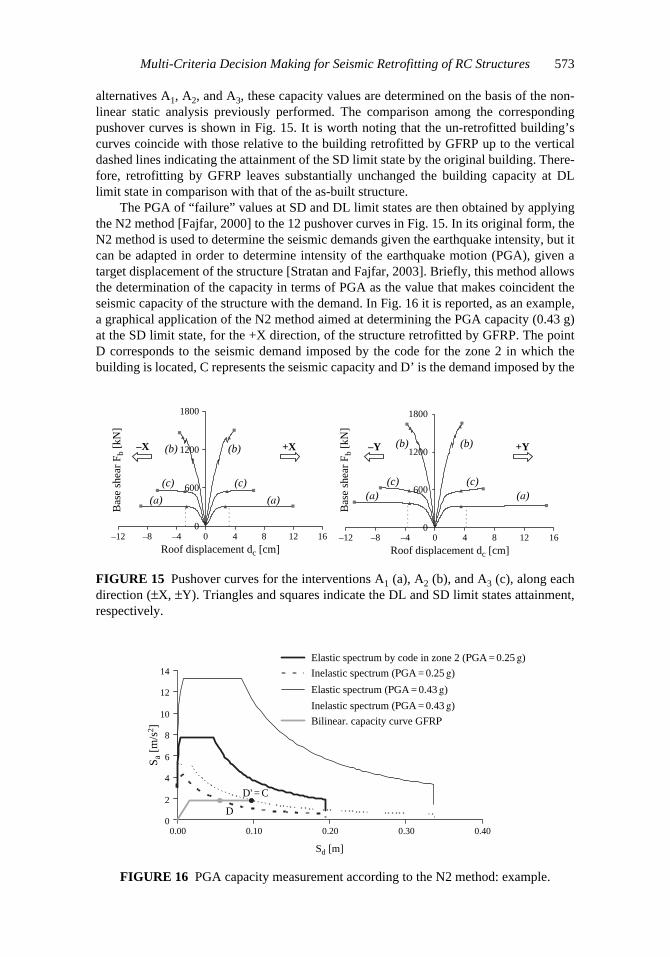
alternatives A1, A2, and A3, these capacity values are determined on the basis of the non-linear static analysis previously performed. The comparison among the correspondingpushover curves is shown in Fig. 15. It is worth noting that the un-retrofitted building’scurves coincide with those relative to the building retrofitted by GFRP up to the verticaldashed lines indicating the attainment of the SD limit state by the original building. There-fore, retrofitting by GFRP leaves substantially unchanged the building capacity at DLlimit state in comparison with that of the as-built structure.
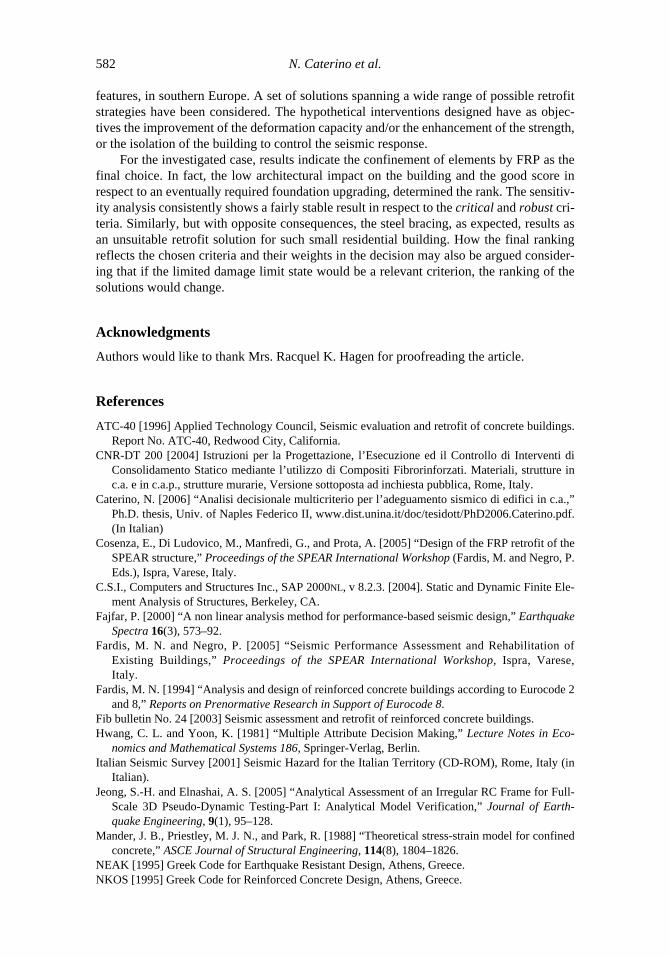
The PGA of “failure” values at SD and DL limit states are then obtained by applyingthe N2 method [Fajfar, 2000] to the 12 pushover curves in Fig. 15. In its original form, theN2 method is used to determine the seismic demands given the earthquake intensity, but itcan be adapted in order to determine intensity of the earthquake motion (PGA), given atarget displacement of the structure [Stratan and Fajfar, 2003]. Briefly, this method allowsthe determination of the capacity in terms of PGA as the value that makes coincident theseismic capacity of the structure with the demand. In Fig. 16 it is reported, as an example,a graphical application of the N2 method aimed at determining the PGA capacity (0.43 g)at the SD limit state, for the +X direction, of the structure retrofitted by GFRP. The pointD corresponds to the seismic demand imposed by the code for the zone 2 in which thebuilding is located, C represents the seismic capacity and D’ is the demand imposed by the
FIGURE 15 Pushover curves for the interventions A1 (a), A2 (b), and A3 (c), along eachdirection (±X, ±Y). Triangles and squares indicate the DL and SD limit states attainment,respectively.
0
600
1200
1800
–12 –8 –4 0 4 8 12 16
Roof displacement dc [cm]–12 –8 –4 0 4 8 12 16
Roof displacement dc [cm]
Bas
e sh
ear
F b [
kN]
Bas
e sh
ear
F b [
kN]
0
600
1200
1800
–X (b)
(c)
(a) (a)
(c)
(b) +X –Y (b)
(c)(a) (a)
(c)
+Y(b)
FIGURE 16 PGA capacity measurement according to the N2 method: example.
0
2
4
6
8
10
12
14
0.00 0.10 0.20 0.30 0.40
Sd [m]
S a [
m/s
2 ]
Elastic spectrum by code in zone 2 (PGA = 0.25 g)
Inelastic spectrum (PGA = 0.25 g)
Elastic spectrum (PGA = 0.43 g)
Inelastic spectrum (PGA = 0.43 g)
Bilinear. capacity curve GFRP
D' = C
D

574 N. Caterino et al.
spectrum “anchored” to a PGA value equal to 0.43 g, determined by subsequent attempts,just in order to make C coincident with D’.
For the alternative A4 (base isolation), the capacity at SD and DL limit states in termsof PGA is obtained by a modal response spectrum analysis. These limit conditions areattained in the isolator devices first and subsequently, for a larger value of the seismicdemand, in the superstructure. Thus, the devices capacity substantially controls the globalbuilding seismic capacity when retrofit option A4 is considered.
The following Table 5 summarizes the capacity values at SD and DL limit states (i.e.,the minimum value among those corresponding to the four directions ±X, ±Y) for theoriginal building and for the four considered retrofit alternatives.
The demand defined by the code for the site considered, measured in terms of PGAvalue on rock, is equal to 0.10 g and 0.25 g for the DL and SD limit states, respectively.Comparing these to Table 5, it is possible to conclude that all retrofit options achieve thestructural performance targets of upgrading, since the capacity of the retrofitted buildingalways results to be equal or larger than the demand for both limit states.
To evaluate the four alternatives in respect to criteria C7 and C8, the probability ofexceeding in 50 years the capacity value PGA of Table 5 is computed. This is a proxy mea-sure of the risk reduction implied by each retrofit solution. These probabilities (Table 6) arecalculated by means of the hazard curve for Pomigliano d’Arco (Fig. 17), approximated bythe relationship p = 0.002PGA−2.18 (given by the Italian Seismic Survey, 2001).
C7 – significant damage risk: The performance of each alternative according to thiscriterion is measured by the values at the SD row of Table 6.
C8 – damage limitation risk: The evaluation of each of the four options in respect to thiscriterion, has to be interpreted as the probability of sustaining repair costs in 50 yearsrather than the probability of exceeding the capacity at DL limit state in 50 years.Therefore, the evaluation in respect to C8 corresponds to the probability that the seis-mic capacity at the DL limit state is exceeded and at SD is not (otherwise it is unlikelyto be convenient to repair the building) in 50 years. These values are calculated as themaximum difference (among all the four directions) between the probability ofexceeding the DL and SD limit states, respectively. It results in A1: 0.291; A2: 0.002;A3: 0.172; A4: 0.000.
TABLE 5 Capacity values in terms of PGA [g] at Significant Damage (SD) and Damage Limitation (DL) limit states for as-built and retrofitted building
Limit state As builtA1
GFRPA2 Steel bracing
A3 RC jacketing
A4 Base isolation
SD 0.103 0.332 0.317 0.253 0.348DL 0.100 0.100 0.308 0.118 0.348
TABLE 6 Probability of exceeding in 50 years the seismic capacity at SD and DL limit states of the original and retrofitted building
Limit state As builtA1
GFRPA2 Steel bracing
A3 RC jackets
A4 Base isolation
SD 0.284 0.022 0.024 0.040 0.020DL 0.303 0.303 0.026 0.211 0.020

Multi-Criteria Decision Making for Seismic Retrofitting of RC Structures 575
6.2. Quantitative Evaluation of Alternatives According to the Qualitative Criteria
In the presented application, only judgments in linguistic terms of retrofit alternativesaccording to criteria C4 (functional compatibility) and C5 (skilled labor requirement/needed technology level) have been carried out. In order to apply any MCDM method(TOPSIS herein) the conversion of these qualitative variables into crisp numbers isneeded. To complete this task, the eigenvalue approach is used, as done for the definitionof criteria weights (Sec. 5). Therefore, pairwise comparisons among the alternatives weredone in terms of their performances according to qualitative criteria C4 and C5. Then,through the linear scale of Table 3, the aij crisp number, corresponding to the comparisonbetween alternatives Ai and Aj was defined.6 After assembling two 4-by-4 matrices withall the aij values (Tables 7 and 8 for criteria C4 and C5, respectively), the eigenvalueapproach leads to the calculation of the quantitative performances of each retrofit optionaccording to the considered qualitative criterion. A few comments are useful to understandhow the procedure leads to the matrices of in Tables 7 and 8.
Criterion C4 – functional compatibility: Alternative A1 (GFRP) is much less invasivethan A2 (steel bracing) since the latter involves elimination of existing openings andwindows of the braced bays (a significant fraction of bays, considering the relatively
6In Table 3 the relative “importance” has to be interpreted as the relative measure of the Ai andAj alternatives’ fulfillment to the considered criterion.
FIGURE 17 PGA on rock exceedance probability in 50 years (hazard curve) forPomigliano d’Arco (Italy).
0
0.2
0.4
0.6
0.8
1
0 0.05 0.1 0.15 0.2 0.25 0.3
PGA [g]
Exc
eedi
ng p
roba
bilit
y in
50
yrs
TABLE 7 Quantitative evaluation of alternatives according to criterion C4 (lmax = 4.042; CR = 1.6%)
A1 A2 A3 A4 Priority
A1 1 7 2 5 0.538A2 1/7 1 1/3 1/2 0.074A3 1/2 3 1 3 0.274A4 1/5 2 1/3 1 0.114

576 N. Caterino et al.
small size of the building). The GFRP intervention (the superimposed plastic fabriclayers are less than 1 mm in thickness) practically does not imply any impact on thearchitectural configuration and functionality of the original structure. Concrete jacketingof the three selected columns (A3) involves only a small enlargement of the crosssections that may result in a moderately unpleasant appearance of the facades. Baseisolation does not imply any intervention on the superstructure, although it results in ause restriction of the building at ground floor since the removal of the existing floorand the laying of removable steel grilles (necessary for the maintenance of isolators).
Criterion C5 – skilled labor requirement/needed technology level: The installation ofthe retrofit alternatives A1 (GFRP) and A4 (base isolation) requires a relatively highlevel of workers’ specialization, moderately higher in comparison with option A2(steel bracing), strongly in respect to A3 (concrete jacketing).
From Tables 7 and 8 it is possible to compute the Consistency Ratios (like in theEquation (5.5)): 1.6% for C4 and 1.4% for C5. They are both much lower than the limit of9% given by Saaty [1999] for a 4-by-4 matrix, indicating a satisfactory degree of consis-tency of the pairwise comparisons made above.
7. Ranking of the Alternatives and Selection of the Best Retrofit Solution
The selected MCDM method is the Technique for Order Preference by Similarity to IdealSolution (TOPSIS). It was developed by Hwang and Yoon [1981] and is based on thegeometrical concept that the best alternative should have the shortest distance to an idealsolution (A*) and the farthest distance to a negative-ideal one (A−).
Let xij indicate the performance measure of the i-th alternative (i = 1, 2, 3, 4) in termsof the j-th criterion (j = 1, 2, ..., 8), evaluated in the previous sections. All the xij have to becollected in the decision matrix D = [xij] representing the starting point for any applicationof the TOPSIS method (Table 9). The normalization of xij values, each of those beingcharacterized by different units, has to be done. According to the TOPSIS procedure,Eq. (7.1) is adopted to do this. Let rij indicate the normalized value of xij. The normalized
TABLE 8 Quantitative evaluation of alternatives according to criterion C5 (lmax = 4.037; CR = 1.4%)
A1 A2 A3 A4 Priority
A1 1 4 7 1 0.414A2 1/4 1 3 1/4 0.120A3 1/7 1/3 1 1/7 0.052A4 1 4 7 1 0.414
TABLE 9 Decision Matrix D
C1 [€] C2 [€] C3 [days] C4 C5 C6 C7 C8
A1 23,096 23,206 33 0.538 0.414 2.90 0.022 0.291A2 53,979 115,037 122 0.074 0.120 15.18 0.024 0.002A3 11,175 40,353 34 0.274 0.052 2.97 0.040 0.172A4 74,675 97,884 119 0.114 0.414 2.65 0.020 0.000

Multi-Criteria Decision Making for Seismic Retrofitting of RC Structures 577
decision matrix R = [rij] is thus obtained (Table 10). The next step is weighting the Rmatrix by multiplying each value of the j-th column by the weight (wj) of the j-th criterion.This leads to obtain the weighted normalized decision matrix, V = [wj rij = vij], given inTable 11.
The two opposite fictitious solutions A* and A−, exactly as for the real alternativesA1, A2, A3, and A4, are defined by eight values, representing the performances (weightedand normalized) measured according the criteria (Table 12). In particular, the ideal solu-tion A* is obtained by taking for each criterion the “best” performance value among A1,A2, A3, and A4 (indicated by an asterisk in Fig. 18). Conversely, the negative-ideal solu-tion A− is composed by considering for each criterion the “worst” performance measureamong the alternatives (indicated by a minus in Fig. 18).
It is important to remark that the best value among performances of all the alterna-tives in respect of the generic criterion Ci has to be interpreted as the minimum valueamong those included in the i-th column of the V matrix if Ci is a “cost” criterion (that isa criterion in respect of which the DM is interested in minimizing the performance valueof the intervention). On the other hand, the best value is assumed as the maximum value ifCi is a “benefit” criterion (like C4, that is the only benefit criterion among the considered
TABLE 10 Normalized Decision Matrix R
C1 C2 C3 C4 C5 C6 C7 C8
A1 0.241 0.147 0.187 0.869 0.690 0.182 0.398 0.861A2 0.564 0.728 0.690 0.120 0.200 0.951 0.434 0.006A3 0.117 0.255 0.192 0.443 0.087 0.186 0.723 0.509A4 0.781 0.619 0.673 0.184 0.690 0.166 0.362 0.000
TABLE 11 Weighted Normalized Decision Matrix V
C1 C2 C3 C4 C5 C6 C7 C8
A1 0.018 0.025 0.014 0.243 0.018 0.037 0.014 0.121A2 0.041 0.125 0.050 0.033 0.005 0.191 0.015 0.001A3 0.009 0.044 0.014 0.124 0.002 0.037 0.025 0.072A4 0.057 0.107 0.049 0.052 0.018 0.033 0.013 0.000
rx
x
.ijij
kj2
k 1
4=
=∑
(7.1)
TABLE 12 Ideal solution A* and negative-ideal solution A−
C1 C2 C3 C4 C5 C6 C7 C8
A* 0.009 0.025 0.014 0.243 0.002 0.033 0.013 0.000A− 0.057 0.125 0.050 0.033 0.018 0.191 0.025 0.121

578 N. Caterino et al.
criteria: actually the DM is interested in maximizing the compatibility of the retrofit inter-vention to the existing building).
A comparison among the alternatives in terms of normalized performances rij isshown by the bar diagram in the top panel of Fig. 18 where it is also indicated, foreach criterion, if the Decision Maker’s goal is to maximize or minimize the corre-sponding performance score. The bar chart in the lower part of Fig. 18 shows, instead,the comparison done with reference to the weighted normalized values vij = wjrij. Thetransformation of the first diagram into the second one, depending on the value ofcriteria weights, reflects the Decision Maker profile and the building’s destinationof use.
Each of the alternatives, real (A1, A2, A3, A4) and fictitious (A* and A−), can bethought of as a point of the 8th dimensional space defined by the axes along which perfor-mances according to each of the 8 criteria are measured. Therefore, each row of the Vmatrix (Table 11) gives the coordinates of such points. The coordinates for the idealoptions are defined by the values in Table 12. Figure 19 reports, as an example, a 3D por-tion (axis C4, C6, C8) of the criteria space, in order to show the reciprocal position of thealternatives and their distances the A* and A− alternatives.
Let Si* and indicate the distance of Ai to A* and A−, respectively, see Eq. (7.2).The TOPSIS method ranks alternative solutions in terms of the so-called relative closeness
FIGURE 18 Graphical comparison among alternatives in terms of normalized perfor-mances rij (top) and weighted normalized performances vij (bottom)
0.0
0.1
0.2
0.3
0.4
0.5
0.6
0.7
0.8
0.9
1.0
r ij
A1 (GFRP) A2 (Steel bracing) A3 (RC jacketing) A4 (Base isolation)
min min min max min min min min
**
*
*
**
*
*
--
-
-
- -
-
-
-
C1 C2 C3 C4 C5 C6 C7 C8
min C1
min C2
min C3
max C4
min C5
min C6
min C7
min C8
0.00
0.05
0.10
0.15
0.20
0.25
0.30
Criteri Ci
Vij
A1 (GFRP) A2 (Steel bracing) A3 (RC jacketing) A4 (Base isolation)
** *
*
*
**
*
-
-
--
--
-
-
-
Si−

Multi-Criteria Decision Making for Seismic Retrofitting of RC Structures 579
Ci* (0 ≤ Ci* ≤ 1) to the A*, with Ci* defined as in the Eq. (7.3). The best alternative is theone with the highest Ci* value.7
The obtained Si*, Si-, and Ci* values for the four alternatives under examination arereported in Table 13. Alternative A1 (GFRP) results to be the best one, with a relativecloseness, C1*, equal to 0.70. Alternative A1 also results to have the shortest absolute dis-tance from the ideal solution A* (S1* = 0.123) and the farthest absolute distance from thenegative-ideal solution A− (S1
− = 0.285). A3 (concrete jackets), A4 (base isolation), and A2(steel bracing) follow.
7Clearly it results Ci* = 1 if Ai = A* and Ci* = 0 if Ai = A−.
FIGURE 19 A 3D portion of the 8D criteria space: alternatives and distancesrepresentation.
real alternatives
fictitious alternatives
Si*
Si–
C4
A1
A3
A4
A2
C6
C8
A*
A_
S ( ) S ( ) ; i 1,2,3, .i* ij j*2
j 1
8
i ij j2
j 1
8
= − = − ==
− −=
∑ ∑n n n n ; 4 (7.2)
CS
S Sii
i i*
*
.=+
−
−(7.3)
TABLE 13 Distances Si*, Si- and relative closeness to the ideal solution Ci* of each alternative
Alternative Si* Si- Ci*
GFRP A1 0.123 0.285 0.70Steel bracing A2 0.285 0.123 0.30Concrete jackets A3 0.141 0.212 0.60Base isolation A4 0.217 0.201 0.48

580 N. Caterino et al.
8. Sensitivity Analysis
A sensitivity analysis may be useful to assess the stability of the optimal solution underchanges in the input parameters (i.e., criteria weights wi and alternatives’ evaluations xij).In particular, the sensitivity of the assigned weights (according to Triantaphyllou, 2002) isreported here, not covering changes in the xij values (that would result in 4x8 = 32 differ-ent sensitivity scenarios).
The first step is done by taking one decision criterion at a time and determining theintervals (included between 0 and 1) in which its weight value may vary without affectingthe ranking of the alternatives. These intervals, together with the corresponding alterna-tives’ classification, are shown in the Table 14. It is worth noting that criteria C2, C3, andC6 can be defined as robust criteria since any arbitrary change in their weight does notaffect the existing ranking of any of the alternatives.
In order to measure the sensitivity of each weight to the final decision, absolute orrelative (namely divided by the adopted wi value) changes of their values can be consid-ered. Furthermore, it is interesting to see whether a change in the current weight valuecauses any two alternatives to reverse their existing ranking or only the change of the bestalternative. Thus, four different sensitivity definitions can be considered. Herein thePercent-Top (PT) definition [Triantaphyllou, 2002] is considered, since it is appropriate tosurvey the best solution changes. In Table 15 the minimum absolute change (indicated as“AT,” Absolute-Top) causing the variation of the best solution (starting from the selectedone, A1) is reported for each weight. The corresponding relative PT change is then
TABLE 14 Sensitivity analysis for criteria weigths
Ranking order
Weights Assumed values Intervals I II III IV
w1 0.073 0.000 ÷ 0.499 A1 A3 A4 A20.499 ÷ 0.583 A3 A1 A4 A20.583 ÷ 1.000 A3 A1 A2 A4
w2 0.172 0.000 ÷ 1.000 A1 A3 A4 A2w3 0.073 0.000 ÷ 1.000 A1 A3 A4 A2w4 0.280 0.000 ÷ 0.097 A3 A4 A1 A2
0.097 ÷ 0.183 A3 A1 A4 A20.183 ÷ 1.000 A1 A3 A4 A2
w5 0.026 0.000 ÷ 0.183 A1 A3 A4 A20.183 ÷ 0.321 A3 A1 A4 A20.321 ÷ 0.477 A3 A1 A2 A40.477 ÷ 1.000 A3 A2 A1 A4
w6 0.201 0.000 ÷ 1.000 A1 A3 A4 A2w7 0.035 0.000 ÷ 0.365 A1 A3 A4 A2
0.365 ÷ 0.651 A1 A4 A3 A20.651 ÷ 1.000 A1 A4 A2 A3
w8 0.141 0.000 ÷ 0.241 A1 A3 A4 A20.241 ÷ 0.255 A3 A1 A4 A20.255 ÷ 0.267 A3 A4 A1 A20.267 ÷ 0.325 A4 A3 A1 A20.325 ÷ 0.377 A4 A3 A2 A10.377 ÷ 1.000 A4 A2 A3 A1

Multi-Criteria Decision Making for Seismic Retrofitting of RC Structures 581
obtained by dividing the AT value by the weight wi of criterion Ci. The PT value for Cican also be defined as “criticality degree” of the i-th criterion. The sensitivity coefficientof the Ci criterion is the reciprocal of its criticality degree. For the robust criteria, AT andPT values are non feasible (N.F. in the Table 15) and the sensitivity coefficient is set to beequal to zero.
Criterion C4 (functional compatibility) results to be the PT “critical criterion” since ithas the minimum PT value (35%) and consequently the maximum sensitivity coefficient(0.0029). In fact, it frequently happens that when weight changes are measured in relativeterms, the most sensitive decision criterion is the one with the highest weight (w4 = 0.280).
Six of the eight criteria weights may assume very large changes in their values with-out determining a best solution different from A1. Only criteria C4 and C8 seem to be moresensitive to the optimal alternative, but their PT changes (35 and 70%, respectively) arejudged to be large enough to say sufficiently stable the selected optimal retrofit solution.
9. Conclusions
The choice of the technique to implement a retrofit strategy in a seismic upgrading projectinvolves several non homogeneous variables and different objectives, which may require aformal approach for the determination of the optimum. In fact, conversely to what may beexpected, often the most relevant criteria for the decision in a seismic upgrading problemare not those related to structural performance or, at least, they should be consideredtogether with others non technical and/or non quantitative. The study presented aimed atexploring a rational and quantitative approach to evaluate and rank different solutions forthe seismic retrofit of existing RC structures. As a multi-criteria decision issue, it wastackled herein by a method allowing to quantitatively uniform the relevant scores of anyof the alternatives in the pre-defined set, in a way they can be combined in a measure ofthe relative distance to the “best” and “worst” cases, made of virtual solutions.
The MCDM has some critical aspects in the procedure which, more than others, affectthe final ranking and the identification of the best intervention. In particular, the choice ofthe relevant criteria reflects the decision-maker/stake-holder profile. Similarly, the defini-tion of the weight for each criterion represents a subjective step. Also, the conversion ofthe qualitative evaluations into crisp numbers may be non trivial and may require a carefulapplication of non traditional approaches. Therefore, tools as the consistency index andthe sensitivity analysis are useful to control and disaggregate the decision process.
These points have been discussed with reference to an illustrative example referringto a substandard RC structure representing existing buildings, lacking appropriate seismic
TABLE 15 Absolute-Top (AT), Percent-Top (PT) changes, and sensitivity of criteriaweights
Weights Assumed values AT PT (%) Sensitivity
w1 0.073 0.425 582 0.00172w2 0.172 N.F. N.F. 0w3 0.073 N.F. N.F. 0w4 0.280 0.098 35 0.02857w5 0.026 0.156 600 0.00167w6 0.201 N.F. N.F. 0w7 0.035 N.F. N.F. 0w8 0.141 0.099 70 0.01424
582 N. Caterino et al.
features, in southern Europe. A set of solutions spanning a wide range of possible retrofitstrategies have been considered. The hypothetical interventions designed have as objec-tives the improvement of the deformation capacity and/or the enhancement of the strength,or the isolation of the building to control the seismic response.
For the investigated case, results indicate the confinement of elements by FRP as thefinal choice. In fact, the low architectural impact on the building and the good score inrespect to an eventually required foundation upgrading, determined the rank. The sensitiv-ity analysis consistently shows a fairly stable result in respect to the critical and robust cri-teria. Similarly, but with opposite consequences, the steel bracing, as expected, results asan unsuitable retrofit solution for such small residential building. How the final rankingreflects the chosen criteria and their weights in the decision may also be argued consider-ing that if the limited damage limit state would be a relevant criterion, the ranking of thesolutions would change.
Acknowledgments
Authors would like to thank Mrs. Racquel K. Hagen for proofreading the article.
References
ATC-40 [1996] Applied Technology Council, Seismic evaluation and retrofit of concrete buildings.Report No. ATC-40, Redwood City, California.
CNR-DT 200 [2004] Istruzioni per la Progettazione, l’Esecuzione ed il Controllo di Interventi diConsolidamento Statico mediante l’utilizzo di Compositi Fibrorinforzati. Materiali, strutture inc.a. e in c.a.p., strutture murarie, Versione sottoposta ad inchiesta pubblica, Rome, Italy.
Caterino, N. [2006] “Analisi decisionale multicriterio per l’adeguamento sismico di edifici in c.a.,”Ph.D. thesis, Univ. of Naples Federico II, www.dist.unina.it/doc/tesidott/PhD2006.Caterino.pdf.(In Italian)
Cosenza, E., Di Ludovico, M., Manfredi, G., and Prota, A. [2005] “Design of the FRP retrofit of theSPEAR structure,” Proceedings of the SPEAR International Workshop (Fardis, M. and Negro, P.Eds.), Ispra, Varese, Italy.
C.S.I., Computers and Structures Inc., SAP 2000NL, v 8.2.3. [2004]. Static and Dynamic Finite Ele-ment Analysis of Structures, Berkeley, CA.
Fajfar, P. [2000] “A non linear analysis method for performance-based seismic design,” EarthquakeSpectra 16(3), 573–92.
Fardis, M. N. and Negro, P. [2005] “Seismic Performance Assessment and Rehabilitation ofExisting Buildings,” Proceedings of the SPEAR International Workshop, Ispra, Varese,Italy.
Fardis, M. N. [1994] “Analysis and design of reinforced concrete buildings according to Eurocode 2and 8,” Reports on Prenormative Research in Support of Eurocode 8.
Fib bulletin No. 24 [2003] Seismic assessment and retrofit of reinforced concrete buildings.Hwang, C. L. and Yoon, K. [1981] “Multiple Attribute Decision Making,” Lecture Notes in Eco-
nomics and Mathematical Systems 186, Springer-Verlag, Berlin.Italian Seismic Survey [2001] Seismic Hazard for the Italian Territory (CD-ROM), Rome, Italy (in
Italian).Jeong, S.-H. and Elnashai, A. S. [2005] “Analytical Assessment of an Irregular RC Frame for Full-
Scale 3D Pseudo-Dynamic Testing-Part I: Analytical Model Verification,” Journal of Earth-quake Engineering, 9(1), 95–128.
Mander, J. B., Priestley, M. J. N., and Park, R. [1988] “Theoretical stress-strain model for confinedconcrete,” ASCE Journal of Structural Engineering, 114(8), 1804–1826.
NEAK [1995] Greek Code for Earthquake Resistant Design, Athens, Greece.NKOS [1995] Greek Code for Reinforced Concrete Design, Athens, Greece.

Multi-Criteria Decision Making for Seismic Retrofitting of RC Structures 583
OPCM 3274 [2003] Ordinanza del Presidente del Consiglio dei Ministri, Primi elementi in materiadi criteri generali per la classificazione sismica del territorio nazionale e normative tecniche perle costruzioni in zona sismica, Rome, Italy.
OPCM 3431 [2005] Ordinanza del Presidente del Consiglio dei Ministri, Ultime modifiche ed inte-grazioni all’Ordinanza n. 3274 del 20 marzo 2003, Rome, Italy.
Saaty, T. L. [1980] The Analytic Hierarchy Process McGraw-Hill, New York.Saaty T. L. [1999] Decision Making for Leaders: The Analytic Hierarchy Process for Decision in a
Complex World, RWS Publications, Pittsburgh, PA.Shapira, M. and Goldenberg, M. [2005] “AHP-based equipment selection model for construction
projects,” ASCE Journal of Construction Engineering and Management, 131(12), 1263–1273.Spoelstra, M. R. and Monti, G. [1999] “FRP-confined concrete model,” ASCE Journal of Compos-
ites for Construction, 3(3), 143–150.Stratan, A. and Fajfar, P. [2003] “Seismic Assessment of the SPEAR Test Structure,” University of
Ljubljana, www.ikpir.com/projects/spear/.Thermou, G. E. and Elnashai, A. S. [2002] Report about SPEAR Project, Performance Parameters
and Criteria for Assessment and Rehabilitation, A.S., I.C. of Science, Technology and Medicine,UK, 2002.
Triantaphyllou, E. [2002] “Multi-criteria decision making methods: a comparative study,” AppliedOptimization, Vol. 44, Kluwer Academic Publishers, Dordrecht, The Netherlands.