Embed Size (px)
Citation preview


Oslo
Trondheim
Houston
Mexico City
Rio de Janeiro
Multi-client library Canada- 2.500 sq. km
Multi-client library US GoM- 14.500 sq. km
Multi-client library Brazil- 12.000 sq. km
Multi-client library Norway- 90.000 sq. km
EMGS key figures
Multi-client library Mexico- 16.000 sq. km
0
100
200
2007 2008 2009 2010 2011 2012 2013 2014 2015 2016 2017 2018
USD million
Tho
usa
nd
s
Contract Revenue Multi-client revenue

Kuala Lumpur
Mumbai
Multi-client library Indonesia- 2.800 sq. km
4EMGS technology
offerings and value added
8Board of Directors
10Board of Directors’
Report
22Responsibility Statement
23Report on Corporate
Governance
33Report on Sustainability
and CSR
37Determination of Salary
Statement
39Financial Statements
EMGS Group
82Financial Statements
EMGS ASA
105Auditor’s Report for 2018
Multi-client library India- 250 sq. km
-50
-30
-10
10
30
50
70
2007 2008 2009 2010 2011 2012 2013 2014 2015 2016 2017 2018
USD million EBITDA

4
EMGS technology, offerings and value added.
The electromagnetic (EM) technology used by EMGS in its survey projects can be divided into two distinct methods: controlled-source electromagnetic (CSEM) surveying and magnetotelluric (MT) surveying.
CSEM When performing a CSEM survey, a powerful horizontal electric dipole source is towed above the seafloor. The dipole source transmits a low-frequency electromagnetic signal into the subsurface. The resistivity of the rocks defines the way the electromagnetic energy transmitted by the dipole propagates through the subsurface. High resistivity is an indicator for a possible hydrocarbon-filled reservoir. Multi-component seabed receivers measure the electromagnetic energy that has propagated through the sea and the subsurface. The information from these receivers is processed and inverted to produce a 3D resistivity image from the survey area. EMGS deploys grids of receivers to acquire full-azimuth surveys providing optimal illumination of the subsurface. CSEM surveying is a valuable supplement to information on structure and deposition of sediments provided from seismic techniques. The combination of the two techniques (CSEM and seismic) together with other complementary subsurface information forms a valuable set of exploration tools, as charge, seal and volumetrics of the prospects are better defined and understood. EMGS has developed a workflow that allows oil companies to easily integrate CSEM information with seismic data and embed the integrated interpretation in their prospect evaluation work: The EMGS’ Exploration Solution. The workflow includes steps such as resistivity attribute analysis (similar to working with seismic attributes), anomaly identification and delineation, anomaly significance tests, sensitivity assessment for depth intervals of interest, correlation of anomalies to seismic observations such as conformance to structure, seismic DHI and seismic indicators of lithological resistors. The resulting integrated interpretation observables are used to establish likelihood of a prospect being hydrocarbon charged and the size/area of a possible hydrocarbon accumulation. The EMGS’ Exploration Solution workflow transforms CSEM data into information for improved exploration decision making:

5
MT Similar to CSEM surveying, the MT technique generates insight into the subsurface by imaging subsurface resistivity. Marine MT surveys map subsurface resistivity variations by measuring naturally occurring electromagnetic signals on the seabed. These signals are generated by the interactions of solar wind with the Earth’s magnetic field, which, when strong, are known as geomagnetic storms. The MT signals are of very low frequency, which offers excellent depth penetration. The unique design and sensitivity of the EMGS seabed receivers enable EMGS to efficiently acquire high quality MT data as part of a CSEM survey when the controlled source is inactive. The low-frequency, deep-sensing nature of MT surveying makes the technique valuable for imaging and interpreting regional geology. MT surveys have been found most useful in salt and basalt settings where the flanks and/or the base are poorly defined. MT measurements, therefore, form a useful complement to seismic techniques, particularly in settings where high-impedance volcanic rocks or salt make the imaging and interpretation of seismic challenging.
Application of EM technology The services offered by EMGS are used in all stages of the offshore exploration and development cycle. Applications of EMGS’ technology include evaluating regional prospectivity, ranking of identified prospects and appraisal of discoveries.

6
Regional Prospectivity At the early stages of the exploration and production process, oil and gas companies use EM services to evaluate whether an offshore acreage is viable for commercial production of hydrocarbons. EM surveys are conducted before licensing decisions to better understand the acreage value and potential of leads and prospects mapped with seismic. EM may also be used to de-risk new unproven plays and generate leads. Adopting EM early in the exploration cycle helps oil and gas companies focus their investments on the most valuable acreage.
Prospect Ranking and Portfolio Polarisation When a prospect is identified from seismic information, EM surveys can help operators reduce uncertainties in its probability of success and expected hydrocarbon volume, resulting in a more reliable economic evaluation of the prospect. When EM surveying is used over a portfolio of prospects, the prospect evaluations become polarised, enabling operators to upgrade or downgrade prospects before making drilling decisions. Using EM to rank prospects reduces risk of drilling dry wells while increasing the economic success of exploration projects.
Field Appraisal Once a discovery is made, EM surveys can be used to ascertain a field’s commercial viability and aid in development planning by improving reservoir delineation. EM can also assist in the optimal placement of subsequent development wells and reduce the number of appraisal wells that would typically be required for field delineation and reservoir characterization.
Development of EM technology
Development of marine EM equipment In 2017 EMGS commercialised the Deep Blue source system, which is the most powerful deep-towed EM source in the industry. The Deep Blue source system consist of a top side unit, slip ring, umbilical, sub-sea unit and antenna. In addition, the onboard handling equipment was upgraded to meet the commercial requirements for marine operation. Following commercialisation of the Deep Blue, the first commercial survey was performed in July 2017. The Deep Blue has been used actively in Norway throughout 2018, especially for mature basin surveys in the North Sea and Norwegian Sea. The commercial offering is a stronger source output combined with increased flexibility for creating the waveform output. The Deep Blue increases the depth of investigation (below mudline) well beyond the capabilities of the conventional source systems. In addition, the new source also increases imaging confidence and resolution for targets that can already be detected with the conventional source system. The Deep Blue can operate in water depths up to 4,000 m. All data acquired with Deep Blue to date confirms the ability to increase sensitivity and resolution through combination of higher source output, increased frequency bandwidth and better accuracy, which allows to image deeper and smaller targets. As a result, Deep Blue increases the addressable market for frontier exploration as well as opens up new markets for EM such as near-field exploration and appraisal.

7
Software development
EMGS offers workstation and high-performance computing software for all stages of an EM project: Feasibility studies, survey planning, processing, modeling, inversion and interpretation. EMGS software is available for licensing to oil companies and consultants. The new generation 3D Gauss-Newton inversion and 3D TTI inversion have become the standard imaging products offered by EMGS. These products were first introduced in 2016 and have higher image quality and reliability compared to other 3D inversion products available on the geophysical market. Optimization of our inversion software in terms of imaging capabilities and computational efficiency has been a continuous effort throughout 2018 in order to provide the best possible image quality without increasing project turnaround time. In addition, changes to the underlying software design were made to simplify usage of the software and improve user experience. These design improvements are important element of EMGS’ strategy to license EM software to its customers. In 2018, EMGS also introduced a cloud computing service to make EMGS’ modeling and imaging software accessible to customers that do not have an in-house processing center. To develop the application of CSEM for reservoir characterization further, EMGS implemented new software functionality for rock physics modeling and quantitative interpretation. These benefit appraisal projects, where customers seek to integrate CSEM results with petrophysical data to establish the hydrocarbon distribution in the field. This new functionality is now undergoing testing and will be released in early 2019. EMGS has close dialogue with oil companies licensing EMGS software about new features and functionality. In 2018 we started a customer funded development of an inversion feature that will facilitate integration of geological models during the imaging step. This new feature will be delivered to the customer in Q2 2019. EMGS software allows customers to take full control of their EM data by generating high quality inversion images, new interpretation insight and updating existing prospect evaluations.

8
Board of Directors.
Eystein Eriksrud, Chairman of the Board
Eystein Eriksrud is the Deputy CEO of Siem Industries Group. He is chairman of Siem Offshore Inc. and a director of Subsea 7 S.A., Siem Kapital AS, Siem Capital UK Ltd. and Siem Europe Sarl. Prior to joining Siem Industries in October 2011, Eystein Eriksrud was partner of the Norwegian law firm Wiersholm Mellbye & Bech, working as a business lawyer from 2005 with an internationally oriented practice in mergers and acquisitions, company law and securities law, particularly in the shipping, offshore and oil service sectors. He was Group Company Secretary of the Kvaerner Group from 2000-2002 and served as Group General Counsel of the Siem Industries Group from 2002-2005. He has served on the boards of Privatbanken ASA and Tinfos AS as well as a number of other boards. He is a Norwegian citizen.
Petteri Soininen, Board member
Petteri Soininen is Partner at RWC Partners and Co-Head of the RWC European Focus Fund. He has been responsible for the RWC European Focus Fund since February 2009 and oversees and manages all engagement activities with companies in the fund’s portfolio. He has served as member of the Supervisory Board of AMG Advanced Metallurgical Group N.V and worked as strategy consultant with The Boston Consulting Group (BCG) in both Europe and the US. He has 20 years of experience in collaborating with top management to design and implement change programs including major transformations to deliver sustainable shareholder value. Petteri holds a MSc (with distinction) in Industrial Engineering from the Helsinki University of Technology and is a Finnish citizen.
Johan Kr. Mikkelsen, Board member
Johan Kr. Mikkelsen is the Chief Technology Officer of Perestroika AS. Johan has 40 years’ experience from Norsk Hydro and Statoil. He entered the oil and gas industry
at the Mongstad refinery in 1974 as process engineer and a couple of years later as Production Manager at the refinery. In 1983 he moved on as Production Director for Oseberg field and in 1992 as SVP for Norsk Hydro drilling. In 2000 he continued as SVP for Oseberg asset and in 2003 as SVP for the Troll asset. In 2005 he became Country manager for Norsk Hydro Canada before he moved on as Peregrino Project Director and later Production Director for the Peregrino field in Brazil. In 2012 he returned to Norway as VP for the Equinor Subsea Improvement Project until early 2014 when he retired from Equinor. Johan Kr Mikkelsen holds a Master degree from NTH from 1973 in Industrial Chemistry and a Master degree in Chemical Engineering from University of Wisconsin, USA in 1979. Johan is a Norwegian citizen.

9
Mimi Berdal, Board member
Mimi Berdal runs an independent corporate counseling and investment business. She holds a Cand. Jur. (law) degree from the University of Oslo. Mimi Berdal is also Chairman of the Board of Gassco AS and a member of the Board of Directors of the listed companies Interoil E&P ASA, Itera ASA, Goodtech ASA and Vistin Pharma ASA. She is a Norwegian citizen.
Anne Øian, Board member
Anne Øian has extensive management experience, mainly from the banking industry, where she has worked with clients from the shipping and offshore industries, as well as experience from directorships in large international companies. She has held various positions in DNB from 1975 to 2015, including Global Head of Shipping. Anne Øian has served on the Board of Equinor, GIEK and the Norwegian School of Management (BI), as well as a number of other boards. Anne Øian holds a Master degree from the Norwegian School of Management and is a Norwegian citizen.
Adam Robinson, Board member
Adam Robinson received an MSc in Physics from NTNU in Norway after completing his BSc at Lancaster University in England. He worked six years offshore for EMGS as a Field Geophysicist, Instrument Engineer and Offshore Manager. For the last seven years he has been the Operations Manager for the EMEA region. Adam has been an EMGS employee since 2005 and is a British citizen.
Marte Karlsen, Board member
Marte Karlsen graduated from NTNU in 1999 and holds a Cand.Mag. in English and Political Science. She has experience from working in an international environment and with international trade, and she has lived in Germany for several years. For the last nine years Marte has been the Crewing Manager in EMGS and part of the acquisition management group. Marte has been an EMGS employee since 2010 and is a Norwegian citizen.

10
Board of Directors’ Report.
2018 was a challenging year for the oil services industry and EMGS. Since the start of the oil price decline in 2014, oil companies have substantially reduced their spending in conventional offshore hydrocarbon exploration and development activities, resulting in a decline in revenues for many suppliers in the industry, including EMGS. EMGS responded to the reduction in revenues by significantly reducing its cost base. This cost reduction programme started in 2015 and continued through 2018. The Company has reinforced its strong cost focus and culture, and reduced costs throughout the organisation, by an organisational re-adjustment, a significant reduction in head count, a reduction of the fleet size and a renewal of vessel charter agreements at improved terms. The Company expects to continue the cost reduction program throughout 2019. EMGS has experienced that the industry’s interest in using the EM technology is progressing, although challenged by reduced budgets and spending in the conventional offshore hydrocarbon exploration and development segment of the oil and gas industry. In 2019, i.e. after the end of the reporting period, the Company has been awarded two material acquisition contracts; the first being the contract for a USD 24 million proprietary data acquisition survey in south-east Asia, and the second being the letter of award for a two-year call-off acquisition contract with a minimum value of approx. USD 29.3 million and a maximum value of approx. USD 73.3 million. For further details on the two contracts, please refer to Note 34 – Events after the reporting period. These two contracts provide a sound basis for two-vessel operation for the Company in 2019. The Board considers this to be a material positive development for the Company, and that this can be seen as a first indication that the EM market has started to recover. However, the Board believes that such a recovery is likely to be characterized by volatility, as it must be assumed that many of the Company’s customers are likely to quickly adjust, curtail and / or delay EM investments in the event of any oil price reductions. Thus, the Board holds a cautiously optimistic view of 2019 and the EM market going forward and will continue to closely monitor and manage the Company’s liquidity.
About EMGS
Vision, Values and Strategy
Electromagnetic Geoservices ASA (“EMGS” or the “Company”), with its subsidiaries (together, the “Group”), is the global leader in electromagnetic (“EM”) surveying technology in the offshore oil and gas exploration industry. EMGS’ vision is to make EM an integral part of the E & P workflow and make EM as fully adopted as seismic. By providing EM data integrated with other subsurface measurement we enable our customers to reduce uncertainty and therefore increase success in their exploration and development programmes. EMGS’ core values are: Integrity, Commitment, Innovation and Quality. These values form an integral part of our

11
organisation and operations and are included as a topic in the Company’s annual employee appraisal process. EMGS is constantly working to deliver the best quality product to its customers. The technology is further developed to improve quality and efficiency, as well as to broaden the scope of the products to increase the Company’s addressable market. EMGS also put a high priority on interacting with its customers, to assist in ensuring the full value of the service is captured. The integration of EM methods into exploration workflows provides oil and gas companies with an improved de-risking and appraisal tool compared to using traditional exploration techniques alone. The use of EM data is complementary to the use of seismic data, as it provides oil companies with more information about the subsurface. Integrating the use of EM data into the exploration workflow reduces exploration risk through a better understanding of a reservoir’s charge, seal and volume estimates. EMGS remains a global leader in the planning, acquisition, processing, modelling, interpretation and integration of EM data. The Company has extensive experience, well-established proprietary routines and leading-edge processing, modelling and inversion software. EMGS has conducted over 900 surveys across the world’s mature and frontier basins in water depths ranging from 20 to 3 600 meters for more than 150 customers. EM surveys have been conducted under a wide variety of operating conditions and in most major basins around the world. EMGS’ strategy is that the Company shall have a flexible and scalable business model. This will be assured by maintaining an asset-light operating model, including chartering all its vessels from third-party vessel owning companies. The Group shall undertake a mix of proprietary contract work and multi-client projects. The International Oil Companies (IOCs) part of the Company’s market is becoming more focused on the multi-client business model. However, the Company’s key National Oil Company (NOCs) customers continue to solicit contract work arrangements as the preferred business model. The flexibility and scalability of the business model comes mainly from the following two arrangements: the chartering of vessels and the ability to undertake a combination of contract work and multi-client projects. EMGS has used its flexible business model to downscale its operations to reduce the Company’s cost base. In line with this strategy, EMGS reduced the fleet from four to two vessels in 2016. In January 2017, EMGS entered into an extended charter agreement of 2 years for the vessel BOA Thalassa at new and improved commercial terms; i.e. approximately 20% below the previous contract and additional flexibility (‘pay as you go’) during six months in 2017. EMGS had, as of 31 December 2018, two vessels on charter; the BOA Thalassa owned by the BOA Group (BOA SBL AS) and the Atlantic Guardian owned by the North Sea Shipping Group (North Sea Commander Shipping AS). EMGS’ strong focus on cost reductions and efficiency gains continues. Through these cost reductions, the various technology improvements – both on the hardware and the software side – and the efficiency gains, the product offered to the market by the Company remains the cutting edge of, and market leader within, EM technology, without material cost increases. Thus, the already attractive value-for-money of the product(s) offered to the market is improving year-over-year. The Company is investing in several R&D and development projects to further improve its offerings. One such initiative currently being considered is a mobile acquisition set (MAS) project, where the Company will use its proprietary acquisition hardware in a containerized set-up, thus allowing for the use of e.g. an ordinary PSV in acquisition work (to be chartered on-site for any given survey). This will further improve the Company’s ability to offer flexible and agile solutions tailored to the customer’s specific needs. EMGS coordinates its activities from its headquarters in Trondheim (Norway) and has offices in Oslo (Norway), Houston (USA) and Kuala Lumpur (Malaysia). The Group also has offices in Rio de Janeiro (Brazil), Mumbai (India) and Mexico City (Mexico). EMGS was listed on the Oslo Stock Exchange in March 2007. On 2 March 2018, the Board of Directors of EMGS called for an extraordinary general meeting (EGM) of the Company to propose a comprehensive refinancing plan (the Comprehensive Refinancing) to the shareholders. The Comprehensive Refinancing consisted of two elements; (i) a rights

12
issue (the Rights Issue) with gross proceeds of up to USD 12.5 million, whereof USD 10.0 million was underwritten; and (ii) issuance of a new, fully underwritten convertible bond loan (the Convertible Bond Issue) with a nominal amount of up to USD 32.5 million. The Comprehensive Refinancing was approved at the EGM held on 23 March 2018. The Rights Issue and the Convertible Bond Issue was completed with the registration of the 39,540,816 new shares and delivery of the convertible bonds on 16 May 2018. On 20 April 2018, the Company announced that it had called, in full, the Company’s existing bond, in accordance with the terms of the existing bond and the Company’s exercise notification, the existing bond was be repaid in full by the Company at 103% of par value (plus accrued interest) on 7 June 2018.
EM technology
The EM technology used by EMGS in its EM survey projects can be divided into two distinct methods: three-dimensional full azimuth controlled-source EM (3D CSEM) surveying and magnetotelluric (MT) surveying. For more information on the different methods, please see a separate section in the annual report, EMGS technology.
Important events in 2018 Technology and operational development
The Deep Blue EMGS has been working on a Joint Industry Project (“the Deep Blue”), supported by Shell and Equinor, for developing the Next Generation EM equipment. This project started in 2009, the agreement with Shell and Equinor was formalised in 2012 and in 2016 a prototype of the new equipment set was successfully tested offshore Norway. In 2017, EMGS took the Deep blue project to the next step and commercialised the source system. The Deep Blue source system is the most powerful deep-towed EM source in the industry. The Deep Blue source system consist of a top side unit, slip ring, umbilical, sub-sea unit and antenna. In addition, the onboard handling equipment was upgraded to meet the commercial requirements for marine operation. Following commercialisation of the Deep Blue, the first commercial survey was performed in July 2017. The Deep Blue has been used actively in Norway throughout 2018, especially for mature basin surveys in the North Sea and Norwegian Sea. The commercial offering is a stronger source output combined with increased flexibility for creating the waveform output. The Deep Blue increases the depth of investigation (below mudline) well beyond the capabilities of the conventional source systems. In addition, the new source also increases imaging confidence and resolution for targets that can already be detected with the conventional source system. The Deep Blue can operate in water depths up to 4,000 m. All data acquired with Deep Blue to date confirms the ability to increase sensitivity and resolution through combination of higher source output, increased frequency bandwidth and better accuracy, which allows to image deeper and smaller targets. As a result, Deep Blue increases the addressable market for frontier exploration as well as opens up new markets for EM such as near-field exploration and appraisal. The carrying value of the Deep Blue as of 31 December 2018 was USD 26.9 million, recorded as property, plant and equipment. EMGS has received prepayments from Shell and Equinor. These are recorded as contract liabilities under provisions and amounted to USD 19.3 million per 31 December 2018. Other equipment developments EMGS works on incremental improvements to the standard suite of 3D CSEM equipment, including receivers, the source and the navigation system, supporting a more efficient operation and improved data quality.
13
Software development The new generation 3D Gauss-Newton inversion and 3D TTI inversion have become the standard imaging products offered by EMGS. These products were first introduced in 2016 and have higher image quality and reliability compared to other 3D inversion products available on the geophysical market. Optimisation of our inversion software in terms of imaging capabilities and computational efficiency has been a continuous effort throughout 2018 in order to provide the best possible image quality without increasing project turnaround time. In addition, changes to the underlying software design were made to simplify usage of the software and improve user experience. These design improvements are important element of EMGS’ strategy to license EM software to its customers. In 2018, EMGS also introduced a cloud computing service to make EMGS’ modelling and imaging software accessible to customers that do not have an in-house processing centre. To develop the application of CSEM for reservoir characterisation further, EMGS implemented new software functionality for rock physics modelling and quantitative interpretation. This benefits appraisal projects, where customers seek to integrate CSEM results with petrophysical data to establish the hydrocarbon distribution in the field. This new functionality is now undergoing testing and will be released in early 2019.
Multi-client investments
Since 2008, EMGS has invested in its multi-client data library. The Company’s multi-client business has become an increasingly important part of the overall business, both in terms of revenues and in terms of marketing value as the Company can more freely share 3D CSEM successes with its existing and new customers. The multi-client business model is well suited for partnerships with seismic players and authorities and reduces the unit cost of EM data for the industry. In 2018, the revenues from multi-client sales amounted to 68% of the total revenues, down from 90% in 2017 and up from 51% in 2016. EMGS key multi-client libraries At the end of 2018, the Group’s most important multi-client libraries are in the following countries/basins: Norway, Mexico (GoM), the US Gulf of Mexico, Canada, Indonesia, India and Brazil. The total carrying value of the library was USD 12.6 million at the end of 2018. The major part of the carrying value of the multi-client library is related to the library in Norway. Norway The Group has acquired approximately 90,000 square kilometres of 3D CSEM data in Norway, of which approximately 70,000 square kilometres is in the Barents Sea. The Barents Sea has proven to be a very important showcase as EMGS has been able to successfully demonstrate its value in the de-risking process of exploration and appraisal projects. In 2018, the Company acquired data on five multi-client projects in Norway; three projects in the North Sea, one project in the Barents Sea, and one project in the Norwegian Sea. In 2018, multi-client revenues in Norway amounted to USD 16.2 million. US Gulf of Mexico EMGS completed its first commercial multi-client project in the US Gulf of Mexico in 2014. In total, EMGS acquired approximately 14,500 square kilometres of 3D CSEM data in this basin. Opening up the US Gulf of Mexico with 3D CSEM data is a natural extension of the Company’s 3D CSEM data and knowledge across the border on the Mexican side. Mexico In 2016, EMGS acquired the rights to license 16,000 square kilometres of 3D CSEM data to the industry from CNH, the regulator in Mexico. The data was originally acquired by the Company on a proprietary basis. After reprocessing the data, the data has been made available for sale to the industry and the Company recorded two sales of the Mexico data in 2018. Canada EMGS completed a multi-client project in Canada in 2014, including approximately 2,500 square kilometres of 3D CSEM data. The survey targeted the Flemish Pass Basin, where major oil discoveries have been made.

14
India During 2016, EMGS acquired a relatively small amount of multi-client data along the west coast of India. The Company has experienced interest to sell the data, but the project has so far not generated sales. Indonesia EMGS acquired multi-client 3D CSEM data in Indonesia in 2015. The total investment in Indonesia in 2015 resulted in adding about 2,300 square kilometres to the Company’s global library. In 2018, the Company completed two multi-client (2D and 3D) surveys in Indonesia. The surveys were both pre-funded. No late sales have been generated from this data. Brazil EMGS acquired 12,000 square kilometres of multi-client 3D CSEM data in Brazil between 2011 and 2013.
Sales and customers
The Group’s revenues reduced from USD 33.9 million in 2017 to USD 31.6 million in 2018, reflecting the challenging market for the oil services industry in general and 3D CSEM in particular. Sales were dominated by activity in Norway whereas the Group acquired data on multi-client surveys in Indonesia and commenced a proprietary contract in Suriname in 2018. The EMGS sales organisation consists of commercial sales, technical advisors and exploration advisors. The Company has presence in key markets to make sure the sales force is located as close as possible to its target markets. As part of the sales strategy, and in addition to the various hardware and software improvements pursued and marketed by the Company, the Company has invested in developing and marketing applicable workflows to complement traditional seismic based exploration workflows with CSEM. Prospect evaluation methodology using CSEM is commercialised in the EMU software.
Other important events
Financing On 2 March 2018, the Board of Directors of EMGS called for an extraordinary general meeting in the Company to propose a comprehensive refinancing plan (the Comprehensive Refinancing) to the shareholders. The Comprehensive Refinancing consisted of two elements; (i) a rights issue (the Rights Issue) with gross proceeds of up to USD 12.5 million, whereof USD 10.0 million was underwritten; and (ii) issuance of a new, fully underwritten convertible bond loan (the Convertible Bond Issue) with a nominal amount of up to USD 32.5 million.
The Comprehensive Refinancing was approved at the extraordinary general meeting (EGM) of the Company held on 23 March 2018. The Rights Issue and the Convertible Bond Issue was completed with the registration of the 39,540,816 new shares and delivery of the convertible bonds on 16 May 2018. On 20 April, the Company announced that it had called, in full, the Company’s existing bond, in accordance with the terms of the existing bond and the Company’s exercise notification, the existing bond was be repaid in full by the Company at 103% of par value (plus accrued interest) on 7 June 2018. Norwegian licensing rounds The Norwegian licensing system consists of two different kinds of licensing rounds; numbered licensing rounds for frontier areas and awards in predefined areas (APA) for more developed acreage. The numbered licensing rounds are normally announced every other year, while the APA round follows a fixed annual cycle. The licensing rounds in Norway represent important revenue opportunities. On 18 June 2018, the Norwegian Ministry of Petroleum and Energy (the "MPE") announced the awards of new production licenses in the 24th licensing round on the Norwegian continental shelf. Based on the offered awards, the Company has recorded net uplift revenues of approximately USD 6.7 million

15
from data-licensing agreements related to the its multi-client library in the second quarter of 2018.
Pre-funding for multi-client survey in the Norwegian North Sea EMGS secured pre-funding of multi-client 3D CSEM surveys in the North Sea during the summer season in 2018. The data was acquired in the second and third quarter of 2018 with total revenues of USD 3.4 million. Survey in South America On 11 November 2018, EMGS announced that the Company had received a purchase order with a value of approximately USD 8 million for a survey in South America for an undisclosed customer. The survey was executed by the vessel Atlantic Guardian and was completed in Q1 2019. CEO resignation and appointment of interim CEO On 28 September, EMGS announced that Christiaan Vermeijden had notified the Board of Directors of his resignation and his last employment date was 31 December 2018. On 15 October, the Company announced that Bjørn Petter Lindhom had been appointed as interim CEO. Mr Lindhom assumed the position on 1 December 2018.
Events after the balance sheet date
Multi-client sales to Equinor On 4 March, EMGS announced that EMGS and Equinor had entered into final contracts including data licensing sale of the Company’s existing multi-client library in the Barents Sea, Norwegian Sea and North Sea, as well as prefunding for a new multi-client acquisition in the North Sea. The combined gross contract value is approximately USD 8 million. Proprietary data acquisition survey in south-east Asia EMGS received a purchase order from an undisclosed customer for proprietary data acquisition survey in south-east Asia on 11 March 2019. The total value of the purchase order is approximately USD 24 million. The BOA Thalassa commenced the survey on 23 March 2019. Multi-year acquisition contract EMGS received a letter of award for a multi-year call-off acquisition contract, awarded by one of the world’s largest national oil companies. The letter of award has a minimum value of approximately USD 29.3 million, and a maximum value of approximately USD 73.3 million over a two year-period. Based on the current acquisition estimates, the Company expects that all or a substantial part of the minimum contract value will be recognised in 2019.
New guarantee facility EMGS has secured a second guarantee facility to supplement the Company’s existing USD 10 million guarantee facility. The new guarantee facility (the “New Facility”) has a maximum limit of USD 7.5 million and is limited in scope to providing certain performance and warranty guarantees required under the multi-year acquisition contract above. The New Facility is provided by the Company’s existing bank. The New Facility is fully guaranteed by the Company’s three largest shareholders (the “Shareholder Guarantors”). The shareholder guarantees will over time be replaced by a pledged deposit (the “Pledged Deposit”) to be built up by the Company, which will serve as security for the New Guarantee. A counter guarantee agreement entered into between EMGS and the Shareholder Guarantors regulates the Company’s obligations towards the Shareholder Guarantors in connection with the New facility. The Company will pay the Shareholder Guarantors a guarantee commission of 8% p.a. of the guaranteed amount. As the Pledged Deposit is built up, the guarantee commission will be reduced to 1.5% p.a. for such parts of the New Guarantee which are covered by the Pledged Deposit, and to 0% as the Shareholder Guarantors are released form their obligations towards the bank. A cash sweep mechanism has been agreed with the Shareholder Guarantors to ensure swift build-up of the Pledged Deposit. Under current estimates, the Company expects that the Pledged Deposit will reach the full USD 7.5 million during the course of the first quarter 2020.

16
Under certain change of control events, including a sale by a Shareholder Guarantor of its shares in the Company, EMGS will be obligated to, within 30 days, replace the relevant Shareholder Guarantor with a new guarantor (or otherwise ensure the release of such Shareholder Guarantor’s obligations towards the bank).
Factors affecting the results of operations The Group’s operational results depend on several factors, where the most important ones are considered to be: demand for EM services, fleet status and vessel utilisation and the charter terms of the Company’s vessels.
Demand for EM services
The Company has two main sources of revenue: proprietary contract sales and multi-client sales. In addition, the Company receives some revenue related to consultancy, processing services and software sales. These revenues are presented as contract sales. For more information on the different revenue sources, please see the notes to the financial statements. The overall demand for EMGS’ services is dependent, in part, on offshore oil and gas E&P budgets. The low oil price environment between mid-2014 and 2016 resulted in reduced E&P spending by oil companies, in particular spending related to conventional offshore hydrocarbon exploration activities. Given the two material acquisition contracts secured in 2019, the Board is cautiously optimistic that the EM market has started its recovery. However, such a recovery is likely to be slow and volatile, as it must be assumed that many of the Company’s customers are likely to quickly adjust, curtail and / or delay EM investments in the event of any oil price reductions. Thus, it must be assumed that 2019 will be another year with considerable uncertainty related to the exploration service provider industry in general, and for the Company’s services in particular.
Fleet status and utilisation
As per the end of 2018, the Company chartered two vessels, i.e. BOA Thalassa and Atlantic Guardian. The BOA Thalassa has a firm charter until 1 October 2019. Atlantic Guardian, has a firm charter agreement until 30 September 2021. Both agreements provide an option to the Company to extend the charter period. The vessels operated over the course of 2018 in Norway, Indonesia and South-America. In total, EMGS recorded a total of 23.7 vessel months in 2018, an average of 5.9 per quarter, compared with 18.0 vessel months in 2017 and an average of 4.5 per quarter in 2017. The Company had a vessel utilisation of 33% in 2018, down from 56% in 2017. EMGS’ ability to optimise the performance of its vessels through maximising commercial utilisation and minimising unpaid activities are key factors for the Group’s longer-term operating performance. Technical downtime, steaming time between surveys and unpaid standby time all negatively affect the Group’s operating results.
Seasonality
Adverse weather conditions can result in lost time when vessels are forced to relocate and reduce their activity. In addition, the Group’s operational results fluctuate from quarter to quarter because of oil and gas companies’ spending patterns and or as revenues are related to licensing rounds in Norway and abroad. Currency transaction exposure occurs to some extent during the ordinary course of business and when the relevant exchange rates alter between the date of a transaction and the date of the final payment for the transaction. The Group records such gains or losses in the financial income and expenses line item of its consolidated income statement.
Financial statements

17
Going concern
The Group has prepared its financial statements under the going concern assumption, and the Board confirms in accordance with Section 3-3a of the Norwegian Accounting Act that the going concern assumption is applicable. The Group’s reported results, its business strategy, its current budgets and financing, as well as its long-term strategic forecasts provide the basis for the going concern assumption. See also “Liquidity risk” below for more information about the going concern assumption. As of 31 December 2018, the carrying value of the Group’s equity was USD 3.3 million, down from USD 26.4 million at the end of 2017. The free cash balance at the end of 2018 was USD 6.5 million. The Company’s equity amounted to NOK 209 million as of 31 December, down from NOK 551 million at the end of 2017. Considering the risk and scope of the Company’s business and activities, confirmed backlog and the level of aggregate liabilities, the Board considers that the Company’s level of equity is adequate, cf section 3-4 of the public limited liability companies Act.
Results of operations
The year ending 31 December 2018 is compared in the section below with the year ending 31 December 2017. The Group prepares its accounts in accordance with International Financial Reporting Standards (“IFRS”), as adopted by the EU. Revenues and operating expenses In 2018, the Group recorded revenues of USD 31.6 million, down from USD 33.9 million in 2017. Contract sales and other revenue ended at USD 10 million, while multi-client sales totalled USD 21.6. million. USD 8.8 million was recorded as pre-funding multi-client revenues and USD 12.8 million was recorded as late sales multi-client revenues. In 2017, USD 3.5 million was recorded as contract sales, while multi-client sales totalled USD 30.4 million. This means that the sales from the multi-client projects accounted for 68% of the revenues in 2018, compared with 90% in 2017. The decrease in revenues from 2017 to 2018 can mainly be explained by a reduction in multi-client sales in
Norway.
With effect from 1 January 2018, the Group applied IFRS 15 Revenue from Contracts with Customers using the full retrospective method which requires a restatement of the previous financials. For contract sales and late sales, there are no effects following the implementation of IFRS 15. The multi-client prefunding revenues are recognised at the point in time when final data is delivered to the customer, and not based on the so-called Percentage of Completion (POC) principle, which was used prior to 1 January 2018. The effects are further described in Note 2. Charter hire, fuel and crew expenses ended at USD 18.8 million, an increase of 145% from the USD 7.7 million reported in 2017. The Group capitalised USD 6.2 million in multi-client expenses in 2018, compared to USD 9.6 million in multi-client and Deep Blue expenses during 2017. The charter hire, fuel and crew expenses have increased from USD 17.2 million in 2017 to USD 25.0 million when adding back the capitalised expenses. The main reason for the increased expenses is that BOA Thalassa was not on charter from 1 April to 1 October 2017. Employee expenses amounted to USD 17.5 million in 2018, up from the USD 17.0 million as reported in 2017 (see more details in Note 8). The number of employees increased from 123 at the beginning of 2018 to 125 at the end of 2018. Other operating expenses amounted to USD 5.9 million in 2018, compared with USD 6.3 million in 2017. A more detailed overview of the Group’s other operating expenses can be found in Note 9.

18
Depreciation and amortisation Depreciation and ordinary amortisation totalled USD 7.6 million in 2018, up from USD 6.8 million in 2017. The increase is due to depreciation of the Deep Blue source and other Deep Blue equipment that were capitalised at the end of 2017. Multi-client amortisation amounted to USD 10.9 million in 2018, compared to USD 10.3 million recorded in 2017. The Company uses straight-line amortisation for its completed multi-client projects, assigned over the useful life time of four years. The amortisation is then distributed evenly, independently of sales during the period. As a result of implementing IFRS 15, the Group started to capitalise multi-client projects with only one customer that were previously expensed as incurred (converted contracts). For these, the full amortisation of the book value is now recorded at the point in time when the revenues are recognised at delivery to the customer. In 2018, the Group recorded impairments of long-term assets of a total of USD 2.5 million, down from a total of USD 3.6 million in 2017. In 2018, EMGS impaired hardware under construction, while the impairment in 2017 mainly consisted of impairment of the multi-client library. Financial items and result for the year before and after taxes Interest expenses ended at USD 5.3 million in 2018, an increase from USD 4.1 million in 2017. EMGS recorded a loss on net foreign currency of USD 0.6 million in 2018 compared with a loss of USD 3.3 million in 2017. In 2018, net gain on financial liabilities consisted of the gain on a forward rate agreement of USD 0.6 million. Net financial items ended at negative USD 5.0 million in 2018, which is the same as the net financial items in 2017. For 2018, EMGS recorded a loss before income taxes of USD 36.7 million, compared with a loss before income taxes of USD 22.9 million in 2017. Income tax expenses of negative USD 0.1 million were recorded in 2018, compared with USD 0.4 million in 2017. These amounts relate to tax accruals in foreign jurisdictions. EMGS reported a net loss of USD 36.6 million for 2018, down from a net loss of USD 23.2 million for 2017.
Cash flow and balance sheet
Cash flow from operating, investing and financing activities For 2018, net cash flow from operating activities was negative USD 11.7 million, compared with positive USD 1.5 million in 2017. EMGS applied USD 7.8 million in investing activities in 2018. The investments consist of USD 1.6 million in property, plant and equipment and USD 6.2 million in multi-client investments. In 2017, cash applied in investing activities amounted to USD 12.1 million. The investments consisted of USD 3.8 million in property, plant and equipment and USD 8.3 million in multi-client investments. Cash flow from financial activities ended at positive USD 9.4 million in 2018. The cash flow from financial activities in 2018 includes proceeds from the rights issue of USD 11.7 million, USD 32.1 million in net proceeds from issuance of a convertible bond loan, repayment of bond loan and FRA of USD 31.9 million, and USD 2.3 million in interest payments. In 2017, cash flow from financial activities ended at positive USD 13.1 million as a result of proceeds from the rights issue of USD 17.4 million, USD 2.0 million in bond repayment and settlement of a part of the forward rate agreement and USD 2.1 million in interest payments. In summary, cash decreased by USD 10.0 million in 2018. At 31 December 2018, cash and cash equivalents totalled USD 6.5 million. Financial position EMGS total assets amounted to USD 74.8 million at 31 December 2018, down from USD 105.6 million at 31 December 2017, mainly explained by the reduction in the value of non-current assets and reduction of cash.

19
The carrying value of the Group’s multi-client library was USD 12.6 million at the end of 2018, a decrease of USD 4.7 million since the end of 2017. Total borrowings were USD 31.3 million at the end of 2018, up from 30.6 million at the end of 2017. Liquidity requirements and financing facilities The Group’s need for liquidity fluctuates from quarter to quarter depending on revenues, capital expenditures, vessels in operation and cash balance. The Company’s convertible bond loan contains a financial covenant requiring free cash and cash equivalents of at least USD 2.5 million. As of 31 December 2018, the free cash and cash equivalents totalled USD 6.5 million. EMGS’ management follows the Company’s liquidity risk closely, including weekly updates of the Group’s sales forecast and vessel schedule, in addition to a corresponding update of the cost and free cash forecast. As per 31 December 2018, EMGS has one listed convertible bond loan with a carrying value of USD 30.8 million and financial lease obligations of USD 0.5 million.
Research and development
To maintain its leading market position within the EM market, EMGS has invested significant time and resources in research and development (“R&D”). The industry in which it operates is highly technical and the requirements for the acquisition and processing of EM data evolve continuously. EMGS has agreements with various universities, research institutions and oil and gas companies regarding various aspects of R&D for hardware, software applications used in the processing, inversion and modelling of EM data. As of 31 December 2018, EMGS’ R&D staff included 17 scientists, engineers and programmers. As a result of the lower activity in the oil and gas sector, EMGS has reduced its investments in R&D. The research, development and software groups were reduced in size and some on-going research/feasibility work has been re-prioritised. The reduced activity related to R&D is likely to have limited revenue impact in the short term, as the Company is in a strong technological position. In 2018, EMGS incurred R&D related costs of USD 1.3 million, up from USD 0.8 million in 2017. Where possible, the Company seeks to offset internal R&D costs by industry funding and partnerships. In addition, the Group capitalised certain R&D expenses in accordance with IFRS. In 2018, the Group capitalised USD 0.6 million of its employee costs as development same amount as in 2017.
Allocation of Net Income
The Board of Directors proposes that the net income of EMGS, the parent company, shall be attributed to Other equity NOK (449.7 million) Net income/(loss) allocated NOK (449.7 million) Distributable equity as of 31 December 2018 was NOK 0.
Financial risk
The Group’s principal financial liabilities are trade and other payables, loans and borrowings and forward rate agreement. The Group has various financial assets such as trade receivables, cash and short-term deposit which arise directly from its operations. The Group is exposed to market risk, credit risk and liquidity risk. The Group’s management and Board review and agree policies for managing each of these risks which are summarised below. For further details see Note 3 to the financial statements.

20
Market risk Market risk is the risk that the fair value of future cash flows of a financial instrument will fluctuate because of changes in market prices. Market prices comprise two types of risk for the Group: interest rate risk and currency risk. Financial instruments affected by market risk include loans and borrowings and AFS investments. Please see sensitivity analysis in Note 3. i) Interest rate risk Interest rate risk is the risk that the fair value of future cash flows of a financial instrument will fluctuate because of changes in market interest rates. The Group has limited exposure to interest rate risk, as this is primarily only related to the Group’s long-term convertible bond loan of USD 32.5 million with floating interest rate (3 month LIBOR + 5.5%). ii) Foreign currency risk Foreign currency risk is the risk that the fair value of future cash flows of a financial instrument will fluctuate because of changes in foreign exchange rates. The Group operates internationally and therefore has exposure to foreign exchange risk arising from transactions executed in other currencies than the functional currency of each company. EMGS ASA has USD as functional currency, so the foreign currency risk is primarily with respect to NOK in EMGS ASA. For 2018, approximately 89% of the Group’s sales revenues were denominated in USD, whilst approximately 49% of the costs were denominated in USD. Foreign exchange risk arises from future commercial transactions, recognised as assets and liabilities. The Group’s exposure to foreign currency changes on equity and for all other currencies is not material. Liquidity risk Liquidity risk is the risk that the Company will not have sufficient liquidity to be able to meet its financial obligations. EMGS’ sources of liquidity include cash balances, cash flow from operations, borrowings, it’s existing and new bank facilities and further debt and equity issues. It is the Company’s objective to balance these sources of liquidity. Through comprehensive cost reduction measures, the Group has reduced the operational cost base from USD 143 million in 2015 down to USD 42 million in 2017. EMGS continued its cost focus in 2018 and recorded a cost base of USD 48 million in 2018. The Company’s convertible bond loan contains a financial covenant requiring free cash and cash equivalents of at least USD 2.5 million. As of 31 December 2018, the free cash and cash equivalents totalled USD 6.5 million. EMGS’ management follows the Company’s liquidity risk closely, including weekly updates of the Group’s sales forecast and vessel schedule, in addition to a corresponding update of the cost and free cash forecast. The Company’s improved backlog in 2019 has reduced the uncertainty related to the timing of revenues and the pressure on the Company’s cash position and consequently the Company’s ability to meet the cash covenant. The Company is operating with very limited headroom under the free cash covenant. Management considers the likelihood of a breach during the next twelve-month period to be low. However, should the Company experience a material, or a series of non-material, incidents with a negative impact on the Company’s cash position and / or timing of cash flow, the Company may nevertheless need to take additional actions to remain compliant with the free cash covenant. The financial liabilities with maturity less than one year will be settled through cash flow from operating activities in 2019. The Group has improved its backlog significantly in 2019, see Note 34 for description, which will have a positive effect on the cash flow from operating activities. Consequently, management considers the liquidity throughout 2019 sufficient to cover both the Group’s net current liabilities per 31 December 2018 and estimated cash-need in 2019. Credit risk Credit risk is the risk that a counterparty will not meet its obligations under a financial instrument or customer contract, leading to a financial loss. The Group is exposed to credit risk from its operating activities (primarily for trade receivables and cash and cash equivalents). See Note 20 for the aging analysis of trade receivables.

21
EMGS considers that it has no significant concentration of credit risk. Its clients are major international, national and independent oil and gas companies, mostly with good credit standings and histories. Occasionally, a smaller oil and gas company may be on the client list and, in these cases, caution is conducted in the credit evaluation. In 2018, EMGS did not experience any significant defaults in payments from customers. It is the Group’s policy that all customers who wish to trade on credit terms are subject to credit verification procedures. In addition, receivable balances are monitored on an ongoing basis. Three customers amounted to a significant part of the 2018 revenues. However, these customers were large national oil companies, and
considered creditworthy.
Corporate governance
EMGS is committed to healthy corporate governance practices. EMGS’ corporate governance principles are based on equal treatment of all shareholders, maintaining open and reliable lines of communication with shareholders and other stakeholders, having a Board that is autonomous and independent of the executive management and ensuring a clear division of responsibility between the Board and the executive management. The Company produces a comprehensive annual statement on corporate governance as part of its annual report. For further details, please see the section titled Corporate Governance in this annual report. The information is also available on the Company’s homepage.
CSR, working environment, discrimination and external environment
EMGS has adopted a policy and a standard for sustainability and corporate social responsibility (“CSR”). The principles in the policy cover the areas labour rights, anti-corruption, the environment and human rights. All work in the Group related to sustainability and CSR (together “the CSR work”) is based on the CSR policy and the standard. As the Company is a Norwegian public limited company listed on the Oslo Stock exchange, it complies with Section 3-3c of the Norwegian Accounting Act in respect of corporate social responsibility. The Company produces an annual statement on its CSR work, including information about the working environment in the Group, equal opportunities and discrimination statement, the external environment and human rights. For further details, please see the section entitled Sustainability and Corporate Social Responsibility in this annual report. The information is also available on the Company’s homepage.
Company outlook
The market outlook for oil services is challenging and characterised by high uncertainty. However, EMGS has noted an increase in commercial activity. In particular, the Company is experiencing increased interest and commercial and technical discussions to more and potentially substantial proprietary acquisitions outside of Norway. Sales efforts are ongoing to secure backlog in all regions. Based on the current operational forecast, EMGS expects to operate two vessels globally in 2019. EMGS also plans to continue to invest in its multi-client library in selected areas. Capital investment plans are limited to maintenance of existing equipment.
Oslo, 26 April 2019 Board of Directors and CEO of Electromagnetic Geoservices ASA Sign.

22
Responsibility Statement. Today the Board of Directors and the Chief Executive Officer reviewed and approved the Board of Directors’ Report and the consolidated and separated annual financial statements for Electromagnetic Geoservices ASA (“EMGS” or the “Company”) for the year ended 31 December 2018. EMGS’ consolidated financial statements have been prepared in accordance with IFRSs and IFRICs as adopted by the EU and additional disclosure requirements in the Norwegian Accounting Act. The separate financial statements for the Company have been prepared in accordance with Norwegian Accounting Act and Norwegian accounting standards. The Board of Directors’ report is in accordance with the requirements in the Norwegian Accounting Act and Norwegian accounting standard no 16.
To the best of our knowledge:
. The consolidated and separate annual financial statements for 2018 have been prepared in accordance
with applicable financial reporting standards. . The consolidated and separate annual financial statements give a true and fair view of the assets,
liabilities, financial position and profit/(loss) as a whole as of 31 December 2018 for the Group and the Company.
. The Board of Directors’ report for the Group and the Company includes a fair review of
- The development and performance of the business and the position of the Group and the Company.
- The principal risks and uncertainties the Group and the Company face.
Oslo, 26 April 2019 Board of Directors and CEO of Electromagnetic Geoservices ASA Sign.

23
Report on Corporate Governance. EMGS is committed to healthy corporate governance practices which strengthens and maintains confidence in the Company, thereby contributing to optimal long-term value creation for shareholders and other stakeholders. The objective of corporate governance is to regulate the division of roles between shareholders, the Board and executive management more comprehensively than is required by legislation.
EMGS’ principles for corporate governance are based on the following elements:
• All shareholders are treated equally
• EMGS will provide open, reliable and relevant communication to shareholders, governmental bodies and the public about the Company’s activities and its corporate governance commitment
• EMGS’ Board is fully independent from the Company’s executive management
• The EMGS’ Board has a majority of members who are independent of shareholders
• EMGS pays particular attention to ensuring that there are no conflicts of interest between the interests of its shareholders, the members of its Board and its executive management
• EMGS will ensure a clear division of responsibility between the Board and the executive management
1. Implementation and reporting on corporate governance Implementation and reporting The board of directors (the “Board”) of Electromagnetic Geoservices ASA (the “Company” or “EMGS”) is committed to maintaining a high standard of corporate governance, in line with both Norwegian and international best practice standards. In addition to having a continuous focus on corporate governance, the Board and the executive management of the Company carries out, on an annual basis, a comprehensive review and evaluation of its principles for corporate governance and the implementation of these. This report (the “Report”) summarises the Company’s corporate governance work and compliance with applicable requirements and fulfils the Company’s reporting obligations under applicable law and other legal frameworks. EMGS is a Norwegian-registered public limited liability company, with its shares listed on the Oslo Stock Exchange (Oslo Børs). The Norwegian Accounting Act Section 3-3b, which the Company is subject to, sets out certain corporate governance related information which is to be disclosed and reported on through the issuance of an annual reporting document. This Report meets the requirements provided by the Accounting Act. The Accounting Act is available on www.lovdata.no. Furthermore, the Continuing Obligations of Stock Exchange Listed Companies (the “OSE Continuing Obligations”) issued by the Oslo Stock Exchange requires listed companies to publish an annual statement of their practice related to their policy on corporate governance. In addition to setting out certain minimum requirements for such reporting (equivalent to those under the Accounting Act), the OSE Continuing Obligations requires that the Company reports on its compliance with the recommendations of the Norwegian Code of Practice for Corporate Governance (the “Code”) published by the Norwegian Corporate Governance Board. Both the OSE Continuing Obligations and the Code requires that an explanation is provided where a company has chosen an alternative approach to specific recommendations in the Code (i.e. a “comply or explain” basis). EMGS complies with the current Code, issued on 17 October 2018. The Company provides a report on its

24
principles for corporate governance in its annual report and on its website, www.emgs.com. EMGS’ objective is to comply with all sections of the Code, but the Company may deviate from principles in the Code if required for special purposes. The OSE continuing Obligations are available on www.oslobors.no, and the Code is available on www.nues.no. This Report sets out how the Code is accommodated through the financial year 2018.
Values and guidelines for business ethics and corporate social responsibility EMGS has a set of clearly defined core values: Integrity, Commitment, Innovation and Quality. The values are operationalised in EMGS’ daily operations and management, including in our approach to corporate governance. The Board recognises that confidence in EMGS as a company and in its business, activities is essential for the Company’s continuing competitiveness. Therefore, EMGS is committed to transparency and openness about its management systems and procedures. This strengthens value creation, builds internal and external confidence and promotes an ethical and sustainable approach to business. The Board has, in close cooperation with the Company’s executive management, established a comprehensive framework of guidance documents. The core element and top-tier in this framework is the Company’s policy documents, which includes amongst other the Company’s ethics policy, the corporate social responsibility policy (see also separate report in the annual report) and the health, safety and environment policy. Other core guidance documents include the Company’s Code of Conduct Standard and the EMGS Sustainability and Corporate Social Responsibility Standard. These policies and standards are evaluated and updated on a regular basis. The Company has adopted a program for corporate social responsibility, including an anti-corruption compliance programme incorporating mandatory training of all employees. EMGS’ website provides more information about the Company’s business activities, policies and standards.
2. Business EMGS is the market leader in controlled source electromagnetic (CSEM) imaging. Pursuant to Section 3 of the Company’s Articles of Association, the Company’s purpose is as follows: “The Company's activity is to engage, by itself or through proprietary interests in other companies, in the prospecting for hydrocarbon deposits in connection with the exploration, development and production of hydrocarbons.” The Company has clear objectives and strategies for its business within the scope of the definition of the business purpose in its Articles of Association. The Board of Directors’ report in the Company’s annual report includes a description of the Company’s objectives and principal strategies according to the business activities clause from the Articles of Association. The Articles are available at the Company’s homepage, www.emgs.com.
3. Equity and dividends Equity As of 31 December 2018, the EMGS Group had a combined equity of USD 3.3 million, representing an equity ratio of 4.5%. The Board’s assessment of the Company’s equity position and a description of certain initiatives by the Board in this connection is set out in the Board of Director’s Report.

25
Dividends The Company has at present no intention to pay dividends. The Board will establish a dividend policy when relevant. The Company’s objective is to generate a long-term return for its shareholders through dividends and increases in the share price that is, at least, in line with the return available on similar investment opportunities of comparable risk.
Authorisations to increase share capital and to acquire own shares At the Annual General Meeting (AGM) held in 2018, the Board was authorised to increase the share capital of the Company by up to NOK 13,096,969 (being 10% of the registered share capital of the Company) through one or more share issues. Further details are set out in the resolution by the AGM that states, among others, that the authorisation may be utilised in connection with potential transaction / M&A activity, and/or to finance general corporate purposes. The Board was also given an authorisation to increase the share capital by up to NOK 9,822,726 to be utilised for fulfilling the Company’s obligations towards holders of options, should such options be exercised. All options are based on the Employee Option Programme. The two authorisations are valid until the next AGM of the Company, but in no event beyond 30 June 2019. As of 31 December 2018, the Board had not used these authorisations.
Share capital increase in connection with 2018 rights issue At an EGM of the Company held on 23 March 2018, it was resolved to issue up to 70,833,333 new shares in a rights issue. The subscription price in the rights issue was determined by an independent board (not including board members with ties to major shareholders). Through the rights issue, a total of 39,540,816 new shares, each at a subscription price of NOK 2.45, were issued. Following completion of the rights issue, the Company’s registered share capital is NOK 130,969,690 divided into 130,969,690 each having a par value of NOK 1.
4. Equal treatment of shareholders and transactions with close associates Equal treatment Equal treatment of shareholders is an important principle for corporate governance in EMGS. The Company has one class of shares, and any purchases or sales of own shares are carried out over the stock exchange. The Articles of Association do not impose any restrictions on voting rights. All shares have equal rights. Pursuant to the Norwegian Public Limited Liability Companies Act, existing shareholders have pre-emption rights in connection with share capital increases and issuance of financial instruments which grants the holder a right to have new shares issued. However, this right can be waived from time-to-time by a qualified majority of the shareholders. When proposing to the shareholders to resolve such a waiver, the Board shall explain the rationale for such a waiver. Where a share capital increase is resolved by the Board in accordance with an authorisation by the general meeting of the Company, the pre-emption right may only be set aside where this has been pre-approved by the shareholders as part of the issuance of the authorisation. Where the Board resolves to carry out an increase in the share capital and waive the pre-emption rights of the existing shareholders on the basis of such an authorisation granted to the Board, an explanation will normally be publicly disclosed in a stock exchange announcement issued in connection with the increase of the capital.

26
The Board of EMGS will waive the pre-emption of existing shareholders in connection with share capital increases following the Company’s obligations towards holders of options if and when such options are exercised.
Transactions with close associates In the event of any material transaction between the Company and its shareholders, a shareholder’s parent Company, members of the Board, members of the executive personnel or close associates of any such parties, the Board will, as a general rule, arrange for a valuation by an independent third party. EMGS has implemented procedures for the Board, the board committees and the executive personnel to ensure that any conflicts of interest connected to agreements entered into by the Company are reported to the full Board.
5. Freely negotiable shares The shares in EMGS are freely negotiable and the Articles of Association do not contain any restrictions on negotiability. EMGS is listed on the Oslo Stock Exchange, and the Company works actively to attract the interest of new shareholders.
6. General meetings General Meetings General Meetings are the Company’s ultimate corporate body. EMGS encourages all shareholders to participate in general meetings. The Board endeavours to organise the general meetings to ensure that as many shareholders as possible may exercise their rights by participating, and that such meetings are an effective forum for the views of shareholders and the Board.
Preparation for the Annual General Meeting (AGM) The AGM is normally held in June each year, and in any case no later than 30 June, which is the latest date permitted under applicable law. The 2018 AGM was held on 8 June 2018. The 2019 AGM is scheduled to be held on 13 June 2019. The notices calling the general meetings are made available on the Company’s website and sent to shareholders in the form requested in their VPS account, in each event no later than three weeks prior to the meeting. According to article 8 of the Company’s registered Articles of Association and provided that the shareholders may participate in general meetings electronically, ref. article 9 in the articles, the AGM may, with the majority required to amend the Articles of Association and with effect until the next AGM, decide that the notices calling Extraordinary General Meetings shall be sent no later than two weeks before the date of the meeting. This alternative was not used in 2018. Shareholders who wish to take part in a general meeting must give notice to the Company by the date stated in the notice of meeting, which date must be at least two business days before the general meeting. Each share carries one vote in the Company's general meetings. Article 10 of the Articles of Association stipulates that the supporting documents dealing with matters to be considered by the AGM can be made available on the Company’s website rather than being sent to shareholders directly. However, shareholders are still entitled to receive the documents by post upon request.

27
The calling notice to the general meeting along with a form for appointing a proxy and sufficiently detailed supporting information, including proposals for resolutions and comments on matters where no resolution is proposed, are disclosed on the Company’s website. Resolutions and supporting information are sufficiently detailed and comprehensive to enable shareholders to form a view on matters on the agenda to be considered in the meeting. The Company will make appropriate arrangements for the general meeting to vote separately on each candidate nominated for the Company’s corporate bodies. As a routine, the financial calendar for the coming year is published no later than 31 December as a stock exchange announcement, and it is also made available on the Company’s website.
Participation in general meetings Shareholders who do not attend the general meeting may be represented and exercise their voting rights by way of a proxy. A person will be nominated to be available to vote as a proxy on behalf of shareholders. Proxy forms will enable the proxy holder to cast votes for each item on the agenda separately. The final deadline for shareholders to give notice of their intention to attend the meeting or to vote by proxy will be set in the notice for the meeting. According to article 9 of the Articles of Association, the Board may decide that the shareholders can participate in the general meeting by mean of an electronic aid, including that they may exercise their rights as shareholders electronically. The Chairman of the Board, the CEO, the CFO and the auditor will be present at the AGM. Other board members will, if possible, attend the general meetings.
Agenda and conduct of the AGM The Board decides the agenda for the AGM. The main agenda items are determined by the requirements of the Public Limited Liability Companies Act. The Code stipulates that the Board should have arrangements to ensure an independent Chairman for the general meetings. The Company has evaluated the recommendation but decided that it was in the interest of the Company and the shareholders that the general meeting held in 2018 was chaired by the Chairman of the Board. The AGM minutes are published by the issuance of a stock exchange announcement and are also made available on the Company’s homepage.
7. Nomination committee EMGS has a nomination committee elected by the AGM. According to article 11 in the Company’s Articles of Association, the committee shall consist of 2 to 3 members who shall be elected by the AGM for a period of 2 years, unless the AGM decides a shorter period. As per 31 December 2018, the nomination committee consists of 2 members;
- Kristian Siem (Chairperson) - Frederik W. Mohn
The Nomination Committee has refrained from accepting a fee for their work on the Nomination committee. The nomination committee proposes candidates for election to the Board and for the remuneration of the members of the Board. Also, the committee proposes candidates for election to the nomination committee and suggest changes to the mandate or guidelines for the nomination committee. EMGS’ nomination committee is in contact with shareholders, the Board and the Company’s executive management when searching for candidates for election to the Board.

28
The recommendation to the AGM relating to the election should be available in time to be sent with the notice calling the meeting, so that the shareholders have the opportunity to submit their views on the recommendation to the nomination committee ahead of the meeting. Further details are set out in article 11 of the Articles of Association and in the guidelines for the nomination committee, which were approved by the AGM in 2012.
8. Board: composition and independence The composition of the Board
EMGS does not have a corporate assembly. According to article 5 in the Company’s Articles of Association, the Board shall consist of 5–11 board members. At the end of 2018, EMGS’ Board consisted of seven directors, including two directors elected by and among the employees of the Company. Three of the directors are female and four are male. The shareholder-elected members represent varied and broad experience from relevant industries and areas of speciality, and the members bring experiences from both Norwegian and international companies. Any proposal for the election of shareholder-elected board members are made with a view to ensure that the Board can attend to the shareholders’ common interest and the Company’s need for competence, capacity and diversity. Also, the Board should function well as a collegial body. The Chairman of the Board is elected by the general meeting. As of 31 December 2018, the Board consisted of the following directors:
• Eystein Eriksrud, Chairman
• Petteri Soininen
• Johan Kr. Mikkelsen
• Mimi Berdal (independent)
• Anne Øian (independent)
• Adam Robinson, employee elected
• Marte Karlsen, employee elected
• Ragnhild Gaupen Gåsø, alternate employee elected
• Ellen Trolid, alternate employee elected
• Magne Andersen Drage, alternate employee elected
• Joseph Fletcher, alternate employee elected
Board members are elected for a period of two years.
Independence of the Board
The Board does not include any members from the Company’s executive management. Two of the five shareholder-elected board members are independent of the Company’s substantial business associations and major shareholders. The three members that are not considered independent are related to the Company’s largest shareholders.
9. The work of the Board The Board’s duties and responsibilities
The Board has the ultimate responsibility for the management of the Company and for supervising its day-to-day management and activities in general. This includes developing the Company’s strategy and monitoring its implementation. In addition, the Board exercises supervision responsibilities to ensure that the Company manages its business and assets and carries out risk management in a prudent and satisfactory manner. The Board is responsible for the appointment of the CEO. The Board has an annual plan for its work.

29
Mandate for the Board
In accordance with the provisions of Norwegian company law, the terms of reference for the Board are set out in a formal mandate that includes specific rules and guidelines on the work of the Board and decision making. The Chairman of the Board is responsible for ensuring that the work of the Board is carried out in an effective and proper manner in accordance with legislation.
Mandate for the CEO
The Board issues a mandate for the work of the CEO. There is a clear division of responsibilities between the Board and the CEO. The CEO is responsible for the operational management of the Company.
Financial reporting The Board receives periodic reports on the Company’s commercial and financial status. The Company follows the timetable laid down by the Oslo Stock Exchange for the publication of interim and annual reports.
Board meetings
The Board holds regular meetings and a strategy meeting each year. Extraordinary Board meetings are held as and when required, to consider matters that cannot wait until the next regular meeting. In addition, the Board has appointed three sub-committees composed of board members to work on matters in these areas. The Board has established and stipulated instructions for these committees.
Audit committee
The audit committee is appointed by the Board. Its main responsibilities are to supervise the Company’s systems for internal control, to ensure that the auditor is independent and that the interim and annual accounts give a fair and true representation of the Company’s financial results and financial condition in accordance with generally accepted accounting principles. The audit committee has reviewed the procedures for risk management and financial controls for the major areas of the Company’s business activities. The audit committee receives reports on the work of the external auditor and the results of the audit. Also, the audit committee meets regularly with the auditor where no member of the executive management is present. As per 31 December 2018, the audit committee consisted of the following:
• Anne Øian, Chairman
• Eystein Eriksrud
Compensation committee
The compensation committee makes proposals to the Board on the employment terms, as well as conditions and total remuneration of the CEO and other executive personnel. As per 31 December 2018, the compensation committee consisted of the following:
• Eystein Eriksrud, Chairman
• Petteri Soininen
• Johan Kr. Mikkelsen
• Mimi Berdal

30
Strategy Committee
A strategy committee was established by the Board on 11 February 2015. The committee shall contribute to the Company’s strategy development. The committee consists of the following:
• Petteri Soininen, Chairman
• Eystein Eriksrud
• Johan Kr. Mikkelsen
Annual evaluation
The Board’s working methods and interactions are subject to annual revision.
10. Risk management and internal control The Board ensures that the Company has sound risk management and an internal control system that is appropriate to its activities. The risk management and internal control systems in EMGS are based on its corporate values, ethics guidelines and principles for sustainability and corporate social responsibility (“CSR”). The Board reviews the Company’s internal control system and the main areas of risk annually. EMGS’ management conducts day-to-day follow-up of financial management and reporting. Management reports to the audit committee that conducts a review of the quarterly and annual reports before publication. The audit committee assess the integrity of EMGS’ accounts. It also inquiries into, on behalf of the Board, assess issues related to financial review and internal control, and the external audit of EMGS’ accounts. The Board ensures that EMGS is capable of producing reliable annual reports and that the external auditor’s recommendations are given thorough consideration. A description of the Company’s financial risk management objectives and policies are included in Note 3 to the financial accounts.
11. Remuneration for the Board The AGM decides the remuneration paid to members of the Board annually. The nomination committee prepare proposals for the AGM regarding remuneration for Board members. The remuneration of the Board reflects the Board’s responsibility, expertise and time commitment, and the complexity of the Company’s activities. The Code recommends that remuneration of the Board should not be linked to the Company’s performance and, further, that the Company should not grant options to members of its Board. The employee elected Board members hold options, but these have been granted to them as employees of the Company, not as board members. None of the shareholder elected board members are engaged by the Company in any other role (e.g. as consultant) than that as board members. Details on the remuneration to the Board can be found in notes to the financial statements of the Company. The employee elected board members do not receive any compensation for their services as board members.
12. Remuneration of the executive personnel The Board determines salary and other remuneration systems for key management personnel pursuant to the provisions of the Norwegian Public Limited Liability Companies Act. The CEO’s employment conditions and remuneration are determined by the Board and are presented to the AGM. The Board annually evaluates salary and other remuneration for the CEO. Details on the remuneration to the Company’s executive personnel are included in notes to the financial statements of the Company.

31
The guidelines of the remuneration system for the executive personnel is determined by the Board and is presented to the general meeting through a declaration on principles for management remuneration, which is required by law. This declaration is also included in the Company’s annual report. Performance-related remuneration of the executive personnel is linked to value creation for shareholders or the Company’s performance over time. The performance-related remuneration to the executive personnel is subject to an absolute limit.
The Board believes that the salary levels of executive personnel should be competitive.
13. Information and communications EMGS maintains regular dialogue with analysts and investors. The Company considers it very important to inform shareholders and investors about the Company’s commercial and financial performance. The Company strives to continuously publish all relevant information to the market in a timely, effective and non-discriminatory manner. All stock exchange announcements are made available both on the Company’s website and on the Oslo Stock Exchange news website at www.newsweb.no, and are also distributed to news agencies (via Hugin).
Financial reports EMGS publishes its provisional annual accounts as soon as possible after the end of each financial year. The complete annual report and accounts are made available to shareholders no later than three weeks prior to the AGM and no later than by the end of April, as required by the Securities Trading Act (section 5-5 (1)). Quarterly reports are normally published within six weeks following the end of the quarter, except for the report for the second quarter which is normally published around seven weeks following the end of the quarter. The Company’s financial calendar for the coming year is published no later than 31 December in accordance with the rules of the Oslo Stock Exchange. The financial calendar is available on the Company’s website and on the Oslo Stock Exchange website. EMGS holds open web-based presentations in connection with the publication of its interim results. These presentations review the published results, market conditions and the Company’s future prospects. The presentations are given by the CEO and/or the CFO and are distributed by webcast so that anyone can follow the presentation on the internet in real time or view it later. Quarterly reports, presentation material and webcasts are all available on the Company’s website. Following the publication of the interim results, the CEO or the CFO meet with shareholders and potential investors.
Other market information In addition to the dialogue between the shareholders in the general meeting, the Board aspires to maintain contact with shareholders throughout the year. If possibly in relation to the quarterly presentations and the participation in seminars mainly aimed at investors. This contact is coordinated between the Chairman of the Board, the CEO and/or the CFO. The Company has a policy identifying the positions entitled to speak on behalf of the Company on various subjects who should communicate with the media, investors and investment bankers.

32
14. Takeovers The Board endorses the recommendation of the Code for corporate governance on takeover bids. EMGS’ Articles of Association do not contain any restrictions, limitations or defence mechanisms on acquiring the Company’s shares. In accordance with the Securities Trading Act and the Code, the Board has adopted guidelines for possible takeovers.
In the event of a takeover bid, the Board will, in accordance with its overall responsibility for corporate governance, act for the benefit of all Company shareholders. The Board will not seek to hinder or obstruct takeover bids for EMGS’ activities or shares, unless the interests of the Company’s shareholders warrants so. If an offer is made for EMGS’ shares, the Board will normally both make a recommendation on whether the shareholders should accept the offer and arrange a valuation from an independent expert.
15. Auditor The external auditor presents an annual plan to the audit committee covering the main features for carrying out the audit. The external auditor participates in all meetings of the audit committee, the Board meeting that approves the annual financial statements and other meetings on request. The external auditor presents the result of the audit to the audit committee and the Board in the meeting dealing with the annual financial statements, including presenting any material changes in the Company’s accounting principles and significant accounting estimates, and reporting any material matters on which there has been disagreement between the external auditor and EMGS’ executive management. The external auditor annually presents internal control weaknesses and improvement opportunities to the audit committee and, when appropriate, to the Board. The Board holds a meeting with the auditor at least once a year where no member of the executive management is present. The Board has adopted instructions as to the executive personnel’s access to the use of the external auditor for services other than auditing. The external auditor provides an overview of his remuneration divided into fee paid for audit work and any fees paid for other specific assignments, which are presented at the annual general meeting. This is also included in the annual report. The external auditor has given the Board a written notification confirming that the requirements for independence are satisfied. Oslo, 26 April 2019 Board of Directors and CEO of Electromagnetic Geoservices ASA Sign.

33
Report on Sustainability and Corporate Social Responsibility. Introduction
This report from the Board of Directors (the “Board”) of Electromagnetic Geoservices ASA (“EMGS” or “the Company”) describes EMGS’ principles, efforts, measures and results related to sustainability and corporate social responsibility (“CSR”) in the year of 2018. The report is based on the principles in EMGS’ policy for sustainability and corporate social responsibility and the EMGS sustainability and corporate social responsibility standard (together, the “CSR Policy Documents”). These principles cover the areas labour rights, anti-corruption, the environment and human rights. The CSR Policy Documents applies to both national and international operations. It is the intention of EMGS that the Company’s efforts within (i) working environment issues, including safety measures, (ii) anti-corruption procedures and training, and (iii) the culture encouraged from our employees through the CSR Policy Documents shall contribute to improved understanding for human rights, working ethics, work environment, health, safety and environmental impact. The work related to sustainability and CSR (together “the CSR work”) in EMGS is based on the core values of the Company:
• Integrity in all our relationships
We earn trust through demonstrating integrity. We dare to challenge, and we are honest. Our honesty benefits all our relationships.
• Commitment to value creation
We are strong believers in the value our technology creates for both customers and shareholders. We go the extra mile.
• Innovation in products and services
We set the stage for the future of the industry. We are passionate about developing what our customers need.
• Quality in every step
We care about our people, our customers and our deliveries. We don’t compromise on safety or on quality. This report covers CSR work related to EMGS with its subsidiaries (together, the “Group”) in 2018.
The report is primarily based on feedback from management in the Group, the EMGS Ethics Committee, and various other internal committees, reporting systems and reports. Throughout 2018, CSR issues were discussed in management meetings and by the Board. This report includes an introduction to the abovementioned principles, the EMGS commitment, implementation and actions as well as the measures and outcome specific for 2018. The CSR policy is available on the Company’s homepage www.emgs.com.

34
Statement on CSR work 2018
All work in the Group related to CSR is based on the CSR Policy Documents. Below is an overview of the principles, as well as a description of how the Company reports issues relates to CSR, and measures taken under each of the main CSR principles.
Quality, Health, Security, Safety and Environment
In 2018, the general objectives for Quality, Health, Security, Safety and Environment (QHSSE) were met. As is natural given the nature of QHSSE work, requiring continuous development and improvement, areas of improvement were identified during the course of 2018. The Company is continuing a positive QHSSE trend from previous years, and the five-year trailing statistics are in line with its peers.
EMGS complies with the highest standards from IOGP, the International Association of Oil and Gas Producers, as well as with specific QHSSE requirements from customers and authorities.
QHSSE performances are reviewed on a regular basis with the Board and management team.
Labour rights
EMGS adheres to the following principles for labour rights:
• Freedom of association and right to collective bargaining;
• No forced and compulsory labour;
• No child labour; and
• No discrimination The working environment and the employees As of 31 December 2018, the EMGS Group had 125 employees, of which 45 work in Trondheim, Norway, 6 at its regional office in Houston, USA, 8 at the regional office in Kuala Lumpur, Malaysia, 17 at the regional office in Oslo, Norway. In addition, 39 employees work offshore and the remaining 10 work in other locations. The Company has initiated a number of activities to measure and track employee satisfaction and the work environment throughout the Group. As part of such activities, the Company has implemented real-time monitoring of employee engagement with monthly feedback from the employees. As many employees are involved in offshore operations, a dedicated HSE training program has been implemented to ensure the safest possible working environment. The percentage of absences due to illness in 2018 was 2.03%, a decrease from 3.7% reported in 2017. The Company experienced no lost time injury event in 2018. Equal opportunities and discrimination statement EMGS’ 125 employees represent more than 22 different nationalities with different cultures. EMGS has defined and implemented guidelines to protect against gender discrimination. At the end of 2018, 20% of the Group’s 125 employees were female, which is the same male/female ration as that of 31 December 2017. The Group will continue to prioritise its goal of improving the current imbalance by actively following a recruiting strategy to this effect. EMGS recognises that the average compensation for its female employees is lower than the average workforce figure. This can be explained by a high degree of representation of males at management level and among the technical professionals. As per 31 December 2018, EMGS management team consisted of nine members, whereof two females. The executive management team consisted of four people, whereof three male and one female. The Discrimination Act’s objective is to promote gender equality, ensure equal opportunities and rights, and to

35
prevent discrimination due to ethnicity, national origin, descent, skin colour, language, religion and faith. The Group is actively and systematically working to encourage the Act’s purpose within its business. The activities include recruiting, remuneration, working conditions, promotion, development opportunities and protection against harassment. These are issues of importance for EMGS’ working environment, as the Group has employees from more than 24 nations with a multitude of languages, cultures, ethnicities, religions and faiths. The Group’s aim is to have a workplace with no discrimination due to reduced functional ability. Therefore, EMGS is actively working to design and implement the physical conditions of its workplaces so that as many people as possible can utilize the various functions. For employees or new applicants with reduced functional ability, individual arrangements are made concerning workplace and responsibilities. For offshore work, the Group has limited possibilities for offering work to employees with reduced functional ability. Committees work The Working Environment Committee shall participate in planning safety and environmental work and follow up developments on issues relating to the safety, health and welfare of the employees. The Working Environment Committee has quarterly meetings, in addition topic-based meetings and reports to the VP HR. The Forum for Employee Representatives meets with the CEO, the CFO, the VP HR and the Chief Legal Counsel. The forum is regulated by the Norwegian Working Environment Act. The goal for this forum is to facilitate cooperation between the employee representatives and management related to the working environment and the general terms and conditions of all employees and conflicts. The forum for Employee Representatives including representative of management met six times in 2018, in addition to several informal meetings.
Working environment measures EMGS management encourages and facilitates close dialogue between management and employees, and between the different departments within the Group. Some of the actions to facilitate dialogue are through management visits to vessels and office meetings. The regular offshore seminars have in part been replaced by management visit to the vessels, in an effort to contribute to the cost reduction efforts and focus. In 2018, management conducted a number of visits to the vessels in the Company’s fleet. The CEO and other members of the management team have visited all business units within the Group. Office inspections are carried out on a regular basis to capture potential working environment hazards. The Maritime Labour Convention, MLC 2006 was implemented in August 2013 and the Norwegian law implementing this convention, the Shipworker Act, was implemented on the same day. By the end of 2018, the MLC 2006 had been ratified by 90 countries. EMGS’ working environment and terms were already in line with the MLC 2006 and the Shipworker Act requirements before its implementation.
Anti-Corruption
Principle for anti-corruption:
• Businesses should work against corruption in all its forms, including extortion and bribery
Corruption undermines all sound business activities and free competition. EMGS has a zero-tolerance policy with respect to corruption in all its forms, including bribery in all of its forms. Adherence to this principle is a basic and fundamental requirement for all contractors and suppliers. The Group and all of its employees shall at all times adhere to all applicable legislation related to bribery and anti-corruption, and as a minimum always to the provisions of the FCPA, the UK Bribery Act and the Norwegian penal code. The Company has over the years given significant attention to the Company’s active pursuit to prevent corruption and bribery. EMGS has several policies and standards related to its anti-corruption compliance program, including but not limited to the Ethics Policy and Code of Conduct as well as an anti-corruption compliance training program. The

36
training is a combination of web based and more in depth training in meetings. The 2018 training was conducted by approximately 100% of the employees of the Group. The Group has established a whistle-blower procedure in line with best practice industry standards and all applicable regulations. EMGS encourages and supports employees who report dilemmas and incidents in relation to attempted and/or actual corruption, bribery and/or fraud to management (“whistle blowers”). The Company has not received any reports from employees related to anti-corruption during 2018. EMGS continues to have a high priority on the Company’s compliance work.
External environment
EMGS is of the opinion that a more systematic use of its EM data in offshore oil exploration will reduce the environmental footprint of oil exploration activities by among other things reducing the number of dry or non-commercial wells being drilled before finding and appraising hydrocarbon reservoirs. EMGS is committed to act responsibly and in full transparency to monitor and reduce its environmental impact and continually improve the overall environmental performance of its services. This is an integral and fundamental part of EMGS business strategy, operating methods and technology development implemented through EMGS’ QHSSE Policy, Environmental Standard and Environmental Management Plan. EMGS is tracking its environmental footprint on each survey and identifying and monitoring the main waste streams including hazardous waste. The technology EMGS uses supports the Company’s environmental ambitions. The anchors used to keep receivers in place are made from an eco-friendly compound which dissolves in the months after the receivers are released, thus the anchors do not harm the environment. This means that the anchors are reduced to disaggregated sand after a survey, leaving no discernible survey footprint and no hazard to subsea operations or fishing. Human Rights
Principles related to Human Rights:
• Support and respect the protection of human rights; and
• Make sure not to be complicit in human rights abuses. Human rights abuses shall not occur at EMGS. It is the intention of EMGS that the working environment effort, including safety measures, the anti-corruption procedures and training as well as the attitude encouraged from the Company’s employees shall contribute to improved understanding for human rights, working ethics and a cleaner environment in the areas of the world where the Group operates. The reputation of the Company is created by the collective conduct of each individual employee. The employees are obligated to study the EMGS policies, including but not limited to Ethics Policy and Code of Conduct and perform their duties accordingly.
On an operating level, EMGS seeks to ensure that there is a good working environment without discrimination of any kind in the Group. The managers handle all minor issues related to human rights. If/when there are issues of broader magnitude, HR, legal and the Ethics Committee are involved.
No claim regarding Human Rights has been reported to the HR, QHSE or Legal or in 2018. Oslo, 26 April 2019 Board of Directors and CEO of Electromagnetic Geoservices ASA Sign.

37
Determination of Salary Statement.
This declaration has been prepared by the Board of Directors of Electromagnetic Geoservices ASA (“EMGS” or the “Company”) in accordance with the Norwegian Public Limited Liability Companies Act section 6-16a. The declaration applies to the financial year 2018 and will be presented at the Annual General Meeting in EMGS in accordance with the Norwegian Public Limited Liability Companies Act section 5-6, subsection 3.
1. Main principles for determination of management remuneration The objective of the Company’s compensation policy applied to executive management (“Management”), is to attract and retain the best leadership capabilities to lead and develop the Company. The compensation is based both on a non-variable element (“Base Salary”) and variable elements such as bonus, stock options and variable special payments (“Variable Compensation”). The Base Salary shall be competitive to local market levels and is determined by the manager’s skills and level of responsibility in the organisation. The Base Salary is determined by using industry benchmarks with local relevance for similar roles. The Variable Compensation, such as bonuses, is applied using Company performance and individual performance. Long term incentives, such as stock option plan, is applied by assessing the criticality of the role to the Company, as an instrument to retain critical skills in the Company.
2. Salaries and remuneration
2.1 Base Salary The Management’s fixed annual salary is defined as the Base salary and is subject to an annual consideration.
2.2 Performance Bonus The Company has a performance bonus program linked to annual performance. The objective of the program is to compensate individuals based on the achievement of Company objectives as well as personal performance. The objectives of the Company are established by the Board of Directors. Management has a bonus potential up to 40% of Base Salary, and the rates are specified in the individual employment agreements. A Bonus program is established as a general program for all employees with a bonus potential of 10 – 40% of Annual Base Salary.
2.3 Share Option Program Management participates in the Company’s Stock Option Plan which is used to attract and retain key employees. The programme was established with the aim to provide a long-term incentive. For new grants, the minimum exercise price is set at fair market value at the date of grant. The vesting period is from 4 to 5 years. Grants to Management will be at the discretion of the Board.

38
In the Annual General Meeting held in June 2018, it was resolved to authorise the Board to issue a maximum of 9,822,726 options over 2 years under the option programme (not only Management), and that the maximum outstanding options shall not, at any time, exceed 7.5% of the registered number of shares in the Company. The total number of outstanding options as of 31 December 2018 is 77,500.
2.4 Pension plan
Management participates in the Company´s collective pension plan. The Company has defined contribution pension plans, and the plan applicable in Norway involves a contribution level of 5% of Base Salary from 0 G up to 7.1 G and 15% of Base Salary from 7.1 G up 12 G, where G is the base amount (Folketrygdens grunnbeløp) that equals NOK 96 883 as of 31 December 2018. The Company does not offer any top-up pension plan for Management.
2.5 Benefits in kind
Management may be given the benefits in kind that are common practice i.e. telephone expenses, laptop and free broadband connection and use.
2.6 Severance plan
In 2018, no members of Management, including the CEO, have any agreements to receive Base salary and benefits beyond the statutory notice period. The severance plan includes an anti-compete clause and is structured to ensure that members of the Management do not start working for a competitor shortly after leaving the Company. Agreements may be signed regarding severance pay for other members of general management to attend to the Company's needs at all times to ensure that the selection of managers is in commensuration with the Company's needs. Pursuant to the Working Environment Act, such agreements may not have a binding effect on general management other than the CEO.
3. Management salaries and remuneration in subsidiaries of EMGS
Companies within the EMGS group are to follow the main principles of the Company’s managerial salary policy as described in section 1. It is an ambition of the Company to globally coordinate the wage policy and the plans used for variable compensation throughout the EMGS Group.
4. Review of the executive management remuneration policy that has been carried out in the financial year 2018
The remuneration policies set out in the declaration on determination of salary and other compensation to the Management for 2018 were followed in all respects. No members of Management received a performance bonus, with the exception of a discretionary performance bonus paid out to the CEO and CFO, amounting to NOK 350.000 and NOK 180.000 respectively.
Oslo, 26 April 2019
Eystein Eriksrud for and on behalf of the Board of Directors of Electromagnetic Geoservices ASA Sign.
Financial statements. EMGS Group

40
Consolidated Income Statement.
1 January - 31 December
Amounts in USD 1 000 Note 2018 2017
Restated*
Operating revenues
Contract sales 6 7,176 2,583
Multi-client pre-funding 6, 16 8,804 11,295
Multi-client late sales 6, 16 12,781 19,132
Other revenue 6 2,789 886
Total revenues 31,550 33,896
Operating expenses
Charter hire, fuel and crew expenses 7 18,784 7,655
Employee expenses 8 17,505 16,964
Depreciation and ordinary amortisation 16, 17 7,595 6,779
Multi-client amortisation 16 10,914 10,345
Impairment of long-term assets 16, 17 2,544 3,626
Other operating expenses 9, 10 5,877 6,334
Total operating expenses 63,218 51,703
Operating profit/(loss) -31,668 -17,807
Financial income and expenses
Interest income 11 232 193
Interest expense 11 -5,251 -4,088
Net gains/(losses) of financial assets and liabilities 649 2,143
Net foreign currency income/(loss) 11 -612 -3,292
Net financial items -4,981 -5,043
Income/(loss) before income taxes -36,650 -22,850
Income tax expense 12 -50 356
Income/(loss) for the year -36,599 -23,206
Basic income/(loss) per share in USD -0.31 -0.39
Diluted income/(loss) per share (ESP) in USD -0.31 -0.39
*See changes in accounting policies under note 2.18

41
Consolidated Statement
of Other Comprehensive Income.
The items recorded in Other comprehensive income/(loss) do not have any tax effect in 2018 or 2017.
1 January - 31 December
Amounts in USD 1 000 Note 2018 2017
Restated*
Income/(loss) for the year -36,599 -23,206
Other comprehensive income to be reclassified to profit or loss
in subsequent periods (net of tax):
Exchange differences on translation of foreign operations 33 -8
Other comprehensive income/(loss) 33 -8
Total comprehensive income/(loss) for the year -36,566 -23,214
*See changes in accounting policies under note 2.18

42
Consolidated Statement
of Financial Position.
As of 31 December
Amounts in USD 1 000 Note 2018 2017As of
1 January 2017
Restated* Restated*
ASSETS
Non-current assets
Multi-client library 16 12,596 17,317 24,332
Other intangible assets 16 1,388 1,559 2,457
Property, plant and equipment 17 30,174 36,281 13,901
Assets under construction 17 852 3,112 28,255
Restricted cash 21 3,008 3,524 3,586
Total non-current assets 48,018 61,793 72,531
Current assets
Spare parts, fuel, anchors and batteries 19 7,225 7,200 7,854
Trade receivables 20 4,634 11,075 8,534
Other receivables 18 4,855 5,957 7,080
Cash and cash equivalents 21 6,487 16,548 14,038
Restricted cash 21 3,609 2,997 1,255
Total current assets 26,811 43,778 38,761
Total assets 74,829 105,571 111,292
EQUITY
Capital and reserves attributable to equity holders
Share capital, share premium and other paid-in equity 14 350,274 336,764 319,283
Other reserves -1,584 -1,617 -1,608
Retained earnings -345,360 -308,761 -285,554
Total equity 3,328 26,386 32,121
LIABILITIES
Non-current liabilities
Provisions 25 19,250 20,670 19,140
Financial liabilities 23 0 2,993 4,668
Borrowings 23,27 31,046 30,288 31,636
Total non-current liabilities 50,296 53,950 55,444
Current liabilities
Trade payables 24 6,819 6,882 6,672
Current tax liabilities 13 5,079 6,299 5,853
Other short term liabilities 26 9,003 11,763 10,951
Borrowings 23,27 303 290 251
Total current liabilities 21,204 25,234 23,727
Total liabilities 71,501 79,184 79,171
Total equity and liabilities 74,829 105,571 111,292
*See changes in accounting policies under note 2.18

43
Consolidated Statement
of Cash Flows.
1 January - 31 December
Amounts in USD 1 000 Note 2018 2017
Restated*
Net cash flow from operating activities
Income/(loss) before income taxes -36,650 -22,850
Adjustments for:
Withholding tax expenses 0 -359
Total taxes paid -1,170 449
Depreciation and ordinary amortisation 16, 17 7,595 6,779
Multi-client amortisation and impairment 16 10,914 10,345
Impairment of other long term assets 16, 17 2,544 3,626
Cost of share-based payment -167 55
Change in trade receivables 6,442 -2,541
Change in inventories -25 654
Change in trade payables -63 210
Change in other working capital -4,123 3,524
Financial gain on bond repayment 0 -836
Amortisation of interest 2,999 2,464
Net cash flow from operating activities -11,705 1,520
Investing activities:
Purchase of property, plant and equipment 17 -1,598 -3,827
Investment in multi-client library 16 -6,193 -8,282
Cash used in investing activities -7,791 -12,109
Financial activities:
Financial lease payments - principal -332 -228
Proceeds from new loan 32,103 8,500
Repayment/settlement of loan and FRA -31,880 -10,454
Proceeds from rights issue 14 11,736 17,426
Net proceed new lease agreement 107 0
Payment of interest on bonds -2,299 -2,145
Cash used in/provided by financial activities 9,435 13,099
Net change in cash -10,061 2,510
Cash balance beginning of period 16,548 14,038
Cash balance end of period 6,487 16,548
Net change in cash -10,061 2,510
Interest paid -4,101 -3,602
Interest received 232 193
*See changes in accounting policies under note 2.18

44
Consolidated Statement
of Changes in Equity.
Oslo, 26 April 2019 Board of Directors and CEO of Electromagnetic Geoservices ASA Sign.
Amounts in USD 1 000 Note
Share capital, share
premium and other
paid-in-equity Other reserves Retained earnings Total equity
Balance as of 1 January 2017 (Restated*) 319,283 -1,608 -285,554 32,121
Income/(loss) for the year 0 0 -23,226 -23,226
Other comprehensive income 0 -8 0 -8
Total comprehensive income 0 -8 -23,226 -23,234
Proceeds from shares issued 14 17,426 0 0 17,426
Share-based payments 14 55 0 0 55
Balance as of 31 December 2017 (Restated*) 336,764 -1,617 -308,761 26,386
Income/(loss) for the year 0 0 -36,599 -36,599
Other comprehensive income 0 33 0 33
Total comprehensive income 0 33 -36,599 -36,566
Proceeds from shares issued 14 11,736 0 0 11,736
Share-based payments 14 -166 0 0 -166
Equity component of convertible loan 14 1,941 0 0 1,941
Balance as of 31 December 2018 350,274 -1,584 -345,360 3,328
*See changes in accounting policies under note 2.18

45
Notes.
Note 1 – Corporate information
Electromagnetic Geoservices ASA (EMGS/the Company) and its subsidiaries (together the Group) use EM, a patented electromagnetic survey method, to find hydrocarbons in offshore reservoirs. The Company’s services help oil and gas companies to improve their exploration success rates. The Group has subsidiaries in Norway, Australia, Brazil, USA, Mexico, Malaysia, Canada and the United Kingdom.
The Company is a public limited liability company incorporated and domiciled in Norway with shares and bonds that are publicly traded. The address of its registered office is Stiklestadveien 1, 7041 Trondheim.
These consolidated financial statements have been approved for issue by the Board of Directors and the Chief Executive Officer on 26 April 2019.
Note 2 – Summary of significant accounting policies
2. Summary of significant accounting policies The principal accounting policies applied in the preparation of these consolidated financial statements are set out below. These policies have been consistently applied to all the years presented, unless otherwise stated.
2.1 Basis of preparation The consolidated financial statements of the Group have been prepared in accordance with International Financial Reporting Standards (IFRS) as adopted by the European Union (EU). IFRS as adopted by the EU differ in certain respects from IFRS as issued by the International Accounting Standards Board (IASB). References to IFRS hereafter should be construed as references to IFRS as adopted by the EU. The preparation of financial statements in conformity with IFRS requires the use of certain critical accounting estimates. It also requires management to exercise its judgment in the process of applying the Company’s accounting policies. The areas involving a higher degree of judgment or complexity, or areas where assumptions and estimates are significant to the consolidated financial statements are disclosed in Note 4. The consolidated financial statements have been prepared on a historical cost basis. The consolidated financial statements are presented in US dollars and all values are rounded to the nearest thousand except when otherwise indicated. The consolidated financial statements provide comparative information in respect of the previous period. In addition, the Group presents an additional statement of financial position at the beginning of the earliest period presented when there is a retrospective application of an accounting policy.
2.2 Basis of consolidation The consolidated financial statements incorporate the financial statements of EMGS and entities controlled by EMGS (subsidiaries). Control is achieved when the Group is exposed, or has rights, to variable returns from its involvement with the investee and has the ability to affect those returns through its power over the investee.

46
Specifically, the Group controls an investee if and only if the Group has:
- Power over the investee (i.e. existing rights that give it the current ability to direct the relevant activities of the
investee)
- Exposure, or rights, to variable returns from its involvement with the investee
- The ability to use its power over the investee to affect its returns
Generally, there is a presumption that a majority of voting rights results in control. To support this presumption and when the Group has less than a majority of the voting or similar rights of an investee, the Group considers all relevant facts and circumstances in assessing whether it has power over an investee, including:
- The contractual agreement(s) with the other vote holders of the investee
- Rights arising from other contractual arrangements
- The Group’s voting rights and potential voting rights
The Group re-assesses whether or not it controls an investee if facts and circumstances indicate that there are changes to one or more of the three elements of control. Consolidation of a subsidiary begins when the Group obtains control over the subsidiary and ceases when the Group loses control of the subsidiary. Assets, liabilities, income and expenses of a subsidiary acquired or disposed during the year are included in the consolidated financial statements from the date the Group gains control until the date the Group ceases to control the subsidiary. All intra-group balances, income and expenses and unrealised gains and losses resulting from intra-group transactions are eliminated in full. The financial statements of the subsidiaries are prepared for the same reporting period as the parent company, using consistent accounting policies.
2.3 Business combinations and goodwill a) Business combinations and goodwill Business combinations are accounted for using the acquisition method. The cost of an acquisition is measured as the aggregate of the consideration transferred, which is measured at acquisition date fair value, and the amount of any non-controlling interest in the acquiree. For each business combination, the Group elects whether to measure the non-controlling interests in the acquiree at fair value or at the proportionate share of the acquiree’s identifiable net assets. Acquisition-related costs incurred are expensed and included in other operating expenses. When the Group acquires a business, it assesses the financial assets and liabilities assumed for appropriate classification and designation in accordance with the contractual terms, economic circumstances and pertinent conditions as at the acquisition date. Goodwill is initially measured at cost, being the excess of the aggregate of the consideration transferred and the amount recognised for non-controlling interest over the net identifiable assets acquired and liabilities assumed. If this consideration is lower than the fair value of the net assets of the subsidiary acquired, the difference is recognised in profit or loss. After initial recognition, goodwill is measured at cost less any accumulated impairment losses. For the purpose of impairment testing, goodwill acquired in a business combination is, from the acquisition date, allocated to each of the Group’s cash-generating units that are expected to benefit from the combination, irrespective of whether the assets or liabilities of the acquiree are assigned to those units. b) Joint operation A joint operation is a joint arrangement whereby the parties that have joint control of the arrangement have rights to the assets, and obligations for the liabilities, relating to the arrangement. The Group recognises in relation to its interest in a joint operation: its assets, including its share of any assets held jointly; its liabilities, including its share of any liabilities incurred jointly; its revenue from sale of its share of the output of the joint operation; its share of the revenue from the sale of the output by the joint operation; and its expenses, including its share of any expenses incurred jointly.

47
2.4 Current versus non-current classification
The Group presents assets and liabilities in statement of financial position based on current/non-current classification. An asset is classified as current when it is:
- Expected to be realised or intended to be sold or consumed in normal operating cycle - Held primarily for the purpose of trading - Expected to be realised within twelve months after the reporting period, or - Cash or cash equivalent unless restricted from being exchanged or used to settle a liability for at least twelve
months after the reporting period All other assets are classified as non-current. A liability is current when:
- It is expected to be settled in normal operating cycle - It is held primarily for the purpose of trading - It is due to be settled within twelve months after the reporting period, or - There is no unconditional right to defer the settlement of the liability for at least twelve months after the
reporting period The Group classifies all other liabilities as non-current.
2.5 Foreign currency translations a) Functional and presentation currency The financial statements of each entity within the Group reflect transactions recorded in the currency of the economic environment in which it operates (the functional currency). The functional currency of the Company is US Dollars (USD). The consolidated financial statements are presented in USD which is the Group's presentation currency. Each entity in the Group determines its own functional currency and items included in the financial statements of each entity are measured using that functional currency. b) Transactions and balances Transactions in foreign currencies are initially recorded by the Group’s entities at their respective functional currency spot rate on the date the transaction first qualifies for recognition. Monetary assets and liabilities denominated in foreign currencies are translated at the functional currency spot rate at the reporting date. All differences are recorded in profit and loss. Non-monetary items that are measured in terms of historical costs in a foreign currency are translated using the exchange rates on the dates of the initial transactions. Non-monetary items measured at fair value in a foreign currency are translated using the exchange rates on the date when the fair value is determined. The gain or loss arising on translation of non-monetary items measured at fair value is treated in line with the recognition of the gain or loss on the change in fair value of the item. c) Group companies The results and financial position of Group companies (none of which has the currency of a hyperinflationary economy) that have a functional currency different from the presentation currency are translated into the presentation currency as follows:
(i) Assets and liabilities for each balance sheet presented are translated on the rate of exchange ruling at
the reporting date.
(ii) Revenues and expenses for each income statement presented are translated at average exchange
rate for the period. However, if this average is not a reasonable approximation of the cumulative
effect on the rates prevailing on the actual transaction dates, revenues and expenses are translated
using the foreign exchange rates on the specific transaction date.
All resulting exchange differences are recognised in other comprehensive income.

48
2.6 Revenue from contracts with customers Revenue from contracts with customers is recognised when control of the goods and services are transferred to the customer at an amount that reflects the consideration to which the Company expects the be entitled in exchange for those goods or services. The disclosures of significant accounting judgements, estimates and assumptions relating to revenue from contracts with customers are provided in Note 4. Revenue is shown net of withholding and value-added taxes. Revenue is recognised as follows:
a) Proprietary contract sales The Group performs EM services under contract for a specific customer, whereby the EM data is owned by the customer. The Group recognises contract revenues (whether priced as Lump Sum, Day Rate or Unit Price) over time. Progress is measured in a manner generally consistent with the physical progress on the project. Mobilisation Fees Revenues for mobilisation are usually contracted with the customer and should cover the vessel’s transit to the actual area. Revenues and costs related to mobilisation are deferred and recognised over the acquisition period (which is the time from the first receiver is dropped to the last retrieval) of the contract, using the percentage of completion method. The deferral of mobilisation costs can only begin after an agreement has been signed between EMGS and the client. Until a contract is signed, costs are expensed as incurred.
b) Sales of multi-client library data Pre-funding agreements Sales made prior to commencement of acquisition for a project and sales while the projects are in progress, are presented as pre-funding revenues. The advantages for pre-funding customers are generally the possibility to influence the project specifications, early access to acquired data, and discounted prices. The Group recognises pre-funded revenue at the point in time when data is made accessible to the customer. Late sales Customers are granted a license from the Group which entitles them to access a specific part of the multi-client data library. The license payment is fixed and is required when the license is granted. The late sale revenue is recognised when a valid licensing agreement is signed, and the multi-client library data is made accessible to the customer. Uplift Uplift revenues can arise if a customer that has already bought a license for EM data, is awarded acreage covered by the data bought. Uplift revenue is recognised when the customer is awarded the acreage. Contract balances Contract assets A contract asset is the right to consideration in exchange for goods or services transferred to the customer. If the Group performs by transferring goods or services to a customer before the customer pays consideration or before payment is due, a contract asset is recognised for the earned consideration that is conditional. Trade receivables A receivable represents the Group’s right to an amount of consideration that is unconditional (i.e., only the passage of time is required before payment of the consideration is due). Contract liabilities A contract liability is the obligation to transfer goods or services to a customer for which the Group has received consideration (or an amount of consideration is due) from the customer. If a customer pays consideration before the Group transfers goods or series to the customer, a contract liability is recognised when the payment is made, or the payment is due (whichever is earlier). Contract liabilities are recognised as revenue when the Group performs under the contract.

49
2.7 Government grants Government grants are recognised where there is reasonable assurance that the grant will be received, and all attached conditions will be complied with. When the grant relates to an expense item, it is recognised as income on a systematic basis over the periods that the related costs, for which it is intended to compensate, are expensed. When the grant relates to an asset, it is recorded as a reduction of the asset up to the amount that covers the cost price. When the Group receives grants of non-monetary assets, the asset and the grant are recorded at nominal amounts and released to profit or loss over the expected useful life in a pattern of consumption of the benefit of the underlying asset by equal annual instalments.
2.8 Property, plant and equipment Property, plant and equipment are stated at historical cost less accumulated depreciation and any accumulated impairment losses. Historical cost includes costs directly attributable to the acquisition of the item. Costs are included in the asset’s carrying amount or recognised as a separate asset, if appropriate, only when it is probable that future economic benefits associated with the item will flow to the Group and the cost of the item can be measured reliably. Costs of all repairs and maintenance are expensed as incurred. Depreciation on assets is calculated using the straight-line method. The assets are depreciated over their estimated useful life, as follows: Useful life: Machinery and equipment* 3 - 8 years Cluster ** 5 years Hardware equipment and furniture 3 - 5 years *Machinery and equipment are mainly placed onboard the vessel. Parts of the equipment are under water during operation and have a shorter useful life. ** A cluster consists of IT equipment comprising of large number of processors for doing advanced data processing. The assets’ residual values, useful lives, and method of depreciation are reviewed at each balance sheet date and adjusted if appropriate. If an asset’s carrying amount is greater than its estimated recoverable amount, the asset is immediately written down to the recoverable amount (Note 2.12). Assets under construction are carried at cost, less accumulated impairment. Depreciation commences when the asset is ready for its intended use. An item of property, plant and equipment and any significant part initially recognised is derecognised upon disposal or when no future economic benefits are expected from its use or disposal. Any gain or loss arising on derecognition of the asset (calculated as the difference between the net disposal proceeds and the carrying amount of the asset) is included in the statement of profit or loss when the asset is derecognised.
2.9 Leases The determination whether an arrangement is, or contains, a lease is based on the substance of the arrangement at the inception of the lease. The arrangement is assessed for whether the fulfillment of the arrangement is dependent on the use of a specific asset or assets or the arrangement conveys a right to use the asset or assets, even if that right is not explicitly specified in an arrangement. a) Operating leases Leases in which a significant portion of the risks and rewards of ownership are retained by the lessor are classified as operating leases. Payments made under operating leases (net of any incentives received from the lessor) are charged to the income statement on a straight-line basis over the period of the lease. b) Finance leases The Group leases certain property, plant and equipment. Leases of property, plant and equipment where the Group has

50
substantially all the risks and rewards of ownership are classified as finance leases. Finance leases are capitalised at the commencement of the lease at the lower of the fair value of the leased asset and the present value of the minimum lease payments. Each lease payment is allocated between the liability and finance charges to achieve a constant rate on the finance balance outstanding. Property, plant and equipment acquired under finance leases are depreciated over the shorter of the useful life of the asset or the lease term.
2.10 Intangible assets Intangible assets acquired separately are measured on initial recognition at cost. The cost of intangible assets acquired in a business combination is fair value as at the date of acquisition. Following initial recognition, intangible assets are carried at cost less any accumulated amortisation and any accumulated impairment losses. The useful lives of intangible assets are assessed to be either finite or indefinite. Intangible assets with finite useful lives are amortised over the useful economic life and assessed for impairment whenever there is an indication that the intangible asset may be impaired. The amortisation period and method are reviewed at least every financial year end. Intangible assets with indefinite useful lives are not amortised, but are tested for impairment annually, either individually or at the cash-generating unit level. a) Patents Patents have a finite useful life and are recorded at historical cost less accumulated amortisation and any accumulated impairment losses. Amortisation is calculated using the straight-line method to allocate the cost of patents over their estimated useful lives (10-15 years). Administrative costs associated with patents are expensed as incurred. b) Computer software The cost of acquired computer software licenses is capitalised based on the expenses incurred to acquire and bring the specific software to use. These costs are amortised over the estimated useful life (3 years). The costs of design of software interfaces, installing, testing, creating system and user documentation, defining user reports and data conversion are capitalised together with the software cost. These costs are directly related to developing the software application for the Group’s use. Costs associated with maintaining computer software are expensed as incurred. Costs directly associated with the production of identifiable and unique software products controlled by the Group, which are expected to generate economic benefits in excess of cost (beyond one year) are recognised as intangible assets. Direct costs include software development employee costs and an appropriate portion of relevant overheads. Computer software development costs recognised as assets are amortised over their estimated useful life, not to exceed three years. c) Research and development costs Research costs are expensed as incurred. Development expenditure on individual projects is recognised as an intangible asset when the Group can demonstrate:
- The technical feasibility of completing the intangible assets so that it will be available for use or sale
- Its intention to complete and its ability to use or sell the asset
- How the asset will generate future economic benefits
- The availability of resources to complete the asset
- The ability to measure reliably the expenditure during development
Following initial recognition of the development expenditure as an asset, the asset is carried at cost less any accumulated amortisation and accumulated impairment losses. Amortisation of the asset begins when development is complete and the asset is available for use. It is amortised over the period of expected future benefit (normally 3 years).

51
During the period of development, the asset is tested for impairment annually. Contributions from external customers and government grant in the development stage are recorded as a reduction of the intangible asset up to the amount that covers the cost price. Any surplus is recorded as revenues. d) Multi-client library The multi-client library consists of surveys of electromagnetic data. The surveys can be licensed to customers on a non-exclusive basis. Directly attributable costs associated with the production and development of multi-client projects such as acquisition costs, processing costs, and direct project costs are capitalised. A multi-client project is considered complete when all components or processes associated with the acquisition and processing of the data are finished, and all components of the data have been properly stored and made ready for delivery to customers. After a project is completed, a straight-line amortisation is applied. The straight-line amortisation is assigned over the useful life, which is set at four years. The straight-line amortisation is distributed evenly through the financial year independently of sales during the quarters.
2.11 Inventories
Inventories are valued at the lower of cost or net realisable value. Cost is determined using the first-in, first-out (FIFO) method. Net realisable value is the estimated selling price in the ordinary course of business, less estimated costs of completion and the estimated costs necessary to make the sale. The Group’s inventory consists primarily of equipment components and parts, anchors, batteries, and fuel.
2.12 Impairment of non-financial assets
The Group assesses, at each reporting date, whether there is an indication that an asset may be impaired. If any indication exists, or when annual impairment testing for an asset is required, such as for goodwill and intangible assets with infinite useful life, the Group estimates the asset’s recoverable amount. An asset’s recoverable amount is the higher of an asset’s or cash-generating unit’s (CGU) fair value less costs of disposal and its value in use. Recoverable amount is determined for an individual asset, unless the asset does not generate cash inflows that are largely independent of those from other assets or groups of assets. When the carrying amount of an asset or CGU exceeds its recoverable amount, the asset is considered impaired and is written down to its recoverable amount. In assessing value in use, the estimated future cash flows are discounted to their present value using a pre-tax discount rate that reflects current market assessments of the time value of money and the risks specific to the asset. In determining fair value less costs of disposal, recent market transactions are taken into account. If no such transaction can be identified, an appropriate valuation model is applied. The Group bases its impairment calculation on budget and forecast calculations. Non-financial assets, other than goodwill previously impaired, are reviewed at each reporting date for possible reversal of the previously recorded impairment. A previously recognised impairment loss is reversed only if there has been a change in the estimates used to determine the asset’s recoverable amount since the last impairment loss was recognised. If that is the case, the carrying amount of the asset is increased to its recoverable amount. That increased amount cannot exceed the carrying amount that would have been determined, net of depreciation, had no impairment loss been recognised for the asset in prior periods.
2.13 Financial instruments
a) Financial assets Initial recognition and measurement Financial assets are classified, at initial recognition, as subsequently measured at amortised cost, fair value through other comprehensive income (OCI), and fair value through profit or loss.

52
The classification of financial assets at initial recognition depends on the financial asset’s contractual cash flow characteristics and the Group’s business model for managing them. With the exception of trade receivables that do not contain a significant financing component, the Group initially measures a financial asset at its fair value plus transaction costs. Trade receivables are measured at the transaction price determined under IFRS 15. Subsequent measurement For purposes of subsequent measurements, financial assets are classified in four categories:
- financial assets at amortised cost (debt instruments) - financial assets at fair value through OCI with recycling of cumulative gains and losses (debt instruments) - financial assets designated at fair value through OCI with no recycling of cumulative gains and losses upon
derecognition (equity instruments) - financial assets at fair value through profit or loss
Financial assets at amortised cost is the most relevant to the Group. The Group measures financial assets at amortised cost if both of the following conditions are met:
- the financial asset is held within a business model with the objective to hold financial assets in order to collect contractual cash flows, and
- the contractual terms of the financial asset give rise on specified dates to cash flows that are solely payments of principal and interest on the principal amount outstanding
Financial assets at amortised cost are subsequently measured using the effective interest (EIR) method and are subject to impairment. Gains and losses are recognised in profit or loss when the asset is derecognised, modified or impaired. The Group’s financial assets at amortised cost includes trade receivables. The Group does not have any financial assets measured at fair value through OCI, financial assets designated at fair value through OCI, or financial assets at fair value through profit or loss. Derecognition A financial asset is derecognised when the rights to receive cash flows from the asset have expired; or the Group has transferred its rights to receive cash flows from the asset or has assumed an obligation to pay the received cash flows in full without material delay to third party under a “pass-through” arrangement; and either (i) the Group has transferred substantially all the risks and rewards of the asset, or (ii) the Group has neither transferred nor retained substantially all the risks and rewards relating to the asset, but has transferred control of the asset.
Impairment of financial assets For trade receivables, the Group applied a simplified approach in calculating expected credit losses (ECL). The Group recognises a loss allowance based on lifetime ECLs at each reporting date. This is based on the historical credit loss experience, adjusted for forward-looking factors specific to the debtors and the economic environment, see Note 3 b). b) Financial liabilities Initial recognition and measurement Financial liabilities are classified, at initial recognition, as financial liabilities at fair value through profit or loss, loans and borrowings, payables, or as derivatives designated as hedging instruments in an effective hedge, as appropriate. All financial liabilities are recognised initially at fair value and, in the case of loans and borrowings and payables, net of directly attributable transaction costs. The Group’s financial liabilities include trade and other payables, loans and borrowings, and derivative financial instruments. Subsequent measurement The measurement of financial liabilities depends on their classification, as described below: Financial liabilities at fair value through profit or loss Financial liabilities at fair value through profit or loss include financial liabilities held for trading and financial liabilities designated upon initial recognition at fair value through profit or loss.

53
This category includes derivative financial instruments entered into by the Group that are not designated as hedging instruments in hedge relationships as defined by IFRS 9. The Group’s forward rate agreement that was repaid in 2018 was classified as financial liability at fair value through profit or loss. Loans and borrowings This is the category most relevant to the Group. After initial recognition, interest-bearing loans and borrowings are subsequently measured at amortised cost using the EIR method. Gains and losses are recognised in profit or loss when the liabilities are derecognised as well as through the EIR amortisation process. The EIR amortization is included as finance costs in the statement of profit or loss. This category applies to interest-bearing loans and borrowings. Convertible bond The convertible bond is separated into a liability and an equity component. On issuance of the convertible bond loan, the fair value of the liability component is determined using a market rate for equivalent non-convertible instrument. This amount is classified as a financial liability measured at amortised costs (net of transaction costs) until it is extinguished on conversion or redemption. The remainder of the proceeds is allocated to the conversion option that is recognised and included in equity. Transaction costs are deducted from equity. The carrying amount of the conversion option is not remeasured in subsequent years. Transaction costs are apportioned between the liability and equity components of the convertible bond, based on the allocation of proceeds to the liability and equity components when the instrument is initially recognised.
Derecognition A financial liability is derecognised when the obligation under the liability is discharged, cancelled or expires. When an existing financial liability is replaced by another from the same lender on substantially different terms, or the terms of an existing liability are substantially modified, this is treated as derecognition of the original liability and recognition of a new liability. The difference in the respective carrying amounts is recognised in the income statement.
2.14 Taxes a) Current income tax Current income tax assets and liabilities for the current and prior periods are measured using the amount expected to be recovered from or paid to the taxation authorities. The tax rates and tax laws used to compute the amount are those that are enacted or substantively enacted at the reporting date in the countries where the Group operates and generates taxable income. Current income tax relating to items recognised directly in equity is recognised in equity and not in the income statement. Management periodically evaluates positions taken in the tax returns with respect to situations in which applicable tax regulations are subject to interpretation and establishes provisions where appropriate. b) Deferred tax Deferred tax is provided for using the liability method on temporary differences between the tax bases of assets and liabilities and their carrying amounts in the consolidated financial statements. Deferred tax is determined using tax rates (and laws) that have been enacted or substantially enacted on the balance sheet date and are expected to apply when the related deferred tax asset is realised or the deferred tax liability is settled. Deferred tax assets are recognised to the extent that it is probable that future taxable profit will be available against which the temporary differences can be utilised. Deferred tax is provided on temporary differences arising on investments in subsidiaries, except where the timing of the reversal of the temporary difference is controlled by the Group and it is probable that the temporary difference will not reverse in the foreseeable future. Deferred tax relating to items recognised directly in equity is recognised in equity and not in the income statement. c) Sales tax Expenses and assets are recognised net of the amount of sales tax, except:

54
- When the sales tax incurred on a purchase of assets or services is not recoverable from the taxation authority,
in which case, the sales tax is recognised as part of the cost of acquisition of the asset or as part of the expense
item, as applicable
- When receivables and payables are stated with the amount of sales tax included
The net amount of sales tax recoverable from, or payable to, the taxation authority is included as part of receivables or payables in the statement of financial position.
2.15 Employee benefits a) Pension obligations The Company operates a defined contribution plan. The net pension cost for the period is presented as an employee expense. b) Share-based payments The Group operates an equity-settled, share-based compensation plan. The cost of equity-settled transactions with employees is measured by reference to the fair value at the date on which they are granted. The fair value is determined by an external valuation expert using an appropriate pricing model, further details are given in Note 15. The cost of equity-settled transactions is recognised in Employee expenses, together with a corresponding increase in equity, over the period in which the performance and/or service conditions are fulfilled, ending on the date on which the relevant employees become fully entitled to the award (the vesting date). The cumulative expense recognised for equity- settled transactions at each reporting date until the vesting date reflects the extent to which the vesting period has expired and the Group's best estimate of the number of equity instruments that will ultimately vest. The income statement charge or credit for a period represents the movement in cumulative expense recognised as at the beginning and end of that period. When options are exercised, the proceeds received net of any directly attributable transaction costs are credited to share capital (nominal value) and share premium. Social security tax on share-based compensation is recorded as a liability and recognised over the estimated option period. The social security tax is calculated using the appropriate tax rate on the difference between market price and the exercise price on the measurement date. c) Bonus plans The Group recognises a provision for bonus expenses where contractually obliged or where there is a past practice that has created a constructive obligation.
2.16 Provisions Provisions are recognised when the Group has a present obligation as a result of a past event, it is probable that an outflow of resources embodying economic benefits will be required to settle the obligation and a reliable estimate can be made of the amount of the obligation.
2.17 Cash flow statement The cash flow statement is presented using the indirect method. Cash and cash equivalents includes cash at hand, deposits held at call with banks, other short-term highly liquid investments with original maturities of three months or less.
2.18 Changes in accounting policies and disclosures The Group applied IFRS 15 and IFRS 9 for the first time in 2018. The nature and effect of the changes as a result of adoption of these new accounting standards are described below. Several other amendments and interpretations apply for the first time in 2018, but do not have an impact on the consolidated financial statements of the Group. The Group has not early adopted any standards, interpretations or amendments that have been issued but are not yet effective.

55
IFRS 15 Revenue from contract with customers IFRS 15 establishes a five-step model to account for revenue arising from contracts with customers. Under IFRS 15, revenue is recognised at an amount that reflects the consideration to which an entity expects to be entitled in exchange for transferring goods and services to a customer. The Group adopted the new standard on the required effective date using the full retrospective method. For proprietary contract sales and late sales, there were no material effects following the implementation of IFRS 15. Multi-client prefunding revenues are recognised at the point in time when final product is delivered to the customer and not based on the so-called Percentage of Completion (POC) principle, which was used prior to 1 January 2018. As a consequence of the change in POC revenue, the Group has also capitalised multi-client projects with only one customer that were previously expensed as incurred (converted contracts). For these, the full amortisation of the book value is now recorded at the point in time when the revenues are recognised at delivery to the customer. Impact on income statement (increase/(decrease) in profit):
Impact on basic and diluted earnings per share (increase/(decrease)):
31 December 2017 Adjustments 31 December 2017
Amounts in USD 1 000 Adjustments Audited IFRS 15 Unaudited
Restated*
Operating revenues
Other revenue 22,602 0 22,602
Multi-client pre-funding a) 13,256 -1,961 11,295
Total Revenues 35,858 -1,961 33,896
Operating expenses
Charter hire, fuel and crew expenses b) 10,331 -2,676 7,655
Employee expenses b) 17,057 -93 16,964
Multi-client amortisation b) 8,613 1,732 10,345
Other operating expenses 16,739 0 16,739
Total operating expenses 52,740 -1,037 51,703
Operating profit/(loss) -16,882 -924 -17,807
Net financial items -5,043 0 -5,043
Net income/(loss) before taxes -21,926 -924 -22,850
Income tax expense 356 0 356
Income profit/(loss) for the year -22,282 -924 -23,206
31 December 2017 Adjustments 31 December 2017
Amounts in USD 1 000 Audited IFRS 15 Unaudited
Restated*
Basic earnings per share -0.37 -0.02 -0.39
Diluted earnings per share -0.37 -0.02 -0.39

56
Impact on the statement of financial position (increase/(decrease)):
The nature of these adjustments is described below:
a) Multi-client pre-funding revenues Prior to adopting IFSR 15, the Group recognised pre-funding revenue based on the Percentage of Completion (POC) principle. Under IFRS 15, the pre-funding revenues are recognised at the point in time when the final product is delivered to the customer, hence pre-funding revenues for data acquired in one year and delivered to the customer in the next year are adjusted in the restated numbers.
b) Capitalisation and amortisation of multi-client projects As a consequence of the change in the pre-funding revenue recognition, the Group has now capitalised multi-client projects with no expectations of future sales. These capitalised expenses have previously been expensed as incurred (converted contracts). A full amortisation of the value is now recorded at the point in time when the revenues are recognised at data delivery to the customer.
IFRS 9 Financial instruments The standard has not had any significant effect on the Group’s consolidated financial statements. The Company has calculated a modification gain of the restructuring of the bond loan in 2015 where the maturity date was extended from 27 June 2016 to 27 June 2019 of 68.
2.19 Standards and interpretations issued, but not yet adopted
The financial statements have been prepared based on standards effective for the year ending 31 December 2018. IASB has issued the following standards/amendments to the following standards that are not yet effective: - IFRS 16 Leases (effective date 1 January 2019) IFRS 16 Leases IFRS 16 Leases replaces existing IFRS leases requirements, IAS 17 Leases. IFRS 16 sets out the principles for the recognition, measurement, presentation and disclosure of leases and requires lessees to account for all leases under a single on-balance sheet model similar to accounting for finance leases under IAS 17.
1 January 2017 Adjustments 1 January 2017 31 December 2017 Adjustments 31 December 2017
Amounts in USD 1 000 Adjustments Audited IFRS 15 Unaudited Audited IFRS 15 Unaudited
Restated* Restated*
ASSETS
Non-current assets
Multi-client l ibrary b) 24,332 0 24,332 16,280 1,037 17,317
Other 48,199 0 48,199 44,476 0 44,476
Total non-current assets 72,531 0 72,531 60,756 1,037 61,793
Total current assets 38,761 0 38,761 43,778 0 43,778
Total assets 111,292 0 111,292 104,534 1,037 105,571
EQUITY
Capital and reserves attributable to equity holders
Retained earnings a),b) -284,975 -579 -285,554 -336,764 -1,503 -338,267
Other 317,675 0 317,675 364,653 0 364,653
Total equity 32,700 -579 32,121 27,889 -1,503 26,386
LIABILITIES
Total non-current liabilities 55,444 0 55,444 53,950 0 53,950
Current liabilities
Other short term liabilities a) 10,372 579 10,951 9,223 2,540 11,763
Other 12,776 0 12,776 13,471 0 13,471
Total current liabilities 23,148 579 23,727 22,694 2,540 25,234
Total liabilities 78,592 579 79,171 76,644 2,540 79,184
Total equity and liabilities 111,292 0 111,292 104,534 1,037 105,571

57
The standard includes two recognition exemptions for lessees – leases of “low-value” assets (e.g., personal computers) and short-term leases (i.e., leases with a lease term of 12 months or less). At the commencement date of a lease, a lessee will recognise a liability to make lease payments (i.e., the lease liability) and an asset representing the right to use the underlying asset during the lease term (i.e., the right-of-use asset). Lessees will be required to separately recognise the interest expense on the lease liability and the depreciation expense on the right-of -use asset. Lessees will be also required to remeasure the lease liability upon the occurrence of certain events (e.g., a change in the lease term, a change in future lease payments resulting from a change in an index or rate used to determine those payments). The lessee will generally recognise the amount of the remeasurement of the lease liability as an adjustment to the right-of-use asset. Transition to IFRS 16 The Group plans to adopt IFRS 16 using the modified retrospectively approach. The Group will elect to apply the standard to contracts that were previously identified as leases applying IAS 17 and IFRIC 4. The Group leases vessels and office space and will have to change the recognition of these lease contracts accordingly. These leases will be recorded as assets and corresponding financial lease liability in the balance sheet. The vessel lease expenses will be moved from charter hire, fuel and crew expenses to depreciation and interest expenses. The office lease expense will be moved from other operating expenses to depreciation and interest expenses. The Group has leases of certain office equipment (i.e. personal computers, printing and photocopying machines) that are considered of low value. During 2018, the Group has performed a detailed impact assessment of IFRS 16. In summary the impact of IFRS 16 adoption is expected to be, as follows: Impact on income statement:
2019
Amounts in USD 1 000 Unaudited
Operating expenses
Charter hire, fuel and crew expenses -13,164
Depreciation 11,999
Other operating expenses -885
Opearating profit/ (loss) 2,050
Interest expense 1,739
Income/ (loss) for the period 311
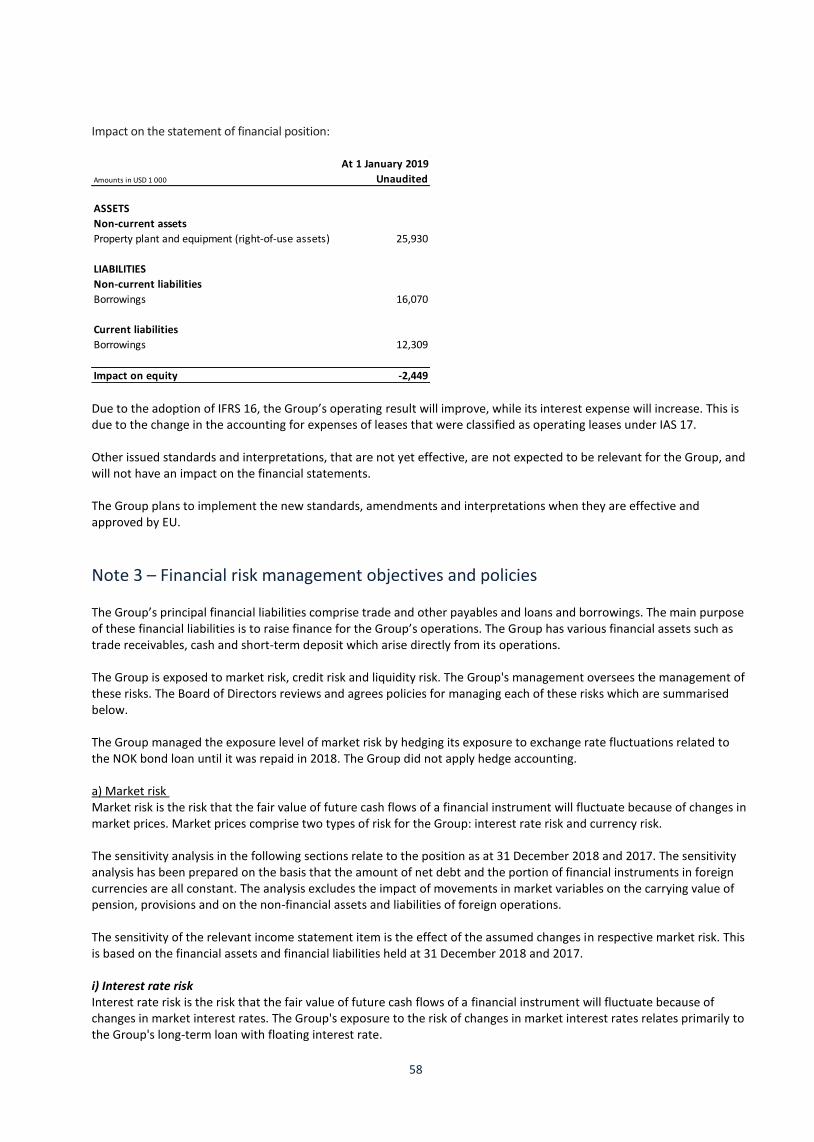
58
Impact on the statement of financial position:
Due to the adoption of IFRS 16, the Group’s operating result will improve, while its interest expense will increase. This is due to the change in the accounting for expenses of leases that were classified as operating leases under IAS 17. Other issued standards and interpretations, that are not yet effective, are not expected to be relevant for the Group, and will not have an impact on the financial statements. The Group plans to implement the new standards, amendments and interpretations when they are effective and approved by EU.
Note 3 – Financial risk management objectives and policies The Group’s principal financial liabilities comprise trade and other payables and loans and borrowings. The main purpose of these financial liabilities is to raise finance for the Group’s operations. The Group has various financial assets such as trade receivables, cash and short-term deposit which arise directly from its operations. The Group is exposed to market risk, credit risk and liquidity risk. The Group's management oversees the management of these risks. The Board of Directors reviews and agrees policies for managing each of these risks which are summarised below. The Group managed the exposure level of market risk by hedging its exposure to exchange rate fluctuations related to the NOK bond loan until it was repaid in 2018. The Group did not apply hedge accounting. a) Market risk Market risk is the risk that the fair value of future cash flows of a financial instrument will fluctuate because of changes in market prices. Market prices comprise two types of risk for the Group: interest rate risk and currency risk. The sensitivity analysis in the following sections relate to the position as at 31 December 2018 and 2017. The sensitivity analysis has been prepared on the basis that the amount of net debt and the portion of financial instruments in foreign currencies are all constant. The analysis excludes the impact of movements in market variables on the carrying value of pension, provisions and on the non-financial assets and liabilities of foreign operations. The sensitivity of the relevant income statement item is the effect of the assumed changes in respective market risk. This is based on the financial assets and financial liabilities held at 31 December 2018 and 2017. i) Interest rate risk Interest rate risk is the risk that the fair value of future cash flows of a financial instrument will fluctuate because of changes in market interest rates. The Group's exposure to the risk of changes in market interest rates relates primarily to the Group's long-term loan with floating interest rate.
At 1 January 2019
Amounts in USD 1 000 Unaudited
ASSETS
Non-current assets
Property plant and equipment (right-of-use assets) 25,930
LIABILITIES
Non-current liabilities
Borrowings 16,070
Current liabilities
Borrowings 12,309
Impact on equity -2,449

59
With all other variables held constant, a reasonably possible increase in LIBOR will increase the Group's annual net interest expense on the long-term loan by approximately 311 at 31 December 2018 (2017: 328 included a reasonably possible increase in NIBOR). ii) Foreign currency risk Foreign currency risk is the risk that the fair value of future cash flows of a financial instrument will fluctuate because of changes in foreign exchange rates. The Group operates internationally and therefore has exposure to foreign exchange risk arising from transactions executed in other currencies than the functional currency of each company. EMGS ASA has USD as functional currency, hence the foreign currency risk is primarily with respect to NOK in EMGS ASA. Approximately 89% of the Group’s sales are denominated in USD, whilst approximately 49% of costs are denominated in USD in 2018. Foreign exchange risk arises from future commercial transactions, recognised as assets and liabilities. The following table summarises the sensitivity to a reasonably possible change in the NOK exchange rate, with all other variables held constant, of the Group’s profit before tax (due to changes in the fair value of monetary assets and liabilities). The Group's exposure to foreign currency changes on equity and for all other currencies is not material.
The effect on income/(loss) before tax is lower in 2018 compared with 2017 as the Group repaid its NOK bond loan and issued a new convertible bond in USD in 2018.
b) Credit risk Credit risk is the risk that a counterparty will not meet its obligations under a financial instrument or customer contract, leading to a financial loss. The Group is exposed to credit risk from its operating activities (primarily for trade receivables and cash and cash equivalents). See Note 20 for aging analysis of trade receivables. i) Trade receivables The Group trades with recognised, creditworthy third parties. It is the Group’s policy that all customers who wish to trade on credit terms are subject to credit verification procedures. In addition, receivable balances are monitored on an ongoing basis. Although three major customers amounted to a significant part of 2018 revenues, these customers were large international oil companies, and considered creditworthy.
The requirement for an impairment charge is analysed at each reporting date on an individual basis for each customer. For trade receivables, the Group applied a simplified approach in calculating expected credit losses (ECL). The Group recognises a loss allowance based on expected credit losses at each reporting date. This is based on the historical credit loss experience, adjusted for forward-looking factors specific to the debtors and the economic environment, see Note 2.13 a). The maximum exposure to credit risk at the reporting date is the carrying value of each class of financial assets.
With respect to credit risk arising from the other financial assets of the Group such as cash and cash equivalents, the Group’s exposure to credit risk arises from default of the counter party, with maximum exposure equal to the carrying amount of these instruments. c) Liquidity risk Liquidity risk is the risk that the Company will not have sufficient liquidity to be able to meet its financial obligations. EMGS’ sources of liquidity include cash balances, cash flow from operations, borrowings, it’s existing and new bank facilities and further debt and equity issues. It is the Company’s objective to balance these sources of liquidity.
Through comprehensive cost reduction measures, the Group has reduced the operational cost base from USD 143 million in 2015 down to USD 42 million in 2017. EMGS continued its cost focus in 2018 and recorded a cost base of USD 48 million in 2018. The Group’s convertible bond loan contains a financial covenant requiring free cash and cash equivalents of at least USD
Increase/
decrease in
NOK rate
Effect on
income/(loss)
before tax
2018 +20% 146
-20% -146
2017 +20% 5,307
-20% -5,307

60
2.5 million. As of 31 December 2018, the free cash and cash equivalents totalled USD 6.5 million. EMGS’ management follows the Group’s liquidity risk closely, including weekly updates of the Group’s sales forecast and vessel schedule, in addition to a corresponding update of the cost and free cash forecast. The Group’s improved backlog in 2019 has reduced the uncertainty related to the timing of revenues and the pressure on the Group’s cash position and consequently the Group’s ability to meet the cash covenant. The Group is operating with very limited headroom under the free cash covenant. Management considers the likelihood of a breach during the next twelve-month period to be low. However, should the Group experience a material, or a series of non-material, incidents with a negative impact on the Group’s cash position and / or timing of cash flow, the Group may nevertheless need to take additional actions to remain compliant with the free cash covenant. The financial liabilities with maturity less than one year will be settled through cash flow from operating activities in 2019. The Group has improved its backlog significantly in 2019, see Note 34 for description, which will have a positive effect on the cash flow from operating activities. Consequently, management considers the liquidity throughout 2019 sufficient to cover both the Group’s net current liabilities per 31 December 2018 and estimated cash-need in 2019. The table below summarises the maturity profile of the Group’s financial liabilities 31 December based on contractual payments.
See Note 23 for financial liabilities. The USD 32.5 million convertible bond loan contains a financial covenant requiring free cash and cash equivalents of at least USD 2.5 million. In addition, the bond agreement restricts the Company's ability, among other things, to sell multi-client library, declare or make any dividend payments, incur additional indebtedness, change our business, and enter speculative financial derivative agreements. i) Capital management For the purpose of the Group's capital management, capital includes equity attributable to the equity holder of the parent. The primary objective of the Group’s capital management is to ensure healthy capital ratios to support its business and maximise shareholder value. In order to achieve this overall objective, the Group's capital management, amongst other things, aims to ensure that it meets financial covenants attached to the interest-bearing loans and borrowings that define capital structure requirements. Breaches in meeting the financial covenants would permit the lenders to immediately call loans and borrowings. There have been no breaches in the financial covenants of any interest-bearing loans and borrowings in the current period. The Group manages its capital structure and adjusts it considering changes in economic conditions. To maintain or adjust the capital structure, the Group may refinance its debt, issue new shares or sell assets.
Amounts in USD 1 000
On
demand
Less than
3 months
3 to 6
months
6 months
to 1 year
1 to 2
years
2 to 5
years > 5 years Total
Year ended 31 December 2018
Interest bearing loans and borrowings 0 749 749 1,498 2,997 39,991 0 45,984
Trade and other payables 0 11,833 1,261 5,080 0 2,730 0 20,904
Other financial liabilities 0 74 75 152 127 85 0 513
Year ended 31 December 2017
Interest bearing loans and borrowings 0 579 592 1,178 33,934 0 0 36,283
Trade and other payables 0 11,261 2,251 5,550 0 3,344 0 22,406
Forward rate agreement 0 0 0 0 2,993 0 0 2,993
Other financial liabilities 0 71 72 147 303 173 0 766

61
Note 4 – Significant accounting estimates, judgements and assumptions
The preparation of the Group’s financial statements requires management to make estimates, judgements and assumptions that affect the reported amounts of revenues, expenses, assets and liabilities. Uncertainty about these assumptions and estimates could result in outcomes that could require a material adjustment to the carrying amount of the assets or liabilities affected in the future periods. Estimates and judgements are continually evaluated and are based on historical experience and other factors, including expectations of future events that are believed to be reasonable under the circumstances.
4.1 Estimates and assumptions The Group makes estimates and assumptions concerning the future. The resulting accounting estimates could deviate from the actual results. The estimates and assumptions that have a significant risk of causing a material adjustment to the carrying amounts of assets and liabilities within the next financial year are discussed below.
Impairment of non-financial assets An impairment exists when the carrying value of an asset or cash generating unit exceeds its recoverable amount, which is the higher of its fair value less costs of disposal and its value in use. The value in use calculation is based on a discounted cash flow (DCF) model. The cash flows are derived from the financial budget approved by the management and do not include restructuring activities that the Group is not yet committed to or significant future investments that will enhance the asset’s performance of the cash generating unit being (CGU) tested. The recoverable amount is sensitive to the discount rate used for the DCF model as well as the expected future cash-inflows and the growth rate used for extrapolation purposes. These estimates are most relevant to the multi-client library and Deep Blue (see description under Assets under construction below) recognised by the Group. The key assumptions used to determine the recoverable amount, including a sensitivity analysis, are disclosed and further explained in Note 16. Deep Blue At least annually, management forecasts future cash flows from the Joint Industry Project (“the Deep Blue”). The Deep Blue is the Next Generation EM equipment. The project has been on-going since 2012. EMGS performed its first commercial survey with the Deep Blue equipment in 2017. The net carrying value of the Deep Blue as of 31 December 2018 of 26 900 (2017: 31 734) has been recorded as property, plant and equipment. The partner contributions with a total value of 19 250 as of 31 December 2018 (2017: 20 670) are recorded as contract liability. In estimating future cash flows, future market demand and additional expenses to operate the vessel are taken into account. Because the inherent difficulty in estimating these factors, it is possible that future cash flows from these activities will not be sufficient to recover the existing carrying value of the Deep Blue. See Note 17 for more details regarding the impairment test. Taxes Uncertainties exist with respect to the interpretation of complex tax regulations, changes in tax laws, and the amount and timing of future taxable income. The Group is subject to income taxes in several jurisdictions. Given the wide range of international business relationships, differences arising between the actual results and the assumptions made, or future changes in such assumptions, could necessitate future adjustments to tax income and expense already recorded. The Group establishes provisions, based on reasonable estimates, for possible consequences of audit by the tax authorities of the respective countries in which it operates. The amount of such provisions is based on several factors, such as the experience of previous tax audits and differing interpretations of tax regulations by the taxable entity and the responsible tax authority. Such differences in interpretation may arise for a wide variety of issues depending on the conditions prevailing in the respective domicile of the Group companies. Deferred tax assets are recognised for unused tax losses to the extent that it is probable that taxable profit will be available against which the losses can be utilised. Significant management judgement is required to determine the amount of deferred tax assets that can be recognised, based upon the likely timing and the level of future taxable profits together with future tax planning strategies. Unrecognised tax assets at 31 December 2018 are 89 592 (2017: 85 113).
62
Useful lives of the Group’s property, plant and equipment, and intangible assets The Group’s management determines the estimated useful lives and related depreciation and amortisation charges for its property, plant, and equipment and intangible assets. This estimate could change significantly as a result of technical innovations and increased competition. When remaining useful lives of assets are determined to be too high, management will make appropriate estimate revisions and adjust depreciation charges prospectively. Items determined to be technically obsolete or which have been abandoned will be written off completely.
4.2 Judgement In the process of applying the Group's accounting policies, management has made the following judgements, which have the most significant effect on the amounts recognised in the consolidated financial statements: Revenue recognition IFRS 15 requires entities to exercise judgement taking into consideration all the relevant facts and circumstances when applying each step of the model to contracts with their customers. The Group uses the percentage of completion method in accounting for its proprietary contracts, as the revenue should be recognised over time by measuring the progress towards complete satisfaction of the performance obligation. Progress is measured in a manner generally consistent with the physical progress on the project. Use of the percentage of completion method requires the Group to estimate the services performed to date as a proportion of the total services to be performed. The proportion of services performed to total services to be performed can differ from management’s estimates, influencing the amount of revenue recognised in the period. Operating leases The Group has entered into lease contracts on its vessels. The Group has determined, based on an evaluation of the terms and conditions of the arrangements, such as the lease term not constituting a substantial portion of the economic life of the vessels, that the vessel owner retains all significant risks and rewards of ownership of these vessels and the Group accounts for the contracts as operating leases. This will change when the Group implements IFRS 16 in 2019, see Note 2. Development costs Development costs are capitalised in accordance with accounting policy in Note 2.10 c). Initial capitalisation of costs is based on management’s judgement that technological and economic feasibility is confirmed, usually when a product development project has reached a defined milestone according to established project management model. At 31 December 2018, the carrying amount of capitalised development costs is 571 (2017: 525).
Note 5 – Shared revenue The Group has since 2013 entered several cooperation agreements regarding EM multi-client surveys in the Barents Sea, Gulf of Mexico and Brazil. The cooperation agreements are joint operations. EMGS has received funding and/or seismic data against a revenue share on prefunding, late sales and uplift revenues. EMGS has provided the vessel, performed the data acquisition and finally provided the data processing services. The acquired data remains the property of EMGS. When EMGS licenses data to customers in areas subject to revenue sharing, the Group invoices and collects payments from the customers for the entire sales amount. The related accounts receivable is presented gross, while the portion due to the partner upon collection from the customer is presented as a short-term liability. EMGS' share of the revenue from the sale of multi-client library with cooperation agreements in 2018 is 4 453 (2017: 6 945).

63
Note 6 – Segment For management purposes, the Group is organised into one reportable segment. The Group offers EM services, and the sale contracts and costs are incurred worldwide. The Group uses a patented electromagnetic survey method to find hydrocarbons in offshore reservoirs. The Group’s services help oil and gas companies to improve their exploration success rates. Management monitors the operating result of the single reportable segment for the purpose of making decisions about resource allocation and performance assessment. No operating segments have been aggregated to form the above reportable operating segment. The customers are international oil companies and the risk and profitability are similar in the different geographical areas. The Group's property, plant and equipment are mainly the survey equipment on the vessels. As the surveys are executed worldwide, the Group is not able to allocate any assets to different geographical areas.
Geographic information Revenues from external customers:
The revenue information above is based on the location of the survey. Three single external customers amounted to 10% or more of the Group's total revenues in 2018 (two single external customers in 2017). Total revenues from these customers were in 2018 6 750, 6 063 and 6 006 (for 2017: 12 979 and 5 149).
EMGS'
revenue share
Multi-client survey
Brazil 2013 95 %
Barents Sea 2013 70 %
Barents Sea 2014 50 %
Gulf of Mexico 2014 90 %
Barents Sea 2015 50 %
Barents Sea 2016 50 %
Barents Sea 2017 50 %
Amounts in USD 1 000 2018 2017Restated*
Europe, Middle East and Africa 20,087 32,211
North and South America 9,083 1,165
Asia and the Pacific Ocean 2,381 520
Total 31,550 33,896
* See changes in accounting policies under note 2.18

64
Note 7 – Charter hire, fuel and crew expenses
Note 8 – Employee expenses
The average number of full-time equivalents was 124 in 2018 (2017: 133). The average number of full-time in equivalents in management was 2.1 in 2018 (2017: 3.8). See Note 6 in the Financial Statements of EMGS ASA for Executive Management and Board of Directors remuneration.
Amounts in USD 1 000 2018 2017
Restated*
Charter hire and crew expenses 15,010 10,714
Fuel 3,249 2,523
Agent fee 0 3
Withholding tax cost 1,017 4
Capitalisation of multi-client costs -6,193 -9,588
Other external services 5,701 3,999
Total charter hire, fuel and crew expenses 18,784 7,655
*See changes in accounting policies under note 2.18
Amounts in USD 1 000 2018 2017
Restated*
Employee expenses
Salaries 13,781 13,268
Social security tax 1,797 1,666
Pension costs (Note 22) 892 1,012
Other payments 1,202 964
Cost of share based payment (Note 15) -167 54
Total employee expenses 17,505 16,964
Compensation of key management personnel of the Group
Salary 1,066 743
Bonus paid in the year 66 363
Share options -181 36
Pension benefits 50 24
Other benefits 36 124
Total management remuneration 1,038 1,290
*See changes in accounting policies under note 2.18

65
Note 9 – Other operating expenses
The fees to auditor are for the Group included subsidiaries, and do not include VAT.
Note 10 – Research and development costs Research and development costs consist of 1 334 (2017: 844) charged to the income statement as part of operating expenses. Employee costs capitalised as development amounted to 632 (2017: 556). The capitalised employee costs are mainly related to software project and the Deep Blue.
Note 11 – Financial items
The exchange rate effects in 2018 and 2017 are mainly related to bond loan, accounts receivables and trade payables in NOK in EMGS ASA, and accounts receivables and trade payables in NOK or other currencies than USD in other group companies.
Amounts in USD 1 000 2018 2017
Office rental and housing expenses 1,437 1,852
Consumables and maintenance 763 873
Consultancy fees * 1,680 1,868
Travel expenses 711 481
Insurance 507 407
Marketing 200 182
Other operating expenses 579 671
Total other operating expenses 5,877 6,334
* Fees to auditor included in consultancy fees:
Statutory audit services 158 153
Further assurance services 16 25
Tax advisory services 77 60
Total fees to auditor 251 237
Amounts in USD 1 000 2018 2017
Financial income:
Interest income on short term bank deposits 232 193
Foreign exchange gains related to loans and receivables 23,129 21,995
Currency gain on forward agreement 1,559 2,143
Total financial income 24,920 24,330
Financial expenses:
Interest expense on financial leases and bank borrowings 1,479 1,413
Interest expense on bonds 2,935 2,464
Foreign exchange losses related to loans and receivables 23,227 23,898
Foreign exchange losses related to liabilities at amortised cost 582 1,388
Financial costs repayment of bond 909 0
Other financial expenses 768 211
Total financial expenses 29,901 29,373
Net financial items -4,981 -5,043

66
Note 12 – Income tax expense
The expense/(benefit) for income taxes from continuing operations differs from the amount computed when applying the Norwegian statutory tax rate to income/(loss) before taxes as the result of the following:
Note 13 – Deferred tax
Deferred tax assets are recognised only to the extent that the realisation of the related tax benefit through the future taxable profits is probable.
Unused tax losses are generated in Brazil, Norway, Mexico, Malaysia and the US. It can be carried forward indefinitely in Brazil, Mexico, Norway and Malaysia whilst in the US it can be carried forward in 20 years. The Group’s temporary differences associated to investment in subsidiaries, for which deferred tax liability has not been recognised is immaterial both for 2018 and 2017. The current tax liabilities of 5 079 mainly consist of accruals for taxes related to operations in Brazil.
Amounts in USD 1 000 2018 2017
Change in deferred tax asset 0 0
Current tax - 50 356
Total income tax expense - 50 356
Amounts in USD 1 000 2018 2,017
Restated*
Income/(Loss) before tax -36,650 -22,850
Tax at the domestic rate of 23% -8,430 -5,484
Non-deductible expenses -121 -84
Change in non recognised deferred tax asset 4,478 1,646
Effect of change in tax rate 4,072 3,701
Effect of change in accounting principles 0 222
Foreign income taxes -50 356
Total tax charge -50 356
*See changes in accounting policies under note 2.18
Amounts in USD 1 000 2018 2017
Deferred taxes detailed:
Property, plant and equipment 974 263
Inventory -25 -26
Accrued foreign income taxes -1,117 -1,449
Loss carried forward -89,423 -83,901
Total deferred tax (asset)/liability -89,592 -85,113
Non-recognised deferred tax assets 89,592 85,113
Net deferred tax asset 0 0

67
Note 14 – Share capital, share premium and other paid in capital
In 2017, the Company’s shares capital was reduced by NOK 295 147 215 by way of a reduction of the nominal value of the shares from NOK 10.00 to NOK 1.00. No distribution was carried out in connection with the share capital reduction. The Company completed a rights issue in 2017. The rights issue resulted in gross proceeds to the Company of NOK 144 million (USD 17.7 million) through an issuance of 58 634 735 shares. In 2018, the Company completed a rights issue which resulted in gross proceeds to the Company of NOK 97 million (USD 11.9 million) through an issuance of 39 540 816 shares. The Board is granted authorisation to increase the share capital by 22,919,695 shares so the total authorised number of ordinary shares is 153 889 385 (2017: 98 831 473) with a par value of USD 0.12 (NOK 1) per share. Total number of shares as of 31 December 2018 is 130,969,690 (2017: 91,428,874). All issued shares are denominated in NOK and fully paid. The largest shareholders as of 31 December 2018:
Amounts in USD 1 000 (except number of shares)
Number of
shares
Ordinary share
capital Share premium
Other paid-in
capital Total
At 1 January 2017 32,794,139 39,365 261,230 18,688 319,283
Share capital reduction -36,187 0 36,187 0
Proceeds from shares issued 58,634,735 7,233 10,487 0 17,720
Cost of shares issued 0 0 -293 -293
Share-based payment 0 0 0 55 55
At 31 December 2017 91,428,874 10,411 271,717 54,637 336,764
At 1 January 2018 91,428,874 10,411 271,717 54,637 336,764
Proceeds from shares issued 39,540,816 4,874 7,067 0 11,941
Cost of shares issued 0 0 0 -205 -205
Share-based payment 0 0 0 -167 -167
Equity component of convertible loan 0 0 1,941 1,941
At 31 December 2018 130,969,690 15,285 278,784 56,206 350,274
Number of
ordinary shares Percentage
Siem Investments Inc. 31,327,467 23.92 %
Perestroika AS 29,452,795 22.49 %
Morgan Stanley & Co. LLC 25,891,805 19.77 %
Bækkelaget Holding AS 5,010,000 3.83 %
Sportsmagasinet AS 4,329,090 3.31 %
Rosenfonn Investering AS 2,148,705 1.64 %
NHO - P665AK 1,293,422 0.99 %
DNB Navigator (II) 1,169,175 0.89 %
SIX SIS AG 1,117,501 0.85 %
Nordnet Livsforsikring AS 800,941 0.61 %
Statoil Pensjon 701,458 0.54 %
Haav Holding AS 652,478 0.50 %
Kristian Falnes AS 564,932 0.43 %
Vestvik Preserving AS 558,799 0.43 %
Rygg, Jan Wiggo 550,260 0.42 %
Rage, Per Egil 509,535 0.39 %
Nordea Bank Abp 469,290 0.36 %
Sandbæk, Rune 466,530 0.36 %
Øverland, Jarle 457,039 0.35 %
Nordnet Bank AB 452,796 0.35 %
Other 23,045,672 17.60 %
Total 130,969,690 100.00 %
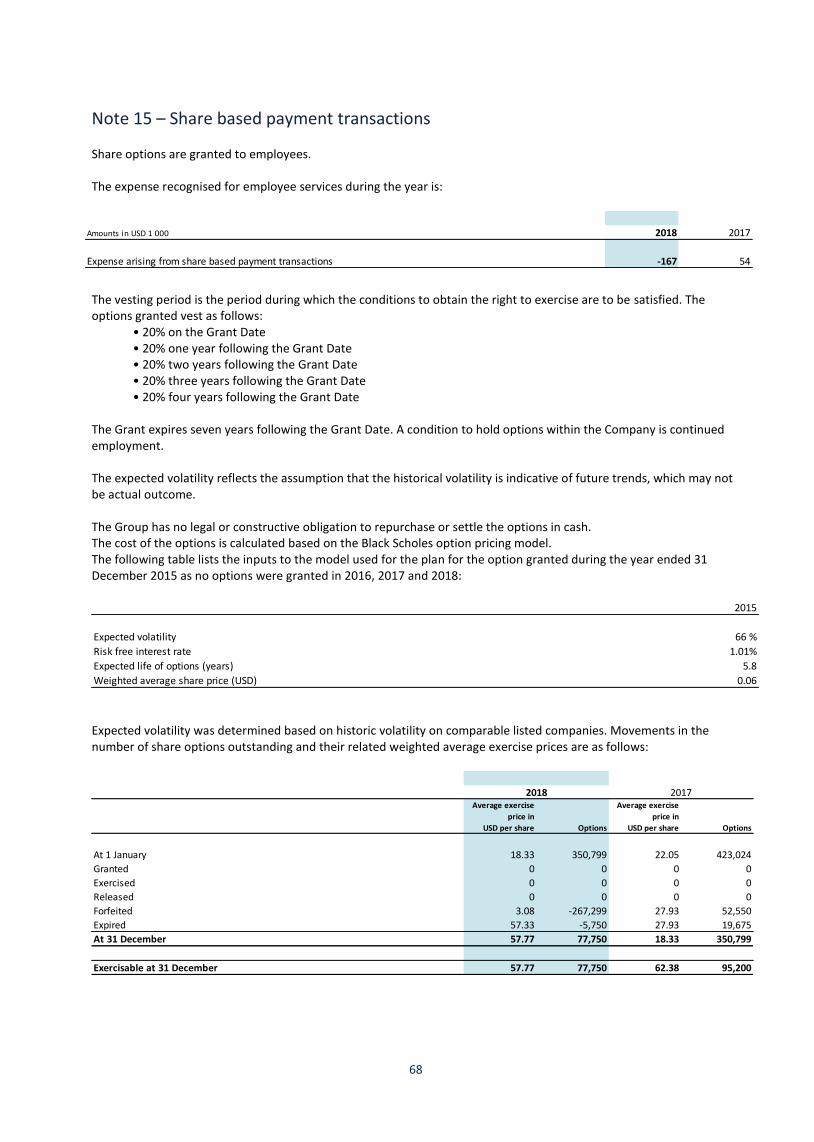
68
Note 15 – Share based payment transactions Share options are granted to employees. The expense recognised for employee services during the year is:
The vesting period is the period during which the conditions to obtain the right to exercise are to be satisfied. The options granted vest as follows:
• 20% on the Grant Date • 20% one year following the Grant Date • 20% two years following the Grant Date • 20% three years following the Grant Date • 20% four years following the Grant Date
The Grant expires seven years following the Grant Date. A condition to hold options within the Company is continued employment. The expected volatility reflects the assumption that the historical volatility is indicative of future trends, which may not be actual outcome. The Group has no legal or constructive obligation to repurchase or settle the options in cash. The cost of the options is calculated based on the Black Scholes option pricing model. The following table lists the inputs to the model used for the plan for the option granted during the year ended 31 December 2015 as no options were granted in 2016, 2017 and 2018:
Expected volatility was determined based on historic volatility on comparable listed companies. Movements in the number of share options outstanding and their related weighted average exercise prices are as follows:
Amounts in USD 1 000 2018 2017
Expense arising from share based payment transactions -167 54
2015
Expected volatility 66 %
Risk free interest rate 1.01%
Expected life of options (years) 5.8
Weighted average share price (USD) 0.06
Average exercise
price in
USD per share Options
Average exercise
price in
USD per share Options
At 1 January 18.33 350,799 22.05 423,024
Granted 0 0 0 0
Exercised 0 0 0 0
Released 0 0 0 0
Forfeited 3.08 -267,299 27.93 52,550
Expired 57.33 -5,750 27.93 19,675
At 31 December 57.77 77,750 18.33 350,799
Exercisable at 31 December 57.77 77,750 62.38 95,200
20172018

69
Share options outstanding at the end of the year have the following expiry date and exercise prices:
The weighted average remaining contractual life for the share options outstanding as at 31 December 2018 is 1,11 years (2017: 3.66 years). The weighted average fair value of options granted during the year 2015 was USD 0.05. No options were granted in 2016, 2017 and 2018.
Note 16 – Intangible assets
2018
In USD per share Options
2019 88.83 31,500
2020 41.42 21,250
2021 19.61 and 33.97 25,000
77,750
2017
In USD per share Options
2018 56.79 6,550
2019 93.68 38,500
2020 1.21 and 43.68 109,833
2021 1.21, 18.98, 20.68 and 35.82 112,583
2022 1.21 83,333
350,799
Amounts in USD 1 000
Software and
licenses Patents
Multi-client
library TotalRestated*
Year ended 31 December 2017
Opening carrying value 1,368 1,087 24,332 26,787
Additions 0 0 6,922 6,922
Transferred from assets under construction to intangible assets 290 0 0 290
Accumulated costs on disposals 0 0 0 0
Amortisation charge -1,050 -137 -10,345 -11,532
Accumulated depreciation on disposals 0 0 0 0
Impairment 0 0 -3,591 -3,591
Closing carrying value 609 950 17,317 18,876
At 31 December 2017
Accumulated cost 15,332 3,667 148,973 167,972
Accumulated amortisation and impairment -14,723 -2,717 -131,656 -149,096
Net carrying value 609 950 17,317 18,876
Year ended 31 December 2018
Opening carrying value 609 950 17,317 18,876
Additions 6 0 6,193 6,199
Transferred from assets under construction to intangible assets 604 0 0 604
Accumulated costs on disposals 0 0 0 0
Amortisation charge -644 -137 -10,914 -11,695
Accumulated depreciation on disposals 0 0 0 0
Impairment 0 0 0 0
Closing carrying value 575 813 12,596 13,984
At 31 December 2018
Accumulated cost 15,942 3,667 155,166 174,775
Accumulated amortisation and impairment -15,367 -2,854 -142,570 -160,791
Net carrying value 575 813 12,596 13,984
*See changes in accounting policies under note 2.18
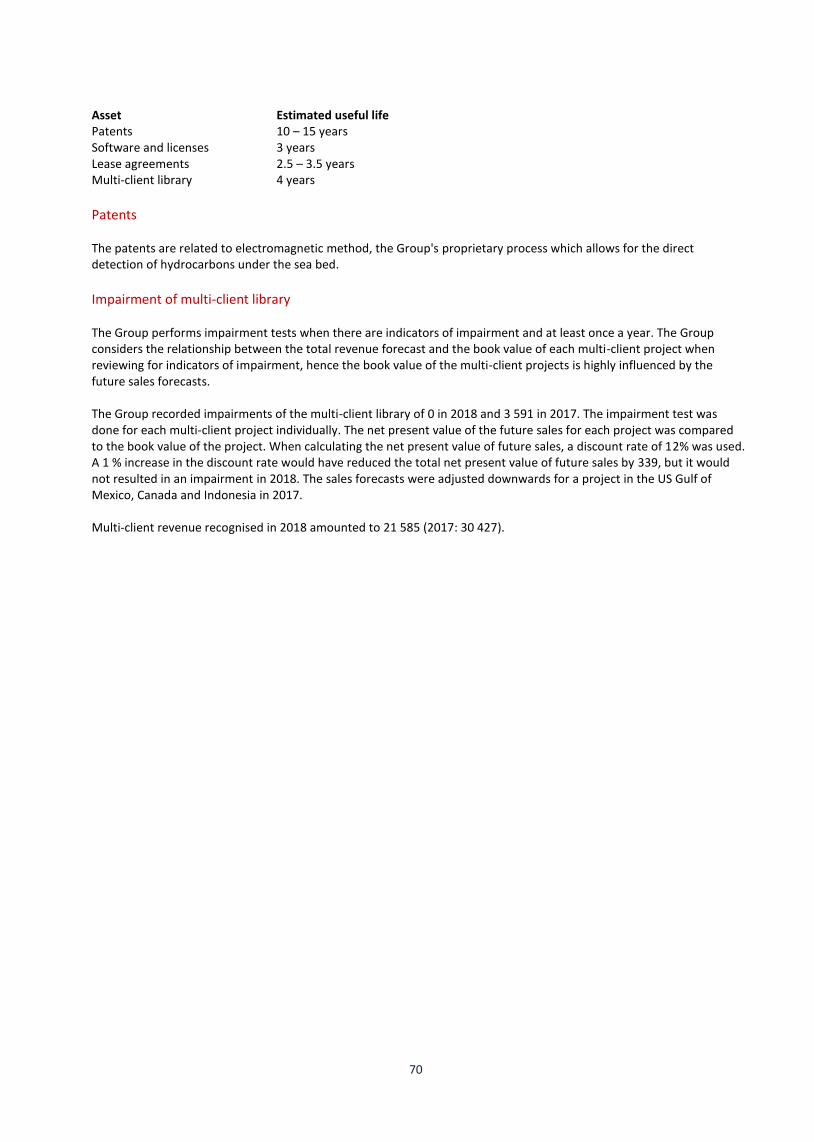
70
Asset Estimated useful life Patents 10 – 15 years Software and licenses 3 years Lease agreements 2.5 – 3.5 years Multi-client library 4 years
Patents
The patents are related to electromagnetic method, the Group's proprietary process which allows for the direct detection of hydrocarbons under the sea bed.
Impairment of multi-client library The Group performs impairment tests when there are indicators of impairment and at least once a year. The Group considers the relationship between the total revenue forecast and the book value of each multi-client project when reviewing for indicators of impairment, hence the book value of the multi-client projects is highly influenced by the future sales forecasts. The Group recorded impairments of the multi-client library of 0 in 2018 and 3 591 in 2017. The impairment test was done for each multi-client project individually. The net present value of the future sales for each project was compared to the book value of the project. When calculating the net present value of future sales, a discount rate of 12% was used. A 1 % increase in the discount rate would have reduced the total net present value of future sales by 339, but it would not resulted in an impairment in 2018. The sales forecasts were adjusted downwards for a project in the US Gulf of Mexico, Canada and Indonesia in 2017. Multi-client revenue recognised in 2018 amounted to 21 585 (2017: 30 427).

71
Note 17 – Property, plant and equipment and assets under construction
Asset Estimated useful life Machinery and equipment 3 – 8 years Hardware and furniture 3 - 5 years Cluster 5 years
Assets under construction Assets under construction are internal capital expenditure projects that are not completed. These projects are mainly development and production of acquisition the EM equipment, including receivers, the source and the navigation system, supporting a more efficient operation and improved data quality of 318 (2017: 2632), also interpretation and modelling software of 534 (2017: 478). In 2018, EMGS recorded an impairment of 2 544 which relates to hardware development cost that will not be commercialised. The impairment of 49 in 2017 was software development cost that will not be commercialised. The Deep Blue EMGS has been working on a Joint Industry Project (“the Deep Blue”), supported by Shell and Equinor, for developing the Next Generation EM equipment. The benefit of using the Deep Blue equipment is deeper penetration and significantly improved imaging at increased burial depths. The improved imaging leads to improved confidence and enhanced interpretation possibilities. The project commenced 2012 and the prototype equipment was completed in 2017 with its first commercial survey summer 2017. The carrying value of the Deep Blue equipment as of 31 December 2018 was 26 900 (2017: 31 735). See Note 25 for funding from the Deep Blue partners recorded as a contract liability. Impairment test of the Deep Blue The Group performs impairment tests when there are indicators of impairment and at least once a year. The Group considers the relationship between the total revenue forecast and the total carrying value of the Deep Blue when reviewing for indicators of impairment.
Amounts in USD 1 000
Machinery and
equipment
Hardware and
furniture Cluster Total
Assets under
construction
Year ended 31 December 2017
Opening carrying value 12,627 961 312 13,900 28,255
Additions 0 0 0 0 3,072
Accumulated costs on disposals 0 0 0 0 0
Transferred from assets under construction to PPE 27,925 0 0 27,925 -28,215
Depreciation charge -4,751 -502 -292 -5,545 0
Accumulated depreciation on disposals 0 0 0 0 0
Impairment 0 0 0 0 0
Closing carrying value 35,801 459 20 36,281 3,112
At 31 December 2017
Accumulated cost 153,492 23,900 12,375 189,767 3,112
Accumulated amortisation and impairment -117,691 -23,441 -12,355 -153,487 0
Net carrying value 35,801 459 20 36,281 3,112
Year ended 31 December 2018
Opening carrying value 35,801 459 20 36,280 3,112
Additions 11 172 0 183 1,423
Accumulated costs on disposals 0 -1,106 0 -1,106 0
Transferred from assets under construction to PPE 535 0 0 535 -1,139
Depreciation charge -6,449 -345 -20 -6,814 0
Accumulated depreciation on disposals 0 1,094 0 1,094 0
Impairment 0 0 0 0 -2,544
Closing carrying value 29,899 275 0 30,174 852
At 31 December 2018
Accumulated cost 154,038 22,966 12,375 189,379 3,396
Accumulated amortisation and impairment -124,140 -22,692 -12,375 -159,207 -2,544
Net carrying value 29,899 275 0 30,174 852

72
The recoverable amount of the Deep Blue equipment was higher than the book value as of 31 December 2018 and 2017, and no impairment was recorded. The recoverable amount was determined based on cash flow projections from the 2019 budget and assumptions regarding additional revenue stream from the Deep Blue equipment. The discount rate applied to cash flow projections was 12%.
The Company used the best estimate of additional revenue stream from the Deep Blue equipment compared with the conventional equipment as revenue forecast in the impairment model. The Deep Blue opens a new market for the Group as it increases the water depth from 3 000 meters as the limit on the conventional source to 4 500 meters on the Deep Blue source. The discount rate used in the net present value calculation was based on the specific circumstances of the Group and was derived from its weighted average cost of capital (WACC). The WACC took both debt and equity into account. The cost of equity was derived from the expected return on investment by the Group's investors. The cost of debt was based on the interest-bearing borrowings the Group is obliged to service. The beta factor was in line with the industry beta.
Sensitivity analysis for key assumptions The table below shows how the recoverable amount of 43 827 of the Deep Blue will be affected by changes in the various assumptions, given that the remainder of the assumptions are constant as of 31 December 2018:
Finance leasing included in property, plant and equipment
The amount of property, plant & equipment pledged as security for liabilities has a net carrying value of 238 as of 31 December 2018 (2017: 376).
Note 18 - Other receivables
Amounts in USD 1 000
Change in
recoverable
amount
Discount rate 1% increase -1,515
1% decrease 1,613
Dayrate 25,000 USD increase 7,296
25,000 USD decrease -7,296
Number of survey days per year 25 increase 10,425
25 decrease -10,425
Amounts in USD 1 000
Machinery and
equipment
Hardware and
furniture Total
Year ended 31 December 2017
Cost of capitalised finance leases 944 537 1,481
Accumulated depreciation -866 -239 -1,105
Net carrying value 78 298 376
Year ended 31 December 2018
Cost of capitalised finance leases 944 644 1,588
Accumulated depreciation -944 -406 -1,350
Net carrying value 0 238 238
Amounts in USD 1 000 2018 2017
Prepayments 2,763 4,243
Receivables VAT and taxes 1,074 553
Other receivables 1,018 1,161
Total other receivables 4,855 5,957

73
Note 19 – Spare parts, fuel, anchors and batteries
Note 20 – Trade receivables
Trade receivables are non-interest bearing and the payment terms are generally net 30 days. Fair value of the receivables approximates the nominal values, less provision for doubtful receivables. Generally, the Group trades with recognised, creditworthy customers. The customers are usually large oil companies with an appropriate credit history. Only in a few instances, services are performed for smaller companies with limited credit history. Per 31 December 2018 EMGS did not find it necessary to make any provision for doubtful trade receivables (2017: 0). As at 31 December, the aging analysis of trade receivables is as follows:
Note 21 – Cash and cash equivalents
Cash earns interest at floating rates based on daily bank deposit rates. Restricted cash consist of employee taxes withheld, loss on forward rate contract, and accrual of service taxes in Brazil, see Note 30. Accrual of service taxes in Brazil of 3 008 (2017: 3 524) is classified as long term restricted cash.
Note 22 – Employee benefit obligations The Company is required to have an occupational pension plan in accordance with the Norwegian law on required occupational pension ("lov om obligatorisk tjenestepensjon"). The Company's pension arrangements fulfill the requirements of the law.
Amounts in USD 1 000 2018 2017
Equipment components and parts, at cost 5,114 5,676
Anchors and batteries, at cost 1,100 876
Fuel, at cost 1,011 648
Total Spare parts, fuel, anchors and batteries 7,225 7,200
Amounts in USD 1 000 2018 2017
Accounts receivable 3,770 10,389
Accrued revenues 864 686
Total trade receivables 4,634 11,075
Amounts in USD 1 000 Total Not Due < 30 30 - 60 days 60 - 90 days 90 - 120 days > 120
3 770 3 435 304 31 0 0 0
Amounts in USD 1 000 2018 2017
Cash 6,487 16,548
Restricted cash 6,617 6,521
Total cash and cash equivalents 13,104 23,069

74
In 2018, the defined contribution plan involved a contribution level of 5 % of Base Salary from 0 to 7.1 G and 15 % of Base Salary from 7.1 up to 12 G, where G is the National Insurance basic amount (Folketrygdens grunnbeløp). G equals to NOK 96 883 as of 31 December 2018. The Company`s contribution to the Norwegian defined contribution plan for the year ended 31 December 2018 is 597. As of 31 December 2018, there are 69 employees covered by the defined contribution pension plan (2017: 77).
Defined contribution schemes Employees not eligible for coverage under the defined contribution plan applicable in Norway are eligible to participate in other Company pension schemes or to receive a pension compensation. All the schemes are considered defined contribution plans. For some of the schemes, subject to statutory limitations, employees may make voluntary contributions in addition to the Company’s contributions. Total pension scheme contributions made by the Company in 2018 is 892 (2017: 1 012).
Note 23 – Financial liabilities
USD 32.5 million convertible bond
On 9 May 2018, EMGS secured a USD 32.5 million convertible bond bearing an interest at 3 months LIBOR + 5.50% p.a. The loan can at any time be converted into common shares in EMGS at the conversion price of USD 0.42677 until the maturity date on 9 May 2023. The USD 32.5 million convertible bond can be seen as a contract settled by an entity by delivering a fixed amount of its own equity instruments in exchange for a fixed amount of foreign currency. The economic components of this convertible bond are: (a) A liability. On issuance of the convertible bond, the fair value of the liability component was determined using a
market rate for an equivalent non-convertible bond; and classified as a financial liability measured at amortised cost (net of transaction costs) until it is extinguished on conversion or redemption.
(b) An equity component. The residual of the proceeds was allocated to the conversion option that was recognised in shareholders’ equity.
At inception, the value of the liability component was estimated to USD 30.2 million, and amortised cost as 31 December 2018 was USD 30.8 million. The equity component, the carrying amount of the conversion option, was estimated to USD 1.9 million at inception and is not remeasured in subsequent periods. The convertible bond loan contains financial covenants requiring free cash and cash equivalents of at least USD 2.5 million. In addition, the bond agreement has restrictions regarding the Company's ability to sell the multi-client library,
Amounts in USD 1 000 Interest rate Maturity 2018 2017
Non-current
USD 32.5 million convertible bond 3 month LIBOR + 5.50% 09.05.2023 30,808 0
NOK 246 million bond 3 month NIBOR +6.00% 27.06.2019 0 29,812
Financial lease liabilites 3 month NIBOR +3.65% 2-5 years 238 476
Forward rate agreement 27.06.2019 0 2,993
31,046 33,281
Current
Financial lease liabilites 3 month NIBOR +3.65% Up to 1 year 303 290
303 290
Total financial liabilities 31,349 33,571

75
declare or make dividend payments, incur additional indebtedness, change its business or enter into speculative financial derivative agreements. As of 31 December 2018, the free cash and cash equivalents totalled USD 6.5 million. The bond is unsecured.
NOK 246 million bond
On 26 June 2013, EMGS secured a NOK 350 million bond bearing an interest at 3 months NIBOR + 6.00% p.a. On 22 December 2015, EMGS bought back NOK 80 million nominal outstanding amount at 80% of par. Following settlement, the nominal outstanding amount of the bond was NOK 270 million. In March 2017, the Company offered its bondholders to buy back in full their nominal outstanding amount at a price equivalent to 70% of the par value. The nominal amount of NOK 24 million was bought back, and the nominal amount outstanding decreased to NOK 246 million. On 7 June 2018, the Company repaid the NOK 246 million bond in full at 103% of par value (plus accrued interest). The bond was unsecured.
Forward rate agreement
In February 2015, EMGS entered into a forward rate agreement with the purpose of reducing its exposure to exchange rate fluctuations related to the bond loan in NOK. The Company paid the negative market value of the difference between NOK 270 million and NOK 246 million of USD 0.4 million when NOK 24 million of the bond was bought back in 2017. In 2018, EMGS paid the remaining negative market value of USD 1.4 million when the NOK 246 million bond loan was repaid and does not have any forward rate agreements as of 31 December 2018. The forward rate agreement was not treated as hedge, as the agreement was not specifically designated as hedge of firm commitments or certain cash flow. Consequently, the forward rate agreement was recorded at estimated fair value with gains and losses included in the line Net gains/(losses) of financial assets and liabilities in the Consolidated income statement.
Finance lease liabilities
The finance lease liabilities relate to certain property, plant and equipment and are capitalised leases for financial reporting purposes. The related leased property, plant and equipment serve as the collateral under such leases.
The exposure of the Group’s borrowings to interest rate changes related to floating rate obligations and the contractual repricing dates of those obligations at the balance sheet dates are as follows:
The maturity of non-current borrowings is as follows:
Amounts in USD 1 000 2018 2017
6 months or less 31,349 30,577
6-12 months 0 0
1-5 years 0 0
Over 5 years 0 0
Total 31,349 30,577
Amounts in USD 1 000 2018 2017
1-3 years 504 30,287
4-5 years 30,845 0
Over 5 years 0 0
Total 31,349 30,287

76
The carrying amounts and fair value of the non-current borrowings are as follows:
The fair value measurements are calculated using observable inputs (level 2). In 2017, the fair value was calculated based on the observable pricing of the bond closest to 31 December 2017, which was the 81.5% of par value in January 2017. There has not been any trading in the USD 32.5 million convertible bond after the issuance, hence the fair value is set to equal the carrying amount. The carrying amount of the Group’s borrowings are as follows:
The effective interest rates at the balance sheet date were as follows:
Fair values
The fair value hierarchy disclose how fair value is determined for financial instruments recorded at fair value in the consolidated financial statement. Level 1: quoted prices (unadjusted) in active markets for identical assets and liabilities. Level 2: assets and liabilities whose values are based on quoted prices in markets that are not active or model inputs that are observable either directly or indirectly. Level 3: techniques for which all inputs which have a significant effect on the recorded fair value that is not based on observable market data. The carrying amounts of cash and cash equivalents, restricted cash, trade receivables, other receivables, trade payables and other short-term liabilities approximate their respective fair values because of short maturities of those instruments. The fair value of the forward rate agreement was estimated using quotes obtained from dealers in such financial instruments. The carrying amounts, estimated fair values of the forward rate agreement including how fair value is determined are summarised as follows:
Amounts in USD 1 000
2018 2017 2018 2017
USD 32.5 million convertible bond 30,808 0 30,808 0
NOK 246 million bond 0 29,811 0 24,296
Leasing liabilities 541 766 541 766
Carrying amounts Fair values
Amounts in USD 1 000 2018 2017
USD denominated 30,808 0
NOK denominated 541 30,577
Total 31,349 30,577
2018 2017
USD 32.5 million convertible bond 10.41 % 0
NOK 246 million bond 0 7.82 %
Leasing liabilities 4.14 % 4.28 %
Amounts in USD 1 000
Carrying
amounts
Fair
values
Hierarchy
level
Carrying
amounts
Fair
values
Hierarchy
level
Financial liabilities measured at fair value
Forward rate agreement 0 0 2 2,993 2,993 2
31 December 2018 31 December 2017

77
Note 24 – Trade payables Trade payables are generally non-interest bearing and the payment terns are net 30 days. Fair value of the payables equals the nominal value of 6 819 (2017: 6 882).
Note 25 - Provisions The Group recognises a contract liability for prepayments from two customers in a joint industry project (the Deep Blue). EMGS and the two customers have decided to collaborate on the development, construction, and testing of an advanced marine electromagnetic acquisition system. The prototype completed in 2017 and the contract liability is being released to revenue over 8 years on a straight-line method, the same period and method as the prototype is being depreciated over. The Group has recognised 19 250 as provision for Deep Blue prepayments per 31 December 2018 (2017: 20 670).
Note 26 – Other short-term liabilities
Accrued expenses are generally on 30 days payment terms.
Note 27 – Finance lease agreements The Company has finance lease agreements for receiver systems, and IT hardware.
Note 28 - Contingencies The Group has contingent liabilities in respect of guarantees and matters arising in the ordinary course of business. It is not anticipated that any material liabilities will arise from the contingent liabilities.
Amounts in USD 1 000 2018 2017
Restated*
Accrued expenses 1,369 1,222
Holiday pay 1,088 1,051
Social security taxes and other public duties 4,529 4,989
Other short term liabilities 2,018 4,501
Total other short term liabilities 9,003 11,763
*See changes in accounting policies under note 2.18
Amounts in USD 1 000 2018 2017
Finance lease agrements – minimum lease payments:
No later than 1 year 319 317
After 1 year and no more than 5 years 251 498
After more than 5 years 0 0
Total minimum lease payments 570 815
Future finance charges on finance leases -29 -48
Present value of finance lease agreements 541 767
The present value of finance lease agreements is as follows:
No later than 1 year 303 290
After 1 year and no more than 5 years 238 477
After more than 5 years 0 0
Total present value of finance lease agreements 541 767

78
The Group has given guarantees in the ordinary course of business to third parties as specified below:
Guarantees on office premises are valid as long as the contracts are active. All guarantees are secured by bank guarantees.
Note 29 - Commitments Operating lease commitments: The Group has operating leases on charter hires, and office premises. The future aggregate minimum lease payments under non-cancellable operating leases are as follows:
Contract terms on renewal of the leases are to be negotiated at or before the expiry of the contracts. The charter hire contracts have renewal options of different durations. Operating leases recognised as expense in the period:
Note 30 – Legal claims EMGS is involved in the following legal processes:
EMGS is currently in a tax dispute with the City of Rio de Janeiro. The case involves the applicability of ISS (a municipal service tax). The entire claim amount of 3 008 has been placed in a judicial deposit to avoid interest and penalties. EMGS is involved in further litigation with the City of Rio de Janeiro related to the applicability of ICMS (a tax on sales and services) on the temporary importation of a surveying vessel in 2014. EMGS disputes the applicability of such tax, and the matter is currently being litigated before the Brazilian courts. If EMGS is unsuccessful in the defense against this claim, ICMS in an amount of approx. 377 (excluding interest and fines) will be payable. Based on advice from its local legal advisors, it is EMGS’ belief that it is more likely than not that the Company will be successful in these proceedings. Hence, no provision has been made for this claim. EMGS is furthermore engaged in several tax disputes with the Brazilian internal revenue service. These disputes are related to two main categories of claims by the IRS; (i) a non-approval by the IRS of certain tax offset requests by EMGS related to a credit of Social Contribution on Net Profits (all as provided for under Brazilian law); and (ii) payment of an administrative penalty fee of 50% over a previously disputed tax credit claim. EMGS disputes all of the claims received from the IRS and has initiated administrative proceedings in Brazil to that effect. Should EMGS ultimately be unsuccessful in disputing these claims, the aggregate potential additional tax liability amounts to approximately 306 (exclusive of interest and penalties).
Amounts in USD 1 000 2018 2017
Guarantees on client contracts 5,305 2,596
Other guarantees/collateral 631 631
Total guarantees 5,936 3,227
Amounts in USD 1 000 2018 2017
No later than 1 year 14,514 15,748
After 1 year and no more than 5 years 18,270 32,999
Total operating lease commitments 32,784 48,747
Amounts in USD 1 000 2018 2017
Charter hire 14,635 11,620
Office premises 1,117 1,502
Total operating leases recognised as expense 15,752 13,122

79
Note 31 – Earnings/(loss) per share Basic earnings/(loss) per share is calculated by dividing net profit attributable to ordinary equity holders of the Company by the weighted average number of ordinary shares outstanding during the year.
The Company has one category of dilutive potential ordinary shares: share options.
Note 32 – Related party transactions The Rights Issue completed in May 2018, were partially underwritten by Siem Invest Inc., Perestroika AS and RWC European Focus Master Inc. The underwriters received a guarantee commission of 1.5% of their guaranteed amount. The Bond Issue completed in May 208, were fully underwritten by the same underwriters. The underwriters received a guarantee commission of 1% of their guaranteed amount. The commissions were paid in 2018, hence no liabilities related to these commissions as of 31 December 2018.
Amounts in USD 1 000 2018 2017
Income/(loss) attributable to equity holders of the Company -36,599 -23,206
Basic earnings per share -0.31 -0.39
Diluted earnings per share -0.31 -0.39
Weighted average number of ordinary shares for the purpose of basic earnings per share (thousands) 116,345 59,782
Effect of dilutive potential shares:
Share options 0 0
Weighted average number of ordinary shares for the purpose of diluted earnings per share (thousands) 116,345 59,782
Amounts in USD 1 000 2018 2017
Siem Investments Inc. 145 85
Perestroika AS 145 85
RWC European Focus Master Inc. 115 85
Total guarantee commissions 405 255

80
Note 33 – Investment in subsidiaries
The Group consolidates Electromagnetic Geoservices Malaysia Sdn Bhd and emgs Shipping Mexico S. de R.L. de C.V. at 100 % as the Company has control over these companies. Side agreements show that EMGS has all the rights and obligations of 100 % ownership.
Note 34 – Events after the reporting period Multi-client sales to Equinor On 4 March, EMGS announced that EMGS and Equinor had entered into final contracts including data licensing sale of the Company’s existing multi-client library in the Barents Sea, Norwegian Sea and North Sea, as well as prefunding for a new multi-client acquisition in the North Sea. The combined gross contract value is approximately USD 8 million.
Proprietary data acquisition survey in south-east Asia
EMGS received a purchase order from an undisclosed customer for proprietary data acquisition survey in south-east Asia on 11 March 2019. The total value of the purchase order is approximately USD 24 million. The BOA Thalassa commenced the survey on 23 March 2019.
Multi-year acquisition contract
EMGS received a letter of award for a multi-year call-off acquisition contract, awarded by one of the world’s largest national oil companies. The letter of award has a minimum value of approximately USD 29.3 million, and a maximum value of approximately USD 73.3 million over a two year-period. Based on the current acquisition estimates, the Company expects that all or a substantial part of the minimum contract value will be recognised in 2019.
New guarantee facility
EMGS has secured a second guarantee facility to supplement the Company’s existing USD 10 million guarantee facility. The new guarantee facility (the “New Facility”) has a maximum limit of USD 7.5 million and is limited in scope to providing certain performance and warranty guarantees required under the multi-year acquisition contract above. The New Facility is provided by the Company’s existing bank. The New Facility is fully guaranteed by the Company’s three
Amounts in USD 1 000
Company
Share
ownership/
voting rights
2018
Share
ownership/
voting rights
2017
Equity 31
December
2018
Equity 31
December
2017 Location
emgs Americas 1 AS 100 % 100 % -615 -510 Trondheim, Norway
CSEM Production AS 100 % 100 % -10 -9 Trondheim, Norway
Sea Bed Logging - Data Storage Company AS 100 % 100 % -830 -829 Trondheim, Norway
Servicios Geologicos Electromagneticos do Brasil Ltda 100 % 100 % -11,887 -10,104 Rio de Janeiro, Brasil
emgs Americas Inc 100 % 100 % -1,174 -1,242 Delaware, USA
Electromagnetic Geoservices Malaysia Sdn Bhd 1%/100% 1%/100% 865 1,060 Kuala Lumpur, Malaysia
emgs Asia Pacific Sdn Bhd 100 % 100 % 1,285 1,158 Kuala Lumpur, Malaysia
emgs Australia Pty Ltd 100 % 100 % 104 105 Perth, Australia
EMGS Global AS 100 % 100 % 1,480 1,164 Trondheim, Norway
emgs Sea Bed Logging Mexico S.A. de C.V. 100 % 100 % -8,328 -7,855 Col. Del Valle, Mexico
emgs Shipping Mexico S. de R.L. de C.V. 99%/100% 99%/100% -893 -735 Col. Del Valle, Mexico
emgs Services Mexico S.A. de C.V. 99 % 99 % 231 309 Col. Del Valle, Mexico
emgs Labuan Ltd 100 % 100 % 882 902 Labuan, Malaysia
emgs Asia Pacific Labuan Ltd 100 % 100 % -420 -50 Labuan, Malaysia
EMGS Surveys AS 100 % 100 % 7,344 7,346 Trondheim, Norway
Electromagnetic Geoservices UK Ltd 100 % 100 % 3,505 3,300 London, UK
EM Multi-client AS 100 % 100 % 11,491 -28,225 Trondheim, Norway
Electromagnetic Geoservices Canada Inc 100 % 100 % -742 -1,137 British Columbia, Canada

81
largest shareholders (the “Shareholder Guarantors”). The shareholder guarantees will over time be replaced by a pledged deposit (the “Pledged Deposit”) to be built up by the Company, which will serve as security for the New Guarantee. A counter guarantee agreement entered into between EMGS and the Shareholder Guarantors regulates the Company’s obligations towards the Shareholder Guarantors in connection with the New facility. The Company will pay the Shareholder Guarantors a guarantee commission of 8% p.a. of the guaranteed amount. As the Pledged Deposit is built up, the guarantee commission will be reduced to 1.5% p.a. for such parts of the New Guarantee which are covered by the Pledged Deposit, and to 0% as the Shareholder Guarantors are released form their obligations towards the bank. A cash sweep mechanism has been agreed with the Shareholder Guarantors to ensure swift build-up of the Pledged Deposit. Under current estimates, the Company expects that the Pledged Deposit will reach the full USD 7.5 million during the course of the first quarter 2020. Under certain change of control events, including a sale by a Shareholder Guarantor of its shares in the Company, EMGS will be obligated to, within 30 days, replace the relevant Shareholder Guarantor with a new guarantor (or otherwise ensure the release of such Shareholder Guarantor’s obligations towards the bank).

Financial statements. EMGS ASA

83
Income Statement.
1 January - 31 December
Amounts in NOK 1 000 Note 2018 2017
Restated*
Operating revenues
Contract sales 1, 11 61,140 13,510
Multi-client sales 1, 11 177,192 241,597
Other revenue 1, 11 22,959 6,897
Total operating revenues 261,291 262,004
Operating expenses
Charter hire, fuel and crew expenses 4 147,039 51,721
Employee expenses 5, 6 130,975 133,557
Depreciation and ordinary amortisation 7 53,737 40,455
Multi-client amortisation 7 82,820 70,930
Impairment of long-term assets 7 14,622 7,444
Other operating expenses 4, 22 45,805 49,700
Total operating expenses 474,998 353,807
Operating income -213,707 -91,803
Financial income and expenses
Financial income 16 64,990 25,237
Financial expense 16 -301,121 -106,596
Net financial items -236,131 -81,359
Income/(loss) before income tax -449,838 -173,161
Income tax expense 8 -92 6,837
Income/(loss) for the year -449,747 -179,998
*See changes in accounting policy under notes

84
Balance Sheet.
As of 31 December
As of
Amounts in NOK 1 000 Note 2018 2017 1 January 2017
Restated* Restated*
ASSETS
Non-current assets
Intangible assets 7 67,893 102,426 129,090
Property, plant and equipment 7, 9 204,926 248,835 86,455
Assets under construction 7 7,000 18,168 189,021
Investments in subsidiaries 10 955 1,438 1,371Total non-current assets 280,774 370,866 405,937
Current assets
Spare parts, fuel, anchors and batteries 3 50,558 47,573 52,899
Trade receivables 9, 11, 12 38,839 72,666 18,501
Receivables group companies 12, 23 359,411 542,130 694,654
Other receivables 18 17,126 19,840 23,429
Cash and cash equivalents 44,131 92,266 41,349
Restricted cash 13 30,664 24,973 11,029
Total current assets 540,729 799,448 841,861
Total assets 821,504 1,170,314 1,247,798
*See changes in accounting policy under notes

85
Balance Sheet.
Oslo, 26 April 2019 Board of Directors and CEO of Electromagnetic Geoservices ASA Sign.
As of 31 December
As of
Amounts in NOK 1 000 Note 2018 2017 January 1 2017
Restated* Restated*
EQUITY
Paid-in-capital
Share capital 14, 15 130,970 91,429 327,941
Share premium 14, 15 1,029,041 971,707 886,687
Other paid-in-capital 14, 15 415,466 402,789 109,560
Total paid-in-capital 1,575,477 1,465,925 1,324,188
Retained earnings
Other equity 15 -1,366,168 -914,700 -742,647Total retained earnings -1,366,168 -914,700 -742,647
Total equity 209,309 551,225 581,541
LIABILITIES
Non-current liabilities
Provisions 19 167,302 170,340 165,472
Borrowings 7, 17 269,828 249,538 273,296
Financial liabilities 17 0 24,668 40,360Total non-current liabilities 437,130 444,546 479,128
Current liabilities
Trade payables 57,354 47,699 53,929
Payable group companies 23 55,592 42,000 56,496
Current tax liabilities 12,028 17,695 12,059
Public taxes and duties payable 20 12,974 13,769 16,437
Other current liabilities 21 34,483 51,031 46,110
Borrowings 17 2,634 2,348 2,100Total current liabilities 175,065 174,543 187,129
Total liabilities 612,194 619,089 666,257
Total equity and liabilities 821,504 1,170,314 1,247,798
*See changes in accounting policy under notes

86
Cash Flow Statement.
1 January - 31 December
Amounts in NOK 1 000 2018 2017
Restated*
A) Cash flow from operating activities
Funds sourced from operations *) -275,560 -64,406
Changes in inventories, accounts receivable and accounts payables 236,808 82,959
Other changes in working capital -13,318 220,684
Net cash flow from operating activities -52,070 239,237
B) Cash flow from investing activities
Purchase of property, plant and equipment -20,768 -238,805
Investment in multi-client library -48,950 -57,036
Net cash flow from investing activities -69,718 -295,841
C) Cash flow from financial activities
Proceeds from issuance of ordinary shares 95,214 141,318
Proceeds from new loan 261,948 -2,088
Repayment of loan -256,728 0
Payment of interests on loans and financial leases -18,711 -17,766
Financial lease payments -2,381 0
Net cash flow from financial activities 79,342 121,464
A+B+C) Net change in cash and cash equivalents -42,445 64,860
Cash and cash equivalents as 01.01 117,239 52,379
Cash and cash equivalents as 31.12 74,794 117,239
Calculation of cash amd cash equivalents
Cash and cash equivalents 44,131 92,266
Restricted cash 30,664 24,973
Cash and cash equivalents 31.12 74,795 117,239
*) Calculation of funds sourced from operations
Income/(loss) before income tax -449,838 -173,161
Depreciation and amortisation 136,557 111,385
Income tax expense 92 -6,837
Impairment of long-term assets 14,622 7,444
Cost of share-based payment -1,493 419
Amortisation of interest 24,500 20,269
Financial gain on repayment of bond 0 -23,925
-275,560 -64,406
*See changes in accounting policy under notes

87
Notes.
Accounting Principles
The financial statements have been prepared in accordance with the Norwegian Accounting Act and generally accepted
accounting principles in Norway.
Use of estimates
The management has used estimates and assumptions that have had an impact on assets, liabilities, income, expenses
and information on potential liabilities in accordance with generally accepted accounting principles in Norway.
Business combinations
Business combinations are accounted for using the acquisition method. The cost of an acquisition is measured as the
aggregate of the consideration transferred, measured at acquisition date fair value. Acquisition costs incurred are
expensed and included in other operating expenses.
When the Company acquires a business, it assesses the financial assets and liabilities assumed for appropriate
classification and designation in accordance with the contractual terms, economic circumstances and pertinent conditions
as at the acquisition date.
Revenue recognition
Revenue from contracts with customers is recognised when control of the goods and services are transferred to the customer at an amount that reflects the consideration to which the Company expects to be entitled in exchange for those goods or services. Revenue is recognised as follows:
a) Proprietary contract sales EMGS performs EM services under contract for a specific customer, whereby the EM data is owned by the customer. The Company recognises contract revenues (whether priced as Lump Sum, Day Rate or Unit Price) over time. Progress is measured in a manner generally consistent with the physical progress on the project. Mobilisation Fees Revenues for mobilisation are usually contracted with the customer and should cover the vessel’s transit to the actual area. Revenues and costs related to mobilisation are deferred and recognised over the acquisition period (which is the time from the first receiver is dropped to the last retrieval) of the contract, using the percentage of completion method. The deferral of mobilisation costs can only begin after an agreement has been signed between EMGS and the client. Until a contract is signed, costs are expensed as incurred.
b) Sales of multi-client library data Pre-funding agreements Sales made prior to commencement of acquisition for a project and sales while the projects are in progress, are presented as pre-funding revenues. The advantages for pre-funding customers are generally the possibility to influence the project specifications, early access to acquired data, and discounted prices. The Company recognises pre-funded revenue at the point in time when data is made accessible to the customer.

88
Late sales Customers are granted a license from the Company which entitles them to access a specific part of the multi-client data library. The license payment is fixed and is required when the license is granted. The late sale revenue is recognised when a valid licensing agreement is signed, and the multi-client library data is made accessible to the customer. Uplift Uplift revenues can arise if a customer that has already bought a license for EM data, is awarded acreage covered by the data bought. Uplift revenue is recognised when the customer is awarded the acreage. Contract balances Contract assets A contract asset is the right to consideration in exchange for goods or services transferred to the customer. If the Company performs by transferring goods or services to a customer before the customer pays consideration or before payment is due, a contract asset is recognised for the earned consideration that is conditional. Trade receivables A receivable represents the Company’s right to an amount of consideration that is unconditional (i.e., only the passage of time is required before payment of the consideration is due). Contract liabilities A contract liability is the obligation to transfer goods or services to a customer for which the Company has received consideration (or an amount of consideration is due) from the customer. If a customer pays consideration before the Company transfers goods or series to the customer, a contract liability is recognised when the payment is made, or the payment is due (whichever is earlier). Contract liabilities are recognised as revenue when the Company performs under the contract.
Balance sheet classification
Current assets and short term liabilities consist of receivables and payables due within one year, and items related to the
inventory cycle. Other balance sheet items are classified as fixed assets / long term liabilities.
Current assets are valued at the lower of cost and fair value. Short term liabilities are recognised at nominal value.
Fixed assets are valued at cost, less depreciation and impairment losses. Long term liabilities are recognised at nominal
value.
Subsidiaries
Subsidiaries are valued at cost in the Company's accounts. The investments are valued at the cost of acquiring shares in
the subsidiary or joint venture, provided that no write down is required. A write down to fair value will be carried out if
the reduction in value is caused by circumstances which may not be regarded as incidental and deemed necessary by
generally accepted accounting principles. Write downs will be reversed when the cause of the initial write down is no
longer present.
Foreign currency translation
Transactions in foreign currency are translated at the rate applicable on the transaction date. Monetary items in a foreign
currency are translated into NOK using the exchange rate applicable on the balance sheet date. Non-monetary items that
are measured at their historical price expressed in a foreign currency are translated into NOK using the exchange rate
applicable on the transaction date. Non-monetary items that are measured at their fair value expressed in a foreign
currency are translated at the exchange rate applicable on the balance sheet date. Changes to exchange rates are
recognised in the income statement as they occur during the accounting period.

89
Property, plant and equipment Property, plant and equipment are capitalised and depreciated linearly over the estimated useful life. Significant fixed assets which consist of substantial components with dissimilar economic life have been unbundled; depreciation of each component is based on the economic life of the component. Costs for maintenance are expensed as incurred, whereas costs for improving and upgrading property, plant and equipment are added to the acquisition cost and depreciated with the related asset. If carrying value of a non-current asset exceeds the estimated recoverable amount, the asset is written down to the recoverable amount. The recoverable amount is the greater of the net realisable value and value in use. In assessing value in use, the discounted estimated future cash flows from the asset are used.
Research and development Development costs are capitalised provided that a future economic benefit associated with development of the intangible asset can be established and costs can be measured reliably. Otherwise, the costs are expensed as incurred. Capitalised development costs are amortised linearly over its useful life. Research costs are expensed as they are incurred.
Multi-client library The multi-client library consists of surveys of electromagnetic data. The surveys can be licensed to customers on a non-exclusive basis. Directly attributable costs associated with the production and development of multi-client projects such as acquisition costs, processing costs, and direct project costs are capitalised. A multi-client project is considered complete when all components or processes associated with the acquisition and processing of the data are finished, and all components of the data have been properly stored and made ready for delivery to customers. After a project is completed, a straight-line amortisation is applied. The straight-line amortisation is assigned over the useful life, which is set at four years. The straight-line amortisation is distributed evenly through the financial year independently of sales during the quarters.
Leased assets Leases that provide EMGS with substantially all the rights and obligations of ownership are accounted for as finance leases. Such leases are valued at the present value of minimum lease payment and recorded as assets under tangible assets. The assets are subsequently depreciated, and the related liabilities are reduced by the amount of the lease payments less the effective interest expense. Other leases are accounted for as operating leases with lease payments recognised as an expense over the lease term.
Inventories
Inventories are valued at the lower of cost or net selling price. The selling price is the estimated selling price in the case of ordinary operations minus the estimated completion, marketing and distribution costs. The cost is arrived at using the FIFO method and includes the costs incurred in acquiring the goods and the costs of bringing the goods to their current state and location.
Trade and other receivables
Trade receivables and other current receivables are recorded in the balance sheet at nominal value less provisions for doubtful accounts. Provisions for doubtful accounts are based on an individual assessment of the different receivables.
Income tax Tax expenses in the profit and loss accounts comprise of both tax payable for the accounting period and changes in deferred tax. Deferred tax/tax assets are calculated on all differences between the book value and tax value of assets and liabilities.

90
Deferred tax is calculated at 23 percent on the basis of existing temporary differences and the tax effect of tax losses carried forward. Temporary differences, both positive and negative, that will reverse within the same period, are recorded net. Deferred tax assets are recorded in the balance sheet when it is more likely than not that the tax assets will be utilised. Taxes payable and deferred taxes are recognised directly in equity to the extent that they relate to equity transactions.
Share based payments Options for employees are valued at the fair value of the option at the time the option plan is adopted. The Black -Scholes model is used for valuation of options. The cost of the options is allocated over the period during which the employees earn the right to receive such options. This arrangement is presented as other paid-in capital in the balance sheet. Provisions are made for the social security taxes related to the share option plan, which are related to the difference between the issue price and the market price of the share at year-end, on the basis of the vesting period of the program.
Provisions Provisions are recognised when the Company has a present obligation as a result of a past event, where it is probable that an outflow of resources embodying economic benefits will be required to settle the obligation and a reliable estimate can be made of the amount of the obligation. Provisions for loss on contracts are recognised when it is clear that the contract will result in a loss. The calculation is made by comparing the contracted revenues to the expected direct operating costs for the contract period.
Cash flow statement The cash flow statement is presented using the indirect method. Cash and cash equivalents include cash and bank deposits.
Changes in accounting policy The Company applied a new revenue recognition policy for the first time in 2018. The nature and effect of the changes as a result of adoption of the policy is described below. Under the new revenue recognition policy, revenue is recognised at an amount that reflects the consideration to which an entity expects to be entitled in exchange for transferring goods and services to a customer. The Company adopted the new policy using the full retrospective method. For proprietary contract sales and late sales, there were no material effects following the implementation of the new revenue recognition. Multi-client prefunding revenues are recognised at the point in time when final product is delivered to the customer and not based on the so-called Percentage of Completion (POC) principle, which was used prior to 1 January 2018. As a consequence of the change in POC revenue, the Company has also capitalised multi-client projects with only one customer that were previously expensed as incurred (converted contracts). For these, the full amortisation of the book value is now recorded at the point in time when the revenues are recognised at delivery to the customer.

91
Impact on income statement (increase/(decrease) in profit):
Impact on the statement of financial position (increase/(decrease)):
31 December 2017 Adjustments 31 December 2017
Amounts in NOK 1 000 Adjustments Audited IFRS 15 Unaudited
Restated*
Operating revenues
Other revenue 178,244 0 178,244
Multi-client pre-funding a) 99,714 -15,953 83,761
Total Revenues 277,957 -15,953 262,004
Operating expenses
Charter hire, fuel and crew expenses b) 73,490 -21,770 51,720
Employee expenses b) 134,314 -757 133,557
Multi-client amortisation b) 56,840 14,090 70,930
Other operating expenses 97,599 0 97,599
Total operating expenses 362,243 -8,436 353,807
Operating profit/(loss) -84,286 -7,517 -91,803
Net financial items -81,359 0 -81,359
Net income/(loss) before taxes -165,646 -7,517 -173,161
Income tax expense 6,837 0 6,837
Income profit/(loss) for the year -172,482 -7,517 -179,998
1 January 2017 Adjustments 1 January 2017 31 December 2017 Adjustments 31 December 2017
Amounts in USD 1 000 Adjustments Audited IFRS 15 Unaudited Audited IFRS 15 Unaudited
Restated* Restated*
ASSETS
Non-current assets
Multi-client l ibrary b) 112,710 0 112,710 83,257 8,436 91,693
Other 293,227 0 293,227 279,173 0 279,173
Total non-current assets 405,937 0 405,937 362,430 8,436 370,866
Total current assets 841,861 0 841,861 799,448 0 799,448
Total assets 1,247,798 0 1,247,798 1,161,878 8,436 1,170,314
EQUITY
Capital and reserves attributable to equity holders
Retained earnings a),b) -737,937 -4,710 -742,647 -902,473 -12,227 -914,700
Other 1,324,188 0 1,324,188 1,465,925 0 1,465,925
Total equity 586,251 -4,710 581,541 563,452 -12,227 551,225
LIABILITIES
Total non-current liabilities 479,128 0 479,128 444,546 0 444,546
Current liabilities
Other short term liabilities a) 41,400 4,710 46,110 30,368 20,663 51,031
Other 141,019 0 141,019 123,512 0 123,512
Total current liabilities 182,419 4,710 187,129 153,880 20,663 174,543
Total liabilities 661,547 4,710 666,257 598,426 20,663 619,089
Total equity and liabilities 1,247,798 0 1,247,798 1,161,878 8,436 1,170,314

92
The nature of these adjustments is described below:
a) Multi-client pre-funding revenues Prior to adopting IFSR 15, the Company recognised pre-funding revenue based on the Percentage of Completion (POC) principle. Under IFRS 15, the pre-funding revenues are recognised at the point in time when the final product is delivered to the customer, hence, pre-funding revenues for data acquired in one year and delivered to the customer in the next year are adjusted in the restated numbers.
b) Capitalisation and amortisation of multi-client projects As a consequence of the change in the pre-funding revenue recognition, the company has now capitalised multi-client projects with no expectations of future sales. These capitalized expenses have previously been expensed as incurred (converted contracts). A full amortisation of the value is now recorded at the point in time when the revenues are recognised at delivery to the customer.
Note 1 – Operating revenues
821 of the 261 291 in total operating revenues in 2018, was intercompany revenues (2017: 11 263). The Company consists of one business area only. EMGS operates globally.
Note 2 – Shared revenue The Company has since 2013 entered several cooperation agreements regarding EM multi-client surveys in the Barents Sea and Brazil. EMGS has received funding and/or seismic data against a revenue share on prefunding, late sales and uplift revenues. EMGS has provided the vessel, performed the data acquisition and finally provided the data processing services. The acquired data remains the property of EMGS. When EMGS licenses data to customers in areas subject to revenue sharing, the Company invoices and collects payments from the customers for the entire sales amount. The related accounts receivable is presented gross, while the portion due to the partner upon collection from the customer, is presented as a short-term liability. EMGS' share of the revenue from the sale of multi-client library with cooperation agreements in 2018 is 34 671 (2017: 57 062).
Amounts in NOK 1 000 2018 2017
Regions Restated*
Europe, Middle East and Africa 167,035 255,050
North and South America 75,146 3,913
Asia and the Pacific Ocean 19,110 3,041
Total 261,291 262,004
*See changes in accounting policy under notes
EMGS'
revenue share
Multi-client survey
Brazil 2013 95%
Barents Sea 2013 70%
Barents Sea 2014 50%
Barents Sea 2015 50%
Barents Sea 2016 50%
Barents Sea 2017 50%

93
Note 3 – Spare parts, fuel, anchors and batteries
Note 4 – Operating leases
Note 5 – Pensions The Company is required to have an occupational pension plan in accordance with the Norwegian law on required
occupational pension ("lov om obligatorisk tjenestepensjon"). The Company's pension arrangements fulfill the
requirements of the law.
In 2018, the pension plan involved a contribution level of 5 % of Base Salary from 0 to 7.1 G and 15 % of Base Salary from
7.1 up to 12 G, where G is the National Insurance basic amount (Folketrygdens grunnbeløp). G is equal to NOK 96 883 as
of 31 December 2018.
The Company`s contribution to the Norwegian defined contribution plan for the year ended 31 December 2018 is 4 854.
As of 31 December 2018, there are 69 employees covered by the defined contribution pension plan (2017: 77).
Note 6 – Remuneration The average number of employees during 2018 was 99.
Amounts in NOK 1 000 2018 2017
Inventory type
Equipment, components and parts 32,269 34,888
Anchors and batteries 9,557 7,194
Fuel 8,732 5,491
Total 50,558 47,573
Amounts in NOK 1 000 2018 2017
Operating leases recognised as expense in the period
Charter hire 119,314 76,135
Office premises 6,808 8,501
Total 126,122 84,636
Amounts in NOK 1 000 2018 2017
Employee expenses: *Restated
Salaries 109,949 110,390
Payroll tax 13,276 12,032
Pension costs 5,183 5,475
Other payments 2,567 5,661
Total 130,975 133,557
*See changes in accounting policy under notes
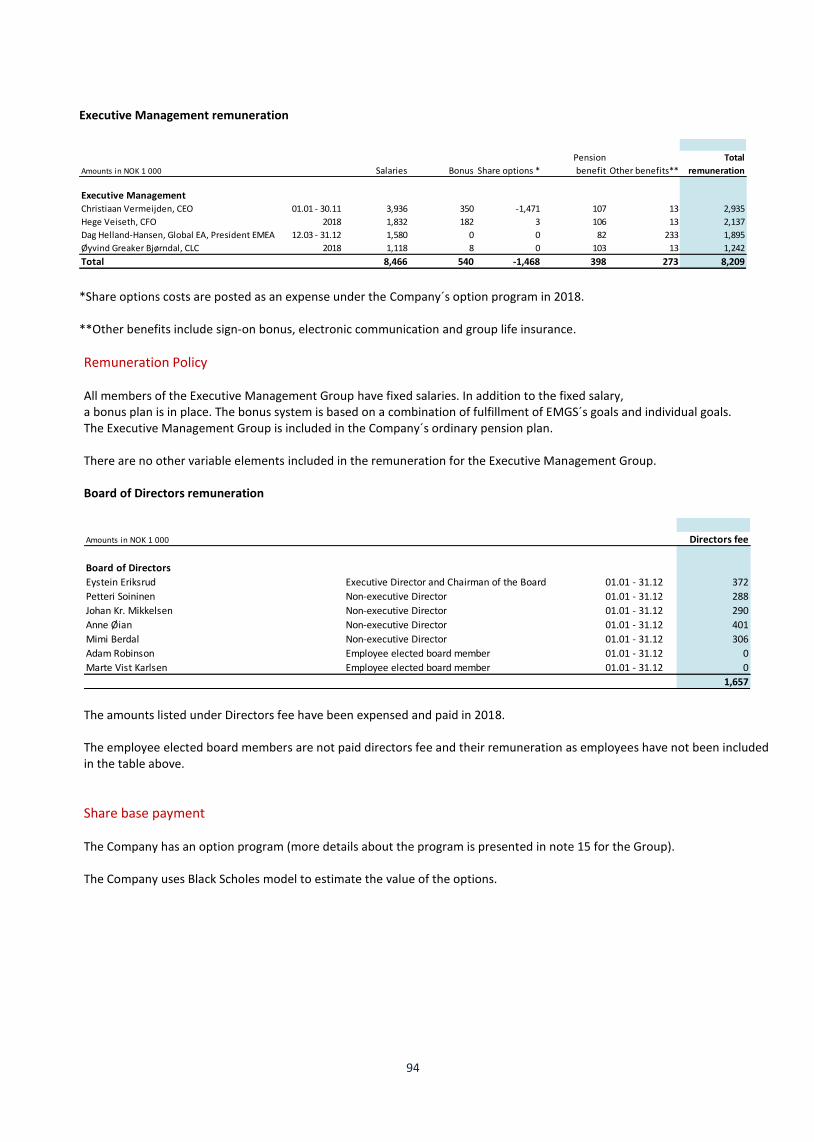
94
Executive Management remuneration
*Share options costs are posted as an expense under the Company´s option program in 2018. **Other benefits include sign-on bonus, electronic communication and group life insurance.
Remuneration Policy All members of the Executive Management Group have fixed salaries. In addition to the fixed salary, a bonus plan is in place. The bonus system is based on a combination of fulfillment of EMGS´s goals and individual goals. The Executive Management Group is included in the Company´s ordinary pension plan. There are no other variable elements included in the remuneration for the Executive Management Group. Board of Directors remuneration
The amounts listed under Directors fee have been expensed and paid in 2018. The employee elected board members are not paid directors fee and their remuneration as employees have not been included in the table above.
Share base payment The Company has an option program (more details about the program is presented in note 15 for the Group). The Company uses Black Scholes model to estimate the value of the options.
Amounts in NOK 1 000 Salaries Bonus Share options *
Pension
benefit Other benefits**
Total
remuneration
Executive Management
Christiaan Vermeijden, CEO 01.01 - 30.11 3,936 350 -1,471 107 13 2,935
Hege Veiseth, CFO 2018 1,832 182 3 106 13 2,137
Dag Helland-Hansen, Global EA, President EMEA 12.03 - 31.12 1,580 0 0 82 233 1,895
Øyvind Greaker Bjørndal, CLC 2018 1,118 8 0 103 13 1,242
Total 8,466 540 -1,468 398 273 8,209
Amounts in NOK 1 000 Directors fee
Board of Directors
Eystein Eriksrud Executive Director and Chairman of the Board 01.01 - 31.12 372
Petteri Soininen Non-executive Director 01.01 - 31.12 288
Johan Kr. Mikkelsen Non-executive Director 01.01 - 31.12 290
Anne Øian Non-executive Director 01.01 - 31.12 401
Mimi Berdal Non-executive Director 01.01 - 31.12 306
Adam Robinson Employee elected board member 01.01 - 31.12 0
Marte Vist Karlsen Employee elected board member 01.01 - 31.12 0
1,657

95
B – average exercise price for number of options by 31 December 2018.
Loans and guarantees No loans or loan guarantees have been granted to the Executive Management of the Board of Directors or other related parties.
Auditor expense
Note 7 – Tangible and intangible assets
Depreciation/amortisation of fixed assets is calculated using the straight-line method. The registered patents rights relate to electromagnetic surveys (EM).
Amounts in NOK 1 000
Number of
options OB
Forfeited
options
Excercised
options
Number of
options CB
Weighted
average
excercise price
B
Weighted
average
remaining
contractual life
Executive Management
Bjørn Petter Lindhom 10,000 0 0 10,000 446.80 1.19
Hege Veiseth 1,875 0 0 1,875 454.13 2.19
Board of Directors
Adam Robinson 3,175 -50 0 3,125 416.48 1.40
Marte Vist Karlsen 1,875 -625 0 1,250 533.60 1.17
Amounts in NOK 1 000 2018 2017
Auditor expenses
Statutory audit services (excl VAT) 1,100 1,080
Tax advisory services (excl VAT) 626 431
Further assurance services (excl VAT) 128 203
Total 1,854 1,714
Amounts in NOK 1 000
Property,
plant and
equipment Patents
Software
licenses etc.
Multi-client
library Total
Assets under
construction
Acquisition cost at 1 January 2018 1,119,021 26,416 88,021 629,583 1,863,041 18,168
Adjustment of opening value 0 0 0 0 0 0
Purchases 4,171 0 4,995 48,950 58,116 11,602
Disposals -5,945 0 0 0 -5,945 -8,148
Acquisition cost at 31 December 2018 1,117,247 26,416 93,016 678,533 1,915,212 21,622
Accumulated depreciation 1 January 2018 (Restated*) 870,186 20,327 83,377 537,890 1,511,780 0
Depreciation/amortisation for the year 48,080 761 4,896 82,820 136,557 0
Disposals -5,945 0 0 0 -5,945 0
Impairment 0 0 0 0 0 14,622
Accumulated depreciation 31 December 2018 912,321 21,088 88,273 620,710 1,642,392 14,622
Net carrying value 204,926 5,327 4,742 57,824 272,820 7,000
Depreciation rate (%) 13-33 7-10 33 25
*See changes in accounting policy under notes

96
The Deep Blue EMGS has been working on a Joint Industry Project (“the Deep Blue”), supported by Shell and Equinor, for developing the Next Generation EM equipment. The benefit of using the Deep Blue equipment is deeper penetration and significantly improved imaging at increased burial depths. The improved imaging leads to improved confidence and enhanced interpretation possibilities. The project commenced 2012 and the prototype equipment was completed in 2017 with its first commercial survey summer 2017. The Group carrying value of the Deep Blue equipment, recorded under Property, plant, and equipment, as of 31 December 2018 was 180 978 (2017: 209 136) (more details about the Deep Blue in presented in note 17 for the Group).
Assets under construction Assets under construction are internal capital expenditure projects that are not completed. These projects are mainly development and production of acquisition equipment, but also interpretation and modelling software.
Finance leases Finance leases are capitalised at the lease’s commencement at the lower of the present value and cost. The leasing contracts have a duration of 5 years and the asset will be depreciated over a 3-5-year period. The terms of the agreements are 3 months NIBOR + 2,60%, 2,80% and 3,42%
Amounts in NOK 1 000 2018 2017
Capitalised in the balance sheet 31 December 12,419 11,547
Accumulated depreciation -10,682 -8,540
Net carrying value 1,737 3,007
Depreciation 2,142 3,849
Amounts in NOK 1 000 2018 2017
Nominal Present Nominal Present
value value value value
Leases due within 12 months 2 769 2 632 2 572 2 348
Leases due within the next 13-60 months 2 364 2 070 4 033 3 864
Remaining debt on leasing contracts 31 December 5 133 4 702 6 605 6 212
Amounts in NOK 1 000 2018 2017
Specification of R&D expenses
External expenses 1,145 -95
Materials 2,146 1,622
Internal hours 6,359 6,725
Total 9,650 8,252

97
Note 8 – Income taxes
Unused tax losses can be carried forward indefinitely. Note 9 – Collaterals
There are no long-term liabilities due in more than five years from 31 December 2018 or 31 December 2017.
Amounts in NOK 1 000 2018 2017
Restated*
Tax base specification
Profit before tax -449,838 -173,161
Permanent differences 208,393 24,263
Changes in temporary differences -25,481 -67,084
Tax expense abroad, paid 0 0
Taxable profit (this year tax base) -266,927 -215,982
Tax losses carried forward 266,927 215,982
Taxable profit (this year tax base) 0 0
Income tax expenses:
Non-creditable foreign income taxes -92 6,837
Total income tax expense -92 6,837
Temporary differences
Fixed assets -66,115 -85,935
Accounts receivable 0 0
Inventory -1,004 -930
Provisions tax liability abroad -10,700 -16,436
Other accruals -490 -490
Tax losses carried forward -1,537,868 -1,258,714
Total temporary differences -1,616,177 -1,362,504
Non-recognised deferred tax asset -355,559 -313,376
Non-recognised deferred tax asset
Amounts in NOK 1 000 Tax base 23% tax
Explanation why the tax is not 23% of income before tax
23% tax of income before tax -449,838 -103,463
Permanent difference 47,930
Change in deferred tax assets, not recognised 42,183
Effect of change in tax rate 13,350
Non-creditable foreign income taxes 0
Calculated tax 0
Effective tax rate in % 0 %
*See changes in accounting policy under notes
Amounts in NOK 1 000 2018 2017
Pledged assets:
Trade receivables 51,590 26,297
Assets held under finance leases 1,737 3,007
Total carrying value of pledged assets 53,327 29,304

98
Note 10 – Investment in subsidiaries
Note 11 – On-going projects
Part of trade receivables that are recognised in 2018, but not invoiced per 31 December 2018 amounts to 6 780 (2017: 680). Deferred revenue as of 31 December 2018 amounts to 193 (2017: 6 104). The Company does not expect any loss on contracts in 2018.
Note 12 – Receivables
The Company has no accounts receivables with due dates later than 12 months. There has not been made any provision for loss on external receivables per 31 December 2018 (2017: 0).
Note 13 – Bank deposits
Restricted cash as of 31 December 2018:
Note 14 – Share capital and Shareholder information In 2017, the Company’s shares capital was reduced by NOK 295 147 215 by way of a reduction of the nominal value of the shares from NOK 10.00 to NOK 1.00. No distribution was carried out in connection with the share capital reduction.
Amounts in NOK 1 000 Profit/Loss 2018 Location
Sea Bed Logging - Data Storage Company AS 100 % 0 -642 -7,404 Trondheim, Norway
emgs Americas 1 AS 100 % 0 -9,275 -111,446 Trondheim, Norway
CSEM Production AS 100 % 0 -12 -83 Trondheim, Norway
EM Multi-client AS 100 % 0 -100,598 -353,145 Trondheim, Norway
EMGS Global AS 100 % 117 -187 11,123 Trondheim, Norway
EMGS Surveys AS 100 % 0 45 31,132 Trondheim, Norway
EMGS Shipping Mexico S. de R.L de C.V. 99 % 0 -1,372 -7,761 Col. Del Valle, Mexico
EMGS Sea Bed Logging Mexico S.A. de C.V. 100 % 0 -4,109 -72,378 Col. Del Valle, Mexico
Servicos Geologicos Electromagneticos Do Brazil LTDA 99 % 0 -15,498 -103,314 Rio de Janeiro, Brazil
Electromagnetic Geoservices Malaysia Sdn Bhd 1 % 0 -1,695 7,520 Kuala Lumpur, Malaysia
emgs Asia Pacific Sdn Bhd 100 % 839 1,102 11,166 Kuala Lumpur, Malaysia
EMGS Labuan Ltd 100 % 0 -178 7,663 Labuan, Malaysia
EMGS Asia Pacific Labuan Ltd 100 % 0 -3,218 -3,652 Labuan, Malaysia
emgs Australia Pty Ltd 100 % 0 -8 906 Perth, Australia
Total 955 -135,645 -589,671
Net carrying value
shares in
subsidiaries
Equity 31
December 2018
Share ownership/
Voting rights
Amounts in NOK 1 000 2018 2017
Restricted cash
Guarantees 20,463 17,254
Employee tax 10,201 7,719
Total 30,664 24,973

99
The Company completed a rights issue in 2017. The rights issue resulted in gross proceeds to the Company of NOK 144 million through an issuance of 58 634 735 shares. In 2018, the Company completed a rights issue which resulted in gross proceeds to the Company of NOK 97 million through an issuance of 39 540 816 shares. The total authorised number of ordinary shares is 153 889 385 (2017: 98 831 473) with a par value of NOK 1 per share. All issued shares are denominated in NOK and fully paid.
The largest shareholders as of 31 December 2018:
Number of
ordinary shares Percentage
Siem Investments Inc. 31,327,467 23.92 %
Perestroika AS 29,452,795 22.49 %
Morgan Stanley & Co. LLC 25,891,805 19.77 %
Bækkelaget Holding AS 5,010,000 3.83 %
Sportsmagasinet AS 4,329,090 3.31 %
Rosenfonn Investering AS 2,148,705 1.64 %
NHO - P665AK 1,293,422 0.99 %
DNB Navigator (II) 1,169,175 0.89 %
SIX SIS AG 1,117,501 0.85 %
Nordnet Livsforsikring AS 800,941 0.61 %
Statoil Pensjon 701,458 0.54 %
Haav Holding AS 652,478 0.50 %
Kristian Falnes AS 564,932 0.43 %
Vestvik Preserving AS 558,799 0.43 %
Rygg, Jan Wiggo 550,260 0.42 %
Rage, Per Egil 509,535 0.39 %
Nordea Bank Abp 469,290 0.36 %
Sandbæk, Rune 466,530 0.36 %
Øverland, Jarle 457,039 0.35 %
Nordnet Bank AB 452,796 0.35 %
Other 23,045,672 17.60 %
Total 130,969,690 100.00 %
Shares
Leading representatives of the Company as of 31 December 2018 hold the following shares:
CEO 17,003
CFO 2,758
CLC 11,000
Global Exploration Advisor 40,000
Chairman of the Board, Eystein Eriksrud (Laburnum AS) 299,271
Board member, Johan Mikkelsen 30,000
Board member, Mimi Berdal (MKB Invest AS) 70,303
Board member, Adam Robinson 2,093
Total 472,428

100
Note 15 – Equity
Note 16 – Financial items
Note 17 – Financial liabilities USD 32.5 million convertible bond
On 9 May 2018, EMGS secured a USD 32.5 million convertible bond bearing an interest at 3 months LIBOR + 5.50% p.a. The loan can at any time be converted into common shares in EMGS at the conversion price of NOK 3.31 (USD 0.42677) until the maturity date on 9 May 2023. The USD 32.5 million convertible bond can be seen as a contract settled by an entity by delivering a fixed amount of its own equity instruments in exchange for a fixed amount of foreign currency. The economic components of this convertible bond are: (a) A liability. On issuance of the convertible bond, the fair value of the liability component was determined using a
market rate for an equivalent non-convertible bond; and classified as a financial liability measured at amortised cost (net of transaction costs) until it is extinguished on conversion or redemption.
Amounts in NOK 1 000 Share capital
Share
premium
Other
paid-in capital
Available-for-
sale reserve
Actuarial
gains/(losses)
Other equity
(uncovered loss) Total
At 31 December 2017 (Restated*) 91,429 971,707 400,739 2,050 13,377 -928,077 551,225
Group contribution not recorded in 2017 0 0 0 0 0 -1,721 -1,721
At 1 January 2018 91,429 971,707 400,739 2,050 13,377 -929,798 549,504
Proceeds from shares issued 39,541 57,334 0 0 0 0 96,875
Costs of shares issued 0 0 -1,661 0 0 0 -1,661
Equity component of covertible loan 0 0 15,832 0 0 0 15,832
Share-based payment 0 0 -1,493 0 0 0 -1,493
Loss of the year 0 0 0 0 0 -449,747 -449,747
At 31 December 2018 130,970 1,029,041 413,416 2,050 13,377 -1,379,545 209,309
*See changes in accounting policy under notes
Amounts in NOK 1 000 2018 2017
Financial income:
Group contribution 1,596 0
Interest income subsidiaries 456 31
Interest income on short term bank deposits 1,625 924
Foreign exchange gains 49,770 10,028
Net gain on financial assets and liabilities 11,543 7,076
Gain on partial bond buy-back 0 7,177
Total 64,990 25,237
Financial expenses:
Interest expense subsidiaries 2,196 492
Interest expense 38,425 32,453
Foreign exchange loss 35,204 42,137
Net loss on financial assets and liabilities 214,307 30,133
Financial expenses repayment of bond loan 7,382 0
Other financial expenses 3,607 1,381
Total financial 301,121 106,596
Net financial items -236,131 -81,359

101
(b) An equity component. The residual of the proceeds was allocated to the conversion option that was recognised in shareholders’ equity.
At inception, the value of the liability component was estimated to NOK 246.4 million, and amortised cost as of 31 December 2018 was NOK 267.8 million. The equity component, the carrying amount of the conversion option, was estimated to NOK 15.8 million at inception and is not remeasured in subsequent periods. The convertible bond loan contains financial covenants requiring free cash and cash equivalents of at least USD 2.5 million on group level. In addition, the bond agreement has restrictions regarding the Company's ability to sell the multi-client library, declare or make dividend payments, incur additional indebtedness, change its business or enter into speculative financial derivative agreements. As of 31 December 2018, the free cash and cash equivalents of the Group totalled USD 6.5 million. The bond is unsecured.
NOK 246 million bond
On 26 June 2013, EMGS secured a NOK 350 million bond bearing an interest at 3 months NIBOR + 6.00% p.a. On 22 December 2015, EMGS bought back NOK 80 million nominal outstanding amount at 80% of par. Following settlement, the nominal outstanding amount of the bond was NOK 270 million. In March 2017, the Company offered its bondholders to buy back in full their nominal outstanding amount at a price equivalent to 70% of the par value. The nominal amount of NOK 24 million was bought back, and the nominal amount outstanding decreased to NOK 246 million. On 7 June 2018, the Company repaid the NOK 246 million bond in full at 103% of par value (plus accrued interest). The bond was unsecured.
Forward rate agreement
In February 2015, EMGS entered into a forward rate agreement with the purpose of reducing its exposure to exchange rate fluctuations related to the bond loan in NOK. The Company paid the negative market value of the difference between NOK 270 million and NOK 246 million when NOK 24 million of the bond was bought back in 2017. In 2018, EMGS paid the remaining negative market value when the NOK 246 million bond loan was repaid and does not have any forward rate agreements as of 31 December 2018. The forward rate agreement was not treated as hedge, as the agreement was not specifically designated as hedge of firm commitments or certain cash flow. Consequently, the forward rate agreement was recorded at estimated fair value with gains and losses included in the line Net gains/(losses) of financial assets and liabilities in the Consolidated income statement.
Finance lease liabilities
The finance lease liabilities relate to certain property, plant and equipment and are capitalised leases for financial reporting purposes. The related leased property, plant and equipment serve as the collateral under such leases.

102
Note 18 – Other receivables
Note 19 – Provisions The Company recognises a provision for prepayments from two customers in a Joint Industry Project (“the Deep Blue”).
EMGS and the two customers collaborated on the development, construction, and testing of a prototype advanced marine
electromagnetic acquisition system. The prototype was completed in 2017 and the provision is being released to revenue
over 8 years, the same period as the prototype is being depreciated over. The Company has recognised 167 302 as
contract liability for the Deep Blue prepayments per 31 December 2018 (2017: 170 340).
Note 20 – Public taxes and duties payable
Amounts in NOK 1 000 Interest rate Maturity 2018 2017
Non-current
USD 32.5 million convertible bond 3 month LIBOR + 5.50% 09.05.2023 267,759 0
NOK 246 million bond 3 month NIBOR +6.00% 27.06.2019 0 245,674
Financial lease liabilites 3 month NIBOR +3.65% 2-3 years 2,069 3,864
Forward rate agreement 27.06.2019 0 24,668
Total 269,828 274,206
Current
Financial lease liabilites 3 month NIBOR +3.65% Up to 1 year 2,634 2,348
Total 2,634 2,348
Total financial liabilities 272,462 276,554
Amounts in NOK 1 000 2018 2017
Other receivables
Prepaid expenses 9,111 10,849
VAT 0 0
Other 8,015 8,991
Total 17,126 19,840
Amounts in NOK 1 000 2018 2017
Public taxes and duties payable
Employee taxes withheld 10,218 7,798
Employment tax 4,866 3,958
Tax foreign employees -1 807
VAT 42 590
Other -2,151 616
Total 12,974 13,769

103
Note 21 – Other current liabilities
Note 22 – Other operating expenses
Note 23 – Related parties
Sales and purchases of services, receivable and liabilities:
In 2018, the Company made an accrual for loss on group company receivables of 213 829 (2017: 30 133)
Amounts in NOK 1 000 2018 2017
Other current liabilities Restated*
Provision for onerous contract 0 0
Accrued holiday pay 9,233 8,531
Accrued salaries 308 1,548
Deferred revenues 196 6,104
Accrued shared revenues 30 0
Accrued vessel expenses 8,699 8,455
Other liabilities 16,016 26,393
Total 34,483 51,031
*See changes in accounting policy under notes
Amounts in NOK 1 000 2018 2017
Other operating expenses
Rental and housing expenses 8,849 10 339
Consumables and maintenance 5,570 6 278
Consultancy fee 8,488 10 225
Travel expenses 2,981 2 123
Insurance 4,046 3 397
Marketing 1,092 944
Intercompany expenses 11,464 11 902
Other operating expenses 3,316 4 493
Total 45,805 49 700
Amounts in NOK 1 000 Liabilities Receivables Purchase Sales Liabilities Receivables Purchase Sales
Related parties
Sea Bed Logging - Data Storage Company AS 0 0 0 0 0 0 0 0
emgs Americas 1 AS 0 0 0 0 0 87,475 0 4,202
CSEM Production AS 0 17 0 0 0 0 0 0
EM Multi-client AS 9 0 0 0 0 99,746 0 0
emgs Global AS 9,077 0 0 0 2,029 0 0 3,308
emgs Americas 1 AS Mexican Branch 0 13 0 0 0 0 0 0
emgs Americas Inc 0 0 15,245 0 0 800 16,513 0
EMGS Shipping Mexico S. de R.L de C.V. 0 54,947 42 0 0 52,667 0 0
EMGS Sea Bed Logging Mexico S.A. de C.V. 0 0 0 0 0 0 0 0
EMGS Sevices Mexico S.A de C.V 675 0 0 0 597 0 124 0
Electromagnetic Geoservices Canada Inc 0 1,342 0 0 0 0 0 3,751
Servicos Geologicos Electromag. Do Brazil LTDA 0 302,989 0 0 0 301,384 0 0
EMGS Surveys AS 0 103 0 0 0 58 0 0
EMGS UK Ltd 29,598 0 3,269 0 27,418 0 7,739 0
Electromagnetic Geoservices Malaysia Sdn Bhd 1,809 0 0 0 1,715 0 1,715 0
emgs Asia Pacific Sdn Bhd 14,258 0 6,749 -821 10,084 0 4,292 0
emgs Labuan Ltd 0 0 0 0 0 0 0 0
EMGS AP Labuan Ltd 166 0 0 0 158 0 0 0
55,592 359,411 25,305 -821 42,000 542,130 30,382 11,262
2018 2017

104
Note 24 – Events after the reporting period Multi-client sales to Equinor
On 4 March, EMGS announced that EMGS and Equinor had entered into final contracts including data licensing sale of the Company’s existing multi-client library in the Barents Sea, Norwegian Sea and North Sea, as well as prefunding for a new multi-client acquisition in the North Sea. The combined gross contract value is approximately USD 8 million.
Proprietary data acquisition survey in south-east Asia
EMGS received a purchase order from an undisclosed customer for proprietary data acquisition survey in south-east Asia on 11 March 2019. The total value of the purchase order is approximately USD 24 million. The BOA Thalassa commenced the survey on 23 March 2019.
Multi-year acquisition contract
EMGS received a letter of award for a multi-year call-off acquisition contract, awarded by one of the world’s largest national oil companies. The letter of award has a minimum value of approximately USD 29.3 million, and a maximum value of approximately USD 73.3 million over a two year-period. Based on the current acquisition estimates, the Company expects that all or a substantial part of the minimum contract value will be recognised in 2019.
New guarantee facility
EMGS has secured a second guarantee facility to supplement the Company’s existing USD 10 million guarantee facility. The new guarantee facility (the “New Facility”) has a maximum limit of USD 7.5 million and is limited in scope to providing certain performance and warranty guarantees required under the multi-year acquisition contract above. The New Facility is provided by the Company’s existing bank. The New Facility is fully guaranteed by the Company’s three largest shareholders (the “Shareholder Guarantors”). The shareholder guarantees will over time be replaced by a pledged deposit (the “Pledged Deposit”) to be built up by the Company, which will serve as security for the New Guarantee. A counter guarantee agreement entered into between EMGS and the Shareholder Guarantors regulates the Company’s obligations towards the Shareholder Guarantors in connection with the New facility. The Company will pay the Shareholder Guarantors a guarantee commission of 8% p.a. of the guaranteed amount. As the Pledged Deposit is built up, the guarantee commission will be reduced to 1.5% p.a. for such parts of the New Guarantee which are covered by the Pledged Deposit, and to 0% as the Shareholder Guarantors are released form their obligations towards the bank. A cash sweep mechanism has been agreed with the Shareholder Guarantors to ensure swift build-up of the Pledged Deposit. Under current estimates, the Company expects that the Pledged Deposit will reach the full USD 7.5 million during the course of the first quarter 2020. Under certain change of control events, including a sale by a Shareholder Guarantor of its shares in the Company, EMGS will be obligated to, within 30 days, replace the relevant Shareholder Guarantor with a new guarantor (or otherwise ensure the release of such Shareholder Guarantor’s obligations towards the bank).

Auditor’s report. 2018


EMGS ASA Pb 1878 Lade 7440 Trondheim NORWAY emgs.com [email protected]