Embed Size (px)
Citation preview

The Effect of the Changing
Dynamics of the Conowingo Dam on
the Chesapeake Bay
Mukhtar Ibrahim and Karl Berger, COG staffWater Resources Technical Committee
March 6, 2015
Why This Presentation• CBPC presentation by Bruce Michael, Maryland
DNR, at January 2015 CBPC meeting• Based on LSRWA report/ request to relicense dam by Exelon• http://bit.ly/LSRWA
• Issue Has Policy Implications• Clean Chesapeake Coalition
• CBPC Action: direct WRTC to track issue; report back to CBPC on any policy recommendations
• Today’s presentation: Provide technical details; outline potential policy recommendations
Slide 2

Outline
• Slides 1 – 3 Intro
• Slides 4 – 7 Background information on dam issue
• Slides 8 -14 LSRWA technical findings
• Slides 15 – 19 Policy implication; COG’s next steps
Slide 3

Draft Assessment Report Released in October
LSRWA Findings• Deposition and scouring rates are different than
previously understood
• Under TMDL attainment levels of load reduction, not addressing the changing dynamics of the dam would result in not meeting water quality standards in 3 of the Bay’s 92 tidal water segments
• The non-attainment would result from the nutrients associated with the increase in sediment fluxes over the dam, not directly from the sediments themselves
• The vast majority of the nutrients and sediment flowing over the dam come from upstream sources, not scouring
• Dredging or other types of dam operational adjustments cannot offset the impact of increased scouring at realistic levels of investment
• Upstream source control is more effective
(summarized from LSRWA FAQ document, pages 3-4)
Slide 4

Background Information
• Flow in lower Susquehanna impacted by series of 3 dams• Safe Harbor (PA)• Holtwood (PA)• Conowingo (MD)
-- largest and last one to reach dynamic equilibrium.
Dam R eservo ir N am e
C onstructio n D ate
Dam Height (feet)
Capacity (acre- feet) Trapping Capacity Status
Saf e H arb o r, P A Lake Clarke 1931 75 150,000 Dynamic equilibrium
reached in the 1950s
Holtwood, PA Lake Aldred 1910 55 60,000 Dynamic equilibrium reached
in the 1920s
Conowingo, MD
Conowingo Reservoir 1928 94 300,000
Dynamic equilibrium reached in the 2000’s, very limited capacity remaining

67%
24%
5% 4%
Total Nitrogen
Susquehanna Potomac James Others
Susquehanna’s Loads to the Bay – as Share of All Monitored Loads
From 1985 to 2013, as % of all monitored freshwater flows to the Bay, the Susquehanna River contributed:• 60% of the fresh
water• 67% of the nitrogen• 46% of the
phosphorus • 47% of the
sediment
46%
28%
18% 8%
Total Phosphorus
47%
30%
17% 7%Sediment
COG staff analysis: Data from USGS river input monitoring stations, accessed at: http://cbrim.er.usgs.govOthers= Rappahannock, Appomattox, Pamunkey, Mattaponi, and Patuxant
Slide 6

Susquehanna’s Loads to the Bay – as Share of All Loads
As % of total loads to Bay(CBP WSM results for 2012 scenario)
• 47% of freshwater flow• 41% of TN• 25 % of TP• 27% of TSS
As % of total loads at RIM stations (1985-2013 average
from monitoring data )
• 60% of freshwater flow• 67% of TN• 46% of TP• 47% of TSS
Of these loads, USGS and USACE scientists estimate that, as a long-term average, 20 -30 % of the loads derive from scouring of the sediments in the dams; the rest derive directly from upstream sources.
Slide 7

Dam System Now in “Dynamic Equilibrium”
Dynamic equilibrium indicates a balance between sediment inflow and outflow over a long period of time. During high flow or storm events, the sediment and associated nutrients behind the dam are scoured and deposited downstream. That leaves storage capacity behind the dam, into which new sediment and nutrients can accumulate until the next scouring event.
Slide courtesy of Bruce Michael, MD DNR
Slide 8
Changing Nutrient, Sediment Dynamicsat Higher Flows
Data from Hirsch, R.M., 2012, “Flux of Nitrogen, Phosphorus, and Suspended Sediment from the Susquehanna River Basin to the Chesapeake Bay during Tropical Storm Lee, September 2011, as an Indicator of the Effects of Reservoir Sedimentation on Water Quality,” U.S. Geological Survey Scientific Investigations Report 2012–5185

Impact on Load Trends
Data from Hirsch, R.M., 2012, “Flux of Nitrogen, Phosphorus, and Suspended Sediment from the Susquehanna River Basin to the Chesapeake Bay during Tropical Storm Lee, September 2011, as an Indicator of the Effects of Reservoir Sedimentation on Water Quality,” U.S. Geological Survey Scientific Investigations Report 2012–5185
WRTDS estimated annual flux of total phosphorus and suspended sediment by water year for the Susquehanna River at Conowingo, MD
Total P trend: up 55% from 1996-2011
Suspended sediment trend:up 97 percent from 1996-2011
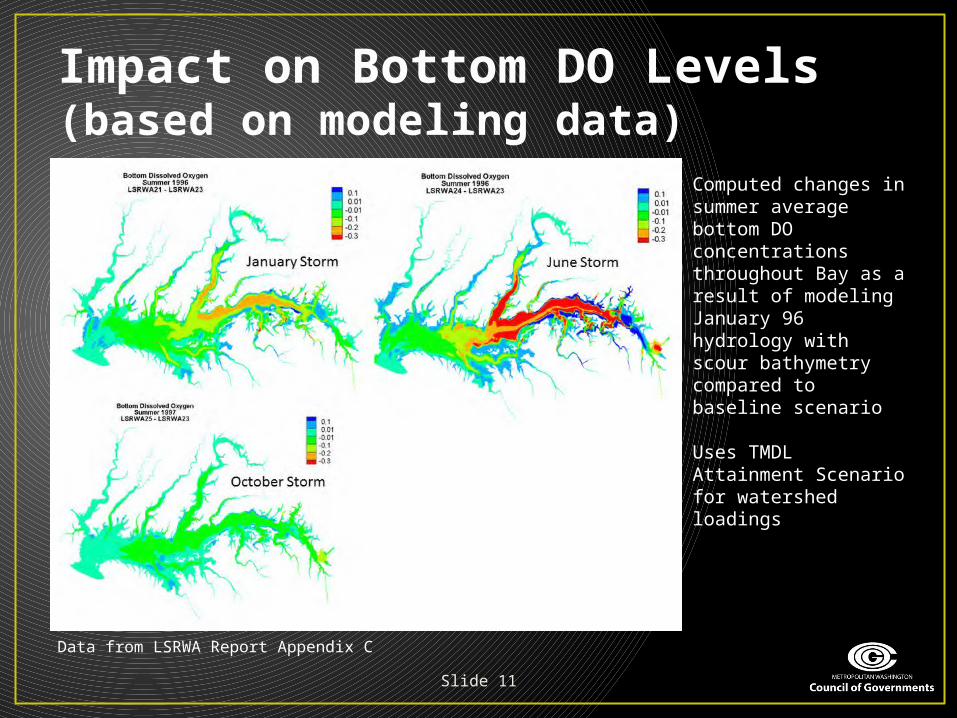
Impact on Bottom DO Levels(based on modeling data)
Computed changes in summer average bottom DO concentrations throughout Bay as a result of modeling January 96 hydrology with scour bathymetry compared to baseline scenario
Uses TMDL Attainment Scenario for watershed loadings
Data from LSRWA Report Appendix C
Slide 11

Impact on Water Quality Standards Attainment(based on modeling data)
CBP Model results indicate that impact of changing dynamics – left uncorrected – would increase nonattainment of the deep channel DO WQ standard by about one percent
Source: LSRWA Report Appendix D (LWRSA scenario 21 – LSRWA scenario 3 computed change in deep channel DO for 1996-1998 hydrology period)
Slide 12

Effectiveness of Dredging(based on modeling data)
Dredge to achieve 1996 bathymetry
Estimated Cost = $0.496 - $2.8 billion
Source: LSRWA Report Appendix C
Slide 13

Effectiveness of Dredging(based on modeling data)
Dredge to remove average annual load (3 million cubic yards/year)
Estimated cost =$15-270 million/year
Source: LSRWA Report Appendix C
Slide 14

Next Steps in Dam Relicensing• Late 2014 Exelon relicensing decision put off
for now • Exelon withdrew application; agreed to help fund more studies
• MD and partners sponsoring more studies (increased monitoring, sediment particle analysis, fate and effect of particular nutrients)
• Likely outcome: Exelon gets new license; agrees to provide funds for Susquehanna watershed BMPs; no dredging or other dam system management changes
Slide 15

Impact on Bay TMDL – if no dredging or dam management changesBay Program Faces Policy Decision• CBP will change nutrient, sediment dynamics of dam system
in the watershed model to account for new understanding – THIS WILL AFFECT WATER QUALITY MODEL OUTPUT
• Under TMDL accounting, the impact on non-attainment of WQ standards must be addressed somehow
• Preliminary estimate:• 4.4 million pounds of total nitrogen/ 0.41 million lbs of
total phosphorus needed from Bay watershed as a wholeor
• 2.4 million pounds of nitrogen / 0.27 million pounds of phosphorus from Susquehanna watershed
Slide 16

Integrating LSRWA Findings into Bay TMDL Midpoint Assessment
Slide courtesy of Bruce Michael, MD DNRWRTC tracking, recommendation
CBPC follow-up
to CBP partners
CBPC input to
CBP partners
Slide 2

Recommended WRTC Action• Federal, state relicensing decision (2015 or later):
no COG involvement• Bay Program TMDL load allocation decision
(during 2017 mid-point assessment) – COG comment• WRTC to track revisions to model output, non-attainment
estimates, load allocation options• Recommend COG support for most equitable allocation
option
Slide 18

For More Information Draft LWRSA Report Available
http://bit.ly/LSRWA
USGS Conowingo report http://pubs.usgs.gov/sir/2012/5185/
Bruce Michael COG presentation http://
www.mwcog.org/uploads/committee-documents/ZF1XW1Zc20150114085202.pdf
COG staff contacts: Karl Berger, [email protected] Ibrahim,