Embed Size (px)
Citation preview

1 Senior Lecturer at University of Malaya. Email: [email protected] 129
PLANNING MALAYSIA:
Journal of the Malaysian Institute of Planners
SPECIAL ISSUE V (2016), Page 129 - 144
ENERGY EFFICIENCY POLICY FOR EXISTING TYPICAL CAMPUS
BUILDINGS IN THE UNIVERSITY OF MALAYA
Muhammad Azzam Ismail1, Karam M. Al-Obaidi2, & Raha Sulaiman3
1,2,3
Centre for Building, Construction and Tropical Architecture
Faculty of Built Environment
UNIVERSITY OF MALAYA
Abstract
A very large component of the maintenance cost of any real estate property is the
electricity consumption cost. The electricity consumption cost of a 700-acre
university campus in Malaysia would reach an overall yearly operating
expenditure of nearly RM 1 billion. Knowing this fact, the University of Malaya’s
(UM) top management has conducted many projects at various scales to address
energy efficiency (EE), including the replacement of old and inefficient
mechanical and electrical (M&E) equipment and the installation of new EE
technologies around the campus. In enhancing the overall EE effort, an energy
management system is required to ensure that a calculated EE plan can be
implemented and audited after it is completed to improve the overall
sustainability of UM. Therefore, this study presents the formulation of an Energy
Management System (EMS) for UM based on the ASEAN Energy Management
Scheme (AEMAS) methodology. Results show that with the full support of the
top management of the university, the EMS can be implemented with at least a
5% electricity consumption reduction per year. The formalization of the EMS is
the most important step in ensuring any marked reduction in electricity
consumption campus-wide.
Keyword: Energy management system, energy efficiency, university campus

Muhammad Azzam Ismail, Karam M. Al-Obaidi & Raha Sulaiman Energy Efficiency Policy for Existing Typical Campus Buildings in the University of Malaya
© 2016 by MIP 130
INTRODUCTION AND BACKGROUND
In many respects, university and college campuses are microcosms of
environmental issues, concerns, and challenges. With a smaller scale and better
structuring, universities are less complex than they are at the scale of the city.
Universities with a potential site can implement sustainable development
(Marans & Edelstein, 2010). According to Levy and Marans (2012), many
universities in the United States have undertaken large-scale environmental
sustainability efforts. However, only a few have advanced broad plans to address
environmental sustainability in their campuses. Numerous studies showed that
universities all over the world are confronted with increasing utility costs rising
significantly faster than the rate of inflation (Marans & Edelstein, 2010). These
issues are pushing university leaders to take serious decisions with long-term
implications. As a result, many options are taken to overcome these concerns,
such as cutbacks in building maintenance; curtailing the building of new
classrooms, laboratories, and libraries; updating older facilities; reductions in
faculty and staff salaries; increased student fees; and reduced student financial
assistance (Marans & Edelstein, 2010). Therefore, many universities are
developing new “sustainability” programs to address the problem of their rising
energy costs (Hignite, 2008).
Electricity is a key energy source and is essential for economic
development in every country. The actual scenario in Peninsular Malaysia shows
that every 1 kilowatt-hour (kWh) of electricity releases about 0.681 kg of CO2,
which is equivalent to 35% electricity supply efficiency (PTM & DANIDA,
2006). Over the past few years, the electricity tariff for “Medium Voltage General
Commercial” clients or Tenaga Nasional Berhad (TNB) tariff C1 has increased
consistently. In 2007, the C1 tariff for every kilowatt of maximum demand was
MYR19.50, and the general C1 tariff for all kilowatts of consumption was at
MYR23.40. However, since January 2014, these demands have risen to
MYR30.30 and MYR36.50, putting significant pressure on the monthly utility
bills for the University of Malaya (UM).
Therefore, in 2012, through the sustainability drive by the UMCARES, a
small group of academicians were called upon to work with the Malaysian Green
Technology Corporation (MGTC) through a UM Sustainability Science Cluster
(SUSCI) flagship project to test and further develop a city-level carbon emission
calculator called the “Low Carbon Cities Framework” or LCCF. Eventually, UM
signed a Memorandum of Understanding with the MGTC at the IGEM 2013 as a
pilot partner to further develop LCCF. In addition to the LCCF flagship project
and with the support of the Vice Chancellor, SUSCI initiated the UM Energy
Management Initiatives (UMEMI) and sent 20 individuals selected from various
levels of the university service, including academicians and technical and
administrative staff, to the ASEAN Energy Management Scheme (AEMAS)
energy management training in August 2013. At that point, the UM naturally

PLANNING MALAYSIA
Sustainable Urban Development
131 © 2016 by MIP
created an energy efficiency policy, set up an energy management procedure, and
allowed for existing buildings to be turned into living laboratories to test new
technologies developed on campus that resulted in resource consumption
efficiency.
However, the momentum stalled, and until now, only marquee energy
efficiency projects were adopted such as LED streetlights fitted throughout
almost the whole campus and all new buildings having energy efficient features
without any systemic changes to the management of the university. The
accounting of energy and water consumption continued as previously conducted,
but the sharing of such information with the campus community has been
inconsistent. Nevertheless, the foundations have been laid, and further action is
needed especially a clear energy efficiency policy that has been outlined in this
paper.
RESEARCH METHODOLOGY
As part of the efforts to achieve a marked reduction in the campus-wide
electricity consumption to and formalize an effective EE policy, a set of
objectives are needed:
To implement the UM Sustainable Energy Management Program (SEMP) to
increase the effectiveness of the UMEMI initiated by the UM SUSCI
To strengthen the energy management procedure and organizational structure
To implement appropriate measures of reducing energy consumption
To achieve the objectives stated, this study proposes that the AEMAS
Energy Management Working Procedure (EM-WP) is adopted and adapted to suit
the existing UM management structure. In this study, the plan for the EM-WP is
presented in the next section, together with a simple case study of a faculty that
includes a study on the return of investment (ROI) of the implemented measures.
In demonstrating the applicability of the energy efficiency proposed in this study,
the low cost measures outlined in this study can be implemented on the existing
buildings in the university’s campus. After one year of this initial implementation
of this policy, the medium cost and high cost such as alternation to the building
fabric and refreshment of cooling systems can be done to achieve a significantly
high reduction of energy consumption. The flowchart (Figure 1) below indicates
the process of UM in formulating an attainable energy efficiency (EE) effort.
Initially, one academic staff was approached by the researchers to solicit
some energy policy information. Thereafter, the researchers referred to two
technical staff members at the UM estate management department. Basing on
these interviews, the researchers managed to plot the profile of the UM’s Energy
Management Matrix (EMM), which is presented in the next section. Additional
in-depth interviews were not conducted because of the saturated response from

Muhammad Azzam Ismail, Karam M. Al-Obaidi & Raha Sulaiman Energy Efficiency Policy for Existing Typical Campus Buildings in the University of Malaya
© 2016 by MIP 132
the interviewee stating that the energy policy in the UM campus has low
implementation.
Figure 1: Implementation of Sustainable Energy Management Program (SEMP)
EVALUATION OF THE ENERGY MANAGEMENT STATUS
As mentioned earlier, through unstructured interviews, the researchers were able
to plot the Energy Management Matrix as formulated by the AEMAS for UM.
Initially, the foundation for UM’s energy management was already established.
However, according to all interviewees, it lacked clear direction and commitment
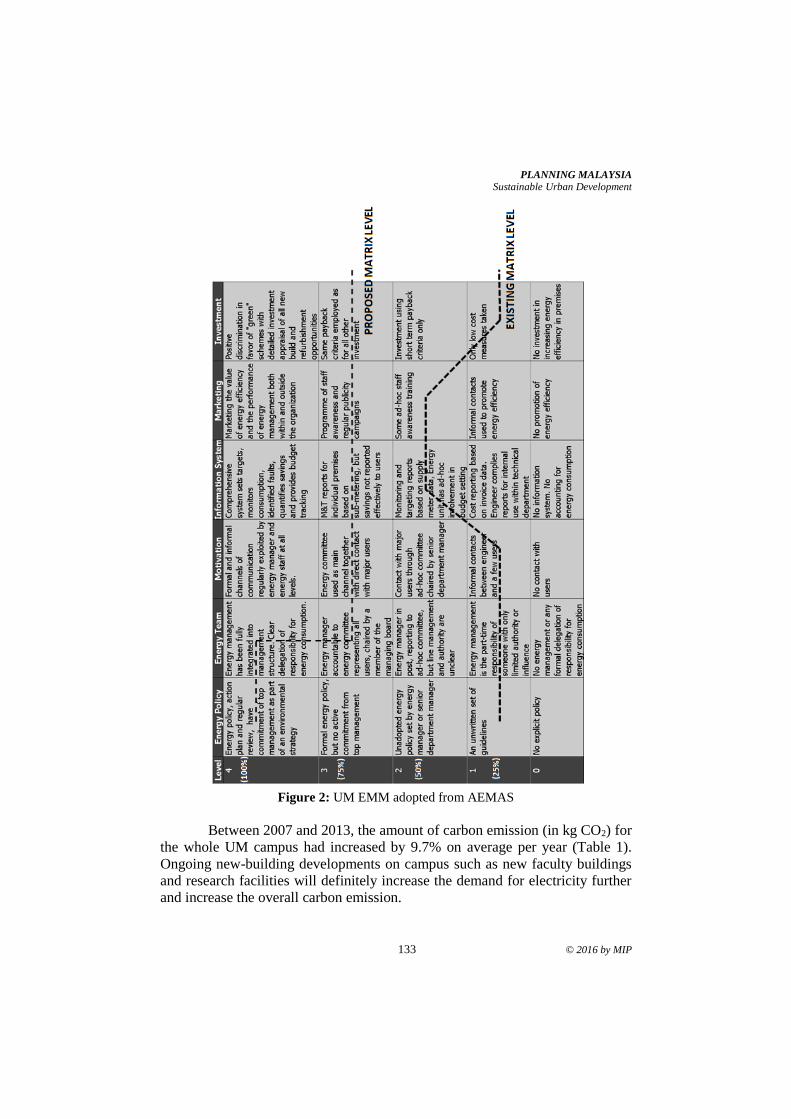
from relevant parties. The existing matrix levels are indicated in Figure 2.
Each EMM represents 25% out of 100% scores. For example, Level 1 in
Energy Policy represents 25%, and an improvement up to Level 4 is calculated
to an increase of 75%. In totality, the improvement percentage range would be
from 25% to 75%. These points of improvement may help UM to execute
meaningful improvement measures around the campus and to start to witness
some electricity consumption reduction. In addition to the energy management
matrix, establishing the baseline carbon emission rate for the whole campus is
important to present an overall effect of the large electricity consumption that has
taken place over the years at UM and as basis for the reduction of carbon emission
to help mitigate climate change and related environmental issues. Although
mitigation of climate change is intangible and the achievement is subjective, the
reduction in carbon emission is finite and can help to establish the baseline
campus-wide yearly carbon emission as basis for an energy efficiency policy.
Close SIT and audit implementation of completed IM and ECM by internal and external parties
Implement Improvement Measures (IM) and Energy Conservation Measures (ECM) by appointed Sustainable Improvement Teams (SIT)
Create Energy Management – Working Procedures (EM-WP) with projected timelines and extract relevant data
Create Energy Target and Plan (ET and P)
Appoint Energy Management Committees at faculty and university level
Evaluate Energy Management Status at each faculty and university level
Set up UM Energy Management Committee (EMC)
PLANNING MALAYSIA
Sustainable Urban Development
133 © 2016 by MIP
Figure 2: UM EMM adopted from AEMAS
Between 2007 and 2013, the amount of carbon emission (in kg CO2) for
the whole UM campus had increased by 9.7% on average per year (Table 1).
Ongoing new-building developments on campus such as new faculty buildings
and research facilities will definitely increase the demand for electricity further
and increase the overall carbon emission.

Muhammad Azzam Ismail, Karam M. Al-Obaidi & Raha Sulaiman Energy Efficiency Policy for Existing Typical Campus Buildings in the University of Malaya
© 2016 by MIP 134
Table 1: UM electricity consumption 2007–2013
Year Average
monthly
electricity
consumption
(kWh)
Average
monthly
maximum
demand
(kWh)
Yearly electricity
consumption(kWh)
Yearly
carbon
emission
(kgCO2)
Yearly
incremental
increase in
carbon
emission
(%)
2007 5,893,910.50 17,525.17 70,726,926 48,306,490 -
2008 6,015,536.17 17,715.33 72,186,434 49,303,334 9.8
2009 6,083,971.00 18,023.08 73,007,652 49,864,226 9.9
2010 6,313,539.25 18,565.92 75,762,471 51,745,768 9.6
2011 6,335,642.17 18,803.50 76,027,706 51,926,923 10.0
2012 6,680,434.33 19,713.67 80,165,212 54,752,840 9.5
2013 7,086,024.67 20,663.92 85,032,296 58,077,058 9.4
ENERGY MANAGEMENT COMMITTEE (EMC)
The best way to achieve the improved “Energy Policy” matrix level is to first set
up an EMC at the university’s top management level. This committee must have
the mandate by the UM Board of Directors to implement a UM EE policy and to
conduct various EE improvement measures around the campus with full
administrative, financial, and technical supports.
At the faculty level, a similar EM Committee hierarchy can be adopted,
where the Energy Action Centre (EAC) Chairman must be created to ensure that
the chain of command is not broken and that the UM EE policy can be
implemented effectively. The EAC Chairman must always be the Dean, and the
Energy manager must always be the Deputy Dean (Research and Development),
who has direct command of the faculty’s amenities, as shown below in Figure 3
and Table 2.
Figure 3: EMC at top level university management
Chairman (Vice Chancellor OR Deputy VC Development)
Head of the JPPHB (Technical)
University Registrar (Administrative)
University Bursar (Finance)
Two (2) appointed Academic Staff
Energy Manager
(Deputy Dean)
18 Energy Action Centre Chairmen
(Dean)

PLANNING MALAYSIA
Sustainable Urban Development
135 © 2016 by MIP
Table 2: Roles and responsibilities of the EMC at top university/faculty level
EM
COMMITTEE
ROLES AND RESPONSIBILITIES
Chairman
(VC & Dean
Level)
Have full authority to make decisions to allocate resources including
manpower, machine, and budget to implement energy management
system to achieve the target stated in the energy policy
Energy Manager
(Deputy Dean)
Understands the energy consumption process of the whole department
Coordinates with all sections to implement the energy management
system
Technical Staff Have authority to control operations in their section
Have good technical knowledge of equipment, utilities, and processes
and energy efficiency technology
Understand energy consumption of each area/process
Administrative
and Finance
Staff
Have authority to control the operation for each area
Develop guidelines of working manual and tools
Monitor and implement plan
Participate in assessment of energy management performance
Other
Representatives
Stakeholder representatives and EM Committee liaison officers
ENERGY SAVINGS TARGET AND PLAN
The university could start with an energy savings target of 5% per year. This
target is significantly in line with the existing Malaysian government’s own
energy consumption reduction target of 5% per annum. Although this target
seems low, with continuous and sustained effort over many years, it will result in
substantial cost savings without major disruption to the existing university
management system and maintenance budget.
In meeting the projected energy savings target, large-scale improvement
measures (IM) must be planned and implemented campus-wide. IM projects at
the university level can include the installation of electricity sub-meters at major
buildings around the campus, organization of energy efficiency, campus-wide
conservation awareness campaigns with the active participation of students and
staff, and approval of specific improvement measures at the faculties.
Creation of Energy Management Working Procedures
EMCs at the top level university management and at various faculties must
practice an energy management system similar to the quality management system
or ISO system with various work processes, reviews, and other elements. The
practice of such a system will inculcate a sense of responsibility showing that
energy savings must be achieved consistently throughout the whole organization.
For instance, achievements beyond the expected 5% yearly targets should be
rewarded with financial incentives to implement further improvement measures.
Alternatively, yearly awards can be created for the best-performing faculties.

Muhammad Azzam Ismail, Karam M. Al-Obaidi & Raha Sulaiman Energy Efficiency Policy for Existing Typical Campus Buildings in the University of Malaya
© 2016 by MIP 136
In ensuring the integrity and culpability of each improvement measure,
audits similar to ISO audits of UM’s curriculum and administrative processes
should be conducted. Similar to the requirements of ISO, records are needed
throughout the energy management process, especially at the faculties. At the top
management level, committee members would deliberate over proposals for
improvement measures from various faculties and yearly energy savings target,
considering the finances and administrative abilities of the university. However,
discussions in specific faculty-level EMCs should concentrate on planned
improvement measures, the allowable budget, and outcomes or reviews of
completed projects (Table 3).
Table 3: Documents needed for the operationalization of energy management at faculty
level
No. Document
type
Description and contents of document
1 Operating
guideline
(OG)
Objectives of the OG
Scope of the OG
Process mapping (electricity consumption analysis)
List of standards and reference documents
Normal working procedures to control energy consumption of faculty
Working forms and documents
2 Work
instruction
(WI)
Set of instructions to guide the implementation of individual
improvement measures
Troubleshooting guide
List of available equipment for energy auditing and other processes
3 Log sheets
(LS)
Recording of daily electricity consumption according to areas in a
building or major mechanical and electrical equipment
IMPLEMENTATION OF IMROVEMENT MEASURES AT UM
Part of the objectives of study was to simulate the implementation of
improvement measures at a selected faculty to demonstrate the applicability and
functionality of the whole EM-WP. The buildings selected were part of the same
faculty, until very recently, the ownership of one of the blocks was transferred to
a different faculty. This particular case study has two (2) blocks that can be
labelled as EACs.
An EAC is a small part of the organization that can effectively control
the overall energy consumption. The number of EACs will depend on the size
and condition of the organization. The Faculty of Built Environment (FBE) has
two blocks with a total of four wings (Figure 4). The main block at the faculty
has been identified as EAC 1, whereas the surveyor’s block is EAC 2. Existing
available data and information of each EAC are tabulated in Table 2. After the
ET & P in step G is set up, the EMC must allocate the responsibility to each EAC

PLANNING MALAYSIA
Sustainable Urban Development
137 © 2016 by MIP
to identify the measures in their areas. The target allocation is based on their
respective energy consumption.
To identify an effective energy management plan, both EACs will use
the recommended internal WP or EAC-WP, as outlined in Figure 5. This WP will
help the EACs to identify improvement measures to control energy consumption
in their respective areas. Through the EAC-WP, each improvement measure can
be properly implemented, monitored, and audited. As part of the EAC-WP, the
OG, Work Instruction (WI), and Log Sheet (LS), as in Table 3, must be created
and used.
Figure 4: Blocks of FBE and the designated EAC
Figure 5: EAC energy management working procedure (EM-WP)
EAC1 EAC2
Operational Guideline (OG), Work Instruction (WI), Log Sheet (LS) are
developed and used
Practice using OG/WI as guidelines and tools for
daily work
Record control parameter using LS or conduct
energy audit
Analyse data Set up or revise energy
efficiency index and energy
savings target for EAC
Identify implementation
measures and set up Sustainable Improvement
Team(s) (SIT)
Implement improvement
measures

Muhammad Azzam Ismail, Karam M. Al-Obaidi & Raha Sulaiman Energy Efficiency Policy for Existing Typical Campus Buildings in the University of Malaya
© 2016 by MIP 138
Energy savings can be achieved from three (3) levels of practical
measures: zero/low cost (housekeeping), medium cost investments, and high cost
investments. At the initial stage, the faculty could implement low cost and
medium cost measures to improve the EEs of EAC1 and EAC2. This faculty
targets to achieve at least 5% of energy savings, following UM’s proposed yearly
energy savings target. Low-cost measures represent a move toward technology
solution but with substantial input from building occupants. Table 4 below shows
proposed improvement measures that must be approved by the faculty’s EMC
and could be implemented over a set period of time.
Table 4: Proposed improvement measures with details for EAC1 and EAC2 IM No. Improvement Measure details Budget
EAC 1
(SIT1)
IM1-1 Installation of weather strips
• Providing glass doors with both horizontal and
vertical weather stripping (3 units): • RM 25.00/p
• Providing timber doors with bottom door weather
stripping (65 units):
• RM 1.50/m
RM 250.00
IM2-1 • Installation of timer to centralised a/c system
• Timer (RM480.00 x 4 AHUs)
RM 1,920.00
IM3-1 Replace T8 with T5 light fittings • 1 T5 bulb = RM22.24
• EAC1 = 9,395.45 m² For T8 (1 m2 = +/- 3 bulbs)
De-lamping of T5 (reduction about 50% of bulbs)
• Total number of bulb = 1,600
RM 35,584.00
IM4-1 Setting all split air-conditioning units at 24º and confiscating all remote controls.
• Wiring and setting the air-conditioning units =
RM80.00/unit
• Number of split air-conditioning units = 94
RM 7,520.00
IM5-1 Maintaining centralised a/c system RM 5,000.00
EAC 2
(SIT2)
IM1-2 Installation of weather strips.
• Providing glass doors with bottom, up and centre
weather stripping (8 units) • RM 25.00/p
• Providing timber doors with bottom door weather
stripping (75 units):
• RM 1.50/m
RM 450.00
IM2-2 Replace T8 with T5 light fittings. • 1 T5 bulb = RM22.24
• EAC1 = 20,611.51m² For T8 (1 m2 = +/- 3 bulbs) De-
lamping of T5 (reduction about 50% of bulbs)
• Total no. of bulb = 4800
RM 77,840.00
IM3-2 Setting all split air-conditioning units at 24º and confiscating all
remote controls. • Wiring and setting the air-conditioning units =
RM80.00/unit
• Number of split air-conditioning units = 81
RM 6,480.00
TOTAL RM 135,044.00

PLANNING MALAYSIA
Sustainable Urban Development
139 © 2016 by MIP
IM1 - Installation of weather strip
Weather stripping is a material used to seal gaps around windows and exterior
doors. Caulking seals the small gaps at doors; weather-stripping seals around
them can help to make the building airtight.
IM2 - Installation of timer at AHU
Currently, the centralized air-conditioning system only supplies cool air to EAC
1, which is the main block. The air-conditioning system starts at 8:00 am and
shuts down at 10:00 pm during the weekdays and 9:00 pm on Saturdays. This
operation resulted in major energy wastage and increased energy bills. Four (4)
AHUs are found in EAC1, distributing cool air to each floor. A timer can
automatically switch air conditioners on and off, which means that an occupant
can fall asleep with a unit turned on, but the unit can automatically shut down
after an hour or so.
IM3 - Replace T8 with T5 lighting fixtures
In proposing an improvement toward energy efficient buildings, the lighting
system must be changed to a more energy efficient lighting such as T5. The T5
adapter has its own extremely efficient built-in ballast. This component can
produce more light, in particular more natural light, than before while saving
about 79% on lighting cost. Table 5 shows additional information about T5 and
T8.
Table 5: Specifications of the T5 and T8 Fluorescent Light Bulb
Des
crip
tio
n
Lig
ht
ou
tpu
t
(lu
men
s)
Lu
min
ou
s
effi
cacy
(lm
/W)
En
erg
y
Use
d
(wat
ts)
Rat
ed l
ife
(hou
rs)
Len
gth
(in
ch)
Dia
met
er
(in
ch)
Co
lou
r
tem
per
atu
re
Pri
ce
(ap
pro
xim
at
ely
) R
M
T8 1900 80 36 15, 000 36 1 4100 12.00
T5 2100 1001 21 20,000 34 0.625 3500 22.00
IM 4 - Setting all existing split air-conditioning units
In setting the temperature to be consistent at 24 C at all times, minor re-wiring
works will be conducted at the indoor unit of the split system. The occupant/user
will only have to turn on the air-conditioning system with the existing switch. All
individual remote controls will be confiscated. This improvement measure is also
in accordance with KETTHA’s requirements to have 24 C in all government
buildings (REF).
Muhammad Azzam Ismail, Karam M. Al-Obaidi & Raha Sulaiman Energy Efficiency Policy for Existing Typical Campus Buildings in the University of Malaya
© 2016 by MIP 140
IM5 – Maintenance of centralized air-conditioning system
Regular and planned preventive maintenance management is the best solution to
maintain the performance of the air-conditioning systems in any building. This
maintenance avoids failures in the operation of the units. Failures include the
following: outdoor fan does not run, compressor does not run, no cool air felt,
excessive cooling, and others.
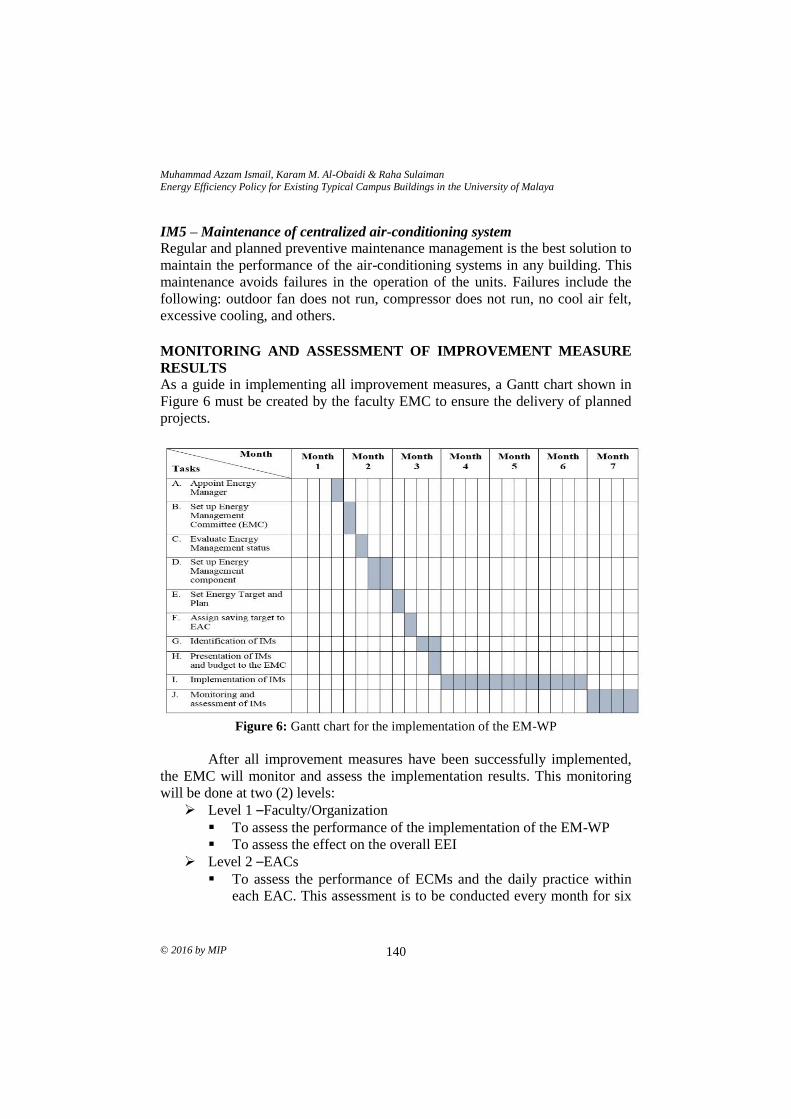
MONITORING AND ASSESSMENT OF IMPROVEMENT MEASURE
RESULTS
As a guide in implementing all improvement measures, a Gantt chart shown in
Figure 6 must be created by the faculty EMC to ensure the delivery of planned
projects.
Figure 6: Gantt chart for the implementation of the EM-WP
After all improvement measures have been successfully implemented,
the EMC will monitor and assess the implementation results. This monitoring
will be done at two (2) levels:
Level 1 –Faculty/Organization
To assess the performance of the implementation of the EM-WP
To assess the effect on the overall EEI
Level 2 –EACs
To assess the performance of ECMs and the daily practice within
each EAC. This assessment is to be conducted every month for six

PLANNING MALAYSIA
Sustainable Urban Development
141 © 2016 by MIP
(6) months after the completion of the system preparation and the
implementation of the ECMs.
The monitoring and assessment at both levels can be conducted through
the following:
Internal audit of IMs
External audit of IMs by EMC from other faculties (third party) and
student representatives (second party)
Figure 7: Gantt chart for the implementation of IMs
EXPECTED RESULTS The EMC at the studied faculty could expect that within 3 years of the
implementation of this simulated energy management plan, the faculty’s Energy
Matrix will be improved.
Expected Cost Requirements The expected cost that the studied faculty needs to invest is based on the
expenditures needed in IM. Table 6 below summarizes the expected cost of this
implementation.
Table 6: Summary of expected cost requirement
No. Task Expected cost (RM)
1 Energy Conservation Measures (ECM) 135,044.00
2 Overhead (20% from item 1) 27, 008.80
TOTAL 162,052.80

Muhammad Azzam Ismail, Karam M. Al-Obaidi & Raha Sulaiman Energy Efficiency Policy for Existing Typical Campus Buildings in the University of Malaya
© 2016 by MIP 142
Net-cost Benefits The actual electricity bill is not known; therefore, the electricity bill is calculated
through estimated figures from the technical staff of FBE, who is responsible for
the maintenance and use of the building’s facilities. Based on the estimated
annual energy consumption of the studied faculty at 240,000 kWh/month and the
electricity tariff at RM0.43 per kWh, the overall electricity bill for the whole
studied faculty is RM 1,238,400 per year. To estimate the return on investment
and the overall payback period, the EMC calculated the estimated benefit that this
faculty can gain based on payback period and energy savings target.
Payback Period
Assume the annual electricity cost for the whole building = RM 1,238,400.00
(This value includes all mechanical and electrical equipment.)
Electricity bill for air-conditioning system (estimated at 50% from total) =
RM 619,200.00
Through installing a timer, performing weather stripping, and performing
regular maintenance of the air-conditioning system, an estimated 10% reduction
in energy consumption can be achieved. Therefore,
10% reduction from RM 619, 200.00
= RM 61, 920.00 ……………………………………………… (1)
Electricity bill for lighting system (estimated at 20% from total)
= RM 247, 680.00
Through the de-lamping of the lighting fixtures, an estimated 50%
reduction in energy consumption can be achieved. However, this implementation
will be carried in stages and must be completed within three years. Therefore,
50% reduction from RM 247, 680.00 = RM 123,840.00
1st year reduction = RM 41,280.00 …… (2)
2nd year reduction = RM 82,560.00
3rd year reduction = RM 123,840.00
The expected cost requirement for the IM
= RM 162,052.80 Total saving for electricity bill (based on 1st year
reduction)
= RM 103, 200.00…………………………………………………. (1+2)
Overall payback period (based on 1st year reduction)
Payback period = Installation cost (RM 162,052.80)
Overall reduction/saving (RM 103,200.00)
= 19 months

PLANNING MALAYSIA
Sustainable Urban Development
143 © 2016 by MIP
Energy Savings Target (%)
In three years, the studied faculty could target to achieve a 5% of reduction in
yearly energy consumption and electricity bills. Calculating its initial (1st year)
energy saving target involves the following:
Estimated annual electricity bill = RM 1,238,400.00
Estimated reduction in electricity bill = RM 103,200.00
Energy savings target =
Estimated reduction (RM 103,200.00) x 100 = 8.333%
Estimated annual bill (RM 1,238,400.00)
The studied faculty will successfully achieve its 5% energy and cost
saving target approximately within one (1) year of the implementation of the
proposed improvement measures.
CONCLUSION This study has presented the chronological process of setting up a functional
energy management system for a large university campus that can be
implemented as soon as concrete confidence and commitment from the top
management of the university is gained. This energy management system follows
an established system created by AEMAS and is in line with the existing quality
management system at UM. In other words, this new energy management system
is a new dimension to the existing ISO system that the university has already
practiced for many years in its curriculum and administrative processes. The
presentation of a specific faculty’s improvement measures, budget, and timeline
indicated that with only the implementation of low-cost measures, a yearly energy
savings target of 5% can be easily achieved with an ROI of one (1) year.
ACKNOWLEDGEMENTS
The authors would like to acknowledge the funding received for this study
through the UM flagship project number FL-027 under the purview of the
Sustainability Science Cluster, UM. The authors would also like to thank all
individuals who have contributed to the successful gathering of all information
for this study.

Muhammad Azzam Ismail, Karam M. Al-Obaidi & Raha Sulaiman Energy Efficiency Policy for Existing Typical Campus Buildings in the University of Malaya
© 2016 by MIP 144
REFERENCES
Association of Water and Energy Research Malaysia's (AWER) (2014). Energy
efficiency in Malaysia sustainable production and consumption: Phasing-out
Malaysia's non-energy efficient products.
Ayres, I., Raseman, S. & Shih, A. (2013). Evidence from two large field experiments that
peer comparison feedback can reduce residential energy usage. Journal of Law,
Economics and Organization, 29(5), 992-1022.
Clean Development Mechanism (CDM) Capacity Building Project. Ministry of Energy,
Water and Communications of Malaysia.
Hignite, K. (2008). Seeking a smaller footprint. Business Officer, 42, 63-72.
Levy, B. L. & Marans, R. W. (2012). Towards a campus culture of environmental
sustainability: recommendations for a large university. International Journal of
Sustainability in Higher Education, 13(4), 365-377.
PTM and DANIDA. (2006). Study on Grid Connected Electricity Baselines in Malaysia.
Marans, R. W. & Edelstein, J. Y. (2010). The human dimension of energy conservation
and sustainability: A case study of the University of Michigan's energy
conservation program. International Journal of Sustainability in Higher
Education, 11(1), 6-18.


![[Abdullah Azzam] Tarbiyah Jihadiyah 10](https://img.dokumen.tips/doc/110x75/577cc0371a28aba7118f4861/abdullah-azzam-tarbiyah-jihadiyah-10.jpg)


![[Abdullah Azzam] Tarbiyah Jihadiyah 09](https://img.dokumen.tips/doc/110x75/577cc0371a28aba7118f4860/abdullah-azzam-tarbiyah-jihadiyah-09.jpg)
![[Abdullah Azzam] Tarbiyah Jihadiyah 11](https://img.dokumen.tips/doc/110x75/577cc0371a28aba7118f4864/abdullah-azzam-tarbiyah-jihadiyah-11.jpg)


![[Abdullah Azzam] Tarbiyah Jihadiyah 12](https://img.dokumen.tips/doc/110x75/577cc0371a28aba7118f4866/abdullah-azzam-tarbiyah-jihadiyah-12.jpg)

![[Abdullah Azzam] Tarbiyah Jihadiyah 06](https://img.dokumen.tips/doc/110x75/577cc0371a28aba7118f485b/abdullah-azzam-tarbiyah-jihadiyah-06.jpg)