Embed Size (px)
Citation preview
Advances in Satellite Oceanography(Monitoring Earth’s water resources)
UG-DMFS Summer Program (AUGUST 1-5, 2016)
Ebenezer Nyadjro
US Naval Research Lab/
University of New Orleans
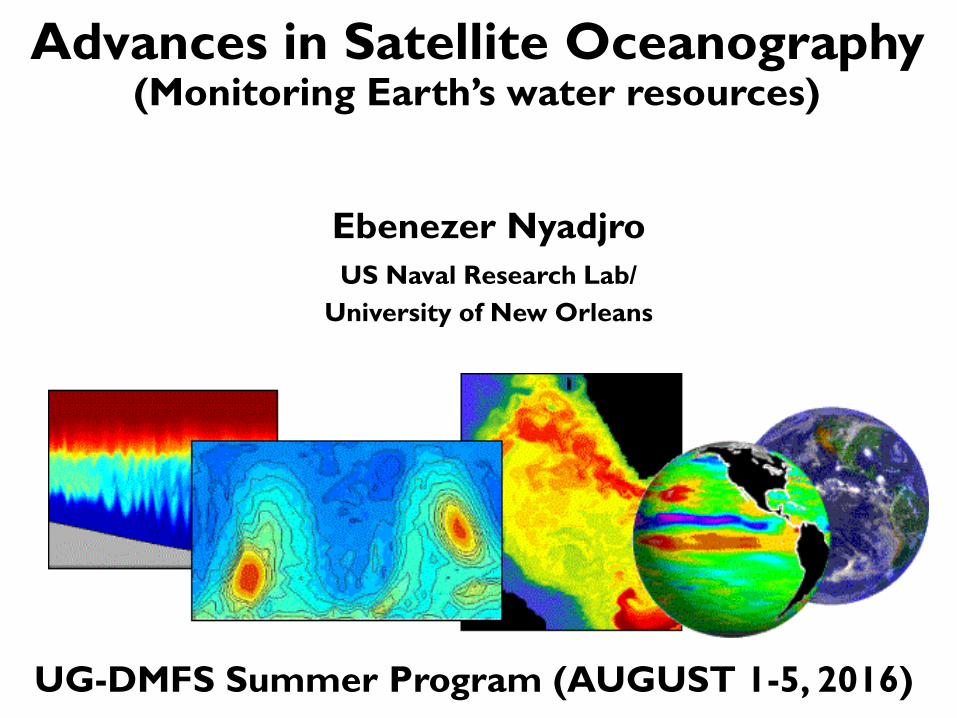
Outline:
Remote Sensing: brief intro
Salinity sensing
GRACE
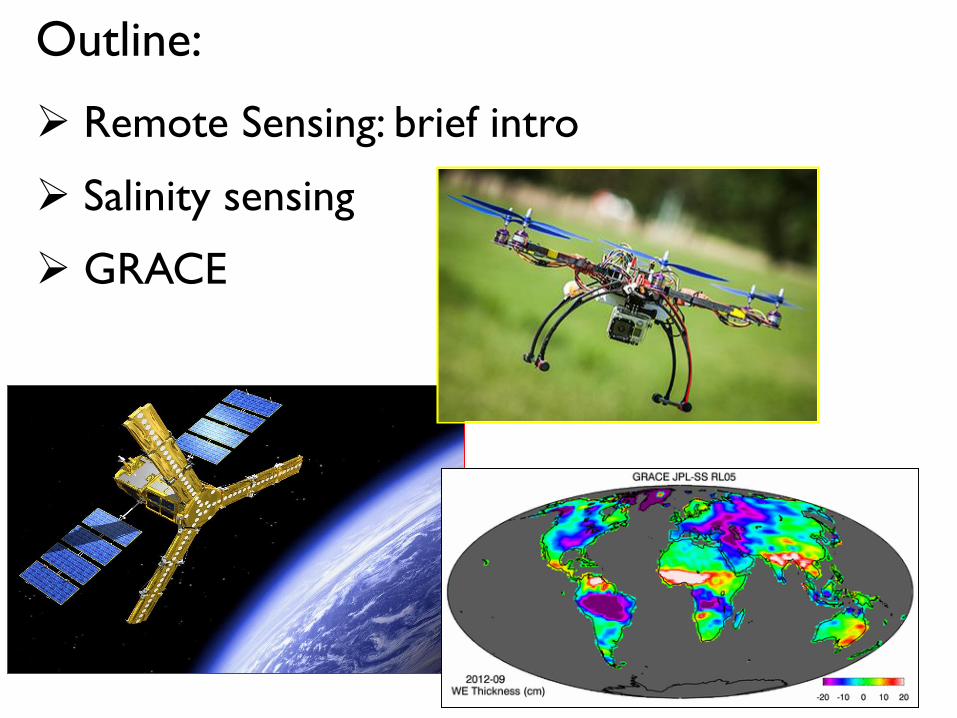
Introduction ASPRS adopted a combined formal
definition of photogrammetry and
remote sensing as (Colwell, 1997):
“the art, science, and
technology of obtaining
reliable information about
physical objects and the
environment, through the
process of recording,
measuring and interpreting
imagery and digital
representations of energy
patterns derived from
noncontact sensor
systems”.3
.

Remote Sensing: A brief history
4
Hot-air Balloons
Invented by the
Montgolfier Brothers
in 1783
1858 Gaspard Felix Tournachon
(Nadar) takes first aerial
photograph near Paris, using a
captive balloon and a collodion
plate. Unfortunately, this first aerial
photograph did not survive.
Gaspard Felix
Tournachon (Nadar)
.

Remote Sensing: A brief history
5
In 1903, Julius Neubronner
patented a breast-
mounted camera for
carrier pigeons that
weighed only 70 grams.
A squadron of pigeons is
equipped with light-weight
70-mm aerial cameras.
.
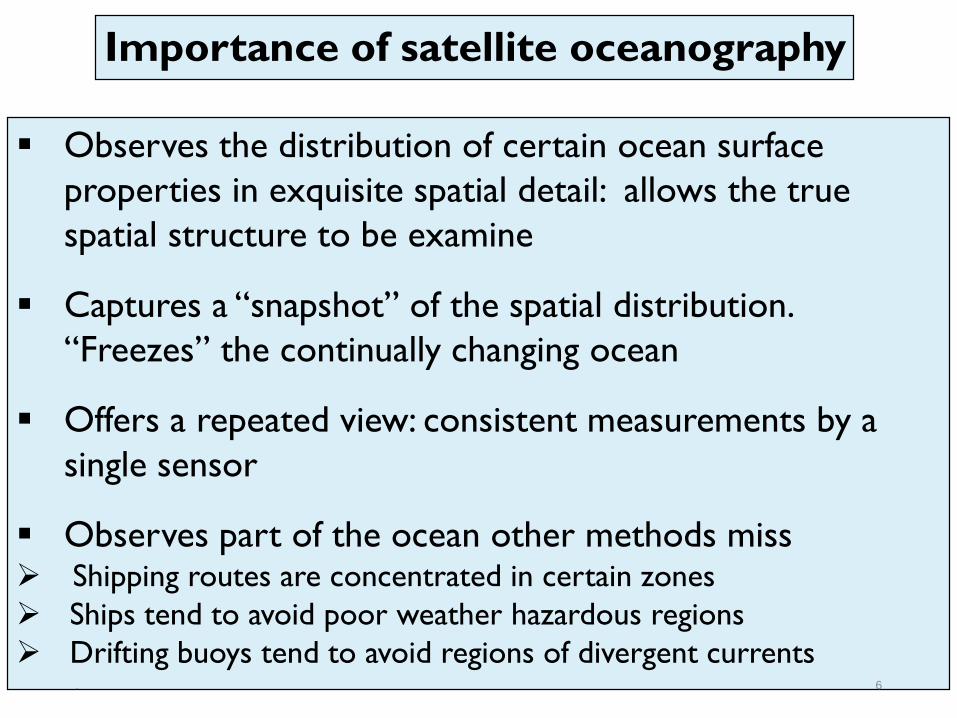
Importance of satellite oceanography
Observes the distribution of certain ocean surface
properties in exquisite spatial detail: allows the true
spatial structure to be examine
Captures a “snapshot” of the spatial distribution.
“Freezes” the continually changing ocean
Offers a repeated view: consistent measurements by a
single sensor
Observes part of the ocean other methods miss Shipping routes are concentrated in certain zones
Ships tend to avoid poor weather hazardous regions
Drifting buoys tend to avoid regions of divergent currents 6.
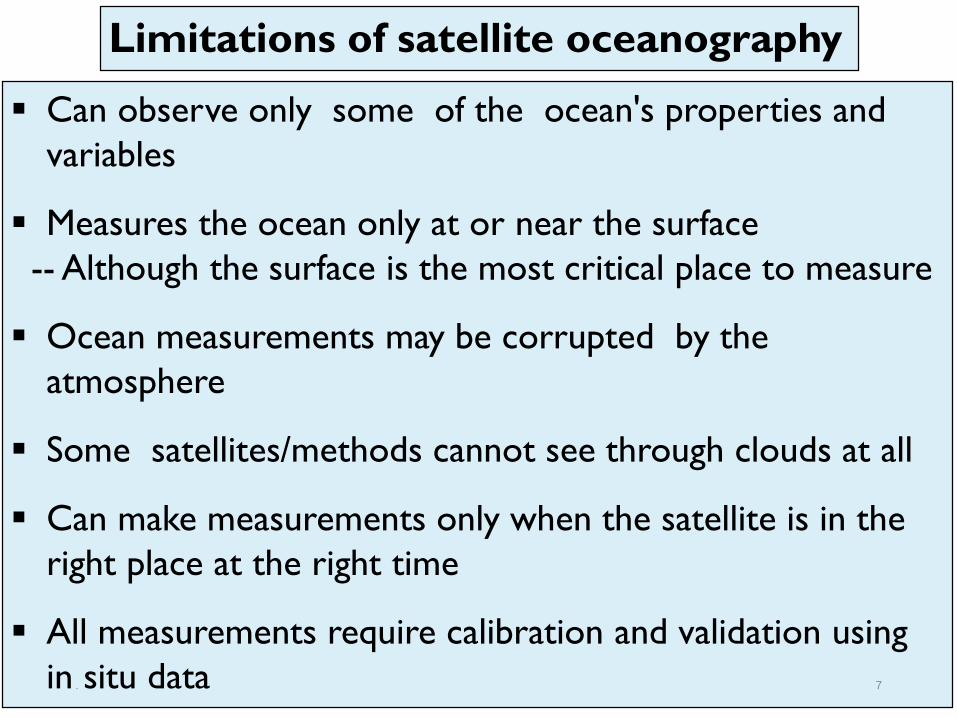
Limitations of satellite oceanography
Can observe only some of the ocean's properties and
variables
Measures the ocean only at or near the surface
-- Although the surface is the most critical place to measure
Ocean measurements may be corrupted by the
atmosphere
Some satellites/methods cannot see through clouds at all
Can make measurements only when the satellite is in the
right place at the right time
All measurements require calibration and validation using
in situ data 7.
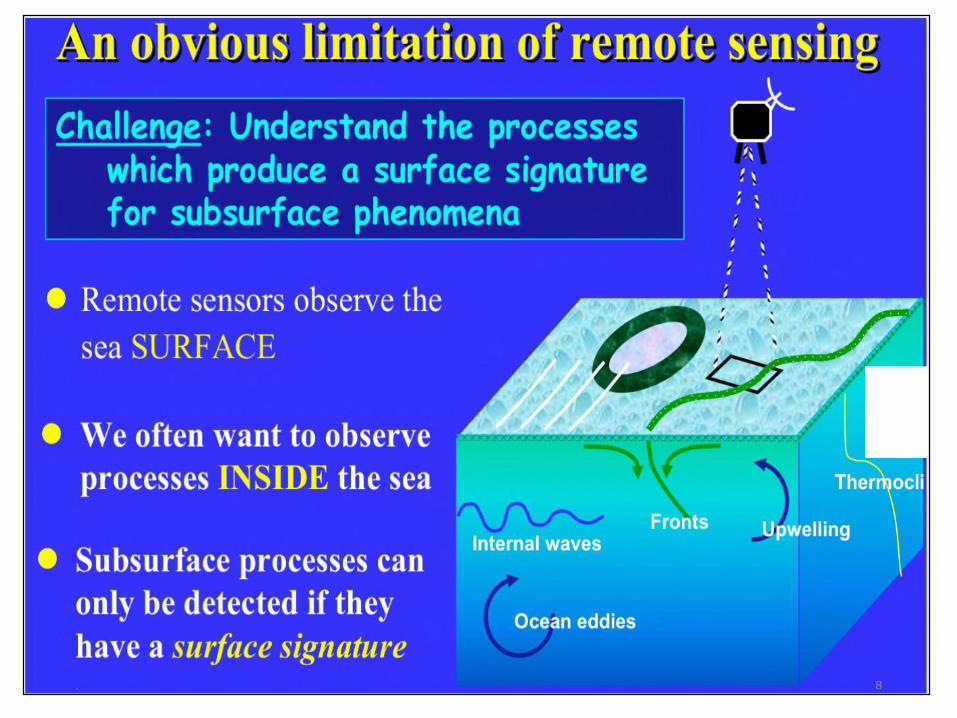
8.

A summary of sensor types & what they measure
9.
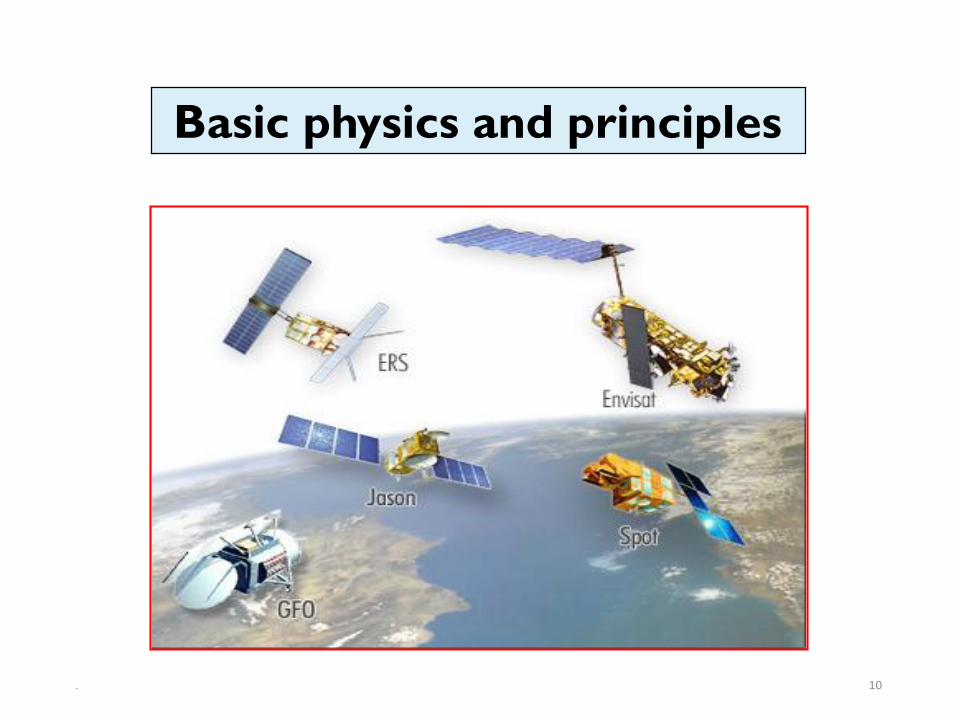
Basic physics and principles
10.

Sources of energy for remote sensing
The Sun---Visible waveband
--- Near Infra red waveband
Thermal emission by the ocean surface--- Thermal infra red
--- Microwaves
Energy source on the satellite--- Microwaves (Radar)
---Visible (Lidar)11.

Electromagnetic Spectrum The Sun produces a
continuous spectrum of
energy from gamma rays to
radio waves that continually
bathe the Earth in energy.
The visible portion of the
spectrum may be measured
using wavelength
(micrometers or
nanometers) or electron
volts (eV).
All units are
interchangeable.

Remote Sensor Resolution Considerations
• Spatial - the size of the field-of-view,
e.g. 10 10 m.
• Spectral - the number and size of spectral regions
(or frequencies) the sensor records data in,
e.g. blue, green, red, near-infrared, thermal infrared.
• Temporal - how often the sensor acquires data,
e.g., every 30 days.
• Radiometric - sensitivity of detectors to small
difference in electromagnetic energy.
B G R NIR
Jan
16
Feb
16
10 m
10 m
8-bit
(0 - 255)
10-bit
(0 - 1023)
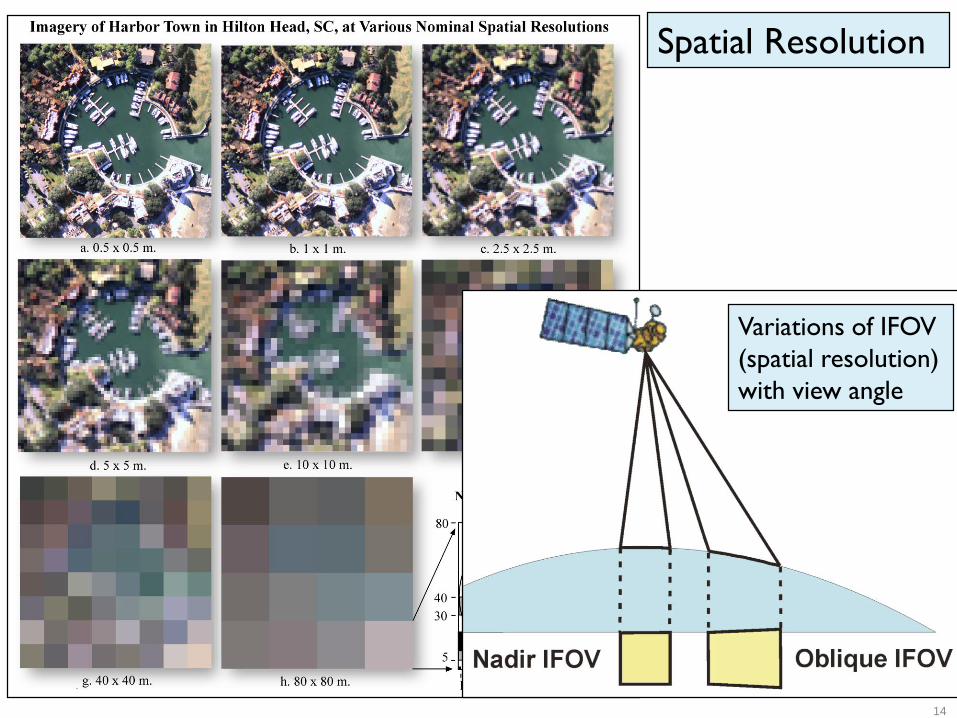
Spatial Resolution
Variations of IFOV
(spatial resolution)
with view angle
14
.

RECAP: Satellite data sources
15
• Radiometers: sea surface temperature
-- Envisat (AATSR) -- NOAA (AVHRR)
• Spectral sensors: ocean color and water quality
-- Envisat (MERIS) -- Aqua (MODIS) -- Quickbird
• Altimeters: SSH, SWH, surface wind speed, ocean currents
-- Envisat -- Jason-1 -- Jason-2 -- GFO-- ERS-2
• Scatterometers: surface wind speed and direction.
-- QuikSCAT -- ASCAT -- ERS-2
• Synthetic Aperture Radars (SAR): winds, waves,
currents, oil slicks and ship detection.
-- Envisat (ASAR) -- Radarsat -- TerraSAR-X
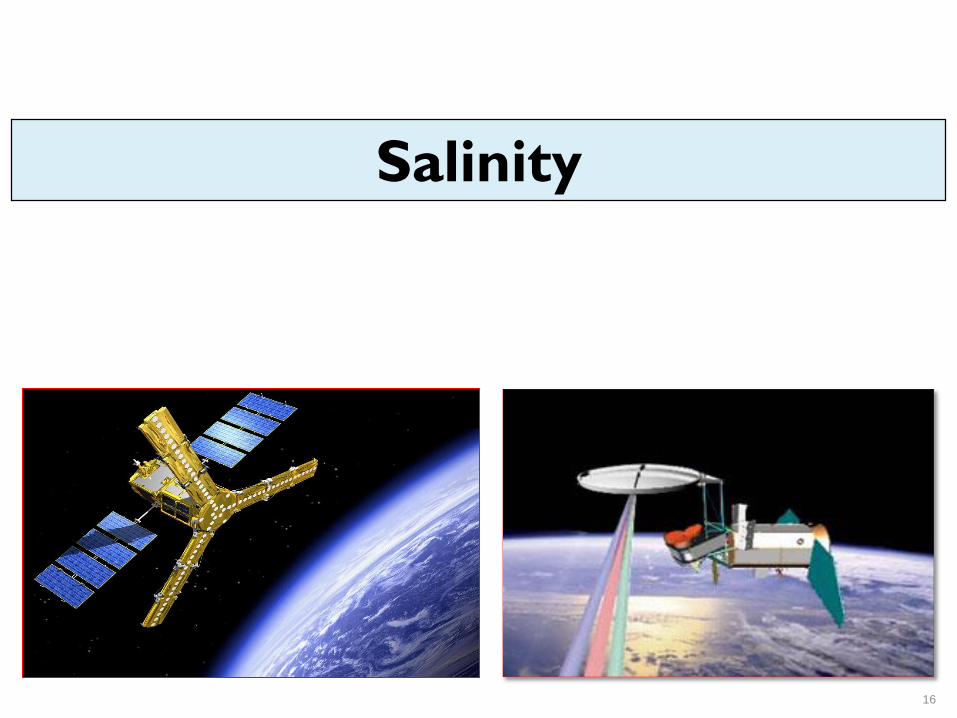
Salinity
16

density/water mass
ocean circulation
hydrological cycle
air-sea interaction
Importance of salinity
Schmitz, 200517
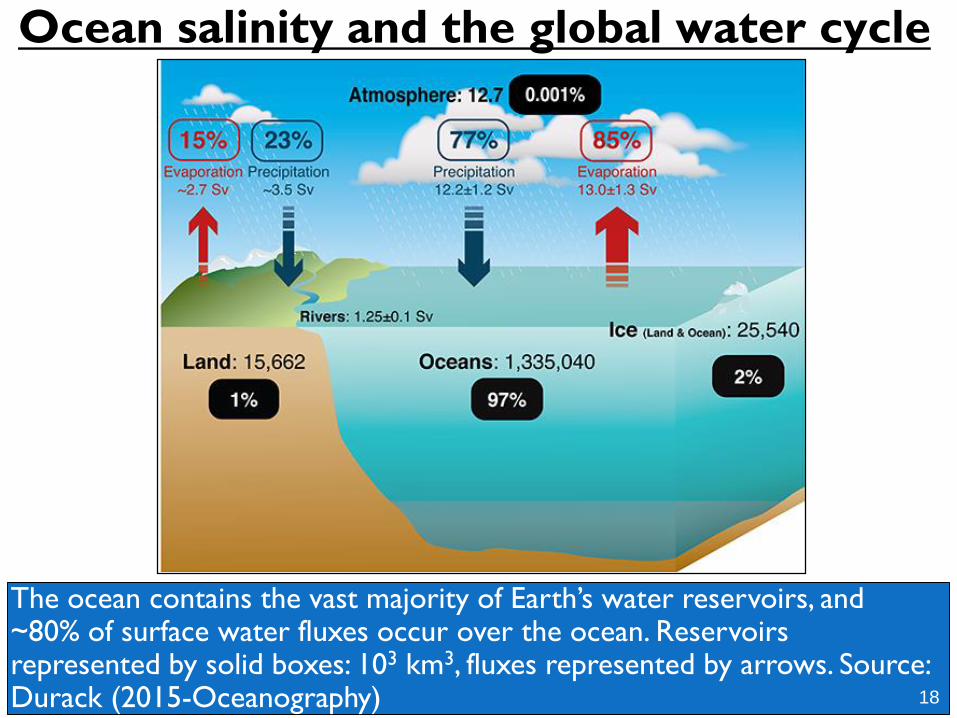
Ocean salinity and the global water cycle
The ocean contains the vast majority of Earth’s water reservoirs, and ~80% of surface water fluxes occur over the ocean. Reservoirs represented by solid boxes: 103 km3, fluxes represented by arrows. Source: Durack (2015-Oceanography) 18
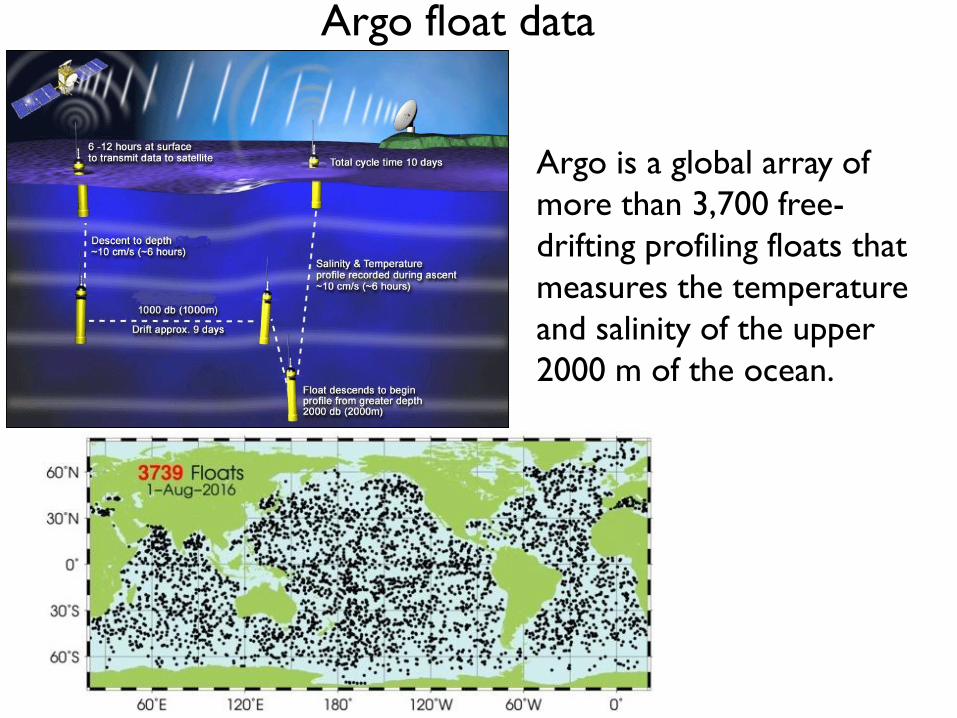
Argo float data
Argo is a global array of
more than 3,700 free-
drifting profiling floats that
measures the temperature
and salinity of the upper
2000 m of the ocean.
19

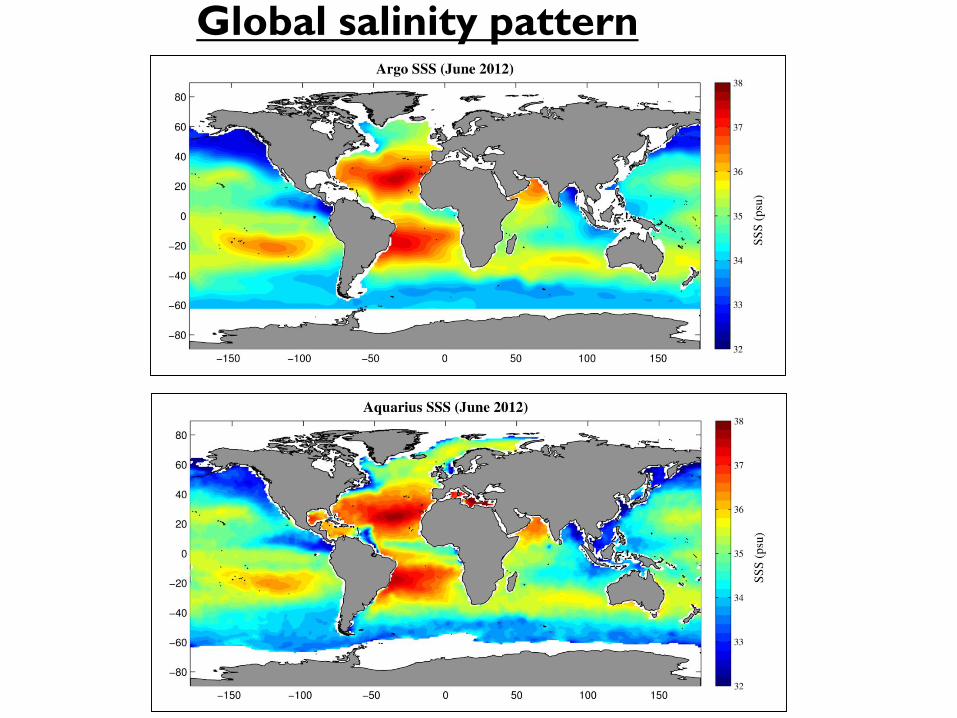
Global salinity pattern
20
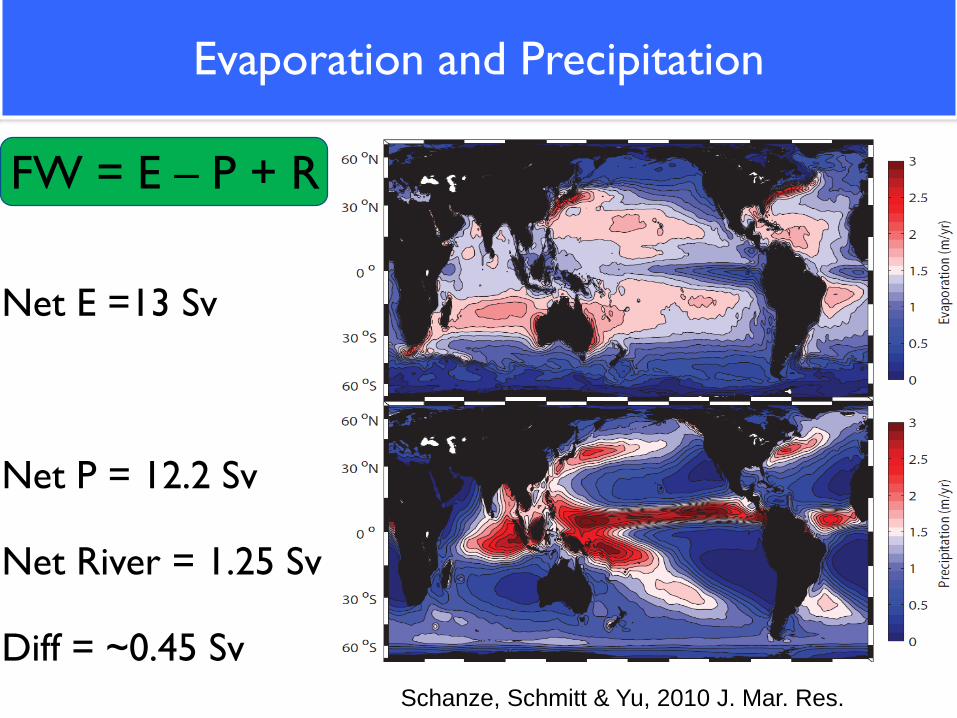
Net E =13 Sv
Net P = 12.2 Sv
Net River = 1.25 Sv
Diff = ~0.45 Sv Schanze, Schmitt & Yu, 2010 J. Mar. Res.
Evaporation and Precipitation
FW = E – P + R

Evaporation Minus Precipitation and Salinity
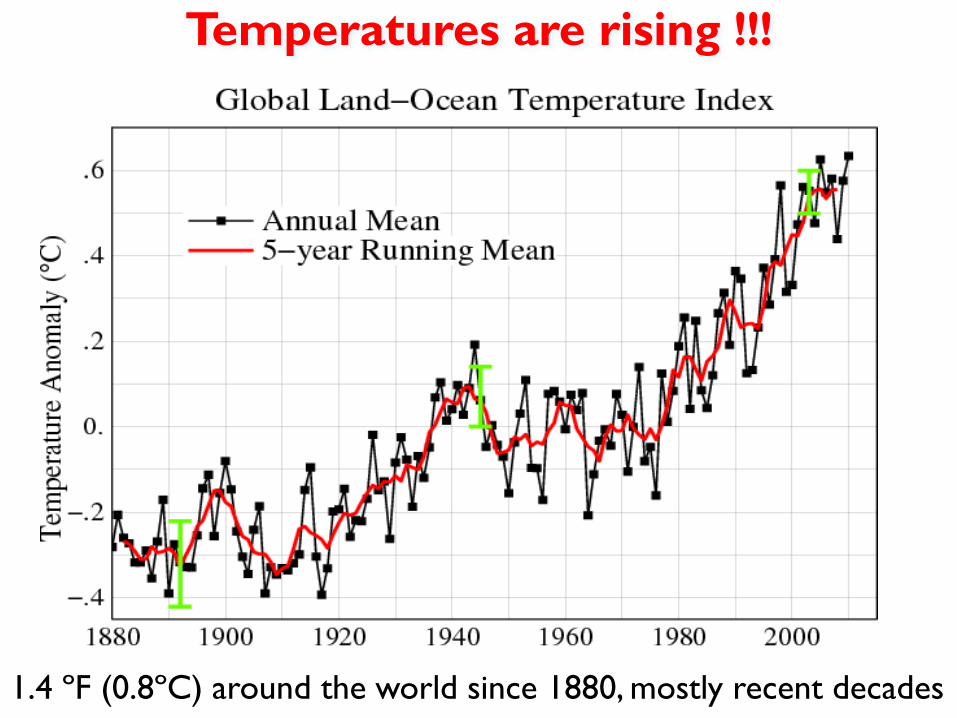
Temperatures are rising !!!
1.4 ºF (0.8ºC) around the world since 1880, mostly recent decades
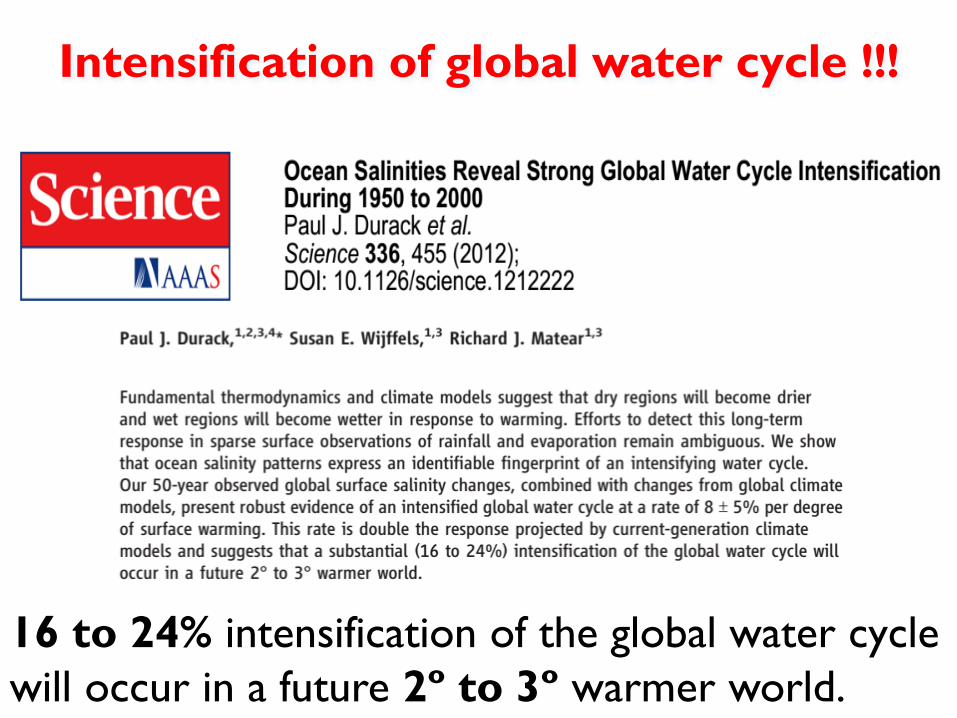
Intensification of global water cycle !!!
16 to 24% intensification of the global water cycle
will occur in a future 2º to 3º warmer world.

Loss of 0.32 Sv due to evaporation
• Evaporative loss of water from the Atlantic; compensated by a net import of
water from the Pacific.
• Increase in Atl salinity compensated by less salty Pacific waters
• In warming climate, inter-basin contrasts increase (saltier Atl, fresher Pacific)
• Warming-driven amplification of the Earth’s hydrological cycle
• Due to simple physics - warm air carries more water vapor
Dry regions will become drier; wet regions will become
wetter in response to warming
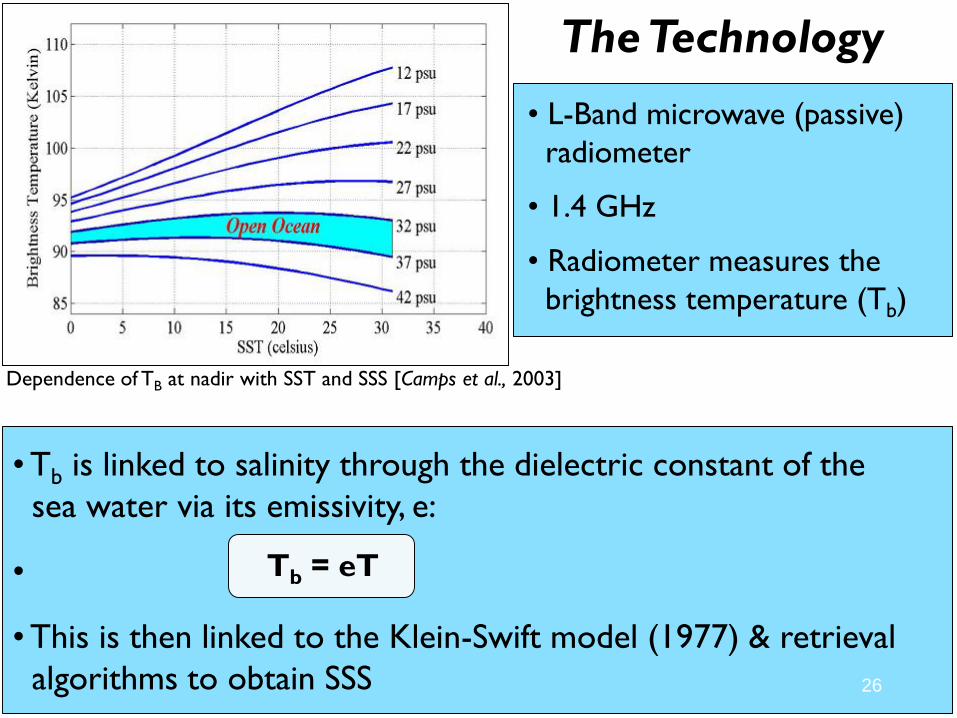
Dependence of TB at nadir with SST and SSS [Camps et al., 2003]
The Technology
• L-Band microwave (passive)
radiometer
• 1.4 GHz
• Radiometer measures the
brightness temperature (Tb)
• Tb is linked to salinity through the dielectric constant of the
sea water via its emissivity, e:
•
• This is then linked to the Klein-Swift model (1977) & retrieval
algorithms to obtain SSS
Tb = eT
26

The Technology
• Tb depends on salinity through the dielectric constant (εr)
εr = 88.045 - 0.4147 T + 6.295 × 10⁻⁴ T2 +1.075 ×10⁻⁵ T3
(Klein and Swift, 1977)
27
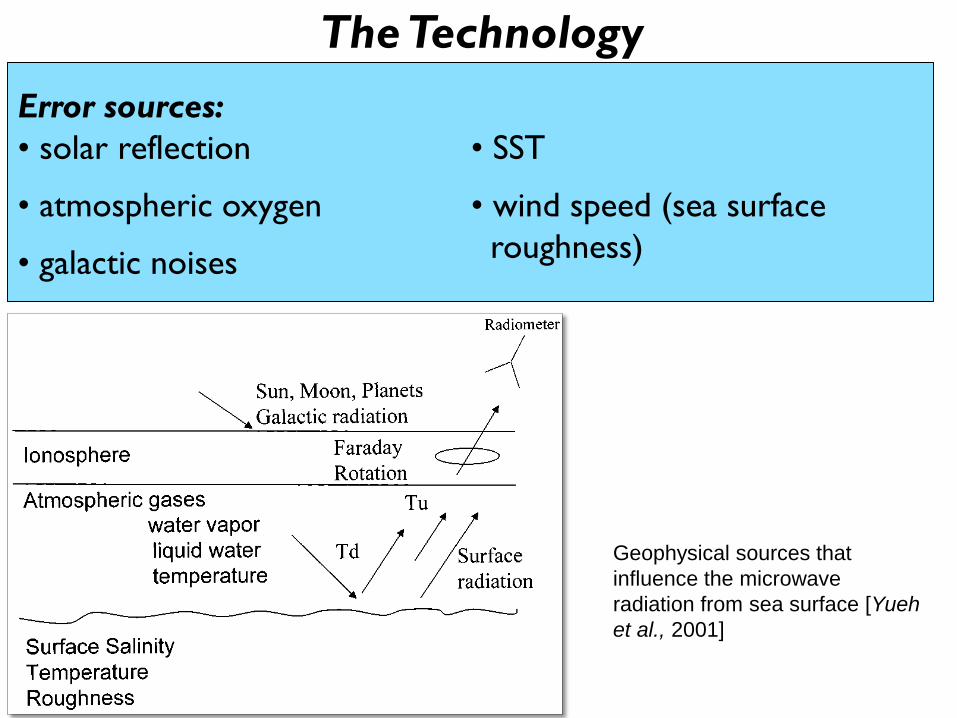
Error sources:
• solar reflection
• atmospheric oxygen
• galactic noises
• SST
• wind speed (sea surface
roughness)
Geophysical sources that
influence the microwave
radiation from sea surface [Yueh
et al., 2001]
The Technology
28
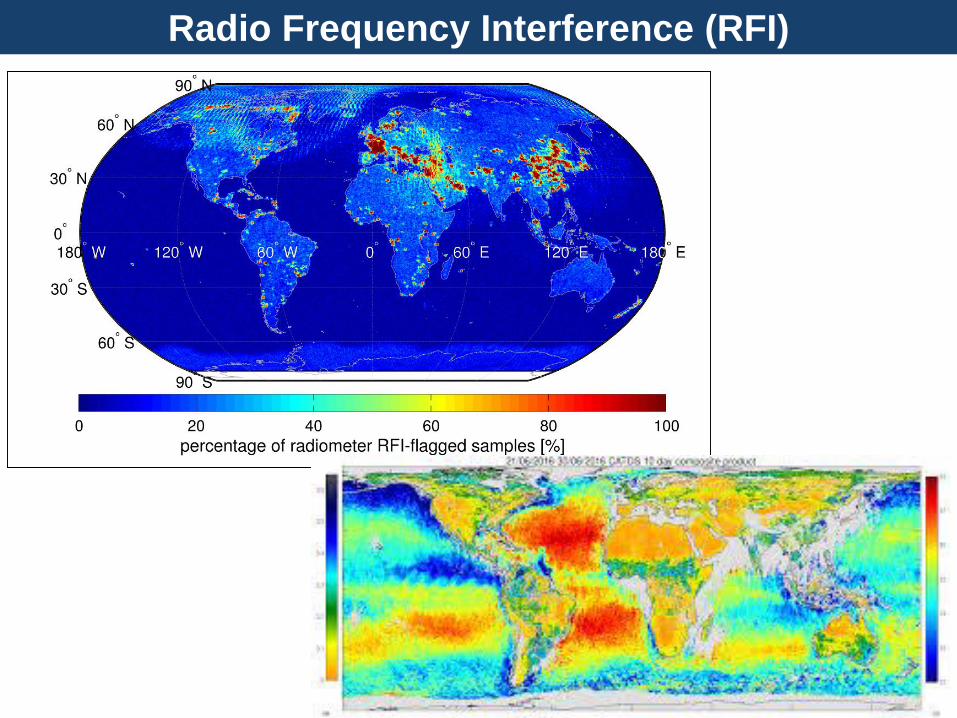
Radio Frequency Interference (RFI)

• European Space Agency (ESA)
• Launched on 2 November 2009
• Soil moisture (SM) and ocean salinity (OS)
• Resolution : 1-3 days & 45 km
•Accuracy of 0.1 psu/ 30 days/200 km
The SMOS satellite
Soil Moisture and Ocean Salinity (SMOS)
Amazon freshwater plume from SMOS
30
VLA (Socorro, NM)
representation of SMOS
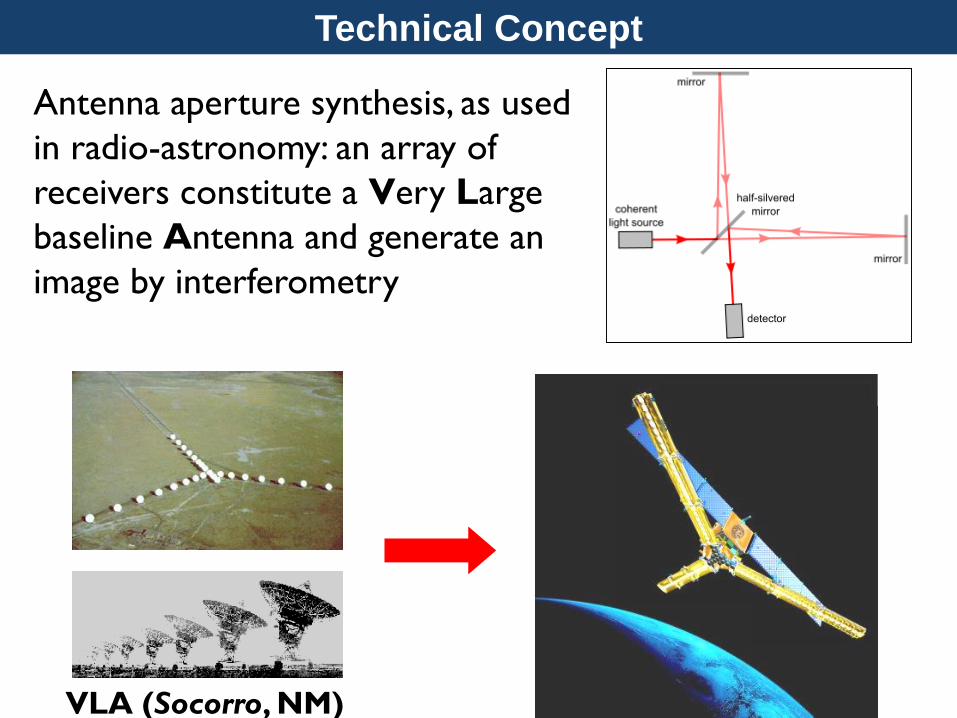
Antenna aperture synthesis, as used
in radio-astronomy: an array of
receivers constitute a Very Large
baseline Antenna and generate an
image by interferometry
Technical Concept
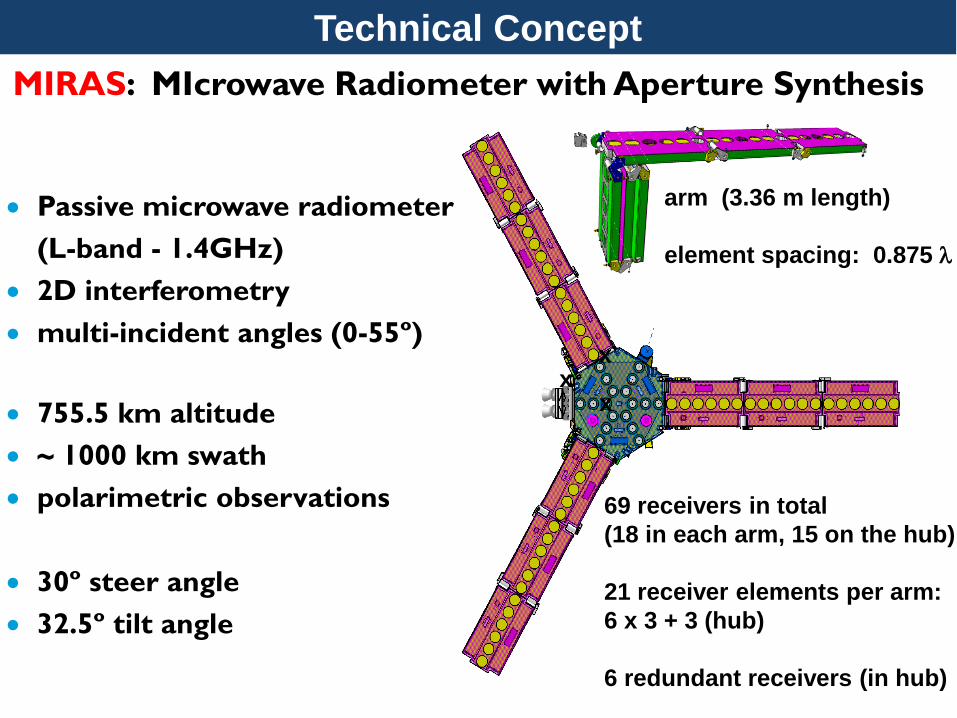
Passive microwave radiometer
(L-band - 1.4GHz)
2D interferometry
multi-incident angles (0-55º)
755.5 km altitude
~ 1000 km swath
polarimetric observations
30º steer angle
32.5º tilt angle
Technical Concept
69 receivers in total
(18 in each arm, 15 on the hub)
21 receiver elements per arm:
6 x 3 + 3 (hub)
6 redundant receivers (in hub)
arm (3.36 m length)
element spacing: 0.875 l
x
xx
MIRAS: MIcrowave Radiometer with Aperture Synthesis

Aquarius• NASA & CONAE; launched10 June 2011; died June 2015
• MWR-ocean wind & direction, rain, sea ice
• NIRST – SST; 3 bands
• Resolution: 7 days & 150 km
• Accuracy: 0.2 psu/30 days/150 km
Aquarius satellite in orbit Aquarius global mean SSS33
Global salinity pattern
34
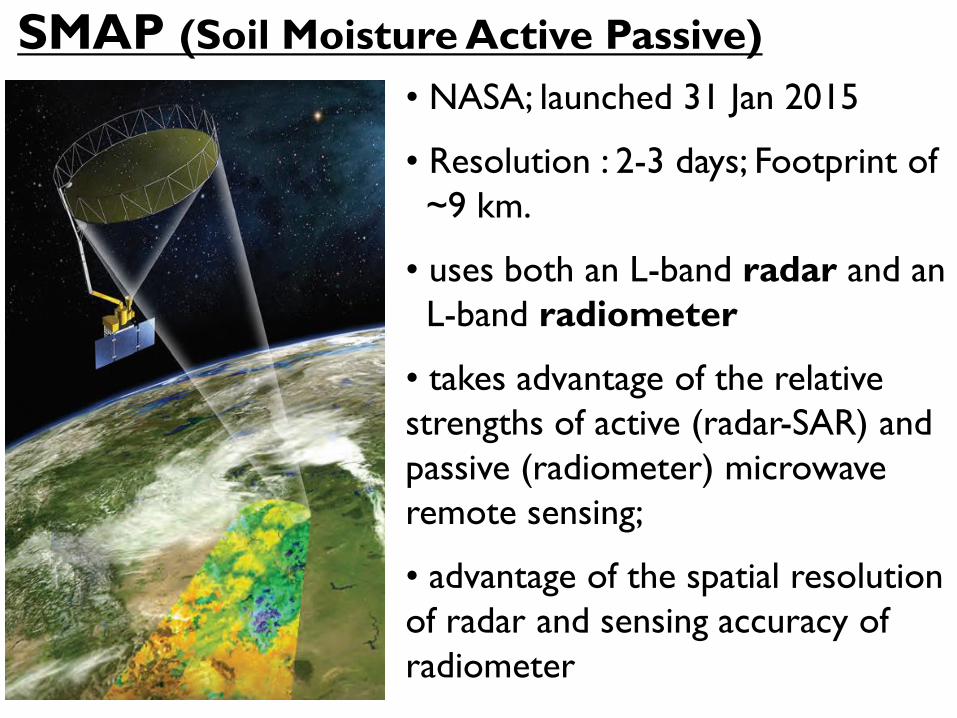
• NASA; launched 31 Jan 2015
• Resolution : 2-3 days; Footprint of
~9 km.
• uses both an L-band radar and an
L-band radiometer
• takes advantage of the relative
strengths of active (radar-SAR) and
passive (radiometer) microwave
remote sensing;
• advantage of the spatial resolution
of radar and sensing accuracy of
radiometer
SMAP (Soil Moisture Active Passive)

SMAP• measures the amount of water in the top 5 cm (2 in) of soil
• help study Earth's water, energy and carbon cycles
• soil moisture is a primary state variable of hydrology and
the water cycle over land.
SMAP radar image. Weaker radar
signals (blues) reflect low soil
moisture or lack of vegetation,
such as in deserts.
Strong radar signals (reds) are
seen in forests. SMAP's radar
also takes data over the ocean
and sea ice.
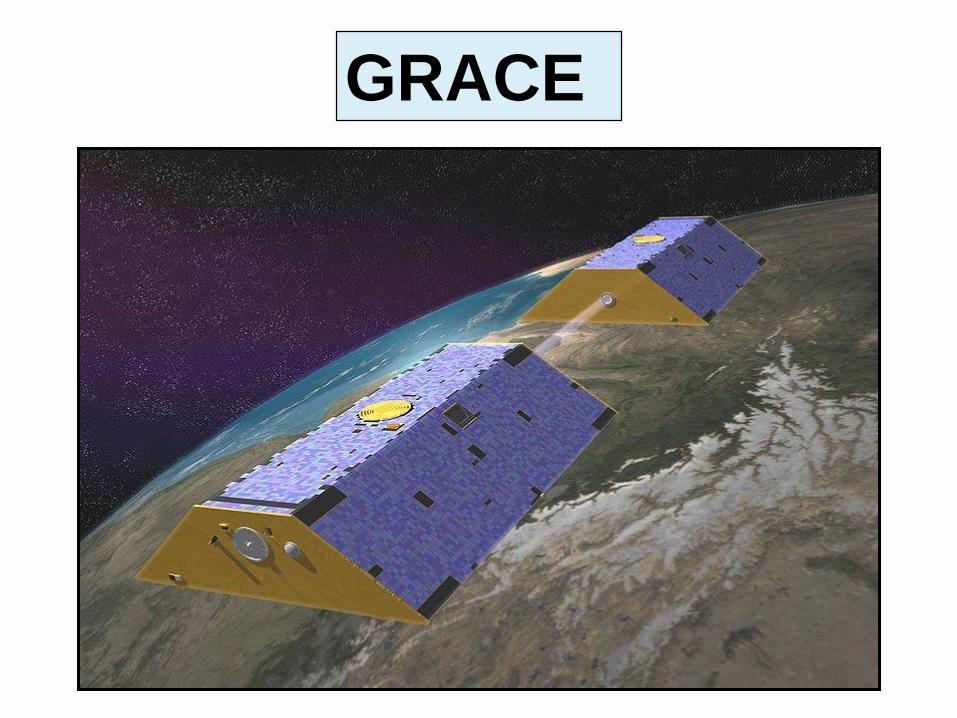
GRACE
37
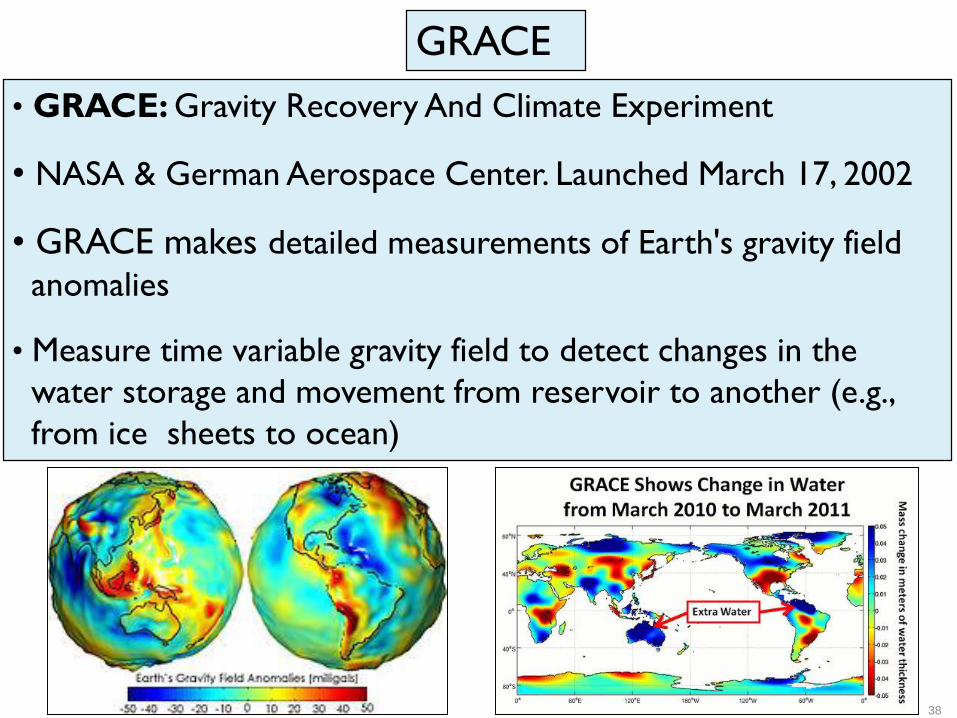
GRACE
38
• GRACE: Gravity Recovery And Climate Experiment
• NASA & German Aerospace Center. Launched March 17, 2002
• GRACE makes detailed measurements of Earth's gravity field
anomalies
• Measure time variable gravity field to detect changes in the
water storage and movement from reservoir to another (e.g.,
from ice sheets to ocean)
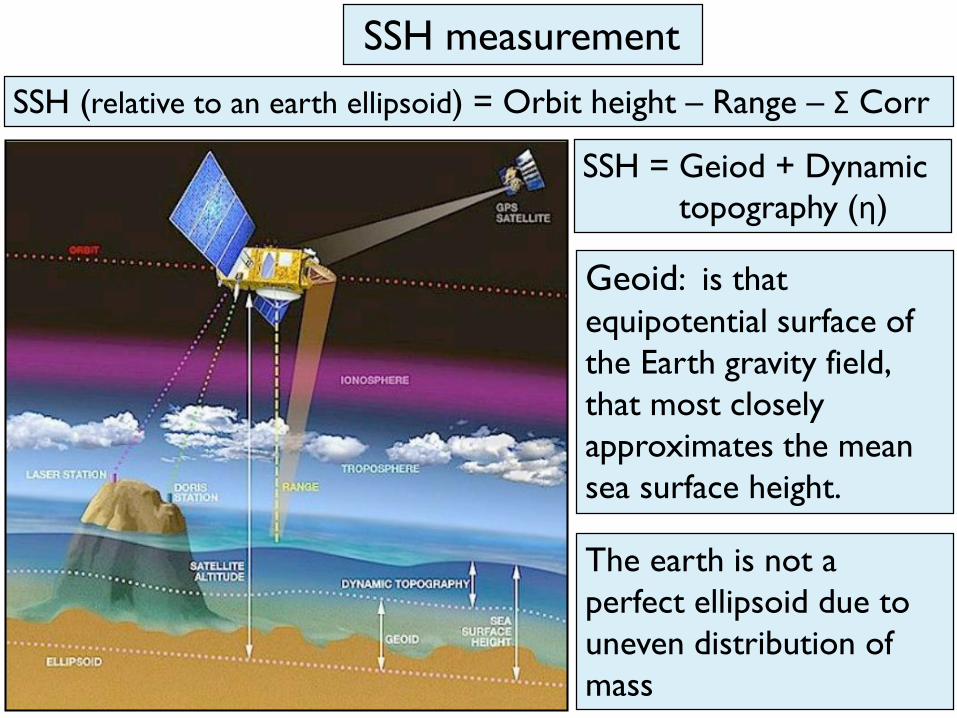
SSH measurement
Geoid: is that
equipotential surface of
the Earth gravity field,
that most closely
approximates the mean
sea surface height.
SSH (relative to an earth ellipsoid) = Orbit height – Range – Σ Corr
39
The earth is not a
perfect ellipsoid due to
uneven distribution of
mass
SSH = Geiod + Dynamic
topography (η)
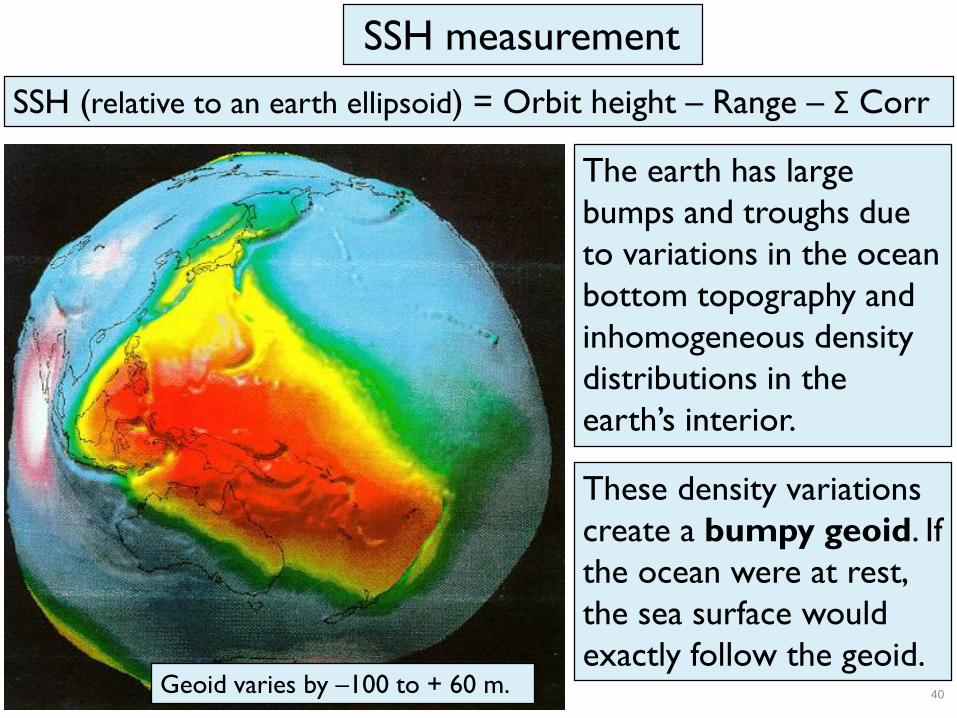
SSH measurement
SSH (relative to an earth ellipsoid) = Orbit height – Range – Σ Corr
40
These density variations
create a bumpy geoid. If
the ocean were at rest,
the sea surface would
exactly follow the geoid.
The earth has large
bumps and troughs due
to variations in the ocean
bottom topography and
inhomogeneous density
distributions in the
earth’s interior.
Geoid varies by –100 to + 60 m.
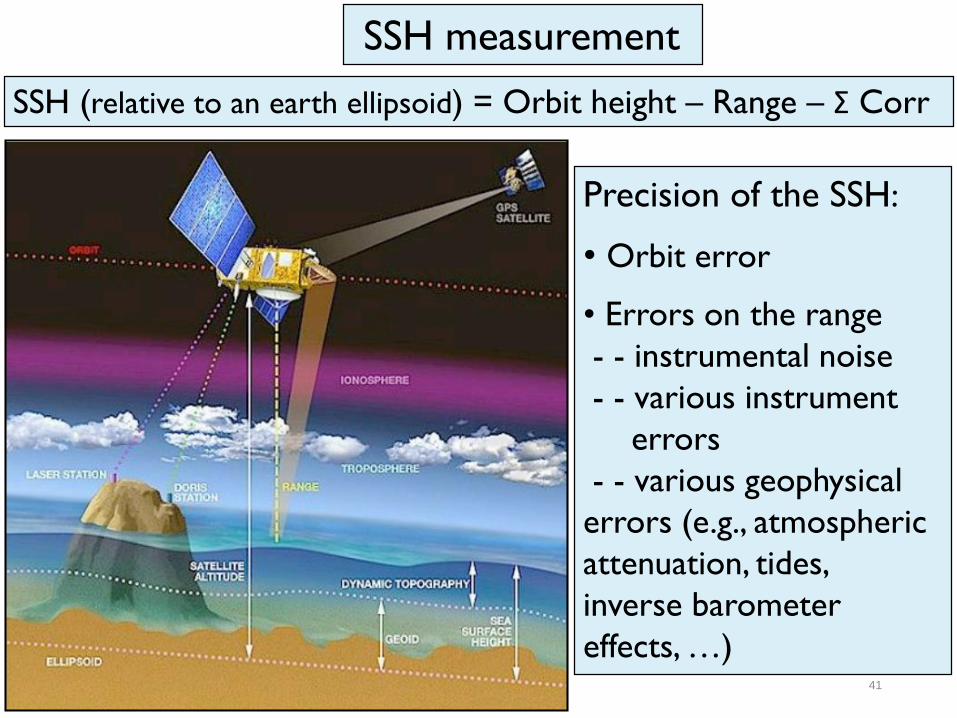
SSH measurement
SSH (relative to an earth ellipsoid) = Orbit height – Range – Σ Corr
41
Precision of the SSH:
• Orbit error
• Errors on the range
- - instrumental noise
- - various instrument
errors
- - various geophysical
errors (e.g., atmospheric
attenuation, tides,
inverse barometer
effects, …)
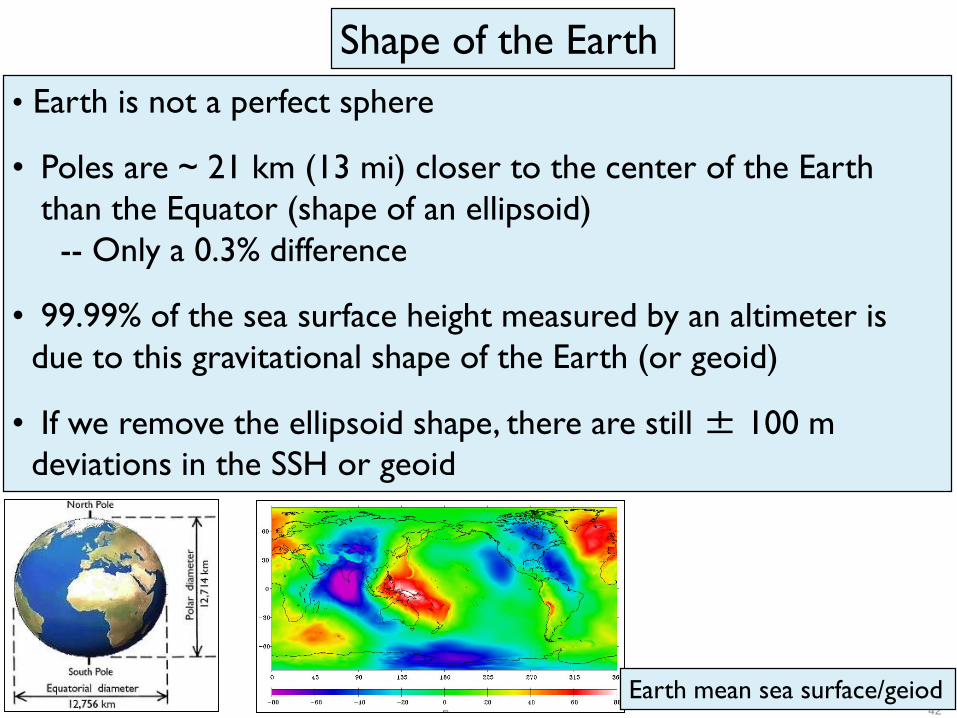
Shape of the Earth
42
• Earth is not a perfect sphere
• Poles are ~ 21 km (13 mi) closer to the center of the Earth
than the Equator (shape of an ellipsoid)
-- Only a 0.3% difference
• 99.99% of the sea surface height measured by an altimeter is
due to this gravitational shape of the Earth (or geoid)
• If we remove the ellipsoid shape, there are still ± 100 m
deviations in the SSH or geoid
Earth mean sea surface/geiod

GRACE: Measurement principle
43
• uses a microwave ranging system to accurately measure changes
in the speed and distance between two identical spacecraft
flying in a polar orbit about 220 kilometers (140 mi) apart, 500
kilometers (310 mi) above Earth.

GRACE: Measurement principle
44
• The ranging system is
sensitive enough to detect
separation changes as small as
10 micrometers
• (approximately one-tenth the
width of a human hair) over a
distance of 220 kilometers
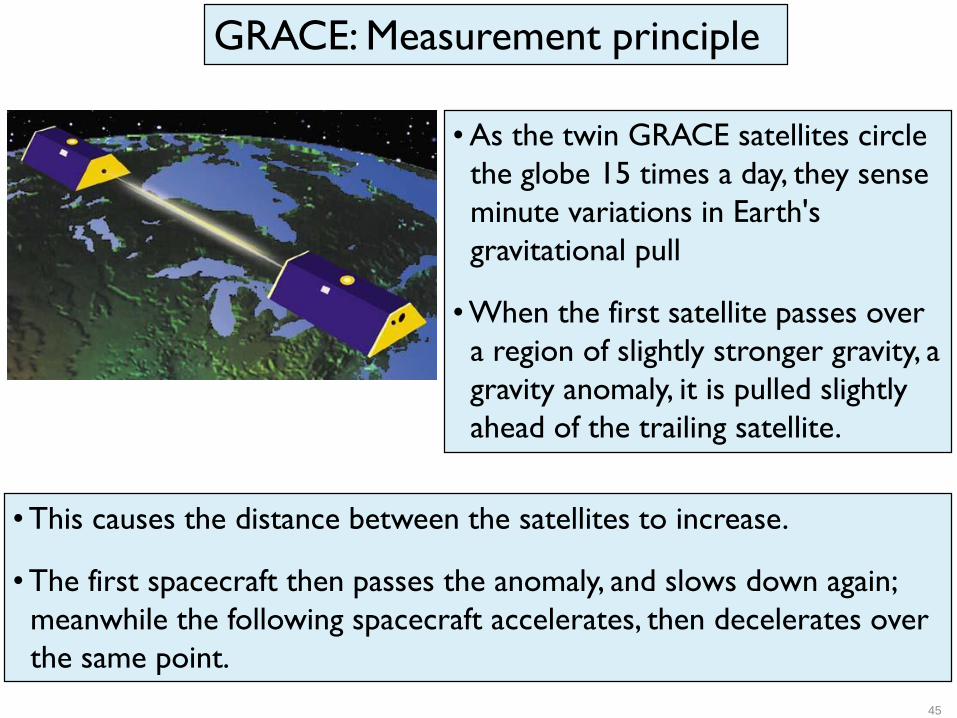
GRACE: Measurement principle
45
• As the twin GRACE satellites circle
the globe 15 times a day, they sense
minute variations in Earth's
gravitational pull
• When the first satellite passes over
a region of slightly stronger gravity, a
gravity anomaly, it is pulled slightly
ahead of the trailing satellite.
• This causes the distance between the satellites to increase.
• The first spacecraft then passes the anomaly, and slows down again;
meanwhile the following spacecraft accelerates, then decelerates over
the same point.

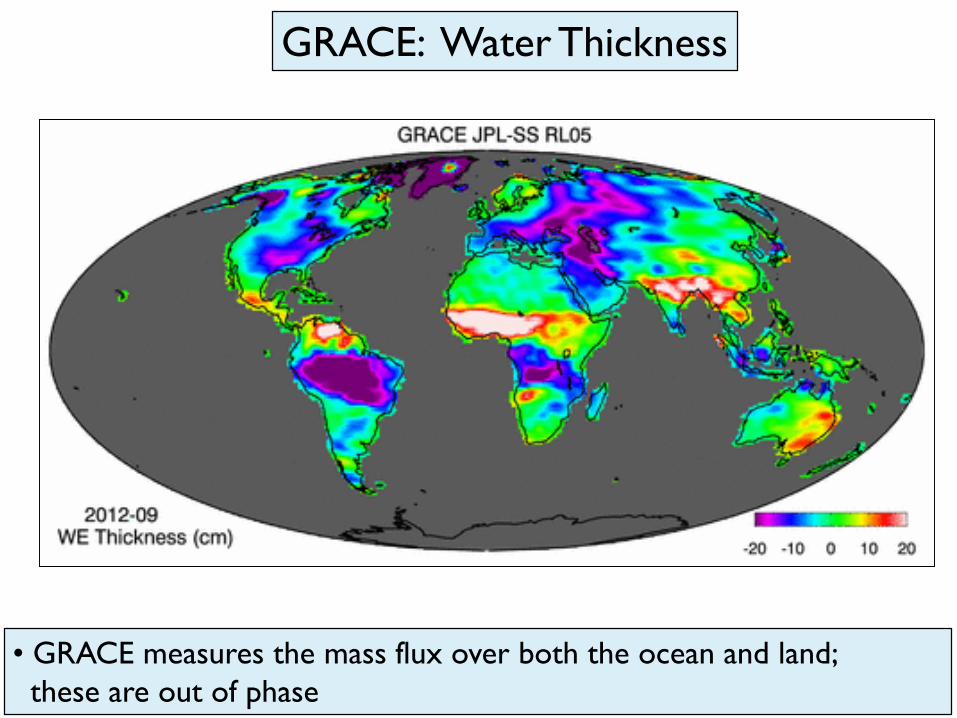
GRACE: Water Thickness
46
• GRACE measures the mass flux over both the ocean and land;
these are out of phase
GRACE: Water Thickness
47
• GRACE measures the mass flux over both the ocean and land;
these are out of phase
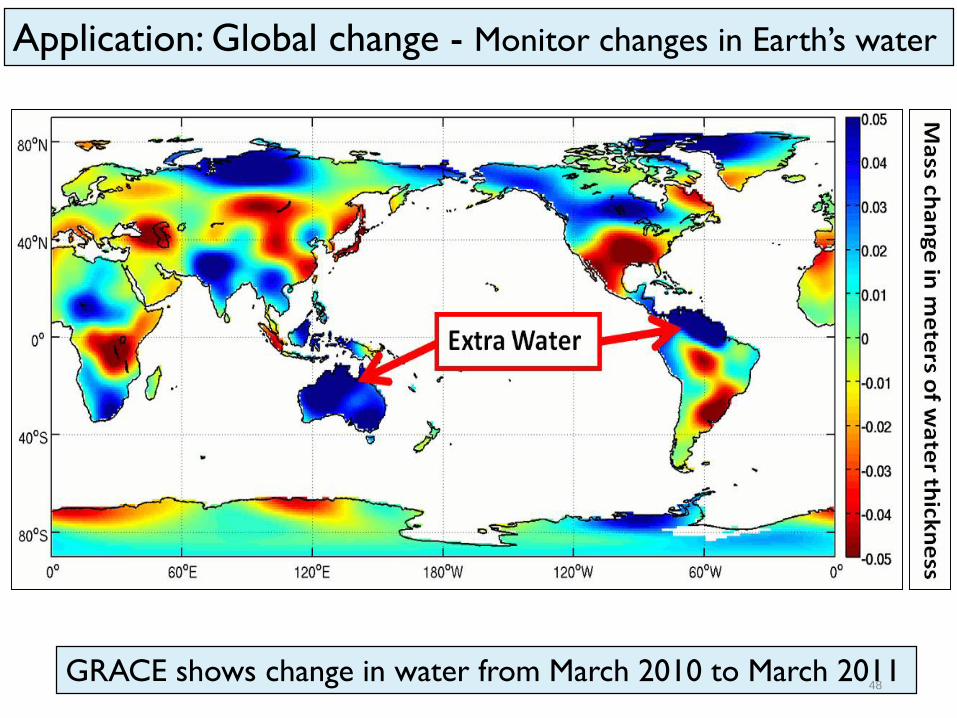
Application: Global change - Monitor changes in Earth’s water
GRACE shows change in water from March 2010 to March 201148

Application: Global change - Monitor changes in Earth’s water
Global mean sea level (GMSL) derived from GRACE and from altimetry.49

GRACE: Sea level changes
50
• Globally averaged sea level rise
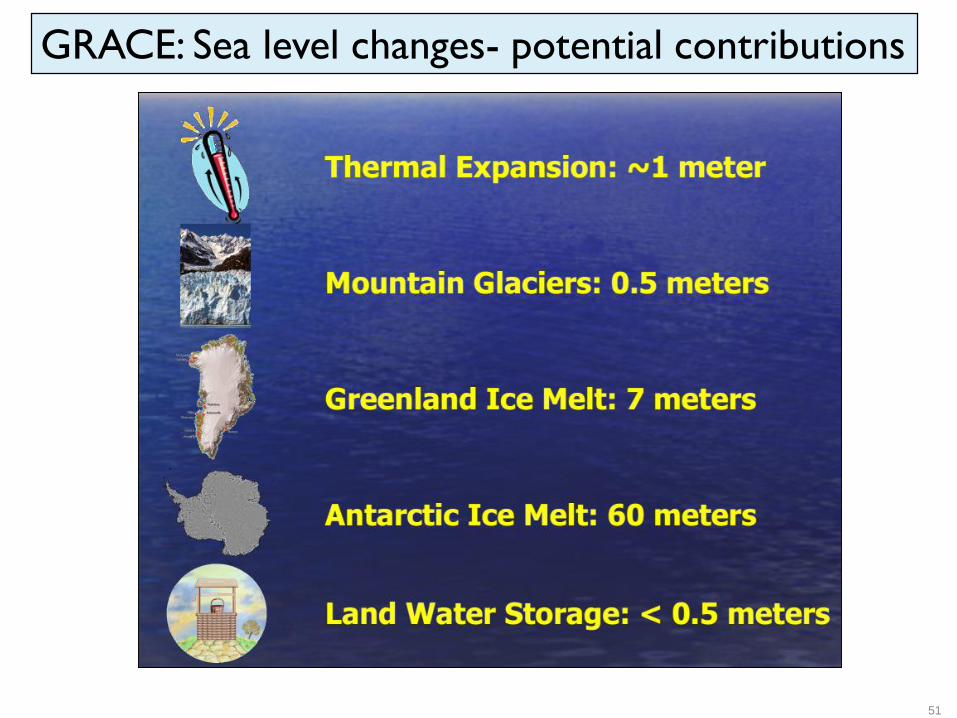
GRACE: Sea level changes- potential contributions
51