Embed Size (px)
Citation preview
MSBM -11-98 - 1
New Product Design
Role of design in new product development
Conjoint Analysis for product design
Air pollution control equipment example
MSBM -11-98 - 2
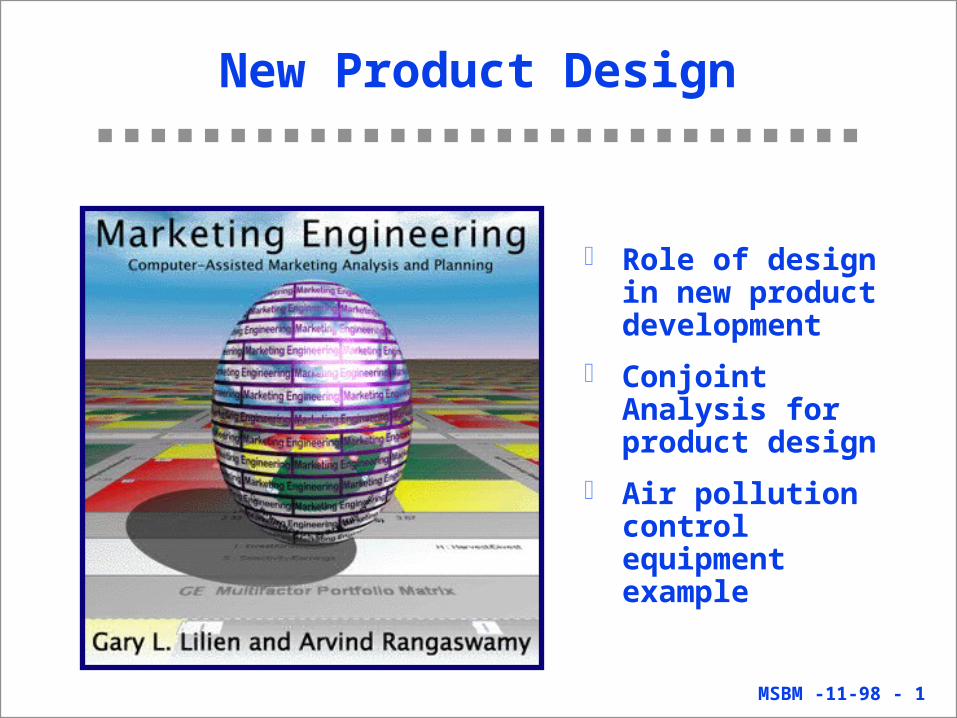
Where companies want to put their efforts in new product development:
Getting our new products to the market on time, as planned (76% of companies interviewed).
Improving the appeal of our new products to customers (73%).
Developing our new products faster from concept to introduction (68%).
Developing products that are easier to manufacture, sell, install, and service (61%).
Reducing costs/investments related to new product development and introduction (47%).
Reducing the payback period of our new products (47%).
Increasing the number of new products (44%)
Arthur D. Little Worldwide Survey

MSBM -11-98 - 3
Breakdown of Success Factors:Process versus Environment
Importance toSuccess (rank
order)
Factors that portrayNPD process
Factors that describeProject Setting
1 1. Product superiority as perceived bycustomers
1. Product Superiority asperceived by customers
2 2. Early and sharp product definition3 3. Quality of technological activities4 4. Technological Synergy5 5. Quality of predevelopment activities6 6. Marketing Synergy7 7. Quality of marketing activities8 8. Market attractiveness9 9. Top management support
10 10. Competitive position
Source: Robert G. Cooper, Winning at New Products (1993)
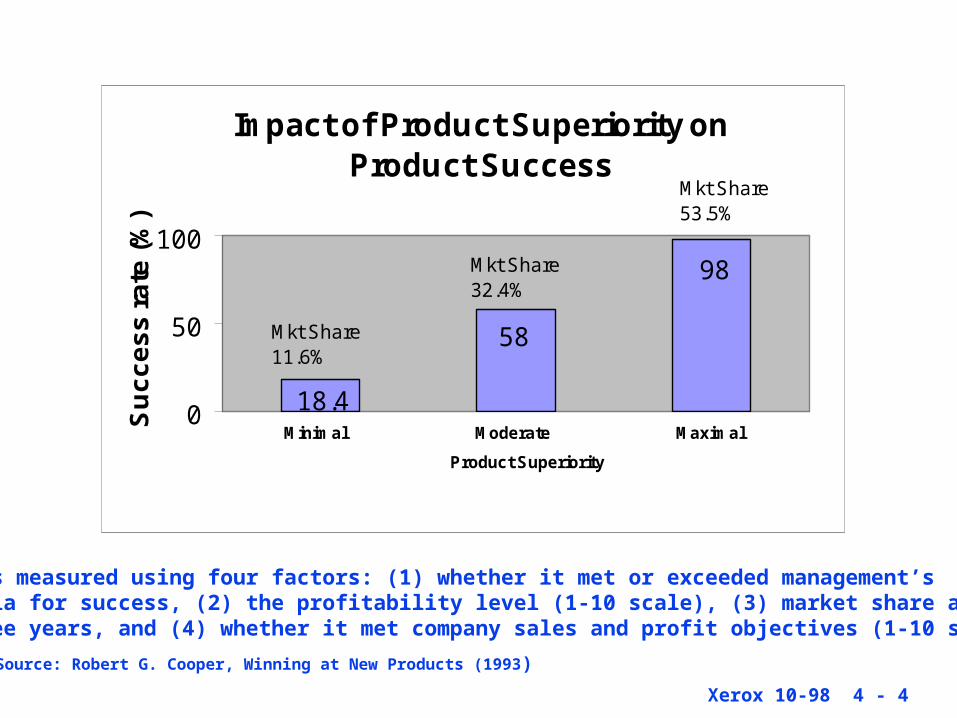
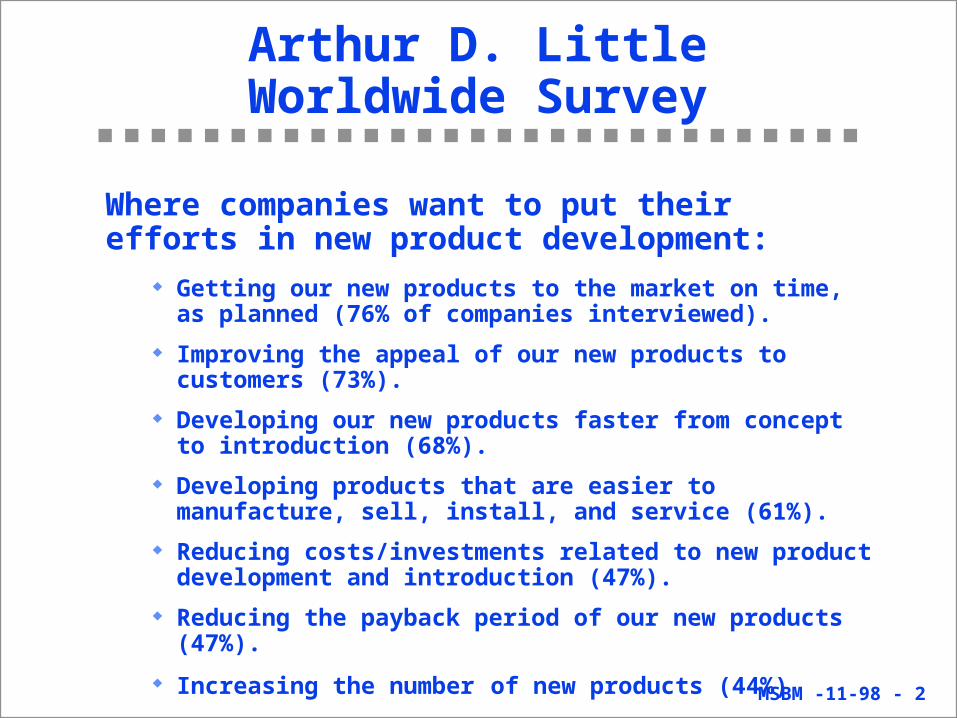
Impact of Product Superiority on Product Success
18.4
58
98
0
50
100
Su
cc
es
s r
ate
(%
)
Mkt Share11.6%
Minimal Moderate Maximal
Product Superiority
Mkt Share32.4%
Mkt Share53.5%
Success measured using four factors: (1) whether it met or exceeded management’s criteria for success, (2) the profitability level (1-10 scale), (3) market share at the endof three years, and (4) whether it met company sales and profit objectives (1-10 scale).
Source: Robert G. Cooper, Winning at New Products (1993)
Xerox 10-98 4 - 4
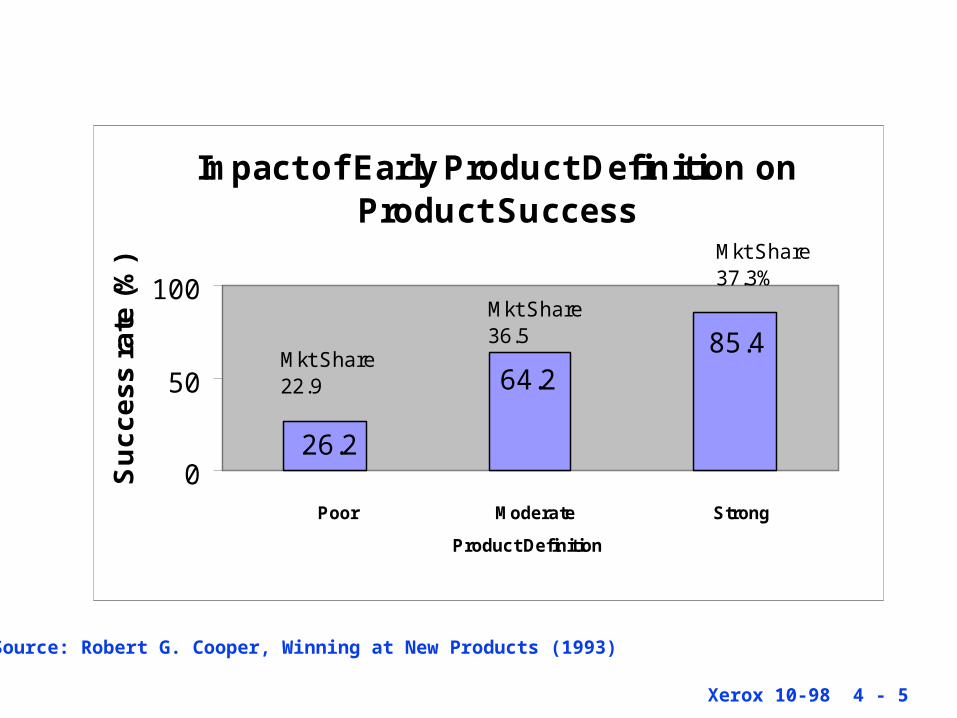
Impact of Early Product Definition on Product Success
26.2
64.285.4
0
50
100
Su
cc
es
s r
ate
(%
)
Mkt Share22.9
Poor Moderate Strong
Product Definition
Mkt Share36.5
Mkt Share37.3%
Source: Robert G. Cooper, Winning at New Products (1993)
Xerox 10-98 4 - 5
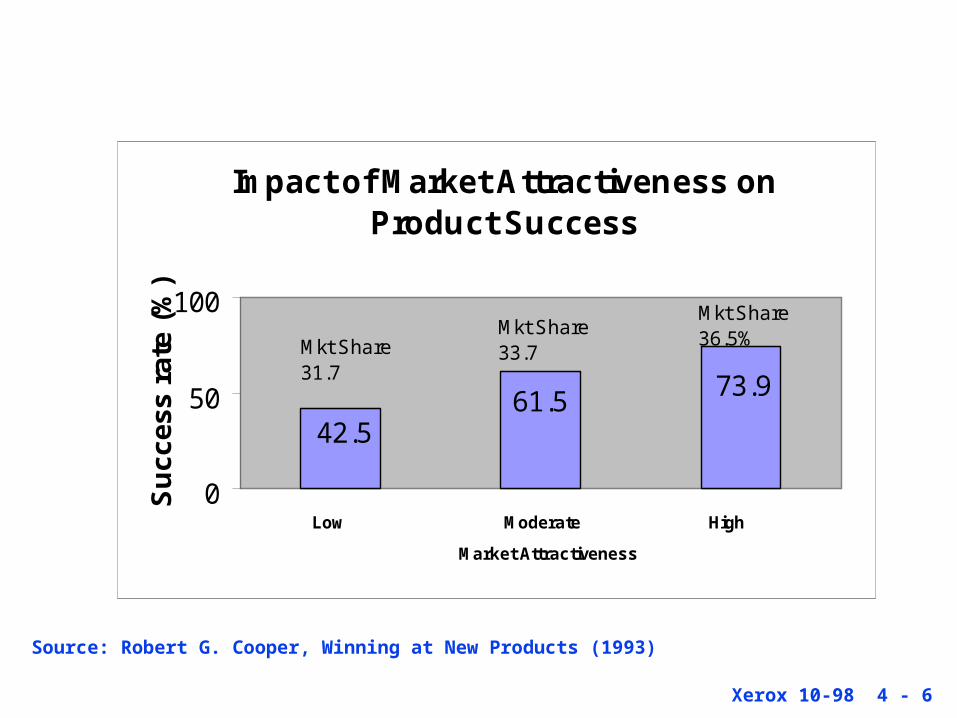
Impact of Market Attractiveness on Product Success
73.961.542.5
0
50
100
Su
cces
s ra
te (
%)
Mkt Share31.7
Low Moderate High
Market Attractiveness
Mkt Share33.7
Mkt Share36.5%
Source: Robert G. Cooper, Winning at New Products (1993)
Xerox 10-98 4 - 6

Resources Allocated at Each Stage of NPD
57
315.3
435.9
148.4
553.2
203.8
0
100
200
300
400
500
600
PredevelopmentActivities
Product development& product testing
Commercialization
Mean Expenditure($000K)
Mean Person-Days
Source: Robert G. Cooper (1993)
Xerox 10-98 4 - 7
MSBM -11-98 - 8
Value of Good Design
80% of a product’s manufacturing costs are incurred during the first 20% of its design (varies with product category).
MSBM -11-98 - 9
A way to understand and incorporate the structure of customer preferences into the new product design process. In particular, it enables one to evaluate how customers make tradeoffs between various productattributes.
The basic output of conjoint analysis are:
• A numerical assessment of the relative importance that customers attach to attributes of a product category
• The value (utility) provided to customers by each potential feature of a product
What is Conjoint Analysis?
MSBM -11-98 - 10
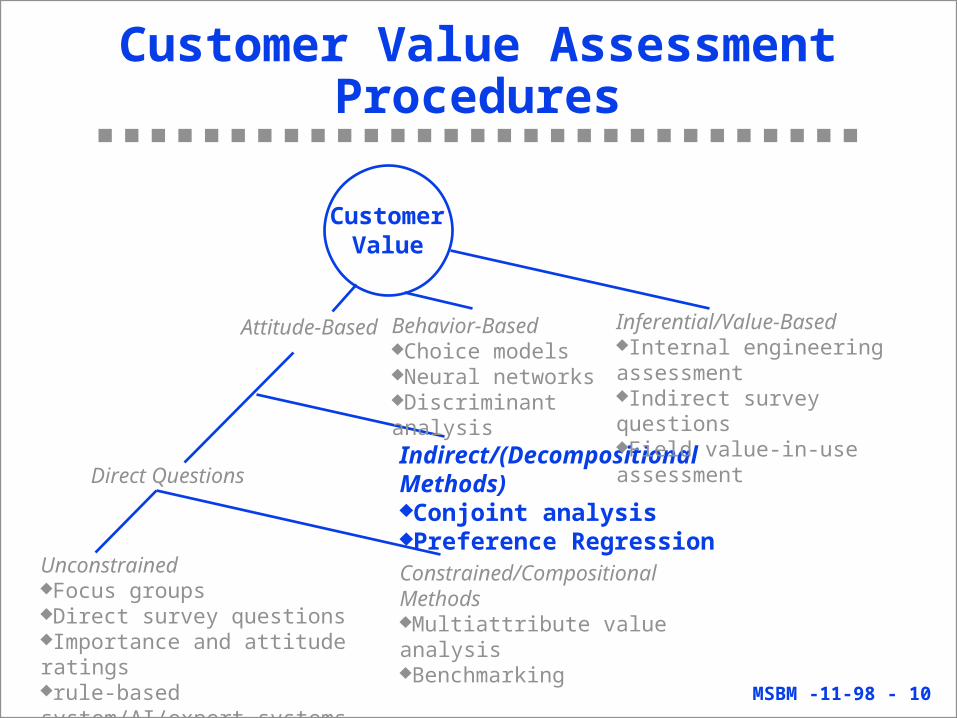
Customer Value Assessment Procedures
CustomerValue
Attitude-Based
Direct Questions
UnconstrainedFocus groupsDirect survey questionsImportance and attitude ratingsrule-based system/AI/expert systems
Constrained/Compositional MethodsMultiattribute value analysisBenchmarking
Indirect/(Decompositional Methods)Conjoint analysisPreference Regression
Behavior-BasedChoice modelsNeural networksDiscriminant analysis
Inferential/Value-BasedInternal engineering assessmentIndirect survey questionsField value-in-use assessment
MSBM -11-98 - 11
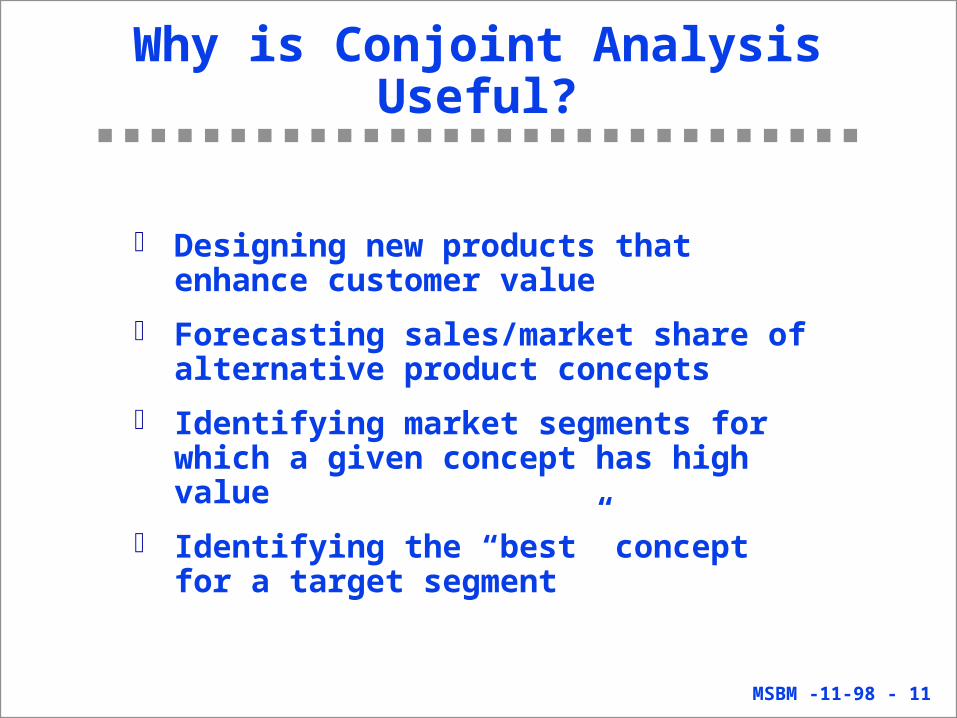
Why is Conjoint Analysis Useful?
Designing new products that enhance customer value
Forecasting sales/market share of alternative product concepts
Identifying market segments for which a given concept has high value
Identifying the “best” concept for a target segment
MSBM -11-98 - 12
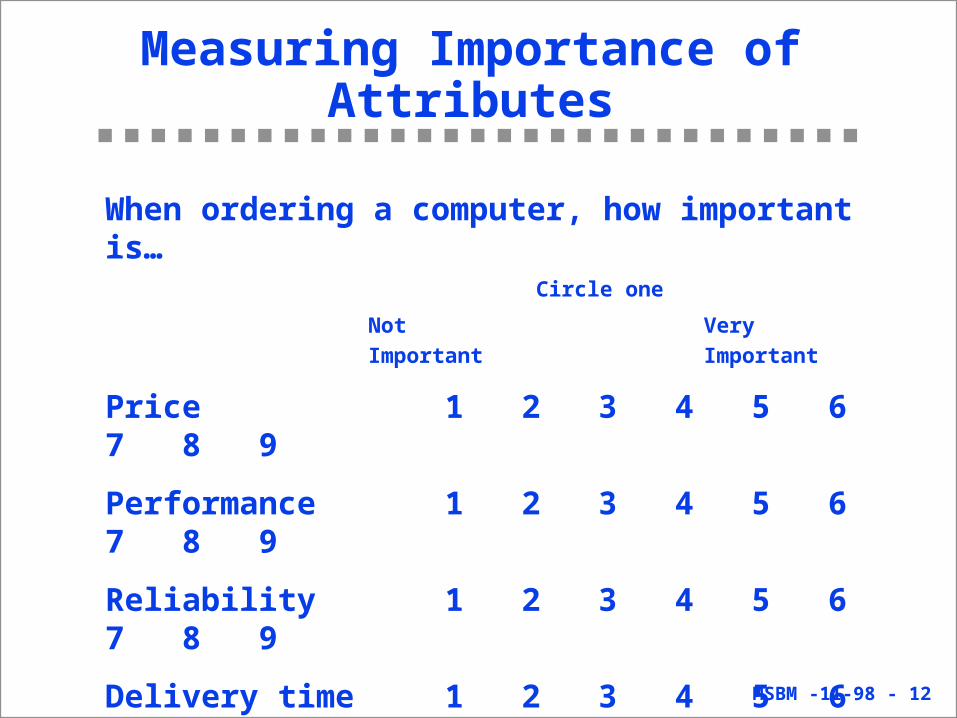
Measuring Importance of Attributes
When ordering a computer, how important is…Circle one
Not Very
Important Important
Price 1 2 3 4 5 6 7 8 9
Performance 1 2 3 4 5 6 7 8 9
Reliability 1 2 3 4 5 6 7 8 9
Delivery time 1 2 3 4 5 6 7 8 9
MSBM -11-98 - 13
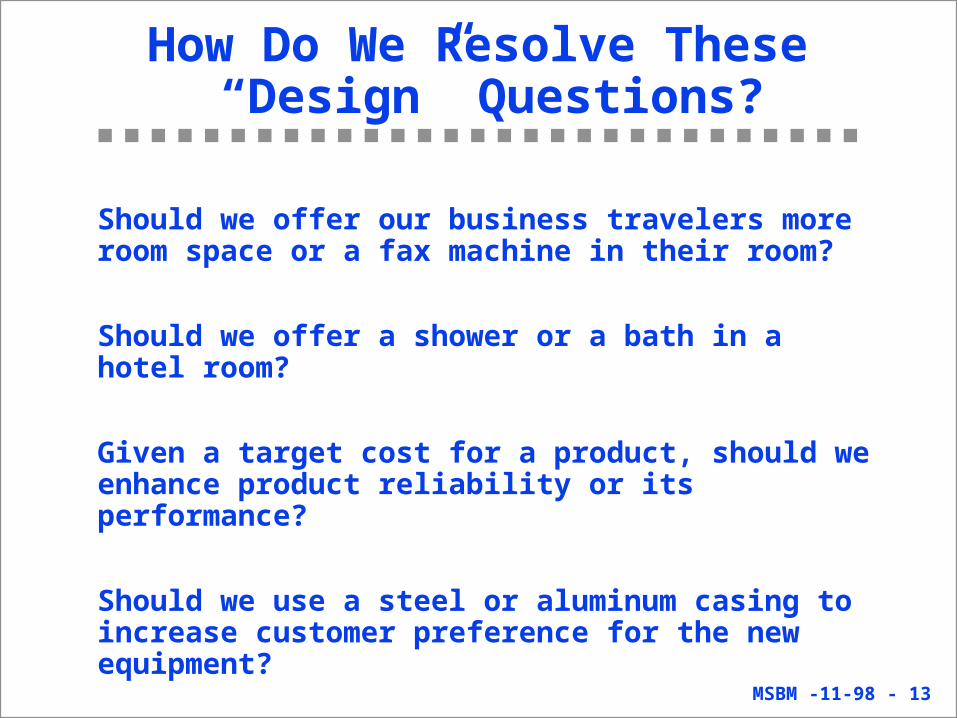
Should we offer our business travelers more room space or a fax machine in their room?
Should we offer a shower or a bath in a hotel room?
Given a target cost for a product, should we enhance product reliability or its performance?
Should we use a steel or aluminum casing to increase customer preference for the new equipment?
How Do We Resolve These “Design” Questions?
MSBM -11-98 - 14
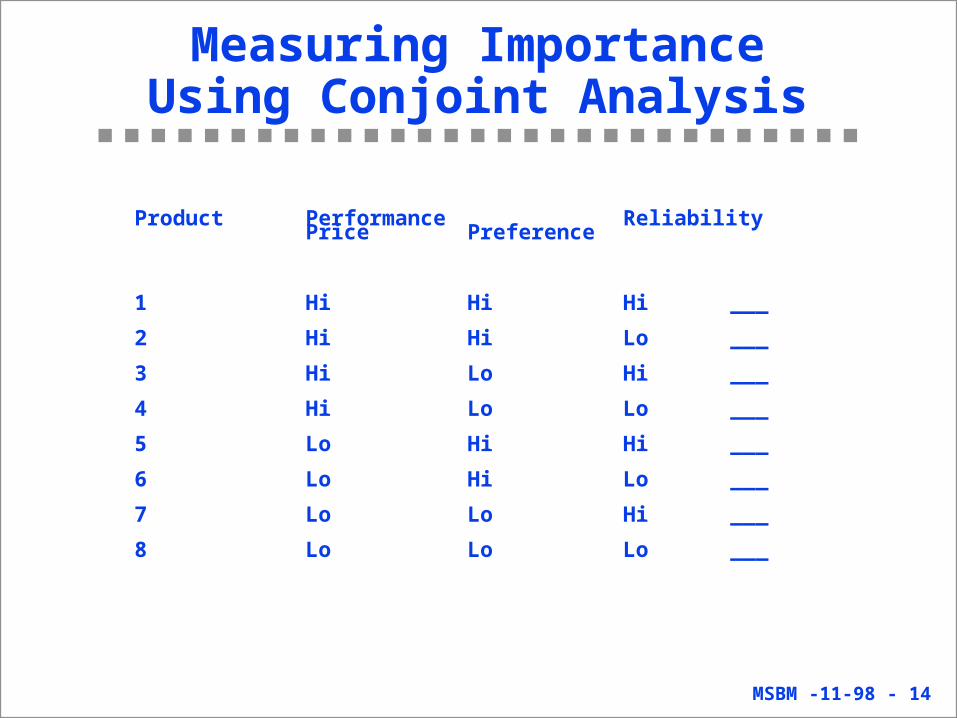
Measuring ImportanceUsing Conjoint Analysis
Product Performance Reliability Price Preference
1 Hi Hi Hi ___
2 Hi Hi Lo ___
3 Hi Lo Hi ___
4 Hi Lo Lo ___
5 Lo Hi Hi ___
6 Lo Hi Lo ___
7 Lo Lo Hi ___
8 Lo Lo Lo ___
MSBM -11-98 - 15
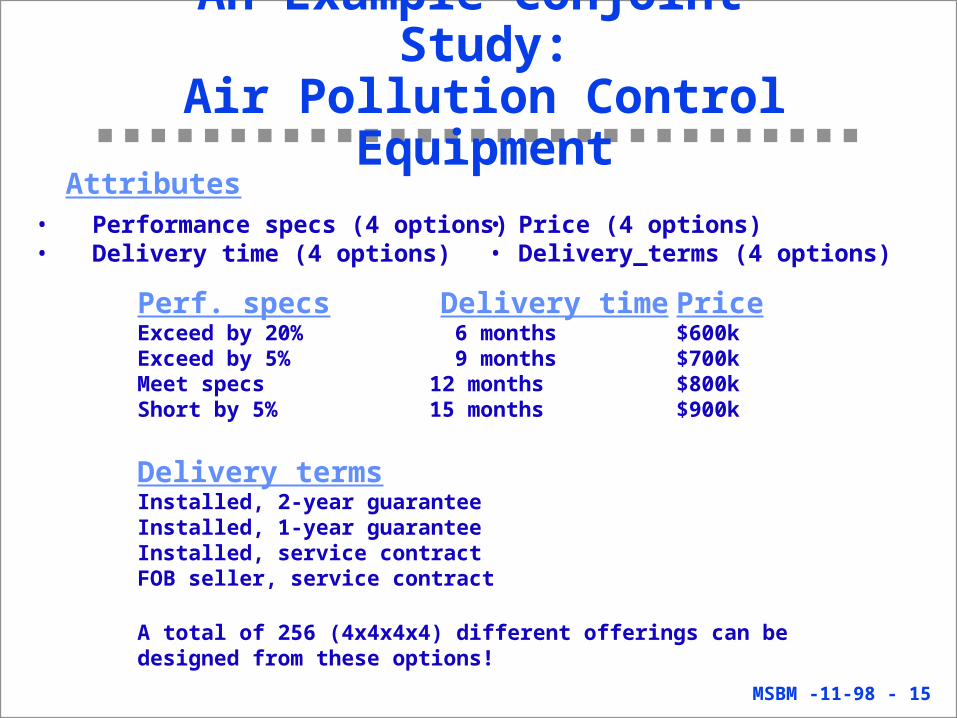
Attributes• Price (4 options)• Delivery_terms (4 options)
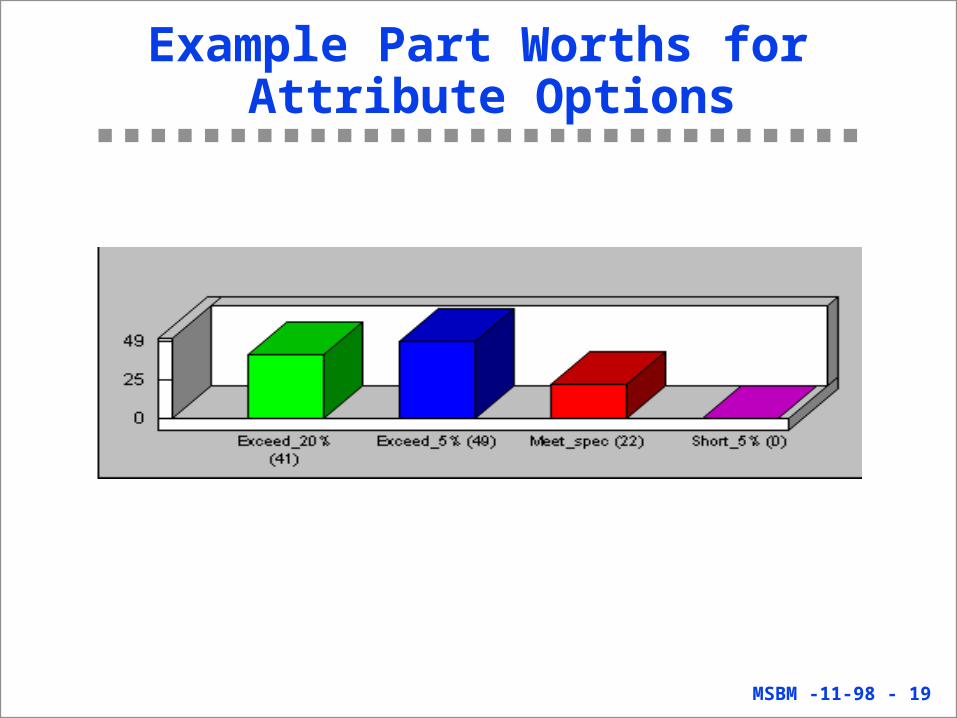
Perf. specs Delivery time PriceExceed by 20% 6 months $600kExceed by 5% 9 months $700kMeet specs 12 months $800kShort by 5% 15 months $900k
Delivery termsInstalled, 2-year guaranteeInstalled, 1-year guaranteeInstalled, service contractFOB seller, service contract
A total of 256 (4x4x4x4) different offerings can be designed from these options!
An Example Conjoint Study:Air Pollution Control Equipment
• Performance specs (4 options)• Delivery time (4 options)
MSBM -11-98 - 16
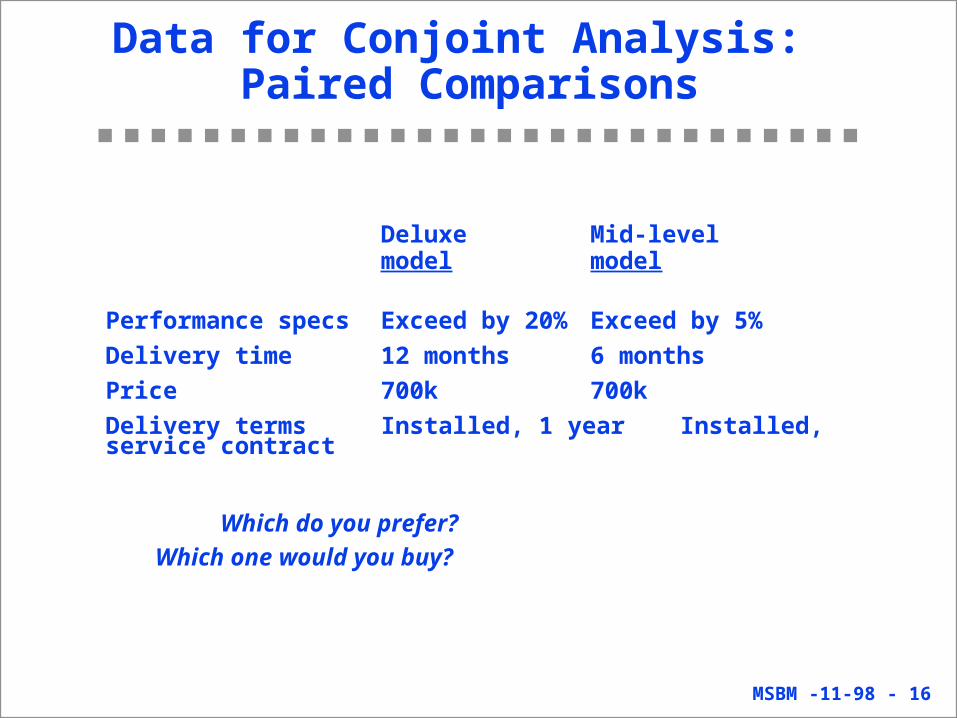
Data for Conjoint Analysis: Paired Comparisons
Deluxe Mid-levelmodel model
Performance specs Exceed by 20% Exceed by 5%
Delivery time 12 months 6 months
Price 700k 700k
Delivery terms Installed, 1 year Installed, service contract
Which do you prefer?
Which one would you buy?
MSBM -11-98 - 17
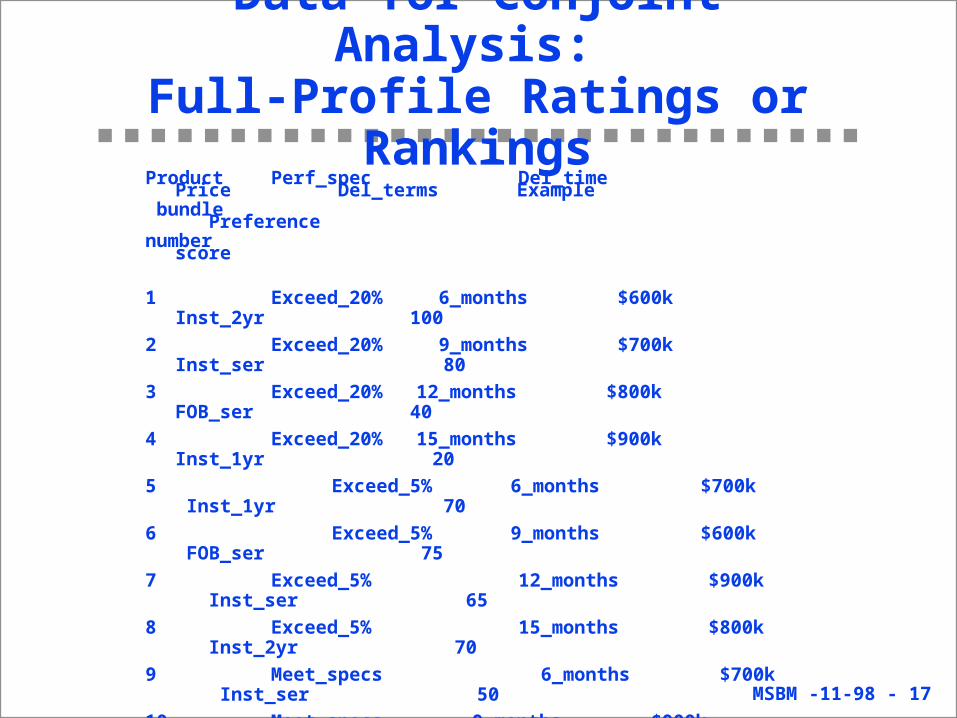
Data for Conjoint Analysis: Full-Profile Ratings or Rankings
Product Perf_spec Del_time Price Del_terms Example bundle Preferencenumber score
1 Exceed_20% 6_months $600k Inst_2yr 100
2 Exceed_20% 9_months $700k Inst_ser 80
3 Exceed_20% 12_months $800k FOB_ser 40
4 Exceed_20% 15_months $900k Inst_1yr 20
5 Exceed_5% 6_months $700k Inst_1yr 70
6 Exceed_5% 9_months $600k FOB_ser 75
7 Exceed_5% 12_months $900k Inst_ser 65
8 Exceed_5% 15_months $800k Inst_2yr 70
9 Meet_specs 6_months $700k Inst_ser 50
10 Meet_specs 9_months $900k Inst_2yr 20
11 Meet_specs 12_months $600k Inst_1yr 40
12 Meet_specs 15_months $700k FOB_ser 30
13 Short_5% 6_months $900k FOB_ser 5
14 Short_5% 9_months $800k Inst_1yr 10
15 Short_5% 12_months $700k Inst_2yr 10
16 Short_5% 15_months $600k Inst_ser 0

MSBM -11-98 - 18
Example Part Worth for Attributes
MSBM -11-98 - 19
Example Part Worths for Attribute Options

MSBM -11-98 - 20
U(P) = aijxij
k
i=1
m
j=1
P: A particular product/concept of interest
U(P): The utility associated with product P
aij: Utility associated with the jth level (j = 1, 2, 3...kj) on the ith attribute
kj: Number of levels of attribute i
m: Number of attributes
xij: 1 if the jth level of the ith attribute is present in product P, 0 otherwise
Conjoint Utility Computations
j
MSBM -11-98 - 21
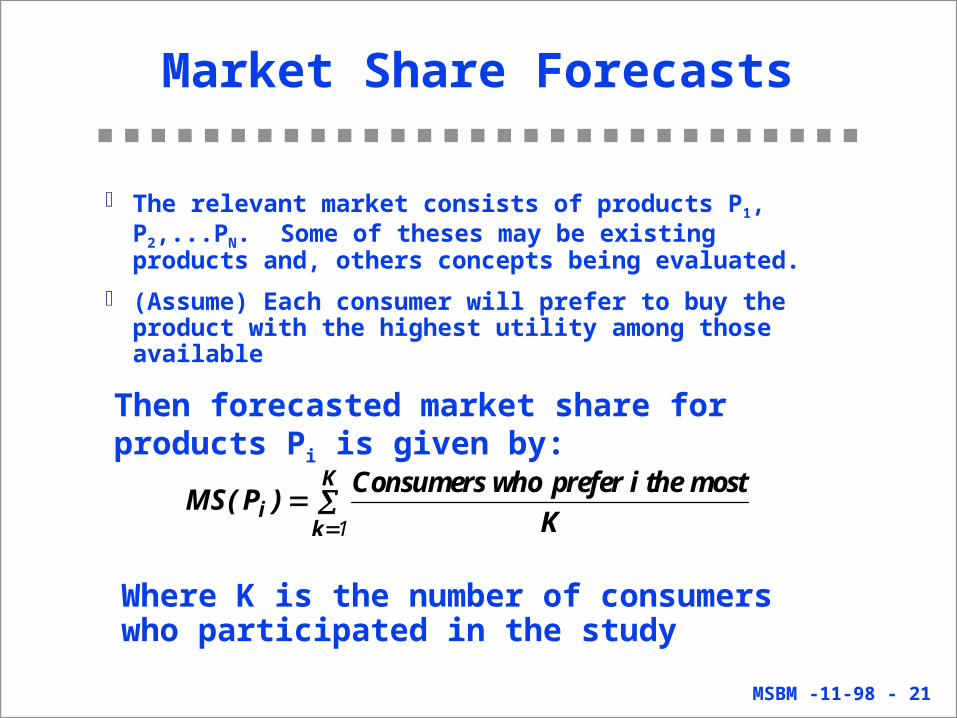
The relevant market consists of products P1, P2,...PN. Some of theses may be existing products and, others concepts being evaluated.
(Assume) Each consumer will prefer to buy the product with the highest utility among those available
Then forecasted market share for products Pi is given by:
Where K is the number of consumers who participated in the study
Market Share Forecasts
MS PConsumers who prefer i the most
Kik
K( )
1
MSBM -11-98 - 22
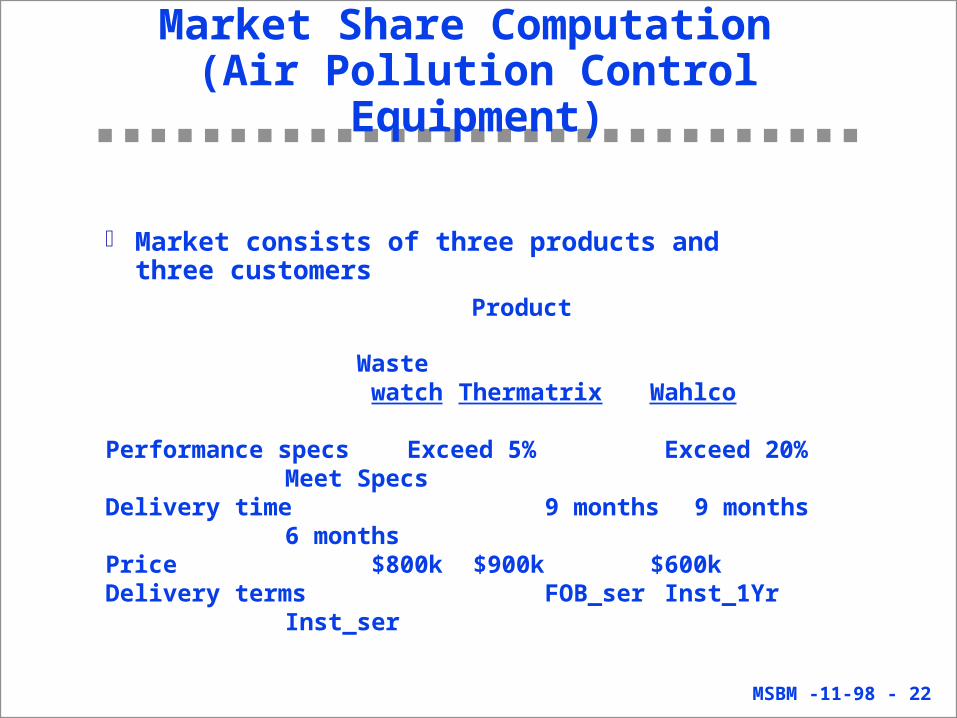
Market consists of three products and three customers
Product
Market Share Computation (Air Pollution Control Equipment)
Waste watch Thermatrix Wahlco
Performance specs Exceed 5% Exceed 20% Meet SpecsDelivery time 9 months 9 months 6 monthsPrice $800k $900k $600k Delivery terms FOB_ser Inst_1Yr Inst_ser
MSBM -11-98 - 23
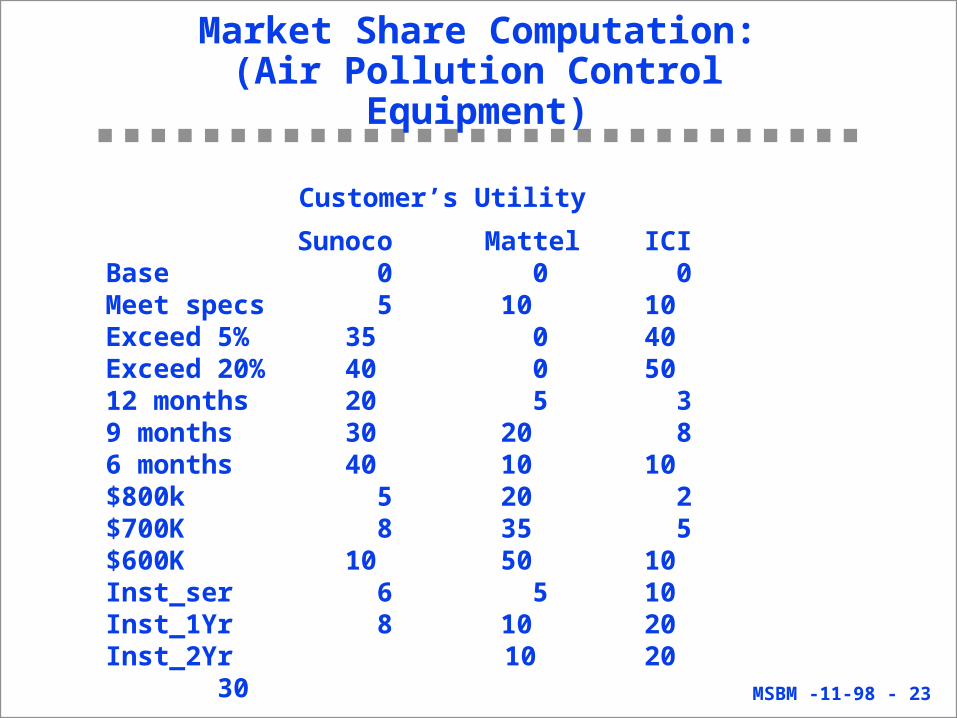
Market Share Computation:(Air Pollution Control Equipment)
Sunoco Mattel ICIBase 0 0 0 Meet specs 5 10 10Exceed 5% 35 0 40Exceed 20% 40 0 50 12 months 20 5 39 months 30 20 86 months 40 10 10$800k 5 20 2$700K 8 35 5$600K 10 50 10Inst_ser 6 5 10Inst_1Yr 8 10 20Inst_2Yr 10 20 30
Customer’s Utility

MSBM -11-98 - 24
Computed Utility for Products
Market Share Computation:(Air Pollution Control Equipment)
WasteWatch Thermatrix Wahlco
Sunoco 70 78 61
Mattel 40 30 75
ICI 50 78 40
Maximum Utility Rule: If we assume customers will only buy the product with the highest utility, the market share for Thermatrix is 2/3 and 1/3 for Wahlco.
Share of preference rule: If we assume that each customer will buy each product in proportion to its utility relative to the other products, then market shares for the three products are:
Waste Watch: 30.3% Thermatrix: 34.8 Wahlco: 34.9
MSBM -11-98 - 25
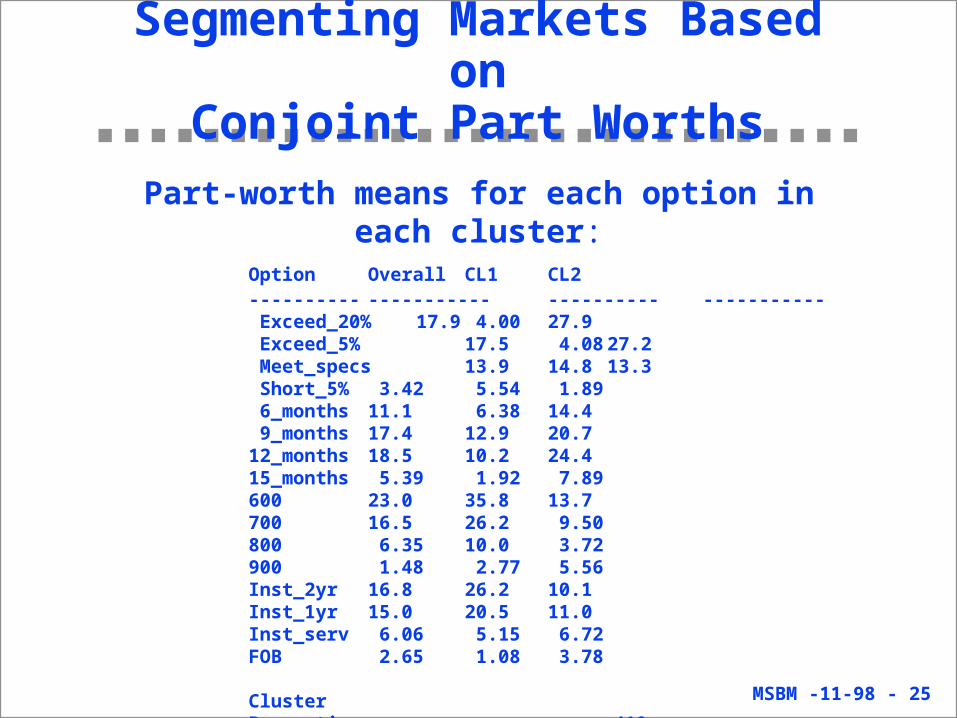
Segmenting Markets Based onConjoint Part Worths
Part-worth means for each option in each cluster: Option Overall CL1 CL2 ---------- ----------- ---------- -----------
Exceed_20% 17.9 4.00 27.9 Exceed_5% 17.5 4.08 27.2 Meet_specs 13.9 14.8 13.3 Short_5% 3.42 5.54 1.89 6_months 11.1 6.38 14.4 9_months 17.4 12.9 20.7 12_months 18.5 10.2 24.4 15_months 5.39 1.92 7.89 600 23.0 35.8 13.7 700 16.5 26.2 9.50 800 6.35 10.0 3.72 900 1.48 2.77 5.56 Inst_2yr 16.8 26.2 10.1 Inst_1yr 15.0 20.5 11.0 Inst_serv 6.06 5.15 6.72 FOB 2.65 1.08 3.78
ClusterProportion .419 .581

MSBM -11-98 - 26
Members in Each Segment
Segment 1 Cummins, Illinois-Tool, Mattell, Nes_Resn, Ralston
Purina, New_W-Tech, Baltimore Gas, Applied Coatings, Pharmasyn, Th_Electric, Ag_Power, Vencor, El_chem.
Segment 2 ICI, Deere, Intel, Mobil, Maytag, Air Products,
Sunoco, HP, Conagra, Kimberly Clark, Hershey, Texaco, Union Carbide, Westinghouse Electric, Dow Chemical, Boise Cascade, Kodak, El_Chem, 3M
MSBM -11-98 - 27
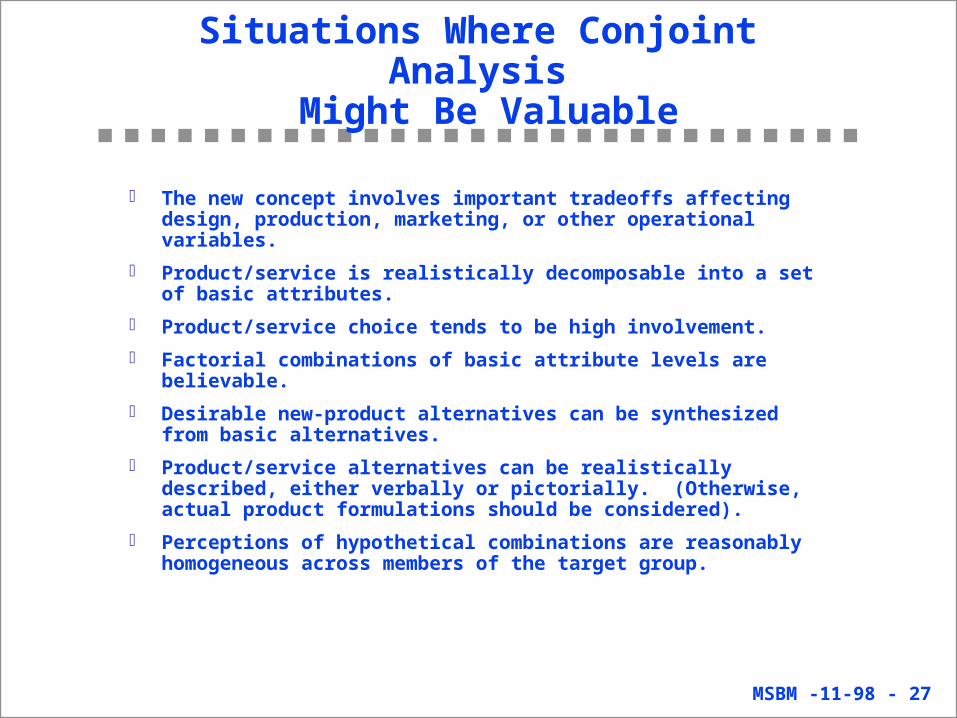
Situations Where Conjoint Analysis Might Be Valuable
The new concept involves important tradeoffs affecting design, production, marketing, or other operational variables.
Product/service is realistically decomposable into a set of basic attributes.
Product/service choice tends to be high involvement.
Factorial combinations of basic attribute levels are believable.
Desirable new-product alternatives can be synthesized from basic alternatives.
Product/service alternatives can be realistically described, either verbally or pictorially. (Otherwise, actual product formulations should be considered).
Perceptions of hypothetical combinations are reasonably homogeneous across members of the target group.