Embed Size (px)
Citation preview

�
MASTER OF SCIENCE IN ANALYTICS
2018 EMPLOYMENT REPORT
Number of graduates: 111
Number of graduates seeking new employment: 108
Candidates employed at graduation: 95%
Average base salary: $98,200
Number of employers interviewing (number on site): 156 (55)
Median number of initial job interviews per candidate: 12
Median number of offers of employment per candidate: 3
Job placements facilitated by the Institute: 91%
Estimated ROI payback period in months: 20
Total number of reported job offers: 310
Job placements based in North Carolina: 45%
Job placements based in U.S.: 100%
Candidates reporting job offer data: 100%
Placement results for Class of 2018 reported as of May 15, 2018.
For further information about recruiting contact: [email protected]
POSITIONS FILLED
Analytical Consultant (3) Artificial Intelligence Engineer Assistant VP, Senior Decision Scientist Associate Associate Consultant (2) Associate Data Scientist Assistant VP, Data Scientist (2) Assistant VP, Senior Decision Scientist Assistant VP, Senior Geographic Scientist Business Analyst – Product Management and
Analytics Associate Business Data Analyst Business Data Scientist (2) Consultant (6) Consulting Specialist – Data Scientist Track Consumer and Marketing Insights Customer Insights Senior Analyst (2) Data Analyst (4) Data Science (21) Engineer Informatics/Analytics Senior Specialist (2) Marketing Data Analyst Marketing Optimization Senior Analyst (3)
Predictive Analytics Product Manager Product Analyst Quantitative Analyst (3) Research Analyst Risk Analyst (3) Senior Analyst, Decision Analytics Senior Analytics Consultant Senior Associate (4) Senior Associate Analytical Consultant (4) Senior Associate Analytics Tester (4) Senior Associate Data Scientist Senior Associate Hosting Technical Account
Manager Senior Associate Solutions Consultant Senior Consultant (2) Senior Quantitative Analyst Senior Statistician – Business Analytics (2) Specialist, Global Advanced Analytics (2) Staff Consultant (7) Statistician/Data Scientist Supply Chain Quantitative Analyst Vice President, Business Control Manager
– � –2
MAJOR TYPES OF POSITIONS AND AVERAGE BASE SALARIES
Manager3%
Consultant $92,300
30%
Analyst $92,400
32%
Data Scientist $108,450
35%

Notes: Data with respect to salaries and bonuses are self-reported by graduates (without anonymity) and whenever possible verified by employers in cases where placement is arranged by the Institute (i.e., most candidates). Three graduates were international Fulbright Scholars and required to return to their home countries; one will remain temporarily in the U.S. to work before returning home. All other job placements are full-time paid positions. Data are made public here to guide prospective students and employers. Annual base salary figures do not include signing bonuses, relocation allowances or other forms of one-time compensation guaranteed upon signing. Contracts, conditional job offers (i.e., those requiring security clearance prior to employment) or other public sector employment are not included in salary data (n=3). As a STEM-qualified degree, international MSA graduates are eligible for Optional Practical Training (OPT). Commencement is typically held on the first Saturday in May. DISCLAIMER: The Institute has a proven track record for placing graduates in the analytics profession, but it does not under any circumstance offer a guarantee of employment upon completion of the MSA degree.
COMPENSATION
ANNUAL BASE SALARYSIGNINGBONUS
TotalPrior Work Experience
None 1-2 Years 3+ Years
Mean $98,200 $92,000 $100,300 $106,700 $11,750
Maximum $145,000 $125,000 $121,500 $145,000 $42,500
75th Percentile $106,250 $100,000 $105,000 $115,000 $15,000
Median $95,000 $88,000 $99,000 $105,000 $10,000
25th Percentile $87,500 $84,000 $90,000 $96,000 $5,300
Minimum $72,500 $72,500 $87,500 $87,500 $2,500
N 100 51 16 33 79
% Reporting 100% 51% 16% 33% 79%
– � –3

EMPLOYERS EXTENDING OFFERS
Accenture Advance Auto Parts Altria Client Services Ankura Consulting Group* Asurion* Bain & Company* Bank of America Beghou Consulting BerkelyNet Blue Cross Blue Shield Capital One Cardinal Solutions Chewy.com Cigna* Clarity Insights Cognizant Deloitte* Digital Roots DraftKings Elder Research* Elevate* Eli Lilly* Elicit Epic Games EY* FedEx Fidelity Investments* Fifth Third Bank* IBM InterWorks John Deere JPMorgan Chase* KPMG LeoForce
Lincoln Financial Group Live Oak Bank Lowe's Home Improvement* M&T Bank Merkle MetaMetrics National Air and Space Intelligence Center NetApp Nielsen PenFed Credit Union PointSource / Globant Putnam Investments PwC* Red Hat* Red Ventures* Royal Bank of Canada* RTI International Sageworks SAP.iO* SAS* Siemens Digital Factory Slalom Consulting* Space and Naval Warfare Systems Command Syneos Health Syntelli Solutions The Home Depot The Rams Club - Carolina Athletics TIAA UNC Healthcare Visionist Walmart Wells Fargo Whole Foods Zencos
Bold = employers that succeeded in hiring one or more candidates. * = employers that hired more than one candidate. List does not include conditional offers made by agencies of the federal government.
– � –4

COMPENSATION BY GEOGRAPHIC REGION
ANNUAL BASE SALARY
North Carolina
U.S. Census Regions Outside North Carolina
South Northeast Midwest West
Mean $93,600 $98,150 $108,750 $99,450 *
Maximum $125,000 $115,000 $125,000 $125,000 *
75th Percentile $100,000 $105,000 $120,000 $112,500 *
Median $90,000 $100,000 $112,500 $95,000 *
25th Percentile $85,000 $91,000 $100,000 $90,000 *
Minimum $72,500 $80,000 $80,000 $77,000 *
N 44 27 12 14 2
COMPENSATION BY INDUSTRY SECTOR
ANNUAL BASE SALARY
All Sectors Consulting Financial Technology Other
Mean $98,200 $94,000 $105,350 $96,100 $93,400
Maximum $145,000 $125,000 $125,000 $145,000 $115,000
75th Percentile $106,250 $105,000 $120,000 $97,000 $98,000
Median $95,000 $93,750 $105,000 $90,000 $90,000
25th Percentile $87,500 $81,250 $90,000 $87,500 $85,000
Minimum $72,500 $72,500 $76,000 $80,000 $80,000
N 100 30 33 24 13
– � –5

– � –6
DISTRIBUTION OF EMPLOYMENT OUTSIDE NORTH CAROLINA BY U.S. CENSUS REGION
South
Midwest
Northeast
West
Number of Placements0 10 20 30 40
DISTRIBUTION OF EMPLOYMENT BY INDUSTRY SECTOR
Financial Services
Consulting
Technology
Healthcare/Pharma
Retail
Games
Government / Military
Research
Consumer Products
Number of Placements0 10 20 30 40
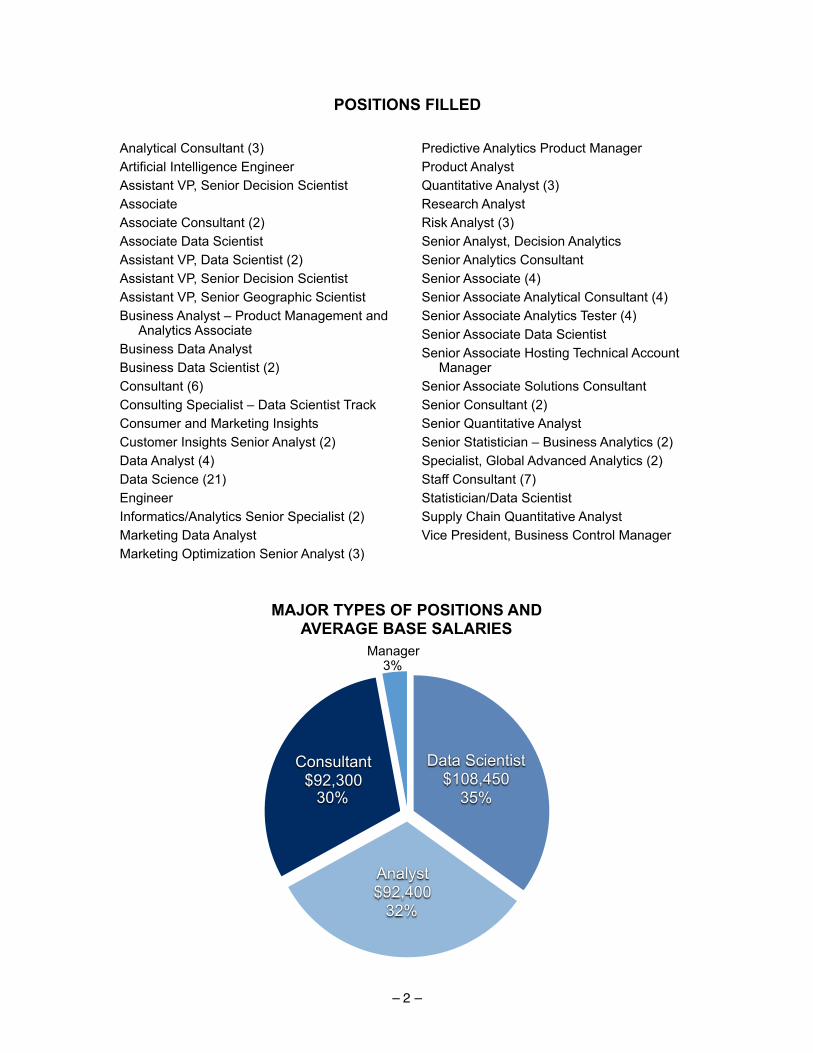
COMPENSATION BY AGE AND GENDER
ANNUAL BASE SALARY
All
Age Brackets Gender
20–24 25–29 30+ Men Women
Mean $98,200 $91,900 $100,500 $105,600 $98,000 $98,400
Maximum $145,000 $121,500 $125,000 $145,000 $145,000 $125,000
75th Percentile $106,250 $97,500 $110,000 $116,500 $105,000 $110,000
Median $95,000 $90,000 $100,000 $100,000 $95,000 $97,000
25th Percentile $87,500 $85,000 $90,000 $94,400 $88,000 $87,500
Minimum $72,500 $72,500 $76,000 $85,000 $80,000 $72,500
N 100 39 41 20 54 46
– � –7
COMPENSATION BY MAJOR POSITION CATEGORIES
ANNUAL BASE SALARY
All Data Scientist Analyst Consultant Manager
Mean $98,200 $108,400 $92,300 $92,300 *
Maximum $145,000 $145,000 $115,000 $125,000 *
75th Percentile $106,250 $120,000 $96,250 $103,500 *
Median $95,000 $112,000 $90,000 $87,500 *
25th Percentile $87,500 $98,000 $88,000 $80,000 *
Minimum $72,500 $85,000 $76,000 $72,500 *
N 100 33 32 31 3

– � –8
HISTORICAL TREND IN MEDIAN BASE STARTING SALARY BY LEVEL OF PRIOR WORK EXPERIENCE
$60,000
$80,000
$100,000
$120,000
MSA Class of…2008 2010 2012 2014 2016 2018
< 3 years 3+ years
HISTORICAL TREND IN JOB PLACEMENT RATEMSA CLASSES OF 2008 – 2018
Pla
ced
by G
radu
atio
n
80%
85%
90%
95%
100%
MSA Class of…2008 2010 2012 2014 2016 2018
40 students 80 students 120 students

– � –9
HISTORICAL TREND IN PLACEMENT CONCENTRATION AMONG THE TOP-5 AND TOP-10 EMPLOYERS
20%
40%
60%
80%
100%
MSA Class of…2008 2010 2012 2014 2016 2018
Top-5 Employers Top-10 Employers
EMPLOYMENT BY RESIDENCY STATUS PRIOR TO ADMISSION
Number of Candidates Employed
SubtotalInside
North CarolinaOutside
North Carolina
Non-Resident 9 27 36
NC Resident 36 31 67
Subtotal 45 58 103
– � –10
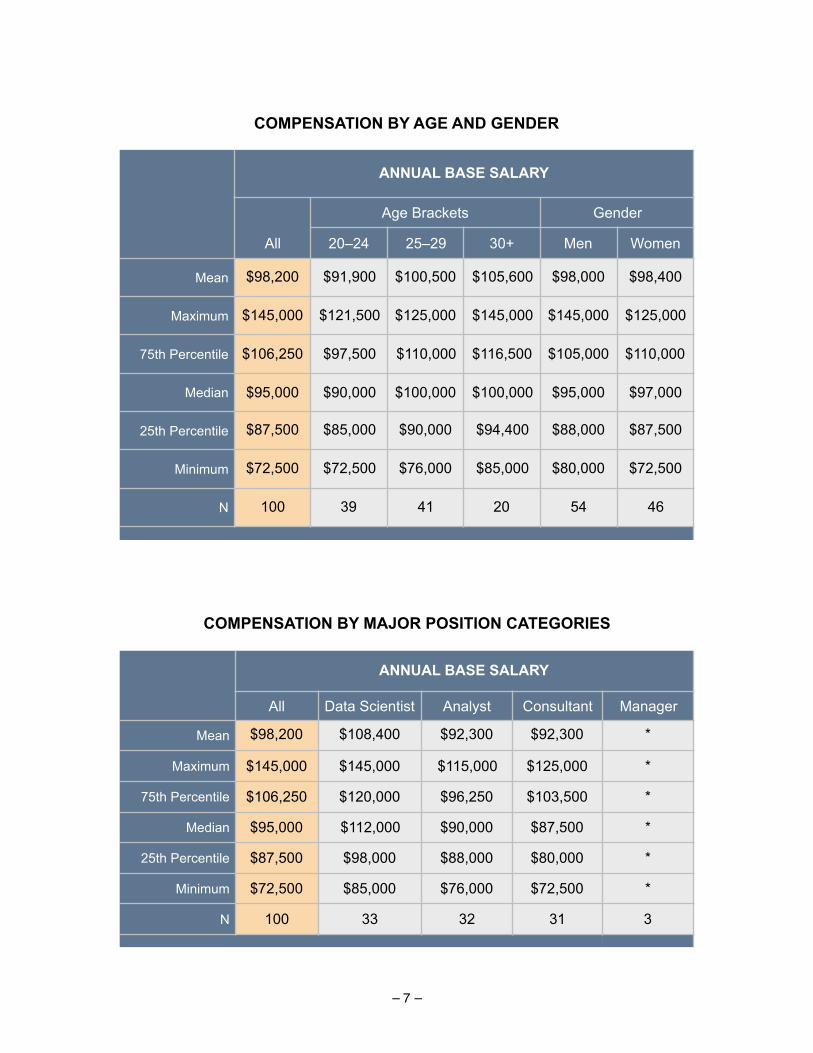
STUDENT RETURN ON INVESTMENT
NC Resident Non-Resident
Number of Respondents 67 36
Pre-MSA Salary Median* $60,000 $60,000
(+) Tuition & Fees $26,500 $46,500
(–) Signing Bonus $10,000 $10,000
Total Investment $76,500 $96,500
Post MSA Salary Median $105,000 $105,000
(–) Pre-MSA Salary $60,000 $60,000
Net Salary Increase $45,000 $45,000
Payback Period (months) 20 26
Net 3-Year ROI $145,000 $145,000
*Based on graduates with full-time employment prior to program entry.
Notes: The response rate was 100-percent. Respondents provided information about their pre- and post-MSA annual base salaries, signing bonuses, and residency status (which determines tuition payments). Sixty-five percent of respondents were NC residents, and 46-percent were employed full-time prior to entry. The median salary increase was $45,000; all but one respondent reported an increase in salary. The ROI payback period calculated for each of 103 candidates employed by graduation, based on their individual circumstances (residency, tuition, pre- and post-salaries, and signing bonuses), yielded a median payback period of 24 months.
Students are assumed to forgo one-year of earning, even though the MSA program is only 10-months in duration. The average pre-MSA salary is estimated based on those candidates working full-time prior to entry in the program. Pre-MSA salaries ranged from $25,000 to $100,000. Candidates without prior work experience are estimated to have foregone an annual salary of $55,000, which is an estimated based on reported salary data for candidates with 1-2 years of prior work experience.
The payback calculation does not take into consideration interest incurred by students who borrow to finance their education.

– � –11
NUMBER OF JOB OFFERS RECEIVED BY GRADUATION
1 or More Offers
2 or More Offers
3 or More Offers
4 or More Offers
Percent of Candidates
0% 20% 40% 60% 80% 100%
29%
54%
77%
96%
GEOGRAPHIC DISTRIBUTION OF EMPLOYMENT OF U.S.-BASED MSA ALUMNI
Note: 97% of the MSA alumni community (n=760) was employed in the U.S. in 2018.

DISCLAIMER
The Institute has a proven track record for placing graduates in the analytics profession, but it does not under any circumstance offer a guarantee of employment upon completion of the MSA degree.
Source URL: http://analytics.ncsu.edu/reports/employment/MSA2018.pdf
http://analytics.ncsu.edu
RECRUITING TIMETABLE – MSA CLASS OF 2019
New cohort of 115 students arrives in: June
Basic demographic profile of new cohort published by: July 1
New student roster available on Institute web site by: July 15
Employer information sessions hosted beginning first week of: September
Student Profile Book available on web site by: October 1
Student Resume Book sent to employers by: December 1
On-site interviews begin second week of: January
Student placement decision date before second week of: March
Graduation date normally in the first week of: May
Employment Report published on web site by: June 1
Candidates typically begin employment by the first week of: June
Open job positions can be circulated to MSA alumni: Upon receipt
MSA recruitment is managed entirely by the Institute as a service provided free of charge as a courtesy to employers.
– � –12