Embed Size (px)
Citation preview
Simone Youngblood (JHU/APL) -- PresenterPeter Pandolfini (JHU/APL)
M&S Use Risk Identification and Management
Presented at ISMOR
22 July 2015
Presentation Outline
This presentation will focus on the M&S Use Risk
Methodology (MURM) and will cover:
Why the MURM was developed
What the MURM is, an overview
Basic steps in the MURM
Key MURM Elements
Expected MURM outputs and benefits
2

MURM Background
3

MURM Objectives
Leverage existing concepts to evolve a methodology to:
Weigh VV&A investments against the risk of making a bad decision due to unreliable M&S results
Tailor the V&V and Accreditation Efforts based on risk
Perform Methods/Technique/Resource Trade-offs
4

Why MURM?
Previous risk-based M&S assessments have deficiencies:
Lack cogent mathematical foundation
Sometimes included unintended bias
Can’t explicitly relate V&V endeavors to risk
Fundamental Driver for MURM: the need to combine M&S risk assessment and VV&A planning in a coherent fashion.
M&S Use Risk Methodology (MURM) provides:
Coherent math foundation for M&S Use Risk
Minimizes or avoids unintended bias
Explicit relation of V&V to M&S Use Risk
Facilitates automation of M&S Use Risk assessment
5
5

The MURM Builds upon Existing Concepts
• V&V Composite Model
• Validation Process Maturity
• Confidence ratios
• Sensitivity analysis
• Uncertainty quantification
• Communication to decision makers
• Risk-driven software development
• Spiral development model
• Communication to decision makers
• Uncertainty quantification
• Credibility assessment
• Sensitivity analysis
• Risk assessment
• Risk-based V&V tailoring
• Software integrity level
• Risk matrices
• Risk assessment
• Communication to
decision makers
• Risk-based VV&A
tailoring
• Simulation importance
• Risk assessment
• Risk matrices
• Severity categories
• Probability levels
• Risk assessment values
• Risk acceptance levels
6

Risk & Risk-related Analysis Is Complex
Review of standards found half-dozen definitions each with negative, neutral, and broad connotations for risk, which indicates the complexity of the subject.
Descriptors often indicate the aspect of risk being addressed: e.g., programmatic risk, technical risk, operational risk, etc.
Many simplify risk and treat the approach as if it fully addresses risk. Common definition is:
Risk = (likelihood of Error) * (Consequence of Error)
MURM focuses on a definition that accommodates both assessment of the consequences of using M&S results and the impact of V&V planning and execution.
8

MURM Definition
8

M&S Use Risk – Key Definition
MURM is not just a collection of tables and figures. MURM applies an underlying mathematical formula based on the definition for M&S Use Risk:
The probability that inappropriate application of M&S Results for the intended use will produce unacceptable consequences to the decision-maker.
MURM calculations are driven by: (1) P(Causes)
The maturity of the definition of M&S use space The relationship of the requirements The rigor of the V&V Evidence
(2) P(Effects)
The impact if the M&S results are applied incorrectly
The Reliance on the M&S
Math Logic Foundation enables: Explicit relationship of M&S Use Risk to V&V endeavors Facilitates automation of UR assessment
9

MURM Implementation
10

MURM Mathematical Basis
MURM calculations are based on Dr. Pete
Pandolfini’s Decision Support Analysis Tool (DSAT)
A DSAT is a model synthesizing the elements of a
decision to inform decision-makers about the
decision space
DSAT is grounded in objectivity, using only available
(justified) information, defensible mathematics, and
the maximum information entropy principle
9
KEY ELEMENTS OF THE MURM CALCULATIONS
12
Evaluation Factor – Key Components of the MURM Calculation
State Tables – List of the possible levels for an Evaluation Factor
Factor Weighting – Allows the assessment to emphasize characteristics and/or Evaluation Factors that are more critical

DECOMPOSITION OF P(CAUSES)
13
p(Causes) is derived from:
C1 Level of understanding associated with how the
M&S will be used, the required representation,
and Referent Knowledge (i.e., Clarity)
C2 Prioritization of Requirements (i.e., Importance)
C3 Rigor of the V&V Evidence Collected (i.e.,
Confidence)

CLARITY OF INTENDED USE (MURM FACTOR C1)
14
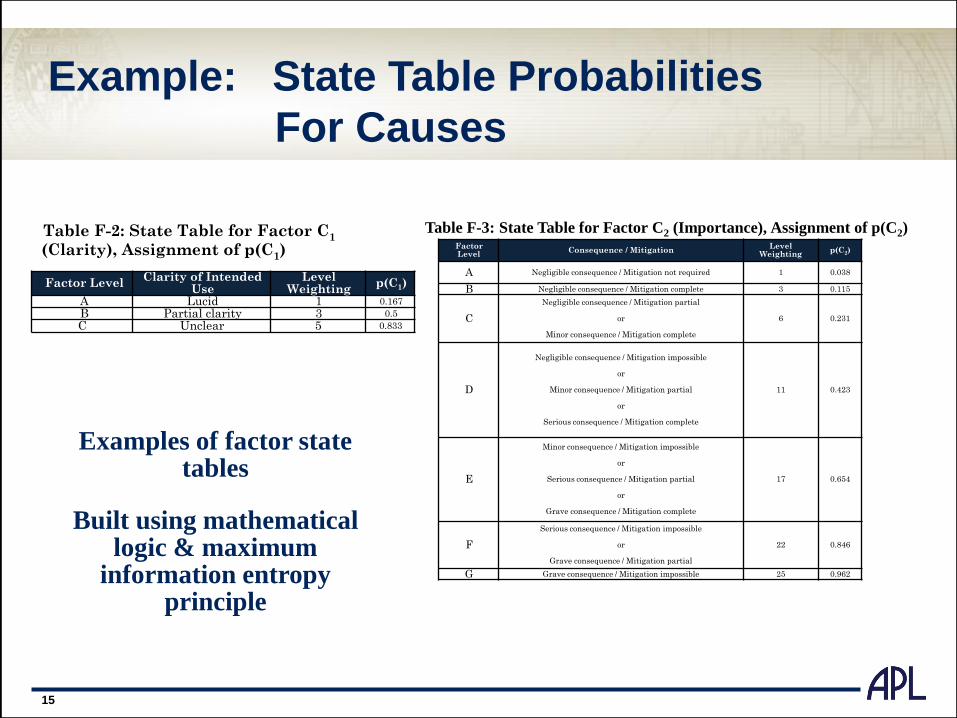
Example: State Table Probabilities
For Causes
Factor LevelClarity of Intended
UseLevel
Weightingp(C1)
A Lucid 1 0.167
B Partial clarity 3 0.5
C Unclear 5 0.833
Table F-2: State Table for Factor C1
(Clarity), Assignment of p(C1)Factor Level
Consequence / MitigationLevel
Weightingp(C2)
A Negligible consequence / Mitigation not required 1 0.038
B Negligible consequence / Mitigation complete 3 0.115
C
Negligible consequence / Mitigation partial
or
Minor consequence / Mitigation complete
6 0.231
D
Negligible consequence / Mitigation impossible
or
Minor consequence / Mitigation partial
or
Serious consequence / Mitigation complete
11 0.423
E
Minor consequence / Mitigation impossible
or
Serious consequence / Mitigation partial
or
Grave consequence / Mitigation complete
17 0.654
F
Serious consequence / Mitigation impossible
or
Grave consequence / Mitigation partial
22 0.846
G Grave consequence / Mitigation impossible 25 0.962
Table F-3: State Table for Factor C2 (Importance), Assignment of p(C2)
Examples of factor state tables
Built using mathematical logic & maximum
information entropy principle
15

DECOMPOSITION OF P(EFFECTS)
p(Effects) is the probability of the effects
resulting from unacceptable consequences to the
decision-maker and is derived from to key
components: M&S Impact and M&S Reliance
• M&S Impact is an indication of how much information the M&S
is providing relative to the decision space.
• M&S Reliance is an indication of the dependence on using M&S
Results in making the decision.
16
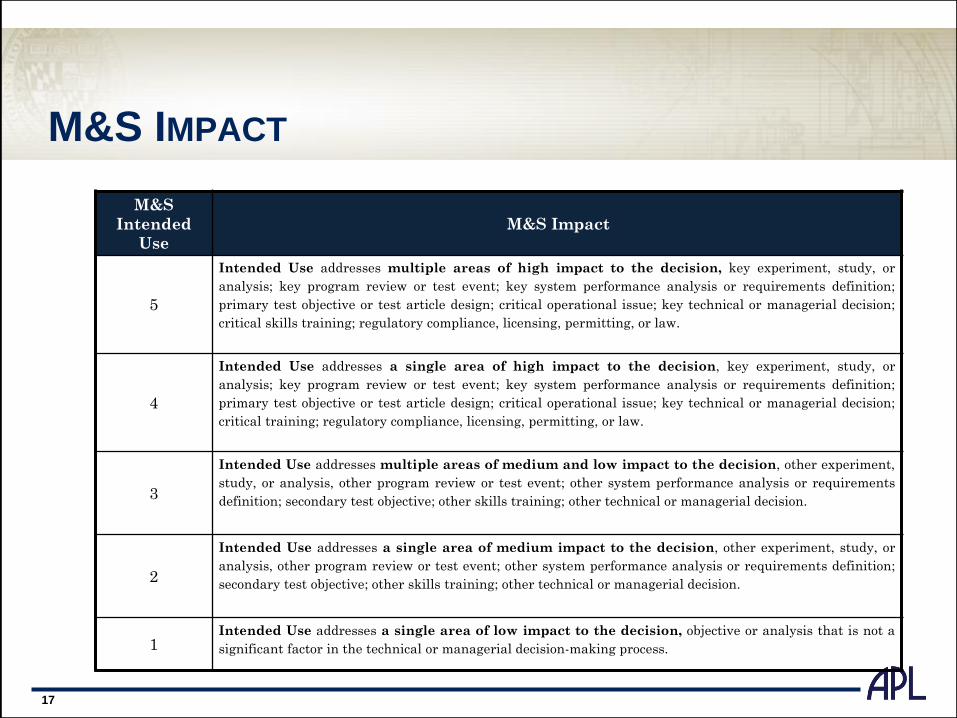
M&S IMPACT
M&S
Intended
Use
M&S Impact
5
Intended Use addresses multiple areas of high impact to the decision, key experiment, study, or
analysis; key program review or test event; key system performance analysis or requirements definition;
primary test objective or test article design; critical operational issue; key technical or managerial decision;
critical skills training; regulatory compliance, licensing, permitting, or law.
4
Intended Use addresses a single area of high impact to the decision, key experiment, study, or
analysis; key program review or test event; key system performance analysis or requirements definition;
primary test objective or test article design; critical operational issue; key technical or managerial decision;
critical training; regulatory compliance, licensing, permitting, or law.
3
Intended Use addresses multiple areas of medium and low impact to the decision, other experiment,
study, or analysis, other program review or test event; other system performance analysis or requirements
definition; secondary test objective; other skills training; other technical or managerial decision.
2
Intended Use addresses a single area of medium impact to the decision, other experiment, study, or
analysis, other program review or test event; other system performance analysis or requirements definition;
secondary test objective; other skills training; other technical or managerial decision.
1Intended Use addresses a single area of low impact to the decision, objective or analysis that is not a
significant factor in the technical or managerial decision-making process.
17

USER RELIANCE ON M&S IN DECISION MAKING
18

Example: State Table Probabilities
For EffectsExample of more complex Effects state table
19

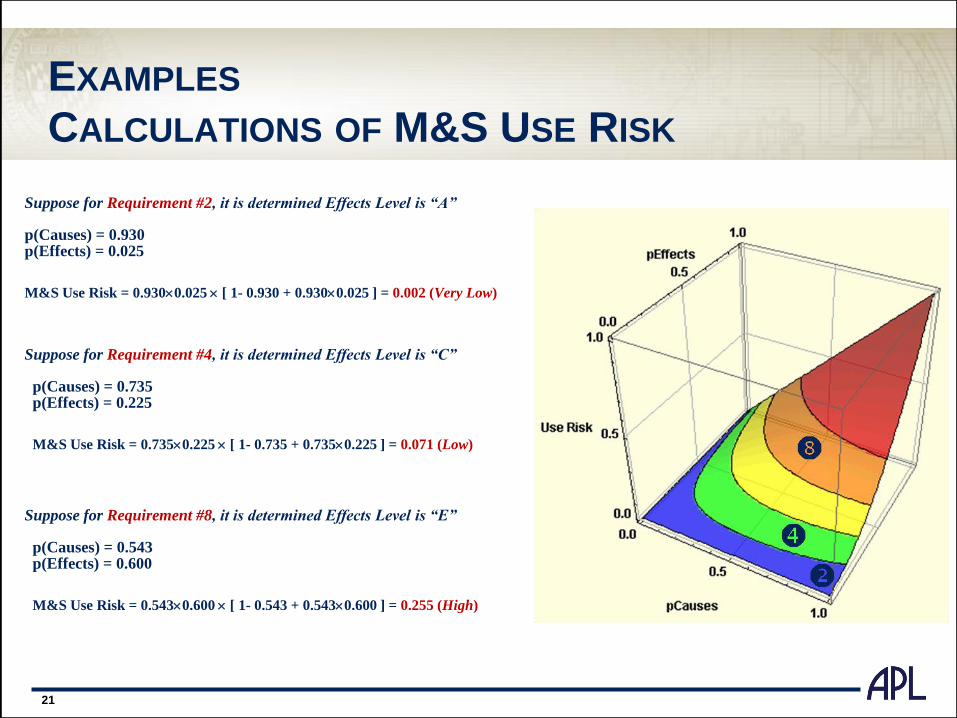
EXAMPLES
CALCULATIONS OF M&S USE RISK
Suppose for Requirement #2, it is determined Effects Level is “A”
p(Causes) = 0.930 p(Effects) = 0.025
M&S Use Risk = 0.9300.025 [ 1- 0.930 + 0.9300.025 ] = 0.002 (Very Low)
Suppose for Requirement #4, it is determined Effects Level is “C”
p(Causes) = 0.735p(Effects) = 0.225
M&S Use Risk = 0.7350.225 [ 1- 0.735 + 0.7350.225 ] = 0.071 (Very Low)
Suppose for Requirement #8, it is determined Effects Level is “E”
p(Causes) = 0.543p(Effects) = 0.600
M&S Use Risk = 0.5430.600 [ 1- 0.543 + 0.5430.600 ] = 0.255 (High)
20
EXAMPLES
CALCULATIONS OF M&S USE RISK
Suppose for Requirement #2, it is determined Effects Level is “A”
p(Causes) = 0.930 p(Effects) = 0.025
M&S Use Risk = 0.9300.025 [ 1- 0.930 + 0.9300.025 ] = 0.002 (Very Low)
Suppose for Requirement #4, it is determined Effects Level is “C”
p(Causes) = 0.735p(Effects) = 0.225
M&S Use Risk = 0.7350.225 [ 1- 0.735 + 0.7350.225 ] = 0.071 (Low)
Suppose for Requirement #8, it is determined Effects Level is “E”
p(Causes) = 0.543p(Effects) = 0.600
M&S Use Risk = 0.5430.600 [ 1- 0.543 + 0.5430.600 ] = 0.255 (High)
21

VISUALIZATION OF MURM RESULTS
Illustrated are results for 15
capabilities & their associated
M&S User Risk
A capability is identified by a number within its symbol
A capability’s priority is noted by the shape of its symbol
A capability’s disposition is noted by the color of its fill
The position of the capability’s symbol on
the risk surface indicates its M&S User
Risk; the surface is divided into five equal
area regions and are labeled from Very Low
risk to Very High risk.
The distribution of the symbols give a sense
of the User Risk status of the M&S; for
example, #4, a high priority capability, met
its acceptability criteria but the risk level,
perhaps driven in part by the p(C3)
recommendation confidence, propels it into
the high user risk region.
9
22

Comments about MURM
MURM allows full use of ALL available information in Use Risk assessment: objective (quantitative), limited (such as only knowing ranking of alternatives), and subjective
Use of information entropy theory reduces or precludes inadvertent & intended bias in assessment
MURM operates at M&S individual capability levels (vice only treating M&S results as a whole)
State tables support Use Risk computation – can be developed to the level supported by available information
Any sophisticated math methodology requires particular math skills. With automation, V&V personnel will be able to use MURM just as Mathematica is used effectively by those without the math skills to apply all of its techniques without use of that program.
40

More Information Is Available
For detailed discussion of MURM and its application or to obtain the MURM report:
Contact Simone Youngblood (JHU/APL) at
(240) 228-7958
42