Embed Size (px)
Citation preview
Page 2 J Am Osteopath Coll Radiol 2012; Vol. 1, Issue 4
MRI Liver Eovist, Saenz
Introduction
Imaging characterization of liver lesions is of diagnostic importance with regard to its implications on patient treatment. Utilization of dynamic MRI has become a common practice as an adjunct to dynamic CT scanning. With the recent FDA approval of gadoxetic disodium, this provides another avenue for evaluation and characterization of indeterminate liver lesions. Gadoxetic acid was approved for use in the United States by the FDA in 2008 for detection and characterization of liver lesions in adults with known or suspected focal liver disease1 The purpose of this article is to review the imaging findings utilizing gadoxetic disodium with respect to benign liver lesions and metastatic disease.
Gadoxetate Disodium
The advantage of utilizing gadoxetate disodium comes from its added hepatocyte phase intracellular imaging. The prior standard gadolinium agents only provide extracellular information with regards to indeterminate liver lesions. Gadoxetic disodium with its additional hepatocyte phase has the ability to provide more specific information of the hepatocyte function/content of an indeterminate liver lesion.
Gadoxetic disodium has two routes of elimination: renal and hepatobiliary.2 The elimination pathways are equally distributed.2 Given its increased T1 shortening compared to traditional extracellular gadolinium products, a lower dose of contrast is required (0.1 mL per kilogram of body weight).2 The gadoxetate disodium is transported from the extracellular space to the intracellular space by ATP-dependent organic anion transporting polypeptide 1 (OATP1) and then excreted into the biliary tract.3 The intracellular imaging (hepatocyte phase) is obtained 20 minutes after intravenous injection. This hepatocyte phase lasts up to 120 minutes,2 which allows for repeat acquisitions on delayed phase imaging to correct for patient motion or other potential technical
limitations. The same restrictions and precautions remain with gadoxetate disodium for nephrogenic systemic fibrosis as with standard extracellular gadolinium products.2
Gadoxetate disodium is best utilized with dynamic, gradient echo (GRE) T1 fat saturation imaging. Optimally, arterial phase imaging, portal venous imaging, and delayed imaging at 20 minutes should be performed. Typically, liver lesions without hepatocytes will not accumulate gadoxetate disodium on delayed imaging. Therefore, they are hypointense relative to the native liver parenchyma on the hepatocyte phase. Since nearly all malignancies lack functioning hepatocytes, they will typically be hypointense on the hepatocyte phase. The one exception to this rule is well-differentiated hepatocellular carcinoma, which demonstrates enhancement on the hepatocyte phase secondary to residual functioning hepatocytes.4-5 Pre-contrast imaging with T1-weighted, T2-weighted, and in-phase and out-of-phase imaging are also beneficial in characterizing liver lesions.
Hepatic Cyst
Hepatic cysts are seen routinely on diagnostic imaging studies and usually do not pose a diagnostic dilemma. Histologically, hepatic cysts are derived from biliary endothelium and contain serous fluid lined by a single layer of epithelium.6 These benign lesions are more commonly seen in women and may be multiple in number. Entities such as autosomal dominant polycystic kidney disease or tuberous sclerosis have been known to present with innumerable hepatic cysts.
CT and MRI imaging of hepatic cysts are complementary in that both modalities show similar findings. Cysts on CT and MRI do not demonstrate contrast enhancement. In addition, T1 and T2-weighted MR images show the cysts to follow fluid signal. Hepatocyte phase imaging is usually not needed in order to characterize these lesions; these
MRI of Benign Liver Lesions and Metastatic Disease Characterization with Gadoxetate Disodium
Rocky C. Saenz, D.O.
Department of Diagnostic Radiology, Botsford Hospital, Farmington Hills, MI

J Am Osteopath Coll Radiol 2012; Vol. 1, Issue 4 Page 3
MRI Liver Eovist, Saenz
lesions are hypointense to the surrounding liver parenchyma on hepatocyte phase (Fig. 1). In the setting of atypical imaging features, such as mural nodules, debris, or thickened septa, then alternative diagnoses must be considered, including cystic metastasis.6
Hemangioma
Hemangiomas are the most common benign tumors of the liver. They are also commonly seen in daily radiology practice and are more common in females than males. The incidence of these lesions is approximately 5 to 20% of the population.6 Histologically, hemangiomas are endothelial lined vascular channels separated by fibrous septa, which
Figure 1. Hepatic Cyst. Multiple axial images demonstrate a
small lesion in segment VII of the right lobe of the liver. The
T1 (A) and T2 fat saturation (B) images show the lesion to be
well circumscribed and of homogeneous low and high signal,
respectively. The pre-contrast, fat saturation GRE (C) shows
the lesion to follow fluid signal. The dynamic portion of the
study shows no enhancement on the arterial phase (D),
portal venous phase (E), or hepatocyte phase (F). Notice the
signal of the lesion follows the signal of cerebrospinal fluid
on all sequences.
Figure 2. Hemangioma. Multiple axial images demonstrate a
moderately-sized lesion in segment IVa of the liver. The T1
(A) and T2 fat saturation (B) images show the lesion to be
well circumscribed and of homogeneous low and high signal,
respectively. Notice that the T2 signal is “light bulb” bright.
The pre-contrast, fat saturation GRE (C) shows the lesion to
be of low signal. The dynamic portion of the study shows
peripheral enhancement of the lesion on the arterial phase
(D) with near total enhancement on the portal venous phase
(E). Notice the lesion is slightly hyperintense to the liver on
the portal venous phase (E). The hepatocyte phase (F)
demonstrates a hypointense lesion.
Page 4 J Am Osteopath Coll Radiol 2012; Vol. 1, Issue 4
MRI Liver Eovist, Saenz
accounts for their dynamic enhancement pattern.6 Unlike hepatic adenomas, it is accepted that these lesions are not associated with oral contraceptive use.3,6,7
Hemangiomas are rarely associated with complications, such as spontaneous rupture/hemorrhage;6 therefore, they are usually asymptomatic. Symptomatic lesions are usually very large (>10cm usually termed giant hemangiomas) and rarely may be associated with platelet sequestration, resulting in thrombocytopenia, known as Kasabach-Merritt syndrome.8-9 Large hemangiomas may also have a central scar, which represents fibrosis secondary to an area of central necrosis produced when the tumor outgrows its blood supply.
Since hemangiomas are commonly encountered, radiologists must recognize their imaging features in order to preclude unnecessary workup or invasive procedures. Many lesions are diagnosed via dynamic liver CT based upon their enhancement patterns. Three dominant enhancement patterns have been described in the literature. The most common pattern is centripetal, peripheral, nodular enhancement of the lesion on early phases (arterial and portal venous phases).3 The enhancement progressively fills the lesion, resulting in iso- to slightly hyperattenuating compared to liver parenchyma on delayed imaging.
This enhancement pattern typically occurs in hemangiomas 2-5 cm in size. Once lesions become larger, a similar enhancement pattern is seen; however, centripetal, peripheral, nodular enhancement of the lesion remains discontinuous centrally. This may occur secondary to the large size of the lesion or be related to central scar formation. Therefore, the lesion centrally remains hypoattenuated compared to surrounding liver parenchyma on delayed imaging. The final enhancement pattern usually occurs in small lesions (<2 cm in size). This enhancement pattern has been termed "flash-filling".3 These lesions typically enhance homogeneously between the arterial and early portal venous phases, resulting in increased attenuation compared to the surrounding liver parenchyma. These smaller hemangiomas also characteristically become iso-attenuated to liver on delayed imaging.
The MRI characteristics of hemangiomas are well documented. The lesions typically are hypointense on
T1 and hyperintense on T2 compared to liver parenchyma. Classically, the lesions are hyperintense, almost “light bulb” bright on T2-weighted imaging. This feature helps distinguish them from malignant lesions, which are typically of intermediate signal on
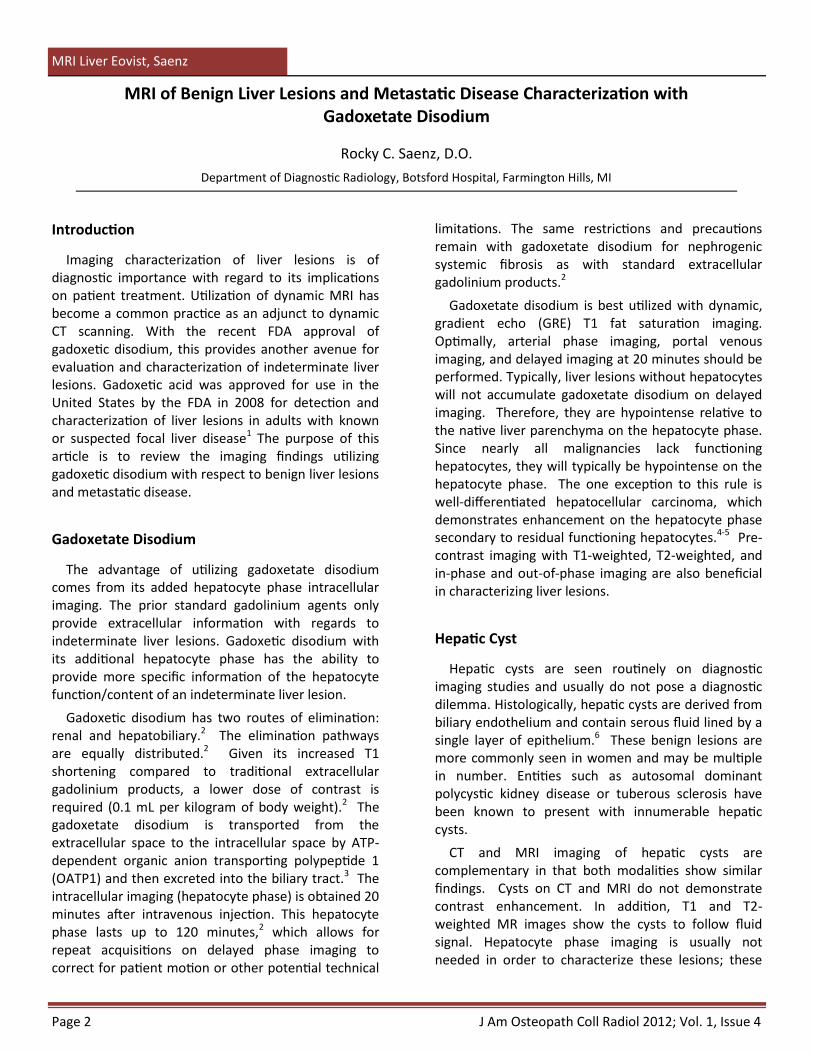
Figure 3. Hepatocellular Adenoma. Multiple axial images and
a single coronal image demonstrate a lesion in segment I of
the liver. The T1 (A) and T2 (B) images show the lesion to be
well circumscribed and hyperintense and intermediate in
signal intensity, respectively. Notice the lesion has bright T1
signal secondary to its fat content, which corresponds with
its loss of signal on the pre-contrast, fat saturation GRE
image (C). The dynamic portion of the study shows minimal
peripheral enhancement of the lesion on the arterial phase
(D) and the portal venous phase (E). The lesion overall
remains hypointense to the liver on the portal venous phase
(E). The hepatocyte phase (F) also demonstrates a
hypointense lesion. Case courtesy of Ankit B. Patel, D.O.
J Am Osteopath Coll Radiol 2012; Vol. 1, Issue 4 Page 5
MRI Liver Eovist, Saenz
T2 imaging. The dynamic enhancement pattern on MRI with gadolinium agents is similar to the CT pattern just described. By utilizing gadoxetate acid, hemangiomas are hypointense on the hepatocyte phase, since they do not contain hepatocytes (Fig 2).
Adenoma
Hepatocellular adenoma is an uncommon benign liver lesion which occurs predominantly in women of reproductive age.6 A direct association has been made with the use of oral contraceptives and steroids.3,6,7,10 Histologically, adenomas are made up of benign hepatocytes arranged in cords separated by dilated sinusoids.7 They lack bile ducts, which histologically distinguishes them from focal nodular hyperplasia (FNH).6,7 These histologic qualities are responsible for the dynamic enhancement pattern seen on imaging.
Hepatocellular adenomas also lack portal tracks and hepatic veins, which predisposes them to development of necrosis and rupture with spontaneous hemorrhage.6 There is also the potential for malignant degeneration with approximately 5% of adenomas differentiating into hepatocellular carcinoma.3 Since the severity of potential complications exists, adenomas are managed differently from other benign liver masses with the majority surgically removed. Therefore, it is important for radiologists to understand and recognize their imaging appearance.
The MRI characteristics of hepatocellular adenomas may be variable. Typically, these lesions are hypointense to liver parenchyma on T1 and intermediate to hyperintense compared to liver parenchyma on T2 weighted images. On occasion, macroscopic fat may be present, which results in areas of high T1 signal intensity (Fig. 3). The dynamic MRI
enhancement pattern is variable as well; typically, these lesions demonstrate homogeneous, hyperintense enhancement on arterial phase imaging, similar to other hepatic lesions (Table 1).10 Hepatocellular adenomas demonstrate this enhancement pattern secondary to their vascular histology. They typically remain hyperintense to iso-intense to liver parenchyma on portal venous imaging. The hepatocyte phase characteristics are a helpful
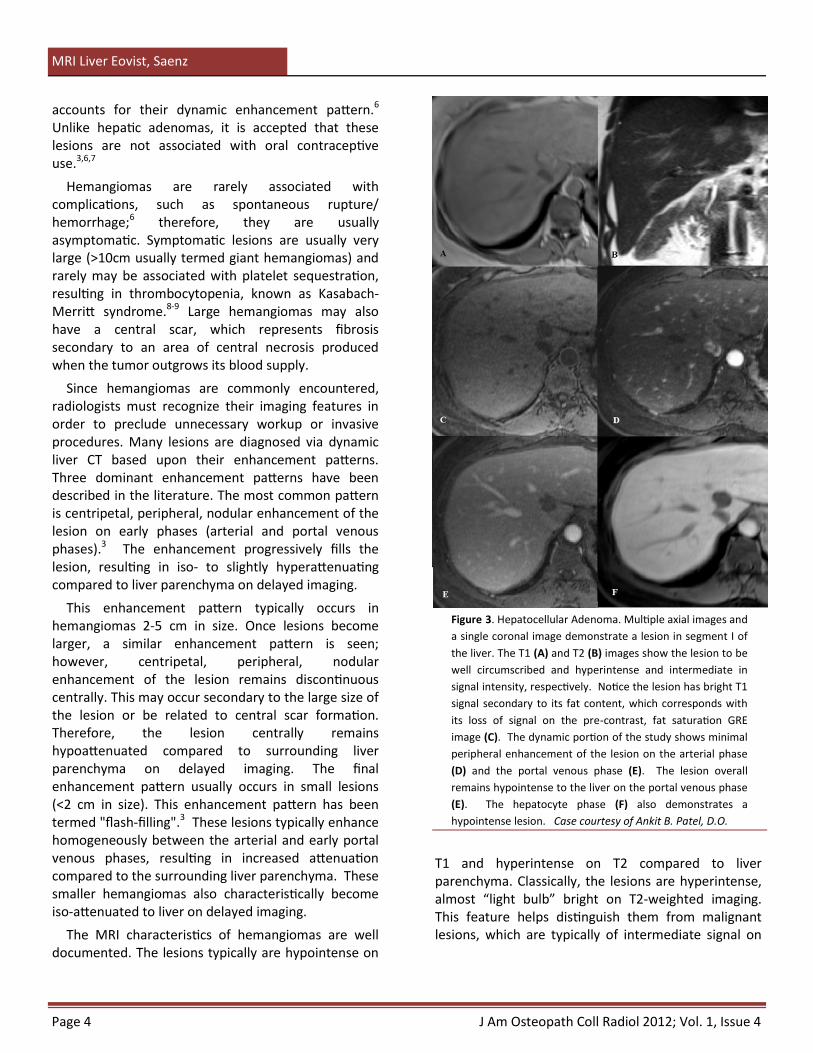
Figure 4. Focal Nodular Hyperplasia. Multiple axial images
demonstrate a moderately sized lesion in segment II of the
liver. On the T1 (A) and T2 fat saturation (B) images the le-
sion is very subtle and hypointense and slightly hyperintense
in signal intensity, respectively. Notice the lesion has inter-
mediate T2 signal when compared to the hepatic cyst and
hemangioma from Figures 1 and 2. The pre-contrast fat
saturation GRE (C) shows the lesion to be iso to hypointense
signal. The dynamic portion of the study demonstrates brisk
enhancement of the lesion in the arterial phase (D) and
slightly hyperintense signal on the portal venous phase (E).
The hepatocyte phase (F) shows an iso-intense lesion.
Table 1. DDx Hypervascular Liver Lesions
Benign
Hepatocellular Adenoma
Focal Nodular Hyperplasia
Hemangioma (Flash-fill)
Malignant
Hepatocellular Carcinoma
Metastatic Disease
Page 6 J Am Osteopath Coll Radiol 2012; Vol. 1, Issue 4
MRI Liver Eovist, Saenz
discriminator with regard to diagnosis of these lesions, as adenomas are usually hypointense compared to liver parenchyma (Fig. 3). The gadoxetate acid hepatocyte phase is instrumental in differentiating these lesions from focal nodular hyperplasia, which is typically hyperintense to iso-intense to liver parenchyma.10 Lastly, an additional potential discriminating characteristic of adenomas is peripheral rim enhancement of the pseudocapsule.
Focal Nodular Hyperplasia
Focal nodular hyperplasia (FNH) is the second most common benign tumor of the liver, and is also more common in females. The incidence is approximately 5% of the general population.3 The majority of these lesions are solitary and contain a central scar.3,6 It is controversial in the literature regarding the lesion’s association with oral contraceptive use, but most studies agree that no direct relationship exists.3,4 FNH is composed of hyperplastic liver parenchyma superimposed upon a pre-existing arterial spiderlike vascular malformation.7 Histologically, these lesions contain Kupffer cells, hepatocytes, and small bile ductules with surrounding radiating fibrous septa.7
On MRI, FNH is typically of low signal on T1-weighted imaging and intermediate signal on T2-weighted imaging. Greater than 50% of these lesions demonstrate a central scar, which classically is of high T2 signal. Morphologically, FNH can be differentiated from hepatocellular adenoma based upon the tumor margins. Hepatocellular adenoma is typically well circumscribed, whereas FNH has lobulated margins.
Arterial phase imaging characteristically demonstrates marked uptake of gadolinium, making the lesion hyperintense to the surrounding liver parenchyma. On the portal venous phase, the lesion is typically hyperintense or iso-intense compared to liver parenchyma. The hepatocyte phase of the dynamic MR enhancement pattern is the most specific radiographic finding in diagnosing FNH.5 On delayed 20 minute imaging, the hepatocyte phase usually demonstrates the lesion to be hyperintense to iso-intense to the remaining liver parenchyma (Fig 4). The increased signal during the hepatocyte phase is due to the presence of hyperplastic hepatocytes and small bile ductules.7
Multiple liver lesions including focal nodular hyperplasia may have a central scar (Table 2). The
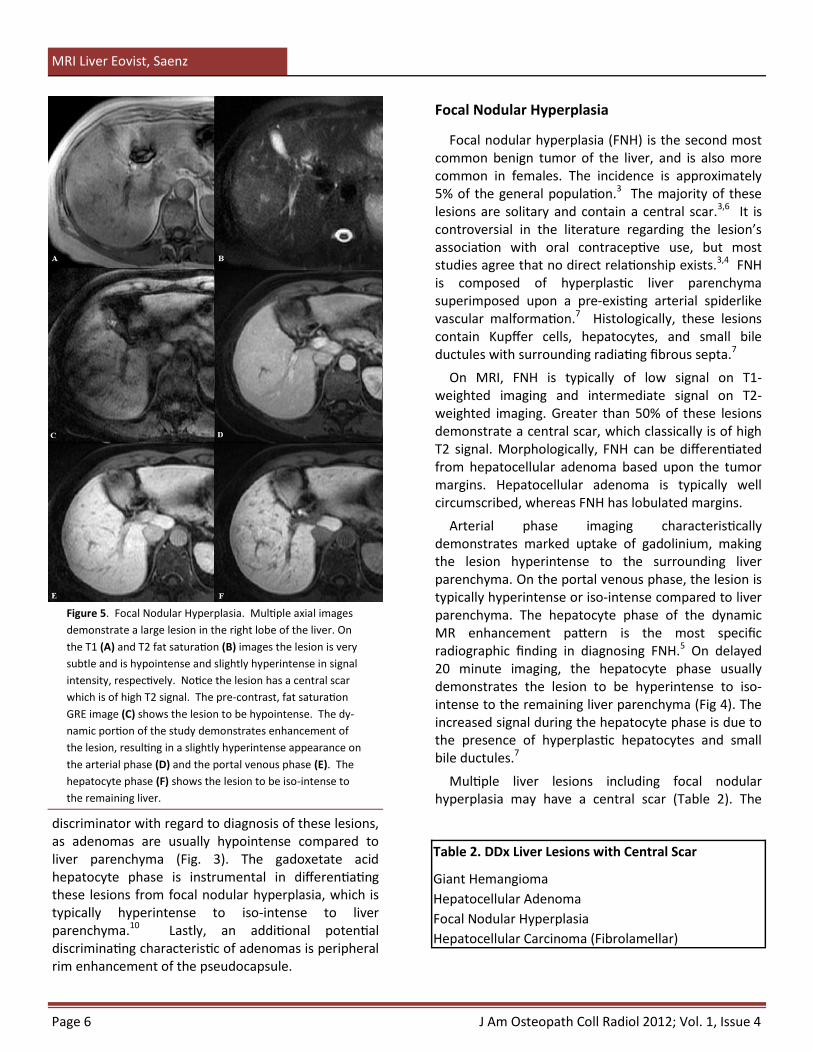
Figure 5. Focal Nodular Hyperplasia. Multiple axial images
demonstrate a large lesion in the right lobe of the liver. On
the T1 (A) and T2 fat saturation (B) images the lesion is very
subtle and is hypointense and slightly hyperintense in signal
intensity, respectively. Notice the lesion has a central scar
which is of high T2 signal. The pre-contrast, fat saturation
GRE image (C) shows the lesion to be hypointense. The dy-
namic portion of the study demonstrates enhancement of
the lesion, resulting in a slightly hyperintense appearance on
the arterial phase (D) and the portal venous phase (E). The
hepatocyte phase (F) shows the lesion to be iso-intense to
the remaining liver.
Table 2. DDx Liver Lesions with Central Scar
Giant Hemangioma
Hepatocellular Adenoma
Focal Nodular Hyperplasia
Hepatocellular Carcinoma (Fibrolamellar)
J Am Osteopath Coll Radiol 2012; Vol. 1, Issue 4 Page 7
MRI Liver Eovist, Saenz
central scar in FNH is unlike the other lesions with respect to its bright T2 signal (Fig. 5). Delayed imaging on CT and MRI with extracelluar, standard gadolinium agents usually demonstrates enhancement of the fibrous scar. Hepatocyte imaging with gadoxetate disodium typically shows non-enhancement of the central scar.5
In comparing FNH with hepatocellular adenoma, a recent study by Grazioli et al, demonstrated that hepatocellular adenomas and FNH have different imaging characteristics on hepatocyte phase imaging greater than 90% of the time. 10 This study also highlighted the fact that a combination of marked enhancement on arterial phase imaging with corresponding hyperintense to iso-intense appearance on hepatocyte phase imaging differentiates FNH from the moderate arterial phase enhancement and hypointensity on hepatocyte imaging seen with hepatocellular adenoma.10
Metastatic Disease
Metastatic disease represents the most common malignant tumor of the liver. The most common primary tumors include lung, breast, colon, pancreas, and melanoma.6 The majority are multiple and vary in size as well as appearance.11 Classically, metastatic lesions are poorly circumscribed with erratic behavior on dynamic CT and MR liver studies.
The majority of metastases are heterogeneous but low in T1 signal intensity with corresponding intermediate to high T2 signal intensity. Compared to
benign liver lesions such as hemangiomas, the T2 signal intensity of metastatic lesions is typically less intense. While hemangiomas have a very similar bright T2 signal compared to hepatic cysts, metastatic lesions are slightly hyperintense compared to background liver parenchyma on T2 sequences (Table 3). Rarely, metastatic lesions may be bright on T1-weighted imaging, as is seen with hepatic metastases from a pancreatic insulinoma; the increased T1 signal is thought to be related to the effects of insulin promoting hepatocyte triglyceride accumulation.11
The majority of metastases have their vascular supply from the hepatic arteries secondary to neo-angiogenesis; therefore, they demonstrate early enhancement on arterial phase imaging. This early enhancement, however, is nonspecific. The differential diagnoses of hypervascular metastatic lesions are listed in Table 4. Unlike some of the benign entities previously discussed, metastases typically do not demonstrate homogeneous enhancement. Lesions from breast carcinoma and gastrointestinal adenocarcinoma may have a “target” enhancement pattern on arterial and early portal venous imaging (Fig. 6). Most metastatic lesions show “washout” on portal venous imaging (hypointense to liver parenchyma).11 Hepatocyte phase imaging demonstrates low signal intensity compared to surrounding liver parenchyma. Metastatic lesions demonstrate no enhancement on the intracellular 20 minute delayed phase, since they do not contain functioning hepatocytes (Fig. 7).
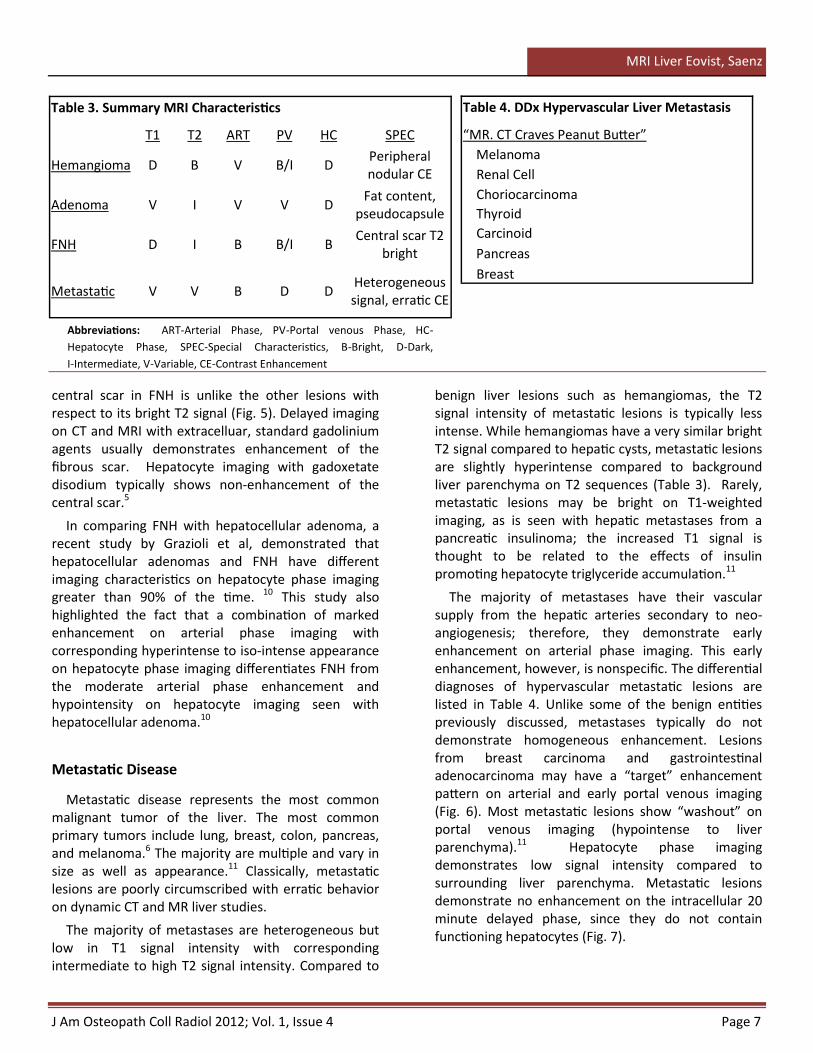
Abbreviations: ART-Arterial Phase, PV-Portal venous Phase, HC-
Hepatocyte Phase, SPEC-Special Characteristics, B-Bright, D-Dark,
I-Intermediate, V-Variable, CE-Contrast Enhancement
Table 3. Summary MRI Characteristics
T1 T2 ART PV HC SPEC
Hemangioma D B V B/I D Peripheral nodular CE
Adenoma V I V V D Fat content,
pseudocapsule
FNH D I B B/I B Central scar T2
bright
Metastatic V V B D D Heterogeneous signal, erratic CE
Table 4. DDx Hypervascular Liver Metastasis
“MR. CT Craves Peanut Butter”
Melanoma
Renal Cell
Choriocarcinoma
Thyroid
Carcinoid
Pancreas
Breast
Page 8 J Am Osteopath Coll Radiol 2012; Vol. 1, Issue 4
MRI Liver Eovist, Saenz
Summary
It is imperative for the radiologist to be familiar with the different dynamic enhancement patterns of benign and malignant liver lesions. With the advent of gadoxetate disodium, hepatocyte phase specific
imaging can provide important information in the characterization of indeterminate liver lesions. This additional information not only assists in making the correct diagnosis, but also helps guide management, to include avoiding unnecessary follow-up or invasive procedures in some cases.
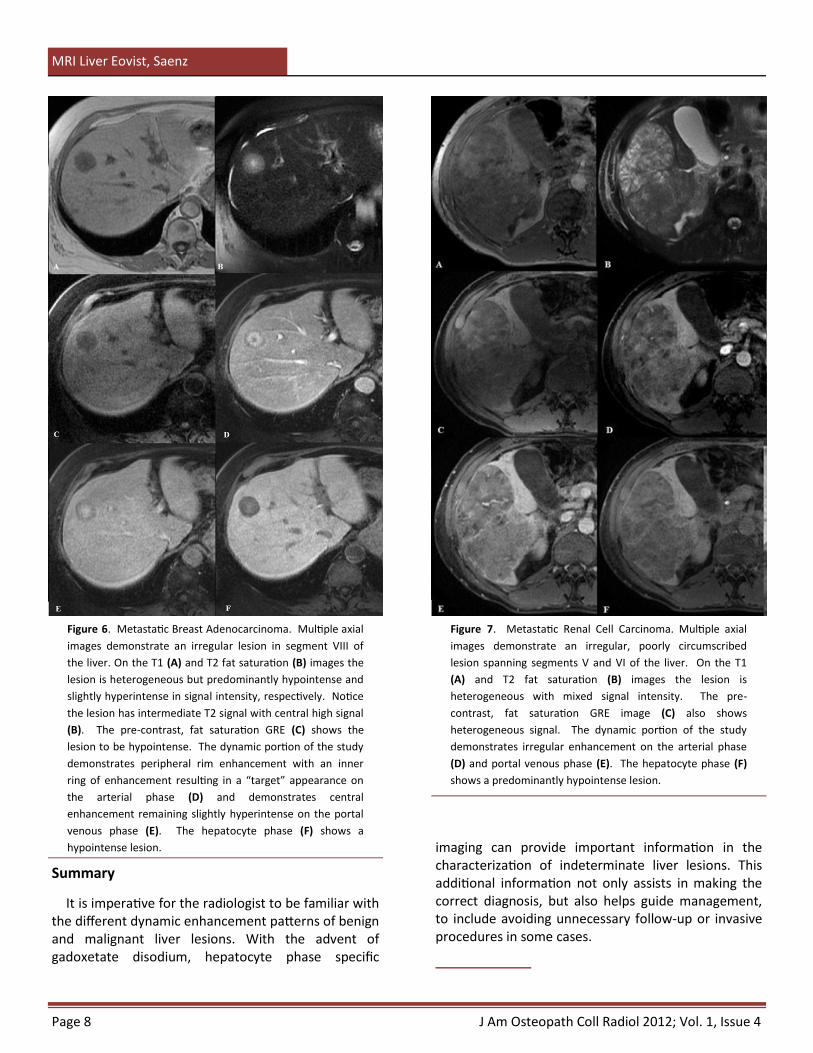
Figure 6. Metastatic Breast Adenocarcinoma. Multiple axial
images demonstrate an irregular lesion in segment VIII of
the liver. On the T1 (A) and T2 fat saturation (B) images the
lesion is heterogeneous but predominantly hypointense and
slightly hyperintense in signal intensity, respectively. Notice
the lesion has intermediate T2 signal with central high signal
(B). The pre-contrast, fat saturation GRE (C) shows the
lesion to be hypointense. The dynamic portion of the study
demonstrates peripheral rim enhancement with an inner
ring of enhancement resulting in a “target” appearance on
the arterial phase (D) and demonstrates central
enhancement remaining slightly hyperintense on the portal
venous phase (E). The hepatocyte phase (F) shows a
hypointense lesion.
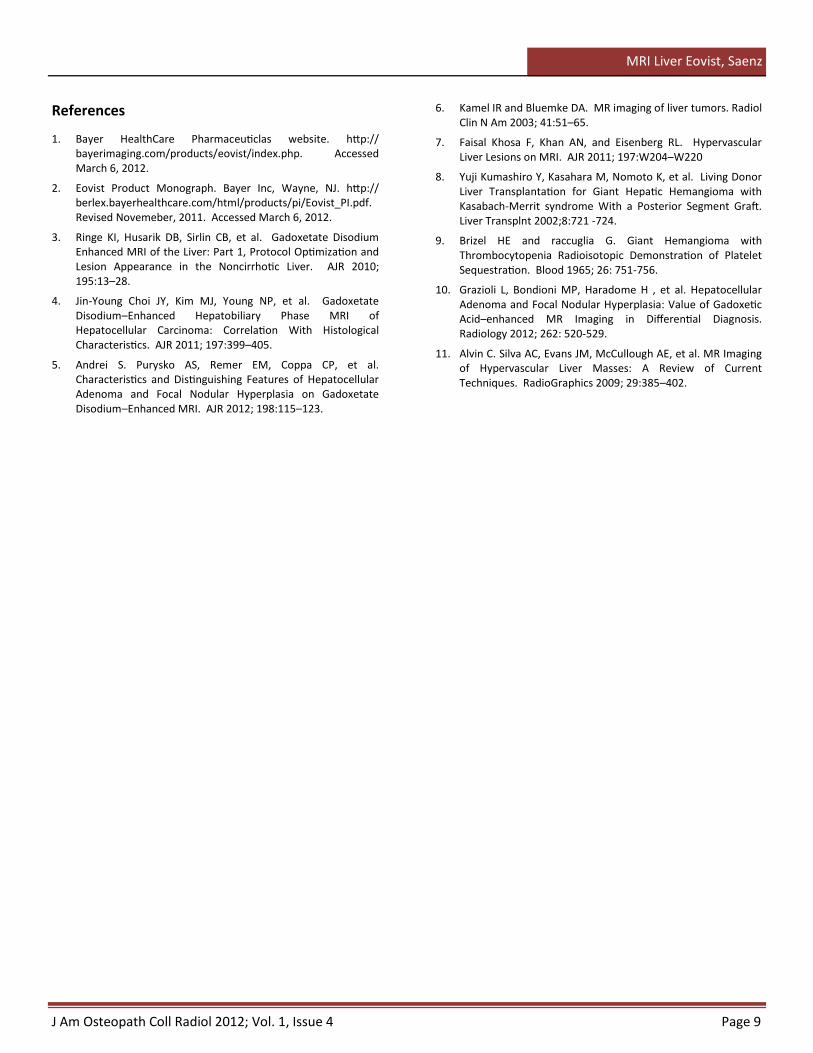
Figure 7. Metastatic Renal Cell Carcinoma. Multiple axial
images demonstrate an irregular, poorly circumscribed
lesion spanning segments V and VI of the liver. On the T1
(A) and T2 fat saturation (B) images the lesion is
heterogeneous with mixed signal intensity. The pre-
contrast, fat saturation GRE image (C) also shows
heterogeneous signal. The dynamic portion of the study
demonstrates irregular enhancement on the arterial phase
(D) and portal venous phase (E). The hepatocyte phase (F)
shows a predominantly hypointense lesion.
J Am Osteopath Coll Radiol 2012; Vol. 1, Issue 4 Page 9
MRI Liver Eovist, Saenz
References
1. Bayer HealthCare Pharmaceuticlas website. http://bayerimaging.com/products/eovist/index.php. Accessed March 6, 2012.
2. Eovist Product Monograph. Bayer Inc, Wayne, NJ. http://berlex.bayerhealthcare.com/html/products/pi/Eovist_PI.pdf. Revised Novemeber, 2011. Accessed March 6, 2012.
3. Ringe KI, Husarik DB, Sirlin CB, et al. Gadoxetate Disodium Enhanced MRI of the Liver: Part 1, Protocol Optimization and Lesion Appearance in the Noncirrhotic Liver. AJR 2010; 195:13–28.
4. Jin-Young Choi JY, Kim MJ, Young NP, et al. Gadoxetate Disodium–Enhanced Hepatobiliary Phase MRI of Hepatocellular Carcinoma: Correlation With Histological Characteristics. AJR 2011; 197:399–405.
5. Andrei S. Purysko AS, Remer EM, Coppa CP, et al. Characteristics and Distinguishing Features of Hepatocellular Adenoma and Focal Nodular Hyperplasia on Gadoxetate Disodium–Enhanced MRI. AJR 2012; 198:115–123.
6. Kamel IR and Bluemke DA. MR imaging of liver tumors. Radiol Clin N Am 2003; 41:51–65.
7. Faisal Khosa F, Khan AN, and Eisenberg RL. Hypervascular Liver Lesions on MRI. AJR 2011; 197:W204–W220
8. Yuji Kumashiro Y, Kasahara M, Nomoto K, et al. Living Donor Liver Transplantation for Giant Hepatic Hemangioma with Kasabach-Merrit syndrome With a Posterior Segment Graft. Liver Transplnt 2002;8:721 -724.
9. Brizel HE and raccuglia G. Giant Hemangioma with Thrombocytopenia Radioisotopic Demonstration of Platelet Sequestration. Blood 1965; 26: 751-756.
10. Grazioli L, Bondioni MP, Haradome H , et al. Hepatocellular Adenoma and Focal Nodular Hyperplasia: Value of Gadoxetic Acid–enhanced MR Imaging in Differential Diagnosis. Radiology 2012; 262: 520-529.
11. Alvin C. Silva AC, Evans JM, McCullough AE, et al. MR Imaging of Hypervascular Liver Masses: A Review of Current Techniques. RadioGraphics 2009; 29:385–402.


![Our Dermatology Online Case Report MMetastatic melanoma ... · lesions. While ITM’s can occur anywhere on the body, ... metastatic melanoma was the culprit [6-10]. One case involved](https://img.dokumen.tips/doc/110x75/6047ebb5adf5097f51310559/our-dermatology-online-case-report-mmetastatic-melanoma-lesions-while-itmas.jpg)


![Osteolytic lesions (brown tumors) of primary hyperparathyroidism … · 2018. 6. 25. · metastatic disease [2, 5–11]. The diagnosis of BT is based on medical history, clinical](https://img.dokumen.tips/doc/110x75/6106f2f301cddf7d4e57c6ff/osteolytic-lesions-brown-tumors-of-primary-hyperparathyroidism-2018-6-25.jpg)