Embed Size (px)
DESCRIPTION
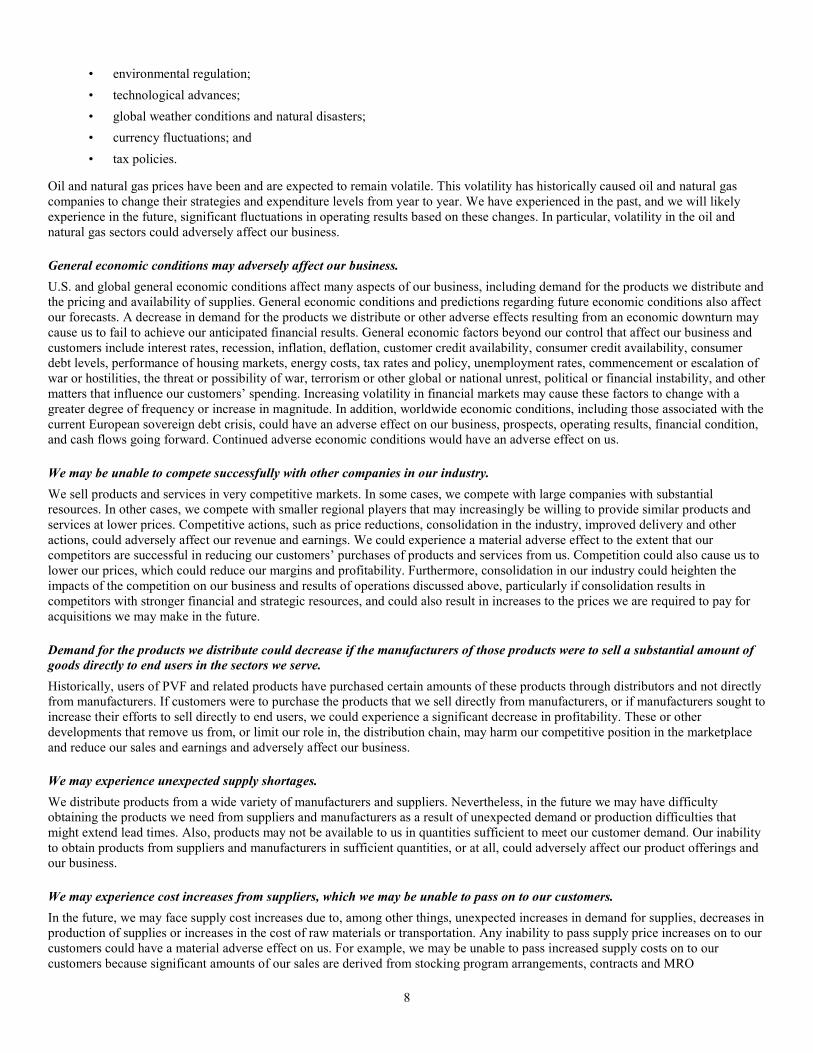
MRC Global 2012 Annual Report
Citation preview

M R C G L O B A L I N C . – 2 0 1 2 A N N U A L R E P O R T
“MRC IS...


...THE INFRASTRUCTURE THAT HOLDS THE ENERGY INDUSTRY TOGETHER.”
– Andrew Lane – MRC Chairman, President & CEO
Global energy demand is on the rise as economies around the
world continue to improve and develop. MRC plays a key role in
bringing energy to the world by providing the vital pipe, valves
and fittings to the industry.
From South Texas to Australia, MRC is the infrastructure that
holds the global energy industry together.

We may be the leader in our space, but that does not mean we
are sitting still.
In 2012, our sales climbed to $5.57 billion representing a 15%
increase over 2011. Our proactive M&A plan produced three
strategic acquisitions in 2012. The addition of Piping Systems
Australia, Chaparral Supply and Production Specialty Services
all added key service locations and experienced employees.
We conquered a new frontier with the signing of our industry’s
first global distribution contract. MRC will continue to grow to
service the needs of our global customers.
MRC IS GROWING.
MRCGLOBAL.COM2

1
MRC IS THE FIRST PVF DISTRIBUTION COMPANY TO SIGN A NORTH AMERICAN PVF CONTRACT WITH A GLOBAL VALVE CONTRACT.
MRC distribution center in Houston, TX.
MRC 2012 ANNUAL REPORT 3

MRC operations in Singapore.
MRC operations in Almere, The Netherlands.
IN 2012, MRC HAD SIGNIFICANT SALES TO MORE THAN 44 COUNTRIES.
MRCGLOBAL.COM4

MRC brings the stability, infrastructure, reputation
and systems our stakeholders want in a global
partner. We source product from more than
35 countries as part of our best-in-class,
in-house quality process. Our
global network of Regional
Distribution Centers and
service locations then stock
those products in key energy
and industrial regions near
our customers’ operations
ready for when they are needed.
By leveraging our global presence and anticipating
our customers’ needs, we are able to provide
unbeatable service at the local level.
MRC IS GLOBAL.
MRC 2012 ANNUAL REPORT 5

Since 1921, we have found that the key to our success is
providing excellent customer service every day. At MRC, we
focus on putting service-oriented people in locations near
customer operations so they can get the local service they
require on every order, every day.
We then support our employees with substantial local
inventories of the product they need most for their regions.
We pride ourselves on having the right products and the best
people at locations near our customers’ operations.
MRC IS LOCAL.
MRC operations in Crane, TX.
MRCGLOBAL.COM66

MRC’S 4,750+ EMPLOYEES SERVE OUR CUSTOMERS FROM 400+ SERVICE LOCATIONS STOCKED WITH NEARLY $1 BILLION IN INVENTORY.
MRC provides onsite service to a customer in the Permian Basin.
MRC 2012 ANNUAL REPORT 7

OCTG
REVENUES BY INDUSTRY SECTOR
UPSTREAM
REVENUES BY GEOGRAPHY
REVENUES BY PRODUCT LINE
Line Pipe Valves
MRC IS BALANCED.
MRC understands that our various stakeholders want a stable business
partner. While we are laser focused on the energy industry, our business is
diversified by product line, geography and industry sector.
Approximately 70% of our sales are to customers through multi-year
Maintenance, Repair and Operations (MRO) contracts, and no single customer
accounts for more than 6% of our 2012 business.
Revenue ($ in Millions)
Operating Income ($ in Millions)
Earnings Per Share ($)
4,832
5,571
1210 11
3,846
407
195
66
10 11 12
1.22
0.34
(0.61)
11 1210
Drilling & Completion Tubulars
Gulf Coast U.S.Western U.S.
Production Infrastructure, Materials & Supplies
MRCGLOBAL.COM8

MIDSTREAM DOWNSTREAM
Valves Fittings & Flanges Other
3
2012 SALES OF $5.57 BILLION REPRESENT A 15% INCREASE OVER 2011 REVENUES.
Gulf Coast U.S. Eastern U.S. Canada International
Transmission Chemical Refining Other/IndustrialGas Utility
REVENUES $5.57 Billion
OPERATING INCOME $407 Million
NET INCOME $118 Million
EPS $1.22
WORKING CAPITAL $1.2 Billion
TOTAL ASSETS $3.4 Billion
MRC 2012 ANNUAL REPORT 9

MRC inventory staged for delivery in the United Kingdom.
MRC distribution center in Perth, Western Australia.
MRC HAS BEEN FOCUSED ON PVF DISTRIBUTION TO THE ENERGY INDUSTRY FOR 92 YEARS.
MRCGLOBAL.COM10

For 92 years, we have been focused on one thing: creating PVF
distribution solutions that help our customers succeed. Because
of that intense focus, we have become intimately
familiar with all of the details of PVF distribution.
This expertise creates cost savings for our
customers and is the foundation of our
company’s value proposition.
MRC IS FOCUSED.
MRC 2012 ANNUAL REPORT 11

MRC IS SAFE.
At MRC, safety is more than a policy – it’s a personal responsibility.
No matter where we are on the globe, our dedication to creating
a safe workplace is the same. Every employee is personally
responsible for ensuring that they, along with their coworkers, go
home to their family safe at the end of each day. We know that
the only way to serve our customers and suppliers to the best
of our ability is to make safety our first priority.
MRCGLOBAL.COM12

MRC operations in the Permian Basin at Odessa, TX.
AT MRC, SAFETY IS OUR FIRST PRIORITY. ZERO ACCIDENTS IS OUR GOAL.
MRC 2012 ANNUAL REPORT 13

As we have grown, so has our responsibility to the communities
where we live and work. An important part of our legacy is leaving
a positive imprint on the communities that support us every day.
Not only are MRC employees genuinely encouraged to take time
to be active in their community, but in 2012 MRC donated more
than $700,000 to support charitable organizations nominated
by our employees.
MRC IS INVOLVED.
MRCGLOBAL.COM14

DURING THE 2012 MRC CARES GLOBAL FOOD DRIVE, MRC EMPLOYEES DONATED NEARLY 80,000 POUNDS OF FOOD TO THEIR LOCAL COMMUNITIES - ENOUGH TO PROVIDE NEARLY 160,000 MEALS TO THOSE IN NEED.
MRC 2012 ANNUAL REPORT 15

DEAR MRC SHAREHOLDERS,
Pipe, valves and fittings are the building blocks of the energy industry’s infrastructure. The selection and distribution of those building blocks is vital to the success of the industry around the world. MRC has focused on PVF distribution for 92 years. We bring the strength of a global company and the customer service of a local partner to this thriving market.
Today, we are an integral part of a complex, global energy supply chain that connects 18,000 end users with 18,000 suppliers every day.
A YEAR OF FIRSTS
In many ways, 2012 was a year of “firsts” for both MRC and the PVF distribution industry.
For the first time in MRC’s history, we recorded sales of $5.57 billion, a 15% increase from 2011. In our first year as a public company, MRC recorded earnings per share of $1.22.
We made our debut on the New York Stock Exchange, raising $333 million in our April IPO, and were promptly featured for the first time on the Fortune 500. We were recognized as one of the top performing IPOs for 2012, and ranked in the top ten worldwide distributors in Industrial Distribution’s global “Big 50 List.”
In June, we signed an industry-first, global contract with Shell. MRC is now responsible for providing valve and valve automation products and services to all of Shell’s operations around the world. This is in addition to our broad North America pipe, flanges and fitting (PFF) contract with Shell. This contract confirms our growth strategy and sets the stage for other global end-users to pursue similar agreements.
2012 also marks the first time in our company’s history that our business outside of the United States accounts for more than 20% of our sales. In the last five years, we have grown this business from nearly zero to a significant portion of our overall revenue.
LETTER FROM THE CHAIRMAN
MRCGLOBAL.COM16

EXECUTING OUR STRATEGY
Our successes in 2012 did not materialize overnight. They were possible because of our focus on executing our strategic plan.
We are committed to a targeted growth and an active M&A program in key energy producing regions. Growing organically and adding the right companies with the right people in the right locations will continue to build on our industry leading position. Last year, we built upon our regional distribution center and automation shop network by adding a first class facility in Cheyenne, WY to support our business in the Bakken and Niobrara shale plays.
In 2012, MRC made three key acquisitions. We added Piping Systems Australia in March, which, when combined with existing business, made MRC the largest complete PVF distributor in the very active Australian mining and oil and gas sectors. In June, we acquired Chaparral Supply in the Mississippian Lime region of the U.S. adding knowledgeable employees and a key customer in SandRidge Energy. To cap off the year, we welcomed Production Specialty Services (PSS) to MRC. The addition of PSS expands our branch network in the Permian Basin and Eagle Ford shale regions of the U.S. and adds a high quality workforce and customer base to our Gulf Coast region.
We have continued to execute on our strategy to reposition our product mix away from OCTG and towards higher margin, MRO-focused, less volatile products. At the end of 2012, we hit our target of rebalancing our inventory position in OCTG to 7% of total inventory.
Throughout the year we implemented our plan to reposition our capital structure for long term growth and flexibility. Beginning with our IPO in April we raised $333 million, which we used to retire debt. In March we secured a $1.25 billion global ABL facility, and in November we refinanced our high cost, long term debt. We finished the year with a leverage ratio of 2.6.
LOOKING FORWARD
We anticipate 2013 will be a year of continued growth fueled by our industry leading position, strong end sector demand and continued commitment to our strategic plan.
MRC 2012 ANNUAL REPORT 17

In the upstream sector E&P spending globally is projected to increase in 2013. South East Asia and Australia, where MRC is well positioned, are expected to be particularly active regions throughout the coming year and we look forward to capitalizing on our new infrastructure in these key markets.
Pipeline infrastructure spending in North America, which drives our fastest growing market sector, is expected to increase to support growing oil and NGL production and aging infrastructure replacement programs.
Downstream PVF demand, chemical in particular, will also continue to be active as end users reposition their assets to capitalize on low natural gas and NGL prices in North America. We anticipate the capital and maintenance spending by the end users will contribute to our growth as delayed projects materialize.
EXECUTIVE CORPORATE LEADERSHIP Left to Right
ANDREW R. LANE – Chairman, President & CEO
JAMES E. BRAUN – Executive VP & CFO
DANIEL J. CHURAY – Executive VP Corporate Affairs, General Counsel & Corporate Secretary
MRCGLOBAL.COM18

Thank you for your commitment to MRC. The MRC management team and I look forward to continuing to work towards a successful and rewarding future as the leader in our industry.
Best Regards,
Andrew R. LaneChairman, President & CEO
EXECUTIVE OPERATIONS LEADERSHIP Left to Right
SCOTT A. HUTCHINSON – Executive VP Canada
ALAN H. COLONNA – Executive VP Global Business Development & Supply Chain Management
NEIL P. WAGSTAFF – Executive VP of International Operations
JAMES F. UNDERHILL – Executive VP & COO United States
EXECUTIVE STRATEGY AND M&A LEADERSHIP Left to Right
RORY M. ISAAC – Executive VP Corporate Strategy, Mergers & Acquisitions
GARY A. ITTNER – Executive VP Corporate Strategy, Mergers & Acquisitions
MRC 2012 ANNUAL REPORT 19

MRCGLOBAL.COM20

UNITED STATES SECURITIES AND EXCHANGE COMMISSION
Washington, D.C. 20549
FORM 10-K
(Mark One) ANNUAL REPORT PURSUANT TO SECTION 13 OR 15(D) OF THE SECURITIES EXCHANGE ACT OF 1934
FOR THE FISCAL YEAR ENDED DECEMBER 31, 2012 or
TRANSITION REPORT PURSUANT TO SECTION 13 OR 15(D) OF THE SECURITIES EXCHANGE ACT OF 1934 FOR THE TRANSITION PERIOD FROM TO
Commission file number: 001-35479
MRC Global Inc. (Exact name of registrant as specified in its charter)
Delaware 20-5956993 (State or Other Jurisdiction of Incorporation or Organization)
(I.R.S. Employer Identification No.)
2 Houston Center, 909 Fannin, Suite 3100 Houston, Texas 77010
(Address of Principal Executive Offices) (Zip Code) (877) 294-7574
(Registrant’s Telephone Number, including Area Code) Securities registered pursuant to Section 12(b) of the Act:
Title of each class
Name of each exchange on which registered
Common Stock New York Stock Exchange Securities registered pursuant to Section 12(g) of the Act: None
(Title of class)
Indicate by check mark if the registrant is a well-known seasoned issuer, as defined in Rule 405 of the Securities Act. Yes No Indicate by check mark if the registrant is not required to file reports pursuant to Section 13 or Section 15(d) of the Exchange
Act. Yes No Indicate by check mark whether the registrant (1) has filed all reports required to be filed by Section 13 or 15(d) of the Securities
Exchange Act of 1934 during the preceding 12 months (or such shorter period that the registrant was required to file such reports), and (2) has been subject to such filing requirements for the past 90 days. Yes No
Indicate by check mark whether the registrant has submitted electronically and posted on its corporate Web site, if any, every Interactive Data File required to be submitted and posted pursuant to Rule 405 of Regulation S-T (§ 232.405 of this chapter) during the preceding 12 months (or for such shorter period that the registrant was required to submit and post such files). Yes No
Indicate by check mark if disclosure of delinquent filers pursuant to Item 405 of Regulation S-K (§ 229.405 of this chapter) is not contained herein, and will not be contained, to the best of registrant’s knowledge, in definitive proxy or information statements incorporated by reference in Part III of this Form 10-K or any amendment to this Form 10-K.
Indicate by check mark whether the registrant is a large accelerated filer, an accelerated filer, a non-accelerated filer or a smaller reporting company. See the definitions of “large accelerated filer,” “accelerated filer,” and “smaller reporting company” in Rule 12b-2 of the Exchange Act.
Large accelerated filer Accelerated filer
Non-accelerated filer Smaller reporting company Indicate by check mark whether the registrant is a shell company (as defined in Rule 12b-2 of the Exchange Act). Yes No The Company’s common stock is listed on the New York Stock Exchange under the symbol “MRC”. The aggregate market value of
voting common stock held by non-affiliates was $975 million as of the close of trading as reported on the New York Stock Exchange on June 29, 2012. There were 101,563,237 shares of the registrant’s common stock, par value $0.01 per share, issued and outstanding as of December 31, 2012.
DOCUMENTS INCORPORATED BY REFERENCE Portions of the registrant’s proxy statement relating to the 2013 Annual Meeting of Shareholders, to be filed within 120 days of the end of the fiscal year covered by this report, are incorporated by reference into Part III of this Annual Report on Form 10-K.

TABLE OF CONTENTS
Page
PART I
ITEM 1. BUSINESS .............................................................................................................................................................. 1
ITEM 1A. RISK FACTORS .................................................................................................................................................... 7
ITEM 1B. UNRESOLVED STAFF COMMENTS ............................................................................................................... 19
ITEM 2. PROPERTIES ........................................................................................................................................................ 19
ITEM 3. LEGAL PROCEEDINGS ..................................................................................................................................... 19
ITEM 4. MINE SAFETY DISCLOSURES ......................................................................................................................... 19
EXECUTIVE OFFICERS OF THE REGISTRANT .......................................................................................... 20
PART II
ITEM 5. MARKET FOR THE REGISTRANT’S COMMON EQUITY, RELATED STOCKHOLDER
MATTERS AND ISSUER PURCHASES OF EQUITY SECURITIES ............................................................ 22
ITEM 6. SELECTED FINANCIAL DATA ........................................................................................................................ 24
ITEM 7. MANAGEMENT’S DISCUSSION AND ANALYSIS OF FINANCIAL CONDITION AND RESULTS OF OPERATIONS ................................................................................................................................................. 29
ITEM 7A. QUANTITATIVE AND QUALITATIVE DISCLOSURES ABOUT MARKET RISK .................................. 48
ITEM 8. FINANCIAL STATEMENTS ............................................................................................................................... 49
ITEM 9. CHANGES IN AND DISAGREEMENTS WITH ACCOUNTANTS ON ACCOUNTING AND FINANCIAL DISCLOSURE ................................................................................................................................ 50
ITEM 9A. CONTROLS AND PROCEDURES ..................................................................................................................... 50
ITEM 9B. OTHER INFORMATION..................................................................................................................................... 50
PART III
ITEM 10. DIRECTORS, EXECUTIVE OFFICERS AND CORPORATE GOVERNANCE .......................................... 51
ITEM 11. EXECUTIVE COMPENSATION ........................................................................................................................ 51
ITEM 12. SECURITY OWNERSHIP OF CERTAIN BENEFICIAL OWNERS AND MANAGEMENT AND RELATED STOCKHOLDER MATTERS ......................................................................................................... 52
ITEM 13. CERTAIN RELATIONSHIPS AND RELATED TRANSACTIONS, AND DIRECTOR INDEPENDENCE .................................................................................................................................................. 52
ITEM 14. PRINCIPAL ACCOUNTING FEES AND SERVICES ..................................................................................... 52
PART IV
ITEM 15. EXHIBITS AND FINANCIAL STATEMENT SCHEDULES .......................................................................... 53

1
PART I
Unless otherwise indicated or the context otherwise requires, all references to “our Company”, “MRC Global”, “MRC”, “we”, “us”, “our”, and the “registrant” refer to MRC Global Inc. and its consolidated subsidiaries.
ITEM 1. BUSINESS General We are the largest global industrial distributor of pipe, valves and fittings (“PVF”) and related products and services to the energy industry based on sales and hold a leading position in our industry across each of the upstream (exploration, production and extraction of underground oil and natural gas), midstream (gathering and transmission of oil and natural gas, natural gas utilities and the storage and distribution of oil and natural gas) and downstream (crude oil refining, petrochemical processing and general industrials) sectors. We offer more than 175,000 SKUs, including an extensive array of PVF, oilfield supply, automation, instrumentation and other general and specialty industry supply products from our over 18,000 suppliers. We operate in three segments consisting of our U.S., Canadian, and International operations. Through our U.S., Canadian and International segments, we serve our more than 18,000 customers through over 400 service locations throughout North America, Europe, Asia and Australasia. We are diversified by geography, the industry sectors we serve and the products we sell.
Our PVF and oilfield supplies are used in mission critical process applications that require us to provide a high degree of product knowledge, technical expertise and comprehensive value added services to our customers. We seek to provide best-in-class service and a one-stop shop for our customers by satisfying the most complex, multi-site needs of many of the largest companies in the energy and industrial sectors as their primary PVF supplier. We provide services such as product testing, manufacturer assessments, multiple daily deliveries, volume purchasing, inventory and zone store management and warehousing, technical support, just-in-time delivery, truck stocking, order consolidation, product tagging and system interfaces customized to customer and supplier specifications for tracking and replenishing inventory, which we believe result in deeply integrated customer relationships. We believe the critical role we play in our customers’ supply chain, together with our extensive product offering, broad global presence, customer-linked scalable information systems and efficient distribution capabilities, serve to solidify our long-standing customer relationships and drive our growth. As a result, we have an average relationship of over 20 years with our largest 25 customers.
We have benefited historically from several growth trends within the energy industry, including high levels of customer expansion and maintenance expenditures. Although these trends were offset in 2009 and 2010 due to adverse economic conditions, we believe that growth in PVF and industrial supply spending within the energy industry is likely to continue. Several factors have driven the long-term growth in spending, including underinvestment in North American energy infrastructure, production and capacity constraints, and market expectations of future improvements in the oil, natural gas, refined products, petrochemical and other industrial sectors. In addition, the products we distribute are often used in extreme operating environments, leading to the need for a regular replacement cycle. Approximately 70% of our sales are attributable to multi-year maintenance, repair and operations (“MRO”) arrangements. Our average annual retention rate for these contracts since 2000 is 95%. We consider MRO arrangements to be normal, generally repetitive business that primarily addresses the recurring maintenance, repair or operational work to existing energy infrastructure. Project activities, including facility expansions, exploration or new construction projects, are more commonly associated with a customer’s capital expenditures budget. Such projects can be more sensitive to global oil and natural gas prices and general economic conditions. We mitigate our exposure to price volatility by limiting the length of any price-protected contracts, and as pricing continues to rebound, we believe that we have the ability to pass price increases on to the marketplace.
MRC Global Inc. was incorporated in Delaware on November 20, 2006. Our principal executive office is located at 2 Houston Center, 909 Fannin, Suite 3100, Houston, Texas 77010. Our telephone number is (877) 294-7574. Our website address is www.mrcglobal.com
Business Strategy
. Information contained on our website is expressly not incorporated by reference into this document.
Our goal is to grow our market position as an industrial distributor of PVF and related products to the energy industry. Our strategy is focused on pursuing growth by increasing market share and growing our business with current customers, expanding into new geographies and sectors, increasing recurring revenues through integrated supply and MRO business, capturing additional high growth project activity, continuing to increase our operational efficiency and making and integrating strategic acquisitions. We seek to extend our current MRO contracts and bundle certain products, most notably pipe, fittings, flanges and other products (“PFF”), into our International segment’s existing customer base and branch network. We also seek to opportunistically add other products and new suppliers, including alloy, chrome, stainless products, gaskets, seals, safety and other industrial supply products, into our existing North American platform. We will also look at future complementary distribution acquisitions that would supplement our PVF leadership position, and we will look at future “bolt-on” acquisitions that broaden our geographic footprint, increase international focus, or expand our product offering to our major customers.

2
Operations Our business is segregated into three geographical operating segments, our U.S. operations, our Canadian operations and our International operations. These segments are substantially similar, particularly within North America, and represent our business of providing PVF and related products and services to the energy and industrial industries, across each of the upstream, midstream and downstream sectors. Financial information regarding our reportable segments appears in “Item 7—Management’s Discussion and Analysis of Financial Condition and Results of Operations” and in Note 13 of the Notes to the Consolidated Financial Statements included in Item 8 of this Form 10-K. We have recast segment operating results for 2011 and 2010 to conform to certain organizational realignments in 2012.
Our U.S. segment represented approximately 76% of our consolidated revenues in 2012. We maintain distribution operations throughout the country with concentrations in the most active oil and natural gas regions. Our network is comprised of over 150 branch locations, 8 distribution centers, 12 valve automation service centers and over 95 third-party pipe yards.
Our Canadian segment represented approximately 14% of our consolidated revenues in 2012. Our distribution operations expand throughout the western part of Canada with concentrations in Alberta and western Saskatchewan. In Canada, we have over 40 branch locations, one distribution center and over 25 third-party pipe yards.
Our International segment represented approximately 10% of our consolidated revenues in 2012. This segment includes over 50 branch locations located throughout Europe, Asia and Australasia with four distribution centers in each of the United Kingdom, Singapore, the Netherlands and Australia. We also maintain 12 valve automation service centers in Europe, Asia and Australia as well as 10 pipe yards in Australia and the United Kingdom.
Products: We distribute a complete line of PVF products, primarily used in specialized applications in the energy infrastructure sector. The products we distribute are used in the construction, maintenance, repair and overhaul of equipment used in extreme operating conditions such as high pressure, high/low temperature, high corrosive and abrasive environments. We are required to carry significant amounts of inventory to meet the rapid delivery, often same day, requirements of our customers. The breadth and depth of our product offerings and our extensive global presence allow us to provide high levels of service to our customers. Due to our broad inventory coverage, we are able to fulfill more orders more quickly, including those with lower volume and specialty items, than we would be able to if we operated on a smaller scale or only at a local or regional level. Key product types are described below:
• Valves and Specialty Products. Products offered include ball, butterfly, gate, globe, check, needle and plug valves which are manufactured from cast steel, stainless/alloy steel, forged steel, carbon steel or cast and ductile iron. Valves are generally used in oilfield and industrial applications to control direction, velocity and pressure of fluids and gases within transmission networks. Specialty products include lined corrosion resistant piping systems, valve automation and top work components used for regulating flow and on/off service, and a wide range of steam and instrumentation products used in various process applications within our refinery, petrochemical and general industrial sectors.
• Carbon Steel Fittings and Flanges and Stainless Steel and Alloy Pipe and Fittings. Carbon steel fittings and flanges include carbon weld fittings, flanges and piping components used primarily to connect piping and valve systems for the transmission of various liquids and gases. These products are used across all the industries in which we operate. Stainless steel and alloy pipe and fittings include stainless, alloy and corrosion resistant pipe, tubing, fittings and flanges. These are used most often in the chemical, refining and power generation industries but are used across all of the sectors in which we operate. Alloy products are principally used in high-pressure, high-temperature and high-corrosion applications typically seen in process piping applications.
• Line Pipe. Carbon line pipe is typically used in high-yield, high-stress and abrasive applications such as the gathering and transmission of oil, natural gas and phosphates. Line pipe is part of our tubular product category.
• Oil Country Tubular Goods (“OCTG”). OCTG is part of our tubular product category, includes casing (used for production and to line the well bore) and tubing pipe (used to extract oil or natural gas from wells) and is either classified as carbon or alloy depending on the grade of material.
• Other. Other includes natural gas distribution products, oilfield supplies, and other industrial products such as mill and safety and electrical supplies. Natural gas distribution products include risers, meters, polyethylene pipe and fittings and various other components and industrial supplies used primarily in the distribution of natural gas to residential and commercial customers. We offer a comprehensive range of oilfield and industrial supplies and completion equipment, and products offered include high density polyethylene pipe and fittings, valves, well heads, pumping units and rods. Additionally, we can supply a wide range of specialized production equipment including meter runs, tanks and separators used in our upstream sector.

3
Services: We provide many of our customers with a comprehensive array of services including multiple deliveries each day, zone store management, valve tagging and significant system interfaces that directly tie the customer into our proprietary information systems. This allows us to interface with our customers’ IT systems and provide an integrated supply service. Such services strengthen our position with our customers as we become more integrated into the customer’s business and supply chain and are able to market a “total transaction value” solution rather than individual product prices.
Our comprehensive information systems, which provide for customer and supplier electronic integrations, information sharing and e-commerce applications, further strengthen our ability to provide high levels of service to our customers. In 2012, we processed over 1.6 million electronic data interface (“EDI”) customer transactions. Our highly specialized implementation group focuses on the integration of our information systems and implementation of improved business processes with those of a new customer during the initiation phase. By maintaining a specialized team, we are able to utilize best practices to implement our systems and processes, thereby providing solutions to customers in a more organized, efficient and effective manner. This approach is valuable to large, multi-location customers who have demanding service requirements.
As major integrated and large independent energy companies have implemented efficiency initiatives to focus on their core business, many of these companies have begun outsourcing certain of their procurement and inventory management requirements. In response to these initiatives and to satisfy customer service requirements, we offer integrated supply services to customers who wish to outsource all or a part of the administrative burden associated with sourcing PVF and other related products, and we also often have MRC employees on-site full-time at many customer locations. Our integrated supply group offers procurement-related services, physical warehousing services, product quality assurance and inventory ownership and analysis services.
Suppliers: We source the products we distribute from a global network of suppliers in 35 countries. Our suppliers benefit from access to our diversified customer base and, by consolidating customer orders, we benefit from stronger purchasing power and preferred vendor programs. Our purchases from our 25 largest suppliers in 2012 approximated 45% of our total purchases, with our single largest supplier constituting approximately 7%. We are the largest customer for many of our suppliers, and we source a significant majority of the products we distribute directly from the manufacturer. The remainder of the products we distribute are sourced from manufacturer representatives, trading companies and, in some instances, other distributors.
We believe our customers and suppliers recognize us as an industry leader in part due to the quality of products we supply and for the formal processes we use to evaluate vendor performance. This vendor assessment process is referred to as the MRC Supplier Registration Process, which involves employing individuals, certified by the International Registry of Certificated Auditors, who specialize in conducting on-site assessments of our manufacturers as well as monitoring and evaluating the quality of goods produced. The result of this process is the MRC approved manufacturer’s listing (“AML”). Products from the manufacturers on this list are supplied across many of the industries we support. Given that many of our largest customers, especially those in our downstream sector, maintain their own formal AML listing, we are recognized as an important source of information sharing with our key customers regarding the results of our on-site assessment. For this reason, together with our commitment to promote high quality products that bring the best overall value to our customers, we often become the preferred provider of AML products to these customers. Many of our customers regularly collaborate with us regarding specific manufacturer performance, our own experience with vendors’ products and the results of our on-site manufacturer assessments. The emphasis placed on the MRC AML by both our customers and suppliers helps secure our central and critical position in the global PVF supply chain.
We utilize a variety of freight carriers in addition to our corporate truck fleet to ensure timely and efficient delivery of our products. With respect to deliveries of products from us to our customers, or our outbound needs, we utilize both our corporate fleet and third-party transportation providers. We utilize third parties for approximately 22% of our outbound deliveries. With respect to shipments of products from suppliers to us, or our inbound needs, we principally use third-party carriers.
Sales and Marketing: We distribute our products to a wide variety of end-users and have direct sales into 44 countries around the world. Our broad distribution network and customer base allow us to capitalize on our extensive inventory offering. Local relationships, depth of inventory, service and timely delivery are critical to the sales process in the PVF distribution industry. Our sales efforts are customer and product driven and provide a system that is more responsive to changing customer and product needs than a traditional, fully centralized structure.
Our sales model applies a two-pronged approach to address both regional and national markets. Regional sales teams are based in our core geographic regions and are complemented by a global accounts sales team organized by sector or product expertise and focused on large regional, national or global customers. These sales teams are then supported by groups with additional specific service or product expertise, including integrated supply and implementation. Our overall sales force is then internally divided into outside and inside sales forces.

4
Our approximately 400 (as of December 31, 2012) account managers and outside sales representatives develop relationships with prospective and existing customers in an effort to better understand their needs and to increase the number of our products specified or approved by a given customer. Outside sales representatives may be branch outside sales representatives, focused on customer relationships in specific geographies, or technical outside sales representatives, who focus on specific products and provide detailed technical support to customers. Internationally, for valve sales, the majority of our sales force are qualified engineers who are able to meet complex customer requirements, select optimal solutions from a range of products to increase customers’ efficiency and lower total product lifecycle costs.
To address the needs of our customer base, our inside sales force of approximately 950 customer service representatives (as of December 31, 2012) is responsible for processing orders generated by new and existing customers as well as by our outside sales force. The customer service representatives develop order packages based on specific customer needs, interface with manufacturers to determine product availability, ensure on-time delivery and establish pricing of materials and services based on guidelines and predetermined metrics that management establishes.
Seasonality: Our business experiences mild seasonal effects as demand for the products we distribute is generally higher during the months of August, September and October. Demand for the products we distribute during the months of November and December and early in the year generally tends to be lower due to a lower level of activity near the end of the calendar year in the industry sectors we serve and due to winter weather disruptions. In addition, certain exploration and production (“E&P”) activities, primarily in Canada, typically experience a springtime reduction due to seasonal thaws and regulatory restrictions, limiting the ability of drilling rigs to operate effectively during these periods.
Customers: Our principal customers are companies active in the upstream, midstream and downstream sectors of the energy industry as well as in other industrial and energy sectors. Due to the demanding operating conditions in the energy industry, high costs and safety risks associated with equipment failure, customers prefer highly reliable products and vendors with established qualifications, reputation and experience. As our PVF products typically are mission critical and represent a fraction of the total cost of a given project, our customers often place a premium on service and high reliability given the high cost to them of maintenance or new project delays. We strive to build long-term relationships with our customers by maintaining our reputation as a supplier of high-quality, efficient and reliable products and value-added services and solutions.
We have a diverse customer base of over 18,000 active customers. We are not dependent on any one customer or group of customers. A majority of our customers are offered terms of net 30 days (payment is due within 30 days of the date of the invoice). Customers generally have the right to return products we have sold, subject to certain conditions and limitations, although returns have historically been immaterial to our sales. For the years ended December 31, 2012 and 2011, our 25 largest customers represented approximately half of our total sales. For many of our largest customers, we are often their sole or primary PVF provider by sector or geography, their largest or second largest supplier in aggregate or, in certain instances, the sole provider for their upstream, midstream and downstream procurement needs. We believe that many customers for which we are not the exclusive or comprehensive U.S. sole source PVF provider will continue to reduce their number of suppliers in an effort to reduce costs and administrative burdens and focus on their core operations. As such, we believe these customers will seek to select PVF distributors with the most extensive product offering and broadest geographic presence. Furthermore, we believe our business will benefit as companies in the energy industry continue to consolidate and the larger, resulting companies look to larger distributors such as ourselves as their sole or primary source PVF provider.
Backlog: Backlog is determined by the amount of unshipped third-party customer orders, which may be revised or cancelled by the customer in certain instances. Backlog is generally attributable to our project contract activity, as we generally supply products for MRO contracts within a short period of time from order. There can be no assurance that the backlog amounts will be ultimately realized as revenue, or that the Company will earn a profit on the backlog of orders. Our backlog at December 31, 2012 was $664 million including $455 million, $62 million and $147 million in our US, Canadian and International segments, respectively. Our backlog at December 31, 2011 was $817 million including $631 million, $60 million and $126 million in our US, Canadian and International segments, respectively. The reduction in the U.S. 2012 backlog is primarily from repositioning the Company away from certain OCTG drilling programs.
Competition: We are the largest PVF distributor to the energy industry based on sales. The broad PVF distribution industry is fragmented and includes large, nationally recognized distributors, major regional distributors and many smaller local distributors. The principal methods of competition include offering prompt local service, fulfillment capability, breadth of product and service offerings, price and total costs to the customer. Our competitors include nationally recognized PVF distributors, such as National Oilwell Varco, Inc. and Ferguson Enterprises (a subsidiary of Wolseley, plc), several large regional or product-specific competitors and many local, family-owned PVF distributors.

5
Employees: As of December 31, 2012, we had approximately 4,780 employees of which 80 employees belong to a union and are covered by collective bargaining agreements. We also had 30 employees in Australia that are not members of a union but are covered by union negotiated agreements. We consider our relationships with our employees to be good.
For a breakdown of our annual revenues by geography, see “Note 13—Segment, Geographic and Product Line Information” to the audited consolidated financial statements as of December 31, 2012.
Environmental Matters We are subject to a variety of federal, state, local, foreign and provincial environmental, health and safety laws, regulations and permitting requirements, including those governing the discharge of pollutants or hazardous substances into the air, soil or water, the generation, handling, use, management, storage and disposal of, or exposure to, hazardous substances and wastes, the responsibility to investigate, remediate, monitor and clean up contamination and occupational health and safety. Fines and penalties may be imposed for non-compliance with applicable environmental, health and safety requirements and the failure to have or to comply with the terms and conditions of required permits. Historically, the costs to comply with environmental and health and safety requirements have not been material to our financial position, results of operations or cash flows. We are not aware of any pending environmental compliance or remediation matters that, in the opinion of management, are reasonably likely to have a material effect on our business, financial position or results of operations or cash flows. However, the failure by us to comply with applicable environmental, health and safety requirements could result in fines, penalties, enforcement actions, employee, neighbor or other third-party claims for property damage and personal injury, requirements to clean up property or to pay for the costs of cleanup, or regulatory or judicial orders requiring corrective measures, including the installation of pollution control equipment or remedial actions.
Under certain laws and regulations, such as the U.S. federal Superfund law or its foreign equivalents, the obligation to investigate, remediate, monitor and clean up contamination at a facility may be imposed on current and former owners, lessees or operators or on persons who may have sent waste to that facility for disposal. Liability under these laws and regulations may be imposed without regard to fault or to the legality of the activities giving rise to the contamination. Although we are not aware of any active litigation against us under the U.S. federal Superfund law or its state or foreign equivalents, contamination has been identified at several of our current and former facilities, and we have incurred and will continue to incur costs to investigate, remediate, monitor and clean up these conditions. Moreover, we may incur liabilities in connection with environmental conditions currently unknown to us relating to our prior, existing or future owned or leased sites or operations or those of predecessor companies whose liabilities we may have assumed or acquired. We believe that indemnities contained in certain of our acquisition agreements may cover certain environmental conditions existing at the time of the acquisition subject to certain terms, limitations and conditions. However, if these indemnification provisions terminate or if the indemnifying parties do not fulfill their indemnification obligations, we may be subject to liability with respect to the environmental matters that those indemnification provisions address.
In addition, environmental, health and safety laws and regulations applicable to our business and the business of our customers, including laws regulating the energy industry, and the interpretation or enforcement of these laws and regulations, are constantly evolving and it is impossible to predict accurately the effect that changes in these laws and regulations, or their interpretation or enforcement, may have upon our business, financial condition or results of operations. Should environmental laws and regulations, or their interpretation or enforcement, become more stringent, our costs, or the costs of our customers, could increase, which may have a material adverse effect on our business, financial position, results of operations or cash flows.
In particular, legislation and regulations limiting emissions of greenhouse gases, including carbon dioxide associated with the burning of fossil fuels, are at various stages of consideration and implementation at the international, national, regional and state levels. In 2005, the Kyoto Protocol to the 1992 United Nations Framework Convention on Climate Change, which established a binding set of emission targets for greenhouse gases, became binding on the countries that ratified it. Attention is now focused on development of a post-2012 international policy framework to guide international action to address climate change when the Kyoto Protocol expired in 2012. Certain states and regions have adopted or are considering legislation or regulation imposing overall caps or taxes on greenhouse gas emissions from certain sectors or facility categories or mandating the increased use of electricity from renewable energy sources. Similar legislation has been proposed at the federal level. In addition, the EPA has implemented regulations that require permits for and reductions in greenhouse gas emissions for certain categories of facilities, the most recent of which became effective in August 2012. Pursuant to the terms of a settlement agreement, the EPA is in the process of finalizing greenhouse gas emissions standards, known as New Source Performance Standards (“NSPS”), for new power plants and plans to issue NSPS for greenhouse gas emissions for oil refineries in the future. NSPS for other oil refinery emissions were issued by the EPA pursuant to the settlement agreement in September 2012 and became effective in November 2012. The settlement agreement also calls for NSPS for greenhouse gas emissions from existing power plants; however, the EPA has not proposed such NSPS to date. These laws and regulations could negatively impact the market for the products we distribute and, consequently, our business.
In addition, federal, state, local, foreign and provincial laws, regulations and permitting requirements have been adopted or are being considered that could impose more stringent permitting, disclosure, wastewater and other waste disposal and well construction and testing requirements on hydraulic fracturing, a practice involving the injection of water containing certain other substances into rock

6
formations (after perforating the formation with explosive charges) to stimulate production of hydrocarbons, particularly natural gas, from shale basin regions. Other states and the federal government are considering regulating this practice. These regulations include a variety of well construction, set back, wastewater disposal, emissions, baseline sampling, operational and disclosure requirements limiting how fracturing can be performed and requiring various degrees of disclosures regarding the contents of chemicals injected into the rock formations, as well as moratoria on all hydraulic fracturing activity. Any increased federal, regional or state regulation of hydraulic fracturing could reduce the demand for our products in these regions.
Exchange Rate Information In this report, unless otherwise indicated, foreign currency amounts are converted into U.S. dollar amounts at the exchange rates in effect on December 31, 2012 and 2011 for balance sheet figures. Income statement figures are converted on a monthly basis, using each month’s average conversion rate.
Available Information Our website is located at www.mrcglobal.com
. We make available free of charge on or through our internet website our annual report on Form 10-K, our quarterly reports on Form 10-Q, current reports on Form 8-K and amendments to those reports filed or furnished pursuant to Section 13(a) or 15(d) of the Securities Exchange Act of 1934 as soon as reasonably practicable after we electronically file such material with, or furnish it to, the SEC.

7
1A. RISK FACTORS You should carefully consider the following risk factors as well as the other information contained in this Annual Report on Form 10-K. If one or more of these risks or uncertainties actually occurs, they could materially and adversely affect our business, financial condition and operating results. In this Annual Report on Form 10-K, unless the context expressly requires a different reading, when we state that a factor could “adversely affect us”, have a “material adverse effect”, “adversely affect our business” and similar expressions, we mean that the factor could materially and adversely affect our business, financial condition and operating results and cash flows. Information contained in this section may be considered “forward-looking statements”. See “Item 7—Management’s Discussion and Analysis of Financial Condition and Results of Operations—Cautionary Note Regarding Forward-Looking Statements” below for a discussion of certain qualifications regarding such statements.
Risks Related to Our Business Decreased capital and other expenditures in the energy industry, which can result from decreased oil and natural gas prices, among other things, can adversely impact our customers’ demand for our products and our revenue. A large portion of our revenue depends upon the level of capital and operating expenditures in the oil and natural gas industry, including capital and other expenditures in connection with exploration, drilling, production, gathering, transportation, refining and processing operations. Demand for the products we distribute and services we provide is particularly sensitive to the level of exploration, development and production activity of, and the corresponding capital and other expenditures by, oil and natural gas companies. A material decline in oil or natural gas prices could depress levels of exploration, development and production activity and, therefore, could lead to a decrease in our customers’ capital and other expenditures. If our customers’ expenditures decline, our business will suffer.
Volatile oil and gas prices affect demand for our products. Prices for oil and natural gas are subject to large fluctuations in response to relatively minor changes in the supply of and demand for oil and natural gas, market uncertainty and a variety of other factors that are beyond our control. Any sustained decrease in capital expenditures in the oil and natural gas industry could have a material adverse effect on us.
Many factors affect the supply of and demand for energy and, therefore, influence oil and natural gas prices, including: • the level of domestic and worldwide oil and natural gas production and inventories; • the level of drilling activity and the availability of attractive oil and natural gas field prospects, which governmental
actions may affect, such as regulatory actions or legislation, or other restrictions on drilling, including those related to environmental concerns (e.g., a temporary moratorium on deepwater drilling in the Gulf of Mexico following a rig accident or oil spill);
• the discovery rate of new oil and natural gas reserves and the expected cost of developing new reserves; • the actual cost of finding and producing oil and natural gas; • depletion rates; • domestic and worldwide refinery overcapacity or undercapacity and utilization rates; • the availability of transportation infrastructure and refining capacity; • increases in the cost of products and services that the oil and gas industry uses, such as those that we provide, which may
result from increases in the cost of raw materials such as steel; • shifts in end-customer preferences toward fuel efficiency and the use of natural gas; • the economic or political attractiveness of alternative fuels, such as coal, hydrocarbon, wind, solar energy and biomass-
based fuels; • increases in oil and natural gas prices or historically high oil and natural gas prices, which could lower demand for oil and
natural gas products; • worldwide economic activity including growth in non-OECD countries, including China and India; • interest rates and the cost of capital; • national government policies, including government policies that could nationalize or expropriate oil and natural gas
exploration, production, refining or transportation assets; • the ability of the Organization of Petroleum Exporting Countries (“OPEC”) to set and maintain production levels and
prices for oil; • the impact of armed hostilities, or the threat or perception of armed hostilities;
8
• environmental regulation; • technological advances; • global weather conditions and natural disasters; • currency fluctuations; and • tax policies.
Oil and natural gas prices have been and are expected to remain volatile. This volatility has historically caused oil and natural gas companies to change their strategies and expenditure levels from year to year. We have experienced in the past, and we will likely experience in the future, significant fluctuations in operating results based on these changes. In particular, volatility in the oil and natural gas sectors could adversely affect our business.
General economic conditions may adversely affect our business. U.S. and global general economic conditions affect many aspects of our business, including demand for the products we distribute and the pricing and availability of supplies. General economic conditions and predictions regarding future economic conditions also affect our forecasts. A decrease in demand for the products we distribute or other adverse effects resulting from an economic downturn may cause us to fail to achieve our anticipated financial results. General economic factors beyond our control that affect our business and customers include interest rates, recession, inflation, deflation, customer credit availability, consumer credit availability, consumer debt levels, performance of housing markets, energy costs, tax rates and policy, unemployment rates, commencement or escalation of war or hostilities, the threat or possibility of war, terrorism or other global or national unrest, political or financial instability, and other matters that influence our customers’ spending. Increasing volatility in financial markets may cause these factors to change with a greater degree of frequency or increase in magnitude. In addition, worldwide economic conditions, including those associated with the current European sovereign debt crisis, could have an adverse effect on our business, prospects, operating results, financial condition, and cash flows going forward. Continued adverse economic conditions would have an adverse effect on us.
We may be unable to compete successfully with other companies in our industry. We sell products and services in very competitive markets. In some cases, we compete with large companies with substantial resources. In other cases, we compete with smaller regional players that may increasingly be willing to provide similar products and services at lower prices. Competitive actions, such as price reductions, consolidation in the industry, improved delivery and other actions, could adversely affect our revenue and earnings. We could experience a material adverse effect to the extent that our competitors are successful in reducing our customers’ purchases of products and services from us. Competition could also cause us to lower our prices, which could reduce our margins and profitability. Furthermore, consolidation in our industry could heighten the impacts of the competition on our business and results of operations discussed above, particularly if consolidation results in competitors with stronger financial and strategic resources, and could also result in increases to the prices we are required to pay for acquisitions we may make in the future.
Demand for the products we distribute could decrease if the manufacturers of those products were to sell a substantial amount of goods directly to end users in the sectors we serve. Historically, users of PVF and related products have purchased certain amounts of these products through distributors and not directly from manufacturers. If customers were to purchase the products that we sell directly from manufacturers, or if manufacturers sought to increase their efforts to sell directly to end users, we could experience a significant decrease in profitability. These or other developments that remove us from, or limit our role in, the distribution chain, may harm our competitive position in the marketplace and reduce our sales and earnings and adversely affect our business.
We may experience unexpected supply shortages. We distribute products from a wide variety of manufacturers and suppliers. Nevertheless, in the future we may have difficulty obtaining the products we need from suppliers and manufacturers as a result of unexpected demand or production difficulties that might extend lead times. Also, products may not be available to us in quantities sufficient to meet our customer demand. Our inability to obtain products from suppliers and manufacturers in sufficient quantities, or at all, could adversely affect our product offerings and our business.
We may experience cost increases from suppliers, which we may be unable to pass on to our customers. In the future, we may face supply cost increases due to, among other things, unexpected increases in demand for supplies, decreases in production of supplies or increases in the cost of raw materials or transportation. Any inability to pass supply price increases on to our customers could have a material adverse effect on us. For example, we may be unable to pass increased supply costs on to our customers because significant amounts of our sales are derived from stocking program arrangements, contracts and MRO

9
arrangements, which provide our customers time limited price protection, which may obligate us to sell products at a set price for a specific period. In addition, if supply costs increase, our customers may elect to purchase smaller amounts of products or may purchase products from other distributors. While we may be able to work with our customers to reduce the effects of unforeseen price increases because of our relationships with them, we may not be able to reduce the effects of the cost increases. In addition, to the extent that competition leads to reduced purchases of products or services from us or a reduction of our prices, and these reductions occur concurrently with increases in the prices for selected commodities which we use in our operations, including steel, nickel and molybdenum, the adverse effects described above would likely be exacerbated and could result in a prolonged downturn in profitability.
We do not have contracts with most of our suppliers. The loss of a significant supplier would require us to rely more heavily on our other existing suppliers or to develop relationships with new suppliers. Such a loss may have an adverse effect on our product offerings and our business. Given the nature of our business, and consistent with industry practice, we do not have contracts with most of our suppliers. We generally make our purchases through purchase orders. Therefore, most of our suppliers have the ability to terminate their relationships with us at any time. Approximately 45% of our total purchases during the year ended December 31, 2012 were from our 25 largest suppliers. Although we believe there are numerous manufacturers with the capacity to supply the products we distribute, the loss of one or more of our major suppliers could have an adverse effect on our product offerings and our business. Such a loss would require us to rely more heavily on our other existing suppliers or develop relationships with new suppliers, which may cause us to pay higher prices for products due to, among other things, a loss of volume discount benefits currently obtained from our major suppliers.
Price reductions by suppliers of products that we sell could cause the value of our inventory to decline. Also, these price reductions could cause our customers to demand lower sales prices for these products, possibly decreasing our margins and profitability on sales to the extent that we purchased our inventory of these products at the higher prices prior to supplier price reductions. The value of our inventory could decline as a result of manufacturer price reductions with respect to products that we sell. There is no assurance that a substantial decline in product prices would not result in a write-down of our inventory value. Such a write-down could have an adverse effect on our financial condition.
Also, decreases in the market prices of products that we sell could cause customers to demand lower sales prices from us. These price reductions could reduce our margins and profitability on sales with respect to the lower-priced products. Reductions in our margins and profitability on sales could have a material adverse effect on us.
A substantial decrease in the price of steel could significantly lower our gross profit or cash flow. We distribute many products manufactured from steel. As a result, the price and supply of steel can affect our business and, in particular, our tubular product category. When steel prices are lower, the prices that we charge customers for products may decline, which affects our gross profit and cash flow. At times pricing and availability of steel can be volatile due to numerous factors beyond our control, including general domestic and international economic conditions, labor costs, sales levels, competition, consolidation of steel producers, fluctuations in and the costs of raw materials necessary to produce steel, steel manufacturers’ plant utilization levels and capacities, import duties and tariffs and currency exchange rates. Increases in manufacturing capacity for the tubular products could put pressure on the prices we receive for our tubular products. When steel prices decline, customer demands for lower prices and our competitors’ responses to those demands could result in lower sales prices and, consequently, lower gross profit and cash flow.
If steel prices rise, we may be unable to pass along the cost increases to our customers. We maintain inventories of steel products to accommodate the lead time requirements of our customers. Accordingly, we purchase steel products in an effort to maintain our inventory at levels that we believe to be appropriate to satisfy the anticipated needs of our customers based upon historic buying practices, contracts with customers and market conditions. Our commitments to purchase steel products are generally at prevailing market prices in effect at the time we place our orders. If steel prices increase between the time we order steel products and the time of delivery of the products to us, our suppliers may impose surcharges that require us to pay for increases in steel prices during the period. Demand for the products we distribute, the actions of our competitors and other factors will influence whether we will be able to pass on steel cost increases and surcharges to our customers, and we may be unsuccessful in doing so.

10
We do not have long-term contracts or agreements with many of our customers. The contracts and agreements that we do have generally do not commit our customers to any minimum purchase volume. The loss of a significant customer may have a material adverse effect on us. Given the nature of our business, and consistent with industry practice, we do not have long-term contracts with many of our customers. In addition, our contracts, including our MRO contracts, generally do not commit our customers to any minimum purchase volume. Therefore, a significant number of our customers, including our MRO customers, may terminate their relationships with us or reduce their purchasing volume at any time. Furthermore, the long-term customer contracts that we do have are generally terminable without cause on short notice. Our 25 largest customers represented approximately half of our sales for the year ended December 31, 2012. The products that we may sell to any particular customer depend in large part on the size of that customer’s capital expenditure budget in a particular year and on the results of competitive bids for major projects. Consequently, a customer that accounts for a significant portion of our sales in one fiscal year may represent an immaterial portion of our sales in subsequent fiscal years. The loss of a significant customer, or a substantial decrease in a significant customer’s orders, may have an adverse effect on our sales and revenue.
In addition, we are subject to customer audit clauses in many of our multi-year contracts. If we are not able to provide the proper documentation or support for invoices per the contract terms, we may be subject to negotiated settlements with our major customers.
Changes in our customer and product mix could cause our gross profit percentage to fluctuate. From time to time, we may experience changes in our customer mix or in our product mix. Changes in our customer mix may result from geographic expansion, daily selling activities within current geographic markets and targeted selling activities to new customer segments. Changes in our product mix may result from marketing activities to existing customers and needs communicated to us from existing and prospective customers. If customers begin to require more lower-margin products from us and fewer higher-margin products, our business, results of operations and financial condition may suffer.
Customer credit risks could result in losses. The concentration of our customers in the energy industry may impact our overall exposure to credit risk as customers may be similarly affected by prolonged changes in economic and industry conditions. Further, laws in some jurisdictions in which we operate could make collection difficult or time consuming. We perform ongoing credit evaluations of our customers and do not generally require collateral in support of our trade receivables. While we maintain reserves for expected credit losses, we cannot assure these reserves will be sufficient to meet write-offs of uncollectible receivables or that our losses from such receivables will be consistent with our expectations.
We may be unable to successfully execute or effectively integrate acquisitions. One of our key operating strategies is to selectively pursue acquisitions, including large scale acquisitions, to continue to grow and increase profitability. However, acquisitions, particularly of a significant scale, involve numerous risks and uncertainties, including intense competition for suitable acquisition targets, the potential unavailability of financial resources necessary to consummate acquisitions in the future, increased leverage due to additional debt financing that may be required to complete an acquisition, dilution of our stockholders’ net current book value per share if we issue additional equity securities to finance an acquisition, difficulties in identifying suitable acquisition targets or in completing any transactions identified on sufficiently favorable terms, assumption of undisclosed or unknown liabilities and the need to obtain regulatory or other governmental approvals that may be necessary to complete acquisitions. In addition, any future acquisitions may entail significant transaction costs and risks associated with entry into new markets.
Even when acquisitions are completed, integration of acquired entities can involve significant difficulties, such as: • failure to achieve cost savings or other financial or operating objectives with respect to an acquisition; • strain on the operational and managerial controls and procedures of our business, and the need to modify systems or to
add management resources; • difficulties in the integration and retention of customers or personnel and the integration and effective deployment of
operations or technologies; • amortization of acquired assets, which would reduce future reported earnings; • possible adverse short-term effects on our cash flows or operating results; • diversion of management’s attention from the ongoing operations of our business; • integrating personnel with diverse backgrounds and organizational cultures;

11
• coordinating sales and marketing functions; • failure to obtain and retain key personnel of an acquired business; and • assumption of known or unknown material liabilities or regulatory non-compliance issues.
Failure to manage these acquisition growth risks could have an adverse effect on us.
Our significant indebtedness may affect our ability to operate our business, and this could have a material adverse effect on us. We have now and will likely continue to have a significant amount of indebtedness. As of December 31, 2012, we had total debt outstanding of $1,256.6 million, borrowing availability of $429.6 million under our credit facilities and total liquidity (borrowing capacity plus cash on hand) of $466.7 million. We may incur significant additional indebtedness in the future. If new indebtedness is added to our current indebtedness, the risks described below could increase. Our significant level of indebtedness could have important consequences, such as:
• limiting our ability to obtain additional financing to fund our working capital, acquisitions, expenditures, debt service requirements or other general corporate purposes;
• limiting our ability to use operating cash flow in other areas of our business because we must dedicate a substantial portion of these funds to service debt;
• limiting our ability to compete with other companies who are not as highly leveraged; • subjecting us to restrictive financial and operating covenants in the agreements governing our and our subsidiaries’ long-
term indebtedness; • exposing us to potential events of default (if not cured or waived) under financial and operating covenants contained in
our or our subsidiaries’ debt instruments that could have a material adverse effect on our business, results of operations and financial condition;
• increasing our vulnerability to a downturn in general economic conditions or in pricing of our products; and • limiting our ability to react to changing market conditions in our industry and in our customers’ industries.
In addition, borrowings under our credit facilities bear interest at variable rates. If market interest rates increase, the variable-rate debt will create higher debt service requirements, which could adversely affect our cash flow. Our interest expense for the year ended December 31, 2012 was $112.5 million.
Our ability to make scheduled debt payments, to refinance our obligations with respect to our indebtedness and to fund capital and non-capital expenditures necessary to maintain the condition of our operating assets, properties and systems software, as well as to provide capacity for the growth of our business, depends on our financial and operating performance, which, in turn, is subject to prevailing economic conditions and financial, business, competitive, legal and other factors. Our business may not generate sufficient cash flow from operations, and future borrowings may not be available to us under our credit facilities in an amount sufficient to enable us to pay our indebtedness or to fund our other liquidity needs. We may seek to sell assets to fund our liquidity needs but may not be able to do so. We may also need to refinance all or a portion of our indebtedness on or before maturity. We may not be able to refinance any of our indebtedness on commercially reasonable terms or at all.
In addition, we are and will be subject to covenants contained in agreements governing our present and future indebtedness. These covenants include and will likely include restrictions on:
• investments; • prepayment of certain indebtedness; • the granting of liens; • the incurrence of additional indebtedness; • asset sales; • the making of fundamental changes; • transactions with affiliates; and • the payment of dividends.

12
In addition, any defaults under our credit facilities, including our global asset-based lending facility (“Global ABL Facility”) and our $650 million term loan (“Term Loan”) or our other debt could trigger cross defaults under other or future credit agreements and may permit acceleration of our other indebtedness. If our indebtedness is accelerated, we cannot be certain that we will have sufficient funds available to pay the accelerated indebtedness or that we will have the ability to refinance the accelerated indebtedness on terms favorable to us or at all. For a description of our credit facilities and indebtedness, see “Item 7—Management’s Discussion and Analysis of Financial Condition and Results of Operations—Liquidity and Capital Resources”.
We are a holding company and depend upon our subsidiaries for our cash flow. We are a holding company. Our subsidiaries conduct all of our operations and own substantially all of our assets. Consequently, our cash flow and our ability to meet our obligations or to pay dividends or make other distributions in the future will depend upon the cash flow of our subsidiaries and our subsidiaries’ payment of funds to us in the form of dividends, tax sharing payments or otherwise. In addition, McJunkin Red Man Corporation, our direct subsidiary and the primary obligor under our Global ABL Facility and our Term Loan, is also dependent to a significant extent on the cash flow of its subsidiaries to meet its debt service obligations. The ability of our subsidiaries to make any payments to us will depend on their earnings, the terms of their current and future indebtedness, tax considerations and legal and contractual restrictions on the ability to make distributions. In particular, our subsidiaries’ credit facilities currently impose significant limitations on the ability of our subsidiaries to make distributions to us and consequently our ability to pay dividends to our stockholders. Subject to limitations in our credit facilities, our subsidiaries may also enter into additional agreements that contain covenants prohibiting them from distributing or advancing funds or transferring assets to us under certain circumstances, including to pay dividends. Our subsidiaries are separate and distinct legal entities. Any right that we have to receive any assets of or distributions from any of our subsidiaries upon the bankruptcy, dissolution, liquidation or reorganization, or to realize proceeds from the sale of their assets, will be junior to the claims of that subsidiary’s creditors, including trade creditors and holders of debt that the subsidiary issued.
Changes in our credit profile may affect our relationship with our suppliers, which could have a material adverse effect on our liquidity. Changes in our credit profile may affect the way our suppliers view our ability to make payments and may induce them to shorten the payment terms of their invoices, particularly given our high level of outstanding indebtedness. Given the large dollar amounts and volume of our purchases from suppliers, a change in payment terms may have a material adverse effect on our liquidity and our ability to make payments to our suppliers and, consequently, may have a material adverse effect on us.
If tariffs and duties on imports into the U.S. of line pipe, OCTG or certain of the other products that we sell are lifted, we could have too many of these products in inventory competing against less expensive imports. U.S. law currently imposes tariffs and duties on imports from certain foreign countries of line pipe and OCTG and, to a lesser extent, on imports of certain other products that we sell. If these tariffs and duties are lifted or reduced or if the level of these imported products otherwise increases, and our U.S. customers accept these imported products, we could be materially and adversely affected to the extent that we would then have higher-cost products in our inventory or increased supplies of these products drive down prices and margins. If prices of these products were to decrease significantly, we might not be able to profitably sell these products, and the value of our inventory would decline. In addition, significant price decreases could result in a significantly longer holding period for some of our inventory.
We are subject to strict environmental, health and safety laws and regulations that may lead to significant liabilities and negatively impact the demand for our products. We are subject to a variety of federal, state, local, foreign and provincial environmental, health and safety laws; regulations and permitting requirements, including those governing the discharge of pollutants or hazardous substances into the air, soil or water, the generation, handling, use, management, storage and disposal of, or exposure to, hazardous substances and wastes, the responsibility to investigate and clean up contamination and occupational health and safety. Regulations and courts may impose fines and penalties for non-compliance with applicable environmental, health and safety requirements and the failure to have or to comply with the terms and conditions of required permits. Our failure to comply with applicable environmental, health and safety requirements could result in fines, penalties, enforcement actions, third-party claims for property damage and personal injury, requirements to clean up property or to pay for the costs of cleanup or regulatory or judicial orders requiring corrective measures, including the installation of pollution control equipment or remedial actions. Certain laws and regulations, such as the Comprehensive Environmental Response, Compensation and Liability Act (“CERCLA” or the “U.S. federal Superfund law”) or its state and foreign equivalents, may impose the obligation to investigate and remediate contamination at a facility on current and former owners or operators or on persons who may have sent waste to that facility for disposal. These laws and regulations may impose liability without regard to fault or to the legality of the activities giving rise to the

13
contamination. Although we are not aware of any active litigation against us under the U.S. federal Superfund law or its state or foreign equivalents, contamination has been identified at several of our current and former facilities, and we have incurred and will continue to incur costs to investigate and remediate these conditions. Moreover, we may incur liabilities in connection with environmental conditions currently unknown to us relating to our existing, prior or future owned or leased sites or operations or those of predecessor companies whose liabilities we may have assumed or acquired. We believe that indemnities contained in certain of our acquisition agreements may cover certain environmental conditions existing at the time of the acquisition, subject to certain terms, limitations and conditions. However, if these indemnification provisions terminate or if the indemnifying parties do not fulfill their indemnification obligations, we may be subject to liability with respect to the environmental matters that those indemnification provisions address. In addition, environmental, health and safety laws and regulations applicable to our business and the business of our customers, including laws regulating the energy industry, and the interpretation or enforcement of these laws and regulations, are constantly evolving. It is impossible to predict accurately the effect that changes in these laws and regulations, or their interpretation or enforcement, may have on us. Should environmental laws and regulations, or their interpretation or enforcement, become more stringent, our costs, or the costs of our customers, could increase, which may have a material adverse effect on us. In particular, legislation and regulations limiting emissions of greenhouse gases, including carbon dioxide associated with the burning of fossil fuels, are at various stages of consideration and implementation, at the international, national, regional and state levels. In 2005, the Kyoto Protocol to the 1992 United Nations Framework Convention on Climate Change, which established a binding set of emission targets for greenhouse gases, became binding on the countries that ratified it. Attention is now focused on the development of a post-2012 international policy framework to guide international action to address climate change when the Kyoto Protocol expired in 2012. Certain states and regions have adopted or are considering legislation or regulation imposing overall caps or taxes on greenhouse gas emissions from certain sectors or facility categories or mandating the increased use of electricity from renewable energy sources. Similar legislation has been proposed at the federal level. In addition, the U.S. Environmental Protection Agency (the “EPA”) has implemented regulations that require permits for and reductions in greenhouse gas emissions for certain categories of facilities, the most recent of which became effective in August 2012. Pursuant to the terms of a settlement agreement, the EPA is in the process of finalizing greenhouse gas emissions standards, known as NSPS, for new power plants and plans to issue NSPS for greenhouse gas emissions for oil refineries in the future. NSPS for other oil refinery emissions were issued by the EPA pursuant to the settlement agreement in September 2012 and became effective in November 2012. The settlement agreement also calls for NSPS for greenhouse gas emissions from existing power plants; however, the EPA has not proposed such NSPS to date. These laws and regulations could negatively impact the market for the products we distribute and, consequently, our business. In addition, federal, state, local, foreign and provincial laws, regulations and permitting requirements have been adopted or are being considered that could impose more stringent permitting, disclosure, wastewater disposal and well construction requirements on hydraulic fracturing, a practice involving the injection of water containing certain other substances into rock formations (after perforating the formation with explosive charges) to stimulate production of hydrocarbons, particularly natural gas, from shale basin regions. These effective and potential regulations include a variety of well construction, set back, wastewater disposal, emissions, baseline sampling, operational and disclosure requirements limiting how fracturing can be performed and requiring various degrees of disclosures regarding the contents of chemicals injected into the rock formations, as well as moratoria on all hydraulic fracturing activity. Any increased federal, regional or state regulation of hydraulic fracturing could significantly reduce the demand for our products in the high-growth shale regions of the U.S.
We may not have adequate insurance for potential liabilities, including liabilities arising from litigation. In the ordinary course of business, we have and in the future may become the subject of various claims, lawsuits and administrative proceedings seeking damages or other remedies concerning our commercial operations, the products we distribute, employees and other matters, including potential claims by individuals alleging exposure to hazardous materials as a result of the products we distribute or our operations. Some of these claims may relate to the activities of businesses that we have acquired, even though these activities may have occurred prior to our acquisition of the businesses. The products we distribute are sold primarily for use in the energy industry, which is subject to inherent risks that could result in death, personal injury, property damage, pollution, release of hazardous substances or loss of production. In addition, defects in the products we distribute could result in death, personal injury, property damage, pollution, release of hazardous substances or damage to equipment and facilities. Actual or claimed defects in the products we distribute may give rise to claims against us for losses and expose us to claims for damages. We maintain insurance to cover certain of our potential losses, and we are subject to various self-retentions, deductibles and caps under our insurance. It is possible, however, that judgments could be rendered against us in cases in which we would be uninsured and beyond the amounts that we currently have reserved or anticipate incurring for these matters. Even a partially uninsured claim, if successful and of significant size, could have a material adverse effect on us. Furthermore, we may not be able to continue to obtain insurance on commercially reasonable terms in the future, and we may incur losses from interruption of our business that exceed our insurance coverage. Finally, even in cases where we maintain insurance coverage, our insurers may raise various objections and exceptions to coverage that could make uncertain the timing and amount of any possible insurance recovery.

14
Due to our position as a distributor, we are subject to personal injury, product liability and environmental claims involving allegedly defective products. Our customers use certain of the products we distribute in potentially hazardous applications that can result in personal injury, product liability and environmental claims. A catastrophic occurrence at a location where end users use the products we distribute may result in us being named as a defendant in lawsuits asserting potentially large claims, even though we did not manufacture the products. Applicable law may render us liable for damages without regard to negligence or fault. In particular, certain environmental laws provide for joint and several and strict liability for remediation of spills and releases of hazardous substances. Certain of these risks are reduced by the fact that we are a distributor of products that third-party manufacturers produce, and, thus, in certain circumstances, we may have third-party warranty or other claims against the manufacturer of products alleged to have been defective. However, there is no assurance that these claims could fully protect us or that the manufacturer would be able financially to provide protection. There is no assurance that our insurance coverage will be adequate to cover the underlying claims. Our insurance does not provide coverage for all liabilities (including liability for certain events involving pollution or other environmental claims).
We are a defendant in asbestos-related lawsuits. Exposure to these and any future lawsuits could have a material adverse effect on us. We are a defendant in lawsuits involving approximately 885 claims, arising from exposure to asbestos-containing materials included in products that we distributed in the past. Each claim involves allegations of exposure to asbestos-containing materials by a single individual, his or her spouse or family members. The complaints in these lawsuits typically name many other defendants. In the majority of these lawsuits, little or no information is known regarding the nature of the plaintiffs’ alleged injuries or their connection with the products we distributed. Based on our experience with asbestos litigation to date, as well as the existence of certain insurance coverage, we do not believe that the outcome of these pending claims will have a material impact on us. However, the potential liability associated with asbestos claims is subject to many uncertainties, including negative trends with respect to settlement payments, dismissal rates and the types of medical conditions alleged in pending or future claims, negative developments in the claims pending against us, the current or future insolvency of co-defendants, adverse changes in relevant laws or the interpretation of those laws and the extent to which insurance will be available to pay for defense costs, judgments or settlements. Further, while we anticipate that additional claims will be filed against us in the future, we are unable to predict with any certainty the number, timing and magnitude of future claims. Therefore, we can give no assurance that pending or future asbestos litigation will not ultimately have a material adverse effect on us. See “Item 7—Management’s Discussion and Analysis of Financial Condition and Results of Operations—Contractual Obligations, Commitments and Contingencies—Legal Proceedings” and “Item 3—Legal Proceedings” for more information.
If we lose any of our key personnel, we may be unable to effectively manage our business or continue our growth. Our future performance depends to a significant degree upon the continued contributions of our management team and our ability to attract, hire, train and retain qualified managerial, sales and marketing personnel. In particular, we rely on our sales and marketing teams to create innovative ways to generate demand for the products we distribute. The loss or unavailability to us of any member of our management team or a key sales or marketing employee could have a material adverse effect on us to the extent we are unable to timely find adequate replacements. We face competition for these professionals from our competitors, our customers and other companies operating in our industry. We may be unsuccessful in attracting, hiring, training and retaining qualified personnel.
Interruptions in the proper functioning of our information systems could disrupt operations and cause increases in costs or decreases in revenues. The proper functioning of our information systems is critical to the successful operation of our business. We depend on our information management systems to process orders, track credit risk, manage inventory and monitor accounts receivable collections. Our information systems also allow us to efficiently purchase products from our vendors and ship products to our customers on a timely basis, maintain cost-effective operations and provide superior service to our customers. However, our information systems are vulnerable to natural disasters, power losses, telecommunication failures and other problems. If critical information systems fail or are otherwise unavailable, our ability to procure products to sell, process and ship customer orders, identify business opportunities, maintain proper levels of inventories, collect accounts receivable and pay accounts payable and expenses could be adversely affected. Our ability to integrate our systems with our customers’ systems would also be significantly affected. We maintain information systems controls designed to protect against, among other things, unauthorized program changes and unauthorized access to data on our information systems. If our information systems controls do not function properly, we face increased risks of unexpected errors and unreliable financial data or theft of proprietary Company information.

15
The loss of third-party transportation providers upon whom we depend, or conditions negatively affecting the transportation industry, could increase our costs or cause a disruption in our operations. We depend upon third-party transportation providers for delivery of products to our customers. Strikes, slowdowns, transportation disruptions or other conditions in the transportation industry, including, but not limited to, shortages of truck drivers, disruptions in rail service, increases in fuel prices and adverse weather conditions, could increase our costs and disrupt our operations and our ability to service our customers on a timely basis. We cannot predict whether or to what extent increases or anticipated increases in fuel prices may impact our costs or cause a disruption in our operations going forward.
We may need additional capital in the future, and it may not be available on acceptable terms, or at all. We may require more capital in the future to:
• fund our operations; • finance investments in equipment and infrastructure needed to maintain and expand our distribution capabilities; • enhance and expand the range of products we offer; and • respond to potential strategic opportunities, such as investments, acquisitions and international expansion.
We can give no assurance that additional financing will be available on terms favorable to us, or at all. The terms of available financing may place limits on our financial and operating flexibility. If adequate funds are not available on acceptable terms, we may be forced to reduce our operations or delay, limit or abandon expansion opportunities. Moreover, even if we are able to continue our operations, the failure to obtain additional financing could reduce our competitiveness.
Adverse weather events or natural disasters could negatively affect our local economies or disrupt our operations. Certain areas in which we operate are susceptible to adverse weather conditions or natural disasters, such as hurricanes, tornadoes, floods and earthquakes. These events can disrupt our operations, result in damage to our properties and negatively affect the local economies in which we operate. Additionally, we may experience communication disruptions with our customers, vendors and employees. These events can cause physical damage to our branches and require us to close branches. Additionally, our sales order backlog and shipments can experience a temporary decline immediately following these events.
We cannot predict whether or to what extent damage caused by these events will affect our operations or the economies in regions where we operate. These adverse events could result in disruption of our purchasing or distribution capabilities, interruption of our business that exceeds our insurance coverage, our inability to collect from customers and increased operating costs. Our business or results of operations may be adversely affected by these and other negative effects of these events.
We have a substantial amount of goodwill and other intangible assets recorded on our balance sheet, partly because of acquisitions and business combination transactions. The amortization of acquired intangible assets will reduce our future reported earnings. Furthermore, if our goodwill or other intangible assets become impaired, we may be required to recognize charges that would reduce our income. As of December 31, 2012, we had $1.4 billion of goodwill and other intangibles recorded on our balance sheet. A substantial portion of these intangible assets results from our use of purchase accounting in connection with the acquisitions we have made over the past several years. In accordance with the purchase accounting method, the excess of the cost of an acquisition over the fair value of identifiable tangible and intangible assets is assigned to goodwill. The amortization expense associated with our identifiable intangible assets will have a negative effect on our future reported earnings. Many other companies, including many of our competitors, may not have the significant acquired intangible assets that we have because they may not have participated in recent acquisitions and business combination transactions similar to ours. Thus, the amortization of identifiable intangible assets may not negatively affect their reported earnings to the same degree as ours.
Additionally, under generally accepted accounting principles, goodwill and certain other long lived intangible assets are not amortized, but must be reviewed for possible impairment annually, or more often in certain circumstances where events indicate that the asset values are not recoverable. These reviews could result in an earnings charge for impairment, which would reduce our net income even though there would be no impact on our underlying cash flow.

16
We face risks associated with conducting business in markets outside of North America. We currently conduct substantial business in countries outside of North America. In addition, we are evaluating the possibility of establishing distribution networks in certain other foreign countries, particularly in Europe, Asia, the Middle East and South America. We could be materially and adversely affected by economic, legal, political and regulatory developments in the countries in which we do business in the future or in which we expand our business, particularly those countries which have historically experienced a high degree of political or economic instability. Examples of risks inherent in such non-North American activities include:
• changes in the political and economic conditions in the countries in which we operate, including civil uprisings and terrorist acts;
• unexpected changes in regulatory requirements; • changes in tariffs; • the adoption of foreign or domestic laws limiting exports to or imports from certain foreign countries; • fluctuations in currency exchange rates and the value of the U.S. dollar; • restrictions on repatriation of earnings; • expropriation of property without fair compensation; • governmental actions that result in the deprivation of contract or proprietary rights; and • the acceptance of business practices which are not consistent with or are antithetical to prevailing business practices we
are accustomed to in North America including export compliance and anti-bribery practices and governmental sanctions.
If we begin doing business in a foreign country in which we do not presently operate, we may also face difficulties in operations and diversion of management time in connection with establishing our business there.
We are subject to U.S. and other anti-corruption laws, trade controls, economic sanctions, and similar laws and regulations, including those in the jurisdictions where we operate. Our failure to comply with these laws and regulations could subject us to civil, criminal and administrative penalties and harm our reputation. Doing business on a worldwide basis requires us to comply with the laws and regulations of the U.S. government and various foreign jurisdictions. These laws and regulations place restrictions on our operations, trade practices, partners and investment decisions. In particular, our operations are subject to U.S. and foreign anti-corruption and trade control laws and regulations, such as the Foreign Corrupt Practices Act (“FCPA”), export controls and economic sanctions programs, including those administered by the U.S. Treasury Department’s Office of Foreign Assets Control (“OFAC”). As a result of doing business in foreign countries and with foreign partners, we are exposed to a heightened risk of violating anti-corruption and trade control laws and sanctions regulations.
The FCPA prohibits us from providing anything of value to foreign officials for the purposes of obtaining or retaining business or securing any improper business advantage. It also requires us to keep books and records that accurately and fairly reflect the Company’s transactions. As part of our business, we may deal with state-owned business enterprises, the employees of which are considered foreign officials for purposes of the FCPA. In addition, the United Kingdom Bribery Act (the “Bribery Act”) has been enacted and came into effect on July 1, 2011. The provisions of the Bribery Act extend beyond bribery of foreign public officials and also apply to transactions with individuals that a government does not employ. The provisions of the Bribery Act are also more onerous than the FCPA in a number of other respects, including jurisdiction, non-exemption of facilitation payments and penalties. Some of the international locations in which we operate lack a developed legal system and have higher than normal levels of corruption. Our continued expansion outside the U.S., including in developing countries, and our development of new partnerships and joint venture relationships worldwide, could increase the risk of FCPA, OFAC or Bribery Act violations in the future.
Economic sanctions programs restrict our business dealings with certain sanctioned countries, persons and entities. In addition, because we act as a distributor, we face the risk that our customers might further distribute our products to a sanctioned person or entity, or an ultimate end-user in a sanctioned country, which might subject us to an investigation concerning compliance with OFAC or other sanctions regulations.
Violations of anti-corruption and trade control laws and sanctions regulations are punishable by civil penalties, including fines, denial of export privileges, injunctions, asset seizures, debarment from government contracts and revocations or restrictions of licenses, as well as criminal fines and imprisonment. We have established policies and procedures designed to assist our compliance with applicable U.S. and international anti-corruption and trade control laws and regulations, including the FCPA, the Bribery Act and trade controls and sanctions programs administered by OFAC, and have trained our employees to comply with these laws and regulations. However, there can be no assurance that all of our employees, consultants, agents or other associated persons will not take actions in violation of our policies and these laws and regulations, and that our policies and procedures will effectively prevent us from violating these regulations in every transaction in which we may engage or provide a defense to any alleged violation. In particular, we may be held liable for the actions that our local, strategic or joint venture partners take inside or outside of the United

17
States, even though our partners may not be subject to these laws. Such a violation, even if our policies prohibit it, could have a material adverse effect on our reputation, business, financial condition and results of operations. In addition, various state and municipal governments, universities and other investors maintain prohibitions or restrictions on investments in companies that do business with sanctioned countries, persons and entities, which could adversely affect the market for our common stock and other securities.
We face risks associated with international instability and geopolitical developments. In some countries, there is an increased chance for economic, legal or political changes that may adversely affect the performance of our services, sale of our products or repatriation of our profits. We do not know the impact that these regulatory, geopolitical and other factors may have on our business in the future and any of these factors could adversely affect us.
We are exposed to risks relating to evaluations of controls required by Section 404 of the Sarbanes-Oxley Act of 2002 (the “Sarbanes-Oxley Act”). Section 404 of the Sarbanes-Oxley Act requires us to annually evaluate our internal controls systems to allow management to report on, and our independent auditors to audit, our internal controls over financial reporting. This is not a static process as we change our processes each year or acquire new companies that have different controls than our controls. Upon completion of this process each year, we may identify control deficiencies of varying degrees of severity under applicable U.S. Securities and Exchange Commission (“SEC”) and Public Company Accounting Oversight Board (“PCAOB”) rules and regulations that remain unremediated. We are required to report, among other things, control deficiencies that constitute a “material weakness” or changes in internal controls that, or that are reasonably likely to, materially affect internal controls over financial reporting. A “material weakness” is a significant deficiency or combination of significant deficiencies in internal control over financial reporting that results in a reasonable possibility that a material misstatement of the annual or interim financial statements will not be prevented or detected on a timely basis.
We could suffer a loss of confidence in the reliability of our financial statements if our independent registered public accounting firm reports a material weakness in our internal controls, if we do not develop and maintain effective controls and procedures or if we are otherwise unable to deliver timely and reliable financial information. Any loss of confidence in the reliability of our financial statements or other negative reaction to our failure to develop timely or adequate disclosure controls and procedures or internal controls could result in a decline in the price of our common stock. In addition, if we fail to remedy any material weakness, our financial statements may be inaccurate, we may face restricted access to the capital markets and our stock price may be adversely affected.
We are a “controlled company” within the meaning of the NYSE rules and, as a result, will qualify for, and may rely on, exemptions from certain corporate governance requirements. A company of which more than 50% of the voting power is held by an individual, a group or another company is a “controlled company” within the meaning of the NYSE rules and may elect not to comply with certain corporate governance requirements of the NYSE, including:
• the requirement that a majority of the Board consist of independent directors; • the requirement that we have a nominating/corporate governance committee that is composed entirely of independent
directors with a written charter addressing the committee’s purpose and responsibilities; and • the requirement that we have a compensation committee that is composed entirely of independent directors with a written
charter addressing the committee’s purpose and responsibilities.
We rely on all of the exemptions listed above. Accordingly, our stockholders do not have the same protections afforded to stockholders of companies that are subject to all of the corporate governance requirements of the NYSE.
The SEC’s move toward a single set of international accounting standards could materially impact our results of operations. The SEC continues to move forward with a convergence to a single set of international accounting standards (such as International Financial Reporting Standards (“IFRS”)). The associated changes in regulatory accounting may negatively impact the way we record revenues, expenses, assets and liabilities. Currently, under IFRS, the last in, first out (“LIFO”) method of valuing inventory is not permitted. If we had ceased valuing our inventory under the LIFO method at December 31, 2012, we would have been required to make tax payments approximating $134.8 million over the subsequent four years.

18
Certain funds affiliated with The Goldman Sachs Group, Inc. (the “Goldman Sachs Funds”) control us and may have conflicts of interest with our other stockholders. Conflicts of interest may arise because affiliates of our principal stockholder have continuing agreements and business relationships with us. As of December 31, 2012, the Goldman Sachs Funds control 54.7% of our outstanding common stock. As a result, the Goldman Sachs Funds control the election of our directors, determine our corporate and management policies and determine, without the consent of our other stockholders, the outcome of any corporate transaction or other matter submitted to our stockholders for approval, including potential mergers or acquisitions, asset sales and other significant corporate transactions. The Goldman Sachs Funds also have sufficient voting power to amend our organizational documents.
Conflicts of interest may arise between our principal stockholder and us. Affiliates of our principal stockholder engage in transactions with our Company. One affiliate of our principal stockholder, Goldman Sachs Lending Partners LLC, is the co-documentation agent and a managing agent for our Global ABL Facility. See “Item 13—Certain Relationships and Related Transactions, and Director Independence”. Further, the Goldman Sachs Funds are in the business of making investments in companies and may, from time to time, acquire and hold interests in businesses that compete directly or indirectly with us, and they may either directly, or through affiliates, also maintain business relationships with companies that may directly compete with us. In general, the Goldman Sachs Funds or their affiliates could pursue business interests or exercise their voting power as stockholders in ways that are detrimental to us but beneficial to themselves or to other companies in which they invest or with whom they have a material relationship. Conflicts of interest could also arise with respect to business opportunities that could be advantageous to the Goldman Sachs Funds and they may pursue acquisition opportunities that may be complementary to our business. As a result, those acquisition opportunities may not be available to us. Under the terms of our certificate of incorporation, the Goldman Sachs Funds have no obligation to offer us corporate opportunities.
As a result of these relationships, the interests of the Goldman Sachs Funds may not coincide with the interests of our Company or other holders of our common stock. So long as the Goldman Sachs Funds continue to control a significant amount of the outstanding shares of our common stock, the Goldman Sachs Funds will continue to be able to strongly influence or effectively control our decisions, including potential mergers or acquisitions, asset sales and other significant corporate transactions. See “Item 13—Certain Relationships and Related Transactions, and Director Independence”.
We do not currently intend to pay dividends in the foreseeable future. It is uncertain when, if ever, we will declare dividends to our stockholders. We do not currently intend to pay dividends in the foreseeable future. Our ability to pay dividends is constrained by our holding company structure under which we are dependent on our subsidiaries for payments. Additionally, we and our subsidiaries are parties to credit agreements which restrict our ability and their ability to pay dividends. See “Item 5—Market for the Registrant’s Common Equity, Related Shareholder Matters and Issuer Purchases of Equity Securities” and “Item 7—Management’s Discussion and Analysis of Financial Condition and Results of Operations—Liquidity and Capital Resources”.
The occurrence of cyber incidents, or a deficiency in our cybersecurity, could negatively impact our business by causing a disruption to our operations, a compromise or corruption of our confidential information or damage to our Company’s image, all of which could negatively impact our financial results. A cyber incident is considered to be any adverse event that threatens the confidentiality, integrity or availability of our information resources. More specifically, a cyber incident is an intentional attack or an unintentional event that can include gaining unauthorized access to systems to disrupt operations, corrupt data or steal confidential information. As our reliance on technology has increased, so have the risks posed to our systems, both internal and those we have outsourced. Our three primary risks that could directly result from the occurrence of a cyber incident include operational interruption, damage to our Company’s image, and private data exposure. We have implemented solutions, processes, and procedures to help mitigate this risk, but these measures, as well as our organization’s increased awareness of our risk of a cyber incident, do not guarantee that our financial results will not be negatively impacted by such an incident.
Compliance with and changes in laws and regulations in the countries in which we operate could have a significant financial impact and effect how and where we conduct our operations. We have operations in the U.S. and in over 15 countries that can be impacted by expected and unexpected changes in the business and legal environments in the countries in which we operate. Compliance with and changes in laws, regulations, and other legal and business issues could impact our ability to manage our costs and to meet our earnings goals. Compliance related matters could also limit our ability to do business in certain countries. Changes that could have a significant cost to us include new legislation, new regulations, or a differing interpretation of existing laws and regulations, changes in tax law or tax rates, the unfavorable resolution of tax assessments or audits by various taxing authorities, the expansion of currency exchange controls, export controls or additional restrictions on doing business in countries subject to sanctions in which we operate or intend to operate.

19
ITEM 1B. UNRESOLVED STAFF COMMENTS Not applicable.
ITEM 2. PROPERTIES In North America, we operate a modified hub and spoke model that is centered around our nine distribution centers in the U.S and Canada with more than 190 branch locations which have inventory and local employees. Our U.S. network is comprised of over 150 branch locations and 8 distribution centers. We own our Charleston, WV corporate office and our Nitro, WV and Houston, TX (Darien Street) distribution centers and lease the remaining six distribution centers. In Canada, we have over 40 branch locations and we own our one distribution center in Nisku, Alberta, Canada. We own less than 15% of our branch locations as we primarily lease the facilities.
Outside North America, we operate through a network of over 50 branch locations located throughout Europe, Asia, Australasia and the Middle East, including distribution centers in each of the United Kingdom, Singapore and Australia. We also maintain an operations center for our international operations in Bradford, United Kingdom and Perth, Australia. We own our Brussels, Belgium location and the remainder of our locations are leased.
Our company maintains its principal executive office at 2 Houston Center, 909 Fannin, Suite 3100, Houston, Texas, 77010 and also maintains corporate offices in Charleston, WV, and in Tulsa, OK. All three locations have corporate functions such as accounting, human resources, legal and information technology. We also maintain operations centers for our Canadian operations in Calgary, Alberta and for our international operations in Bradford, United Kingdom.
ITEM 3. LEGAL PROCEEDINGS From time to time, we have been subject to various claims and involved in legal proceedings incidental to the nature of our businesses. We maintain insurance coverage to reduce financial risk associated with certain of these claims and proceedings. It is not possible to predict the outcome of these claims and proceedings. However, in our opinion, there are no material pending legal proceedings that upon resolution are likely to have a material effect on our business, financial condition, results of operations or cash flows.
Also, from time to time, in the ordinary course of our business, our customers may claim that the products that we distribute are either defective or require repair or replacement under warranties that either we or the manufacturer may provide to the customer. These proceedings are, in the opinion of management, ordinary and routine matters incidental to our normal business. Our purchase orders with our suppliers generally require the manufacturer to indemnify us against any product liability claims, leaving the manufacturer ultimately responsible for these claims. In many cases, state, provincial or foreign law provides protection to distributors for these sorts of claims, shifting the responsibility to the manufacturer. In some cases, we could be required to repair or replace the products for the benefit of our customer and seek our recovery from the manufacturer for our expense. In the opinion of management, the ultimate disposition of these claims and proceedings are not expected to have a material adverse effect on our financial position, results of operations or cash flows.
For information regarding asbestos cases in which we are a defendant and other claims and proceedings, see “Item 7—Management’s Discussion and Analysis of Financial Condition and Results of Operations—Contractual Obligations, Commitments and Contingencies—Legal Proceedings” and “Note 15—Commitments and Contingencies” to our audited consolidated financial statements included elsewhere in this report.
ITEM 4. MINE SAFETY DISCLOSURES Not applicable.

20
EXECUTIVE OFFICERS OF THE REGISTRANT The name, age, period of service and the title of each of our executive officers as of February 22, 2013 are listed below.
Andrew R. Lane has served as our president and chief executive officer (“CEO”) since September 2008 and our chairman of the Board since December 2009. He has also served as a director of MRC Global Inc. since September 2008. From December 2004 to December 2007, he served as executive vice president and chief operating officer of Halliburton Company, where he was responsible for Halliburton’s overall operational performance, managed over 50,000 employees worldwide and oversaw the integration of several mergers and acquisitions. Prior to that, he held a variety of leadership roles within Halliburton, serving as president and CEO of Kellogg Brown & Root, Inc. from July 2004 to November 2004, as senior vice president, global operations of Halliburton Energy Services Group from April 2004 to July 2004, as president of the Landmark Division of Halliburton Energy Services Group from May 2003 to March 2004, and as president and CEO of Landmark Graphics Corporation from April 2002 to April 2003. He was also chief operating officer of Landmark Graphics from January 2002 to March 2002 and vice president, production enhancement PSL, completion products PSL and tools/testing/TCP of Halliburton Energy Services Group from January 2000 to December 2001. Mr. Lane served as a director of KBR, Inc. from June 2006 to April 2007. He began his career in the oil and natural gas industry as a field engineer for Gulf Oil Corporation in 1982, and later worked as a production engineer in Gulf Oil’s Pipeline Design and Permits Group. Mr. Lane received a B.S. in mechanical engineering from Southern Methodist University in 1981 (cum laude). He also completed the Advanced Management Program (A.M.P.) at Harvard Business School in 2000. He is a member of the executive board of the Southern Methodist University School of Engineering. Mr. Lane is uniquely qualified to serve as one of our directors due to his extensive executive and leadership experience in the oil and natural gas industry and his deep knowledge of our operations.
James E. Braun has served as our executive vice president and chief financial officer since November 2011. Prior to joining the Company, Mr. Braun served as chief financial officer of Newpark Resources, Inc. since 2006. Newpark provides drilling fluids and other products and services to the oil and gas exploration and production industry, both inside and outside of the U.S. Before joining Newpark, Mr. Braun was chief financial officer of Baker Oil Tools, one of the largest divisions of Baker Hughes Incorporated, a leading provider of drilling, formation evaluation, completion and production products and services to the worldwide oil and gas industry. From 1998 until 2002, he was vice president, finance and administration, of Baker Petrolite, the oilfield specialty chemical business division of Baker Hughes. Previously, he served as vice president and controller of Baker Hughes. Mr. Braun is a CPA and was formerly a partner with Deloitte & Touche. Mr. Braun received a B.A. in accounting from the University of Illinois at Urbana-Champaign.
Daniel J. Churay has served as our executive vice president corporate affairs, general counsel and corporate secretary since May 2012. In his current role, Mr. Churay manages the company’s human resources, legal, risk and compliance and external and government affairs functions. He also acts as corporate secretary to the company’s board of directors. Prior to May 2012, Mr. Churay served as executive vice president and general counsel since August 2011 and as our corporate secretary since November 2011. From December 2010 to June 2011, he served as president and CEO of Rex Energy Corporation, an independent oil and gas company. From September 2002 to December 2010, Mr. Churay served as executive vice president, general counsel and secretary of YRC Worldwide Inc., a Fortune 500 transportation and logistics company, with primary responsibility for YRC Worldwide Inc.’s legal, risk, compliance and external affairs matters, including its internal audit function. During 2010, Mr. Churay also supervised YRC’s Chinese businesses. From 1995 to 2002, Mr. Churay served as the deputy general counsel and assistant secretary of Baker Hughes Incorporated, a Fortune 500 company that provides products and services to the petroleum and continuous process industries, where he was responsible for legal matters relating to acquisitions, divestitures, treasury matters and securities offerings. From 1989 to 1995, Mr. Churay was an attorney at the law firm of Fulbright and Jaworski LLP in Houston, Texas. He is a member of the American Bar Association, the State Bar of Texas and the Parent’s Council of Texas Christian University. He also serves on the board of directors of the Sam Houston Area Council of the Boy Scouts of America. Mr. Churay received a bachelor’s degree in economics from the University of Texas and a juris doctorate from the University of Houston Law Center, where he was a member of the Law Review.
Gary A. Ittner has served as executive vice president of corporate strategy, mergers and acquisitions since September 2012. From September 2010 to May 2012, he served as our executive vice president of global supply chain management and as our chief administrative officer since. Prior to that, he served as our executive vice president—supply chain management from October 2008 to September 2010 after he had served as our senior corporate vice president of supply chain management from February 2007 to October 2008, having specific responsibility for the procurement of all industrial valves, automation, fittings and alloy tubular products. From March 2001 to November 2007, he served as our senior corporate vice president of supply chain management. Before joining the supply chain management group, Mr. Ittner worked in various field positions including branch manager, regional manager and senior regional vice president. He is a past chairman of the executive committee of the American Supply Association’s Industrial Piping Division. Mr. Ittner began working at MRC in 1971 following his freshman year at the University of Cincinnati and joined MRC full-time following his graduation in 1974.
Rory M. Isaac has served as executive vice president of corporate strategy, mergers and acquisitions since September 2012. Prior to this role, Mr. Isaac served as the executive vice president of global business development since December 2008. From 2007 to 2008, he served as our senior corporate vice president of sales (focusing on downstream, industrials and natural gas utilities operations) since

21
November 2007. From 2000 to 2007 he served as our senior vice president of national accounts, utilities and marketing. From 1995 to 2000 he served as our senior vice president of national accounts. Mr. Isaac joined MRC in 1981. He has extensive experience in sales, customer relations and management, and has served at MRC as a branch manager, regional manager and regional vice president. In 1995 he began working in our corporate office in Charleston, West Virginia as senior vice president for national accounts where he was responsible for managing and growing our national accounts customer base and directing business development efforts into integrated supply markets. Prior to joining MRC, Mr. Isaac worked at Consolidated Services, Inc. and Charleston Supply Company. Mr. Isaac attended the Citadel.
James F. Underhill has served as our executive vice president and chief operating officer of U.S. operations since November 2012. His global responsibilities also include information technology and corporate shared services, including safety, quality, and marketing. Prior to his current role, he served as our executive vice president and chief operating officer – North America beginning in November 2011. He served as our executive vice president and chief financial officer from November 2007 through October 2011. He served as our chief financial officer from May 2006 through October 2007, as senior vice president of accounting and information services from 1994 to May 2006, and vice president and controller from 1987 to 1994. Prior to 1987, Mr. Underhill served as controller, assistant controller, and corporate accounting manager. Mr. Underhill joined us in 1980 and has since overseen our accounting, information systems and mergers and acquisitions areas. He has been involved in numerous implementations of electronic customer solutions and has had primary responsibility for the acquisition and integration of more than 30 businesses. Mr. Underhill was also project manager for the design, development, and implementation of our IT operating system. He received a B.A. in accounting and economics from Lehigh University in 1977 and is a certified public accountant. Prior to joining us, Mr. Underhill worked in the New York City office of the accounting firm of Main Hurdman (which was incorporated into the successor accounting firm, KPMG).
Alan Colonna has served as our executive vice president of global business development and supply chain management since September 2012. Prior to this role, he served as the senior regional vice president of the Gulf Coast U.S. region since 2009. Prior to that he was the senior regional vice president of the Western U.S. region from 2008 to 2009 and the regional vice president of the Western U.S. region from 2000-2007. Mr. Colonna began his career with Republic Supply of California in 1984, which was acquired by MRC in 1991, and has held a variety of operational positions including inside sales, branch manager and regional manager throughout his career. Mr. Colonna graduated from Cal Poly San Luis Obispo, California in 1982.
Scott A. Hutchinson has served as our executive vice president of Canada since November 2012. Before this role, he served as our executive vice president of North America operations beginning in November 2009. Prior to that, from January 2009 to November 2009 he had served as our senior vice president of the Eastern region covering most operational units east of the Mississippi River. Mr. Hutchinson’s extensive background in branch sales and operations was instrumental as he led the integration effort of the Midwest, Eastern and Appalachian regions. From October 1998 to January 2009, he served as senior vice president of our Midwest region. During this time he was key in the acquisitions and integration of Wilkins Supply, Joliet Valve, Cigma and Valvax, solidifying and expanding the market reach of the Company in the Midwest. From May 1988 to October 1998 he worked in various field positions including branch manager, regional manager and regional vice president in our Western Region. From 1984 to 1988, he served as outside sales representative for Grant Supply in Houston, Texas which became part of our Company in 1987. Prior to joining us, Mr. Hutchinson worked for Fluor Corporation in procurement. Mr. Hutchinson received a bachelor of arts degree in marketing from the University of Central Florida in 1977.
Neil P. Wagstaff has served as our executive vice president—international operations since January 1, 2011. Prior to that, he served as our executive vice president—international operations and as CEO of MRC Transmark since October 2009. From July 2006 until October 2009, he served as group chief executive of MRC Transmark, where he was responsible for the group’s overall performance in 13 operating companies in Europe, Asia and Australia and oversaw a number of acquisitions and integrations. Prior to that he held a variety of positions within MRC Transmark, serving as a group divisional director from 2003, responsible for operations in the UK and Asia, as well as managing director for the UK businesses. He was also sales and marketing director of Heaton Valves prior to the acquisition by MRC Transmark group in 1996, as well as sales and marketing director for Hattersley Heaton valves and Shipham Valves. Mr. Wagstaff began his career in the valve manufacturing business in 1983 when he studied mechanical engineering at the Saunders Valve Company. Educated at London Business School, he is a chartered director and fellow of the UK Institute of Directors.

22
PART II
ITEM 5. MARKET FOR THE REGISTRANT’S COMMON EQUITY, RELATED STOCKHOLDER MATTERS AND ISSUER PURCHASES OF EQUITY SECURITIES
MRC Global Inc. common stock was listed on the New York Stock Exchange on April 17, 2012 following an initial public offering at a price of $21.00. The following table illustrates the high and low sales prices for the subsequent quarters.
2012
Second Quarter (from April 17, 2012)
Third Quarter
Fourth Quarter
Common stock sale price
High $ 21.50 $ 25.82 $ 28.55
Low $ 19.04 $ 20.02 $ 21.60
As of February 2013, there were 77 holders of record of the Company’s common stock.
Our board of directors has not declared any dividends during 2011 or 2012 and currently has no intention to declare any dividends.
McJunkin Red Man Corporation’s Global ABL Facility and Term Loan restrict our ability to declare cash dividends. Any future dividends declared would be at the discretion of our board of directors and would depend on our financial condition, results of operations, cash flows, contractual obligations, the terms of our financing agreements at the time a dividend is considered, and other relevant factors.

23
PERFORMANCE GRAPH The graph below compares the cumulative total shareholder return on our common stock to the S&P 500 Index and the Dow Jones U.S. Industrial Suppliers Index. The total shareholder return assumes $100 invested on April 12, 2012, the date our stock first traded following our initial public offering, in MRC Global Inc., the S&P 500 Index and the Dow Jones U.S. Industrial Suppliers Index. It also assumes reinvestment of all dividends. The results shown in the graph below are not necessarily indicative of future performance.
Comparison of Cumulative Total Return
This information shall not be deemed to be ‘‘soliciting material’’ or to be ‘‘filed’’ with the SEC or subject to Regulation 14A (17 CFR 240.14a-1-240.14a-104), other than as provided in Item 201(e) of Regulation S-K, or to the liabilities of section 18 of the Exchange Act (15 U.S.C. 78r).

24
ITEM 6. SELECTED FINANCIAL DATA The selected financial data presented below have been derived from the consolidated financial statements of MRC Global Inc. that have been prepared using accounting principles generally accepted in the United States of America which have been audited by Ernst & Young LLP, our independent registered public accounting firm. This data should be read in conjunction with “Item 7—Management’s Discussion and Analysis of Financial Condition and Results of Operations” and the consolidated financial statements, related notes and other financial information included elsewhere in this report.
Year Ended December 31,
2012
2011
2010
2009
2008
(dollars in millions, except per share amounts) Statements of Operations Data:
Sales ......................................................................................... $ 5,570.8 $ 4,832.4 $ 3,845.5 $ 3,661.9 $ 5,255.2 Cost of sales ............................................................................. 4,557.1 4,124.2 3,327.4 3,113.9 4,273.1
Gross profit .............................................................................. 1,013.7 708.2 518.1 548.0 982.1 Selling, general and administrative expenses ........................... 606.7 513.6 451.7 411.6 482.1 Goodwill and intangibles impairment charge .......................... — — — 386.1 —
Operating income (loss) ........................................................... 407.0 194.6 66.4 (249.7) 500.0 Other (expenses) income:
Interest expense ........................................................................ (112.5) (136.8) (139.6) (116.5) (84.5) Early extinguishment of debt ................................................... (114.0) — — — — Write off of debt issuance costs ............................................... (1.7) (9.5) — — — Change in fair value of derivatives .......................................... 2.2 7.0 (4.9) 8.9 (6.2) Other, net ................................................................................. 0.7 0.5 2.9 2.5 (2.6)
Income (loss) before income taxes ........................................... 181.7 55.8 (75.2) (354.8) 406.7 Income taxes ............................................................................ 63.7 26.8 (23.4) (15.0) 153.2
Net income (loss) ..................................................................... $ 118.0 $ 29.0 $ (51.8) $ (339.8) $ 253.5
Earnings (loss) per share amounts:
Basic ............................................................................... $ 1.22 $ 0.34 $ (0.61) $ (4.30) $ 3.26 Diluted ............................................................................ $ 1.22 $ 0.34 $ (0.61) $ (4.30) $ 3.26 Weighted average shares, basic (in thousands) .............. 96,465 84,417 84,384 79,067 77,646 Weighted average shares, diluted (in thousands) ........... 96,925 84,655 84,384 79,067 77,828 Dividends ....................................................................... $ — $ — $ — $ 0.04 $ 6.10
As of December 31,
2012
2011
2010
2009
2008
Balance Sheet Data:
Cash .......................................................................................... $ 37.1 $ 46.1 $ 56.2 $ 56.2 $ 12.1 Working capital(1) .................................................................... 1,200.5 1,074.7 842.6 930.2 1,208.0 Total assets ................................................................................ 3,369.7 3,229.9 2,991.2 3,083.2 3,919.7 Total debt(2) ............................................................................. 1,256.6 1,526.7 1,360.2 1,452.6 1,748.6 Stockholders’ equity ................................................................. 1,185.9 720.8 689.8 743.9 987.2
Year Ended December 31,
2012
2011
2010
2009
2008
Other Financial Data:
Adjusted Gross Profit(3) ............................................................. $ 1,057.7 $ 849.6 $ 663.2 $ 493.5 $ 1,164.0 Adjusted EBITDA(4) .................................................................. 463.2 360.5 224.2 218.5 744.4 Adjusted EBITDA RONA(5)...................................................... 28.9% 24.1% 19.6% 18.6%
Net cash flow:
Operating Activities .......................................................... 240.1 (102.9) 112.7 505.5 (137.4) Investing Activities............................................................ (183.0) (48.0) (16.2) (66.9) (314.2) Financing Activities .......................................................... (60.5) 140.6 (98.2) (393.9) 452.0
(1) Working capital is defined as current assets less current liabilities. (2) Includes current portion.

25
(3) We define “Adjusted Gross Profit” as sales, less cost of sales, plus depreciation and amortization, plus amortization of intangibles, and plus or minus the impact of our last-in, first-out (“LIFO”) inventory costing methodology. We present Adjusted Gross Profit because we believe it is a useful indicator of our operating performance and facilitates a meaningful comparison to our peers. We believe this for the following reasons: • Our management uses Adjusted Gross Profit for planning purposes, including the preparation of our annual operating
budget and financial projections. This measure is also used to assess the performance of our business; • Investors use Adjusted Gross Profit to measure a company’s operating performance without regard to items, such as
depreciation and amortization, and amortization of intangibles, that can vary substantially from company to company depending upon the nature and extent of transactions they have been involved in. Similarly, the impact of the LIFO inventory costing method can cause results to vary substantially from company to company depending upon whether those companies elect to utilize the LIFO method and depending upon which LIFO method they may elect; and
• Securities analysts can use Adjusted Gross Profit as a supplemental measure to evaluate overall operating performance of companies.
In particular, we believe that Adjusted Gross Profit is a useful indicator of our operating performance because Adjusted Gross Profit measures our Company’s operating performance without regard to acquisition transaction-related amortization expenses. However, Adjusted Gross Profit does not represent and should not be considered an alternative to gross profit or any other measure of financial performance calculated and presented in accordance with GAAP. Our Adjusted Gross Profit may not be comparable to similar measures that other companies report because other companies may not calculate Adjusted Gross Profit in the same manner as we do. Although we use Adjusted Gross Profit as a measure to assess the operating performance of our business, Adjusted Gross Profit has significant limitations as an analytical tool because it excludes certain material costs. For example, it does not include depreciation and amortization expense. Because we use capital assets, depreciation expense is a significant element of our costs and impacts our ability to generate revenue. In addition, the omission of amortization expense associated with our intangible assets further limits the usefulness of this measure. Furthermore, Adjusted Gross Profit does not account for our LIFO inventory costing methodology and, therefore, to the extent that recently purchased inventory accounts for a relatively large portion of our sales, Adjusted Gross Profit may overstate our operating performance. Because Adjusted Gross Profit does not account for certain expenses, its utility as a measure of our operating performance has material limitations. Because of these limitations, management does not view Adjusted Gross Profit in isolation or as a primary performance measure and also uses other measures, such as net income and sales, to measure operating performance. The following table reconciles Adjusted Gross Profit to gross profit (in millions):
Year Ended December 31,
2012
2011
2010
2009
2008
Gross profit ............................................................ $ 1,013.7 $ 708.2 $ 518.1 $ 548.0 $ 982.1 Depreciation and amortization .............................. 18.6 17.0 16.6 14.5 11.3 Amortization of intangibles ................................... 49.5 50.7 53.9 46.6 44.4 (Decrease) increase in LIFO reserve ..................... (24.1) 73.7 74.6 (115.6) 126.2
Adjusted Gross Profit ............................................ $ 1,057.7 $ 849.6 $ 663.2 $ 493.5 $ 1,164.0
(4) We define “Adjusted EBITDA” as net income plus interest, income taxes, depreciation and amortization, amortization of intangibles, other non-recurring and non-cash charges (such as gains/losses on the early extinguishment of debt, changes in the fair value of derivative instruments and goodwill impairment) and plus or minus the impact of our LIFO inventory costing methodology. We present Adjusted EBITDA because we believe it is a useful factor indicator of our operating performance. We believe this for the following reasons: • Our management uses Adjusted EBITDA for planning purposes, including the preparation of our annual operating budget
and financial projections, as well as for determining a significant portion of the compensation of our executive officers; • Adjusted EBITDA is widely used by investors to measure a company’s operating performance without regard to items,
such as interest expense, income tax expense and depreciation and amortization, that can vary substantially from company to company depending upon their financing and accounting methods, the book value of their assets, their capital structures and the method by which their assets were acquired; and
• Securities analysts use Adjusted EBITDA as a supplemental measure to evaluate the overall operating performance of companies.
In particular, we believe that Adjusted EBITDA is a useful indicator of our operating performance because Adjusted EBITDA measures our Company’s operating performance without regard to certain non-recurring, non-cash or transaction-related expenses.
26
Adjusted EBITDA, however, does not represent and should not be considered as an alternative to net income, cash flow from operations or any other measure of financial performance calculated and presented in accordance with GAAP. Our Adjusted EBITDA may not be comparable to similar measures that other companies report because other companies may not calculate Adjusted EBITDA in the same manner as we do. Although we use Adjusted EBITDA as a measure to assess the operating performance of our business, Adjusted EBITDA has significant limitations as an analytical tool because it excludes certain material costs. For example, it does not include interest expense, which has been a significant element of our costs. Because we use capital assets, depreciation expense is a significant element of our costs and impacts our ability to generate revenue. In addition, the omission of the amortization expense associated with our intangible assets further limits the usefulness of this measure. Adjusted EBITDA also does not include the payment of certain taxes, which is also a significant element of our operations. Furthermore, Adjusted EBITDA does not account for our LIFO inventory costing methodology, and therefore, to the extent that recently purchased inventory accounts for a relatively large portion of our sales, Adjusted EBITDA may overstate our operating performance. Because Adjusted EBITDA does not account for certain expenses, its utility as a measure of our operating performance has material limitations. Because of these limitations, management does not view Adjusted EBITDA in isolation or as a primary performance measure and also uses other measures, such as net income and sales, to measure operating performance. The following table reconciles Adjusted EBITDA with our net income (loss), as derived from our financial statements (in millions):
Year Ended December 31,
2012
2011
2010
2009
2008
Net income (loss) ........................................................ $ 118.0 $ 29.0 $ (51.8) $ (339.8) $ 253.5 Income taxes ................................................................ 63.7 26.8 (23.4) (15.0) 153.2 Interest expense ........................................................... 112.5 136.8 139.6 116.5 84.5 Loss (gain) on early extinguishment of debt ............... 114.0 — — (1.3) — Write off of debt issuance costs................................... 1.7 9.5 — — — Depreciation and amortization .................................... 18.6 17.0 16.6 14.5 11.3 Amortization of intangibles ......................................... 49.5 50.7 53.9 46.6 44.4 Amortization of purchase price accounting ................. — — — 15.7 2.4 Change in fair value of derivative instruments ............ (2.2) (7.0) 4.9 (8.9) 6.2 Closed locations .......................................................... — — (0.7) 1.4 4.4 Share based compensation ........................................... 8.5 8.4 3.7 7.8 10.2 Franchise taxes ............................................................ — 0.4 0.7 1.4 1.5 Goodwill and intangibles impairment ......................... — — — 386.1 — Inventory write-down .................................................. — — 0.4 46.5 — IT system conversion costs .......................................... — — — 2.4 1.4 M&A transaction & integration expenses ................... — 0.5 1.4 17.5 30.4 Pension settlement ....................................................... 4.4 — — — — Legal and consulting expenses .................................... (1.2) 9.9 4.2 1.9 0.4 Joint venture termination ............................................. — 1.7 — — — Provision for uncollectible accounts ........................... — 0.4 (2.0) 1.0 7.7 Severance and related costs ......................................... — 1.1 3.2 4.4 — MRC Transmark pre-Acquisition contribution ........... — — — 38.5 — LIFO ............................................................................ (24.1) 73.7 74.6 (115.6) 126.2 Other expenses ............................................................ (0.2) 1.6 (1.1) (3.1) 6.7
Adjusted EBITDA ....................................................... $ 463.2 $ 360.5 $ 224.2 $ 218.5 $ 744.4

27
(5) We define Adjusted EBITDA Return on Net Assets (“Adjusted EBITDA RONA”) as (a) Adjusted EBITDA divided by (b) accounts receivable, plus inventory, plus the LIFO reserve, plus property, plant & equipment, net, less accounts payable and net assets acquired on December 31, 2012. The calculation of Adjusted EBITDA RONA is set forth below (dollars in millions):
Year Ended December 31,
2012
2011
2010
2009
Adjusted EBITDA ......................................................... $ 463.2 $ 360.5 $ 224.2 $ 218.5
Accounts receivable ...................................................... $ 823.2 $ 791.3 $ 596.4 $ 506.2 Inventory at LIFO .......................................................... 970.2 899.1 765.4 871.6 LIFO Reserve ................................................................ 151.0 175.1 101.4 26.9 Property, plant & equipment, net .................................. 122.5 107.4 104.7 111.5 Accounts payable .......................................................... (438.4) (479.6) (426.6) (338.5) Net assets acquired on December 31, 2012(1) .............. (28.0) — — —
Total adjusted net assets ................................................ $ 1,600.5 $ 1,493.3 $ 1,141.3 $ 1,177.7
Adjusted EBITDA RONA ............................................. 28.9% 24.1% 19.6% 18.6%
(1) Includes Production Specialty Services, Inc. accounts receivable, inventory and property plant and equipment less accounts payable acquired on December 31, 2012.
We present Adjusted EBITDA RONA because we believe it is a useful indicator of our operating performance. Management believes that Adjusted EBITDA RONA provides meaningful supplemental information regarding our performance by excluding certain income and expense items and assets and liabilities that may not be indicative of the core business operating results and may help in comparing current period results with those of prior periods as well as with our peers. Our management uses Adjusted EBITDA RONA for determining a significant portion of the compensation of our executive officers. In addition, Adjusted EBITDA RONA is a useful indicator of our operating performance because it measures our performance without regard to acquisition transaction-related assets such as intangibles and goodwill. However, Adjusted EBITDA RONA does not represent and should not be considered an alternative to other GAAP measures of performance such as net income. Also, our definition of Adjusted EBITDA RONA may not be comparable to similar measures that other companies report. Further, Adjusted EBITDA RONA has certain limitations, such as excluding our LIFO inventory costing methodology. In addition, the omission of our substantial intangible assets and goodwill further limits the usefulness of this measure. As a result, management does not view Adjusted EBITDA RONA in isolation or as a primary performance measure and uses other measures such as net income and sales to measure operating performance. Management believes that the GAAP-based measure which is most comparable to Adjusted EBITDA RONA is a percentage with net income in the numerator and stockholders’ equity in the denominator. We believe Adjusted EBITDA is a useful measure of performance as compared to net income for the reasons stated above in footnote 4. We believe that for our Company total adjusted net assets (as calculated above) is a more useful measure than stockholders’ equity for purposes of a RONA calculation because, among other things, our calculation omits intangible assets and goodwill arising from acquisitions. Given the Company’s history of making numerous acquisitions in recent years, the Company believes that the measure it uses is more comparable to similar measures used by other companies if the effects of acquisitions are eliminated.

28
For a reconciliation of Adjusted EBITDA (the numerator in our calculation of Adjusted EBITDA RONA) to net income, see footnote 4 above. For a reconciliation of total adjusted net assets (the denominator in our calculation of Adjusted EBITDA RONA) to stockholders’ equity, see the following table:
Year Ended December 31,
2012
2011
2010
2009
(dollars in millions) Stockholders’ equity ...................................................... $ 1,185.9 $ 720.8 $ 689.8 $ 743.9 Long term debt .............................................................. 1,256.6 1,526.7 1,360.2 1,452.6 Deferred taxes, net ......................................................... 334.5 357.2 373.7 377.9 Other liabilities .............................................................. 147.7 143.3 140.8 170.2 Intangible assets ............................................................ (1,359.7) (1,333.1) (1,366.5) (1,425.7) LIFO Reserve ................................................................ 151.0 175.1 101.4 26.9 Other assets ................................................................... (50.4) (50.6) (101.9) (111.9) Cash ............................................................................... (37.1) (46.1) (56.2) (56.2) Net assets acquired on December 31, 2012(1) .............. (28.0) — — —
Total adjusted net assets ................................................ $ 1,600.5 $ 1,493.3 $ 1,141.3 $ 1,177.7
(1) Includes Production Specialty Services, Inc. accounts receivable, inventory and property plant and equipment less accounts payable acquired on December 31, 2012.
The following table summarizes (1) the numerator and denominator in our calculation of Adjusted EBITDA RONA and (2) the numerator (net income) and denominator (stockholders’ equity) in the most comparable GAAP-based measure.
Year Ended December 31,
2012
2011
2010
2009
(dollars in millions) Adjusted EBITDA .......................................................... $ 463.2 $ 360.5 $ 224.2 $ 218.5 Total adjusted net assets ................................................. $ 1,600.5 $ 1,493.3 $ 1,141.3 $ 1,177.7 Adjusted EBITDA RONA .............................................. 28.9% 24.1% 19.6% 18.6%
Net income (loss) ........................................................... $ 118.0 $ 29.0 $ (51.8) $ (339.8) Stockholders’ equity ....................................................... $ 1,185.9 $ 720.8 $ 689.8 $ 743.9 Net income / stockholders’ equity .................................. 10.0% 4.0% (7.5)% (45.7)%

29
ITEM 7. MANAGEMENT’S DISCUSSION AND ANALYSIS OF FINANCIAL CONDITION AND RESULTS OF OPERATIONS
You should read the following discussion and analysis of our financial condition and results of operations in conjunction with our financial statements and related notes included elsewhere in this report. This discussion and analysis contains forward-looking statements that involve risks, uncertainties and assumptions. Our actual results may differ materially from those anticipated in these forward-looking statements as a result of a number of factors, including, but not limited to, those set forth under “Cautionary Note Regarding Forward-Looking Statements” and “Item 1A—Risk Factors” and elsewhere in this report. All references throughout this section (and elsewhere in this report) to amounts available for borrowing under various credit facilities refer to amounts actually available for borrowing after giving effect to any borrowing base limitations imposed by the facility.
Cautionary Note Regarding Forward-Looking Statements Management’s Discussion and Analysis of Financial Condition and Results of Operations (as well as other sections of this Annual Report on Form 10-K) contain forward-looking statements, including, for example, statements about our business strategy, our industry, our future profitability, growth in the industry sectors we serve, our expectations, beliefs, plans, strategies, objectives, prospects and assumptions, and estimates and projections of future activity and trends in the oil and natural gas industry. These forward-looking statements are not guarantees of future performance. These statements are based on management’s expectations that involve a number of business risks and uncertainties, any of which could cause actual results to differ materially from those expressed in or implied by the forward-looking statements. These statements involve known and unknown risks, uncertainties and other factors, including the factors described under “Risk Factors”, that may cause our actual results and performance to be materially different from any future results or performance expressed or implied by these forward-looking statements. Such risks and uncertainties include, among other things:
• decreases in oil and natural gas prices; • decreases in oil and natural gas industry expenditure levels, which may result from decreased oil and natural gas prices or
other factors; • increased usage of alternative fuels, which may negatively affect oil and natural gas industry expenditure levels; • U.S. and international general economic conditions; • our ability to compete successfully with other companies in our industry; • the risk that manufacturers of the products we distribute will sell a substantial amount of goods directly to end users in the
industry sectors we serve; • unexpected supply shortages; • cost increases by our suppliers; • our lack of long-term contracts with most of our suppliers; • increases in customer, manufacturer and distributor inventory levels; • suppliers’ price reductions of products that we sell, which could cause the value of our inventory to decline; • decreases in steel prices, which could significantly lower our profit; • increases in steel prices, which we may be unable to pass along to our customers which could significantly lower our
profit; • our lack of long-term contracts with many of our customers and our lack of contracts with customers that require
minimum purchase volumes; • changes in our customer and product mix; • risks related to our customers’ creditworthiness; • the potential adverse effects associated with integrating acquisitions into our business and whether these acquisitions will
yield their intended benefits; • the success of our acquisition strategies; • our significant indebtedness; • the dependence on our subsidiaries for cash to meet our debt obligations; • changes in our credit profile; • a decline in demand for certain of the products we distribute if import restrictions on these products are lifted; • environmental, health and safety laws and regulations and the interpretation or implementation thereof;

30
• the sufficiency of our insurance policies to cover losses, including liabilities arising from litigation; • product liability claims against us; • pending or future asbestos-related claims against us; • the potential loss of key personnel; • interruption in the proper functioning of our information systems; • loss of third-party transportation providers; • potential inability to obtain necessary capital; • risks related to adverse weather events or natural disasters; • impairment of our goodwill or other intangible assets; • changes in tax laws or adverse positions taken by taxing authorities in the countries in which we operate; • adverse changes in political or economic conditions in the countries in which we operate; • exposure to U.S. and international laws and regulations, including the Foreign Corrupt Practices Act and the U.K. Bribery
Act and other economic sanction programs; • risks relating to ongoing evaluations of internal controls required by Section 404 of the Sarbanes-Oxley Act; • the operation of our Company as a “controlled company”; • the impact on us of the SEC’s move toward convergence with IFRS; • adverse changes in political or economic conditions in the countries in which we operate; and • the occurrence of cybersecurity incidents.
Undue reliance should not be placed on our forward-looking statements. Although forward-looking statements reflect our good faith beliefs, reliance should not be placed on forward-looking statements because they involve known and unknown risks, uncertainties and other factors, which may cause our actual results, performance or achievements to differ materially from anticipated future results, performance or achievements expressed or implied by such forward-looking statements. We undertake no obligation to publicly update or revise any forward-looking statement, whether as a result of new information, future events, changed circumstances or otherwise, except to the extent law requires.
Overview We are the largest global industrial distributor, based on sales, of PVF and related products and services to the energy industry and hold a leading position in our industry across each of the upstream (exploration, production and extraction of underground oil and natural gas), midstream (gathering and transmission of oil and natural gas, natural gas utilities and the storage and distribution of oil and natural gas) and downstream (crude oil refining, petrochemical and chemical, processing and general industrials) sectors. Our business is segregated into three geographical operating segments, consisting of our U.S. operations, our Canadian operations and our International operations. We serve our customers in over 400 service locations. We offer a wide array of PVF and oilfield supplies encompassing a complete line of products from our global network of suppliers to our more than 18,000 customers. We are diversified by geography, the industry sectors we serve and the products we sell. We seek to provide best-in-class service to our customers by satisfying the most complex, multi-site needs of many of the largest companies in the energy and industrial sectors as their primary PVF supplier. We believe the critical role we play in our customers’ supply chain, together with our extensive product offering, broad global presence, customer-linked scalable information systems and efficient distribution capabilities, serve to solidify our long-standing customer relationships and drive our growth. As a result, we have an average relationship of over 20 years with our 25 largest customers.
Key Drivers of Our Business Our revenues are predominantly derived from the sale of PVF and other oilfield and industrial supplies to the energy sector in North America, Europe, Asia and Australasia. Our business is therefore dependent upon both the current conditions and future prospects in the energy industry and, in particular, maintenance and expansionary operating and capital expenditures by our customers in the upstream, midstream and downstream sectors of the industry. Long-term growth in spending has been, and we believe will continue to be, driven by several factors, including underinvestment in global energy infrastructure, growth in shale and unconventional exploration and production (“E&P”) activity, and anticipated strength in the oil, natural gas, refined products, petrochemical and other industrial sectors. The outlook for future oil, natural gas, refined products, petrochemical and other industrial PVF spending is influenced by numerous factors, including the following:
• Oil and Natural Gas Prices. Sales of PVF and related products to the oil and natural gas industry constitute a significant portion of our sales. As a result, we depend upon the oil and natural gas industry and its ability and willingness to make maintenance and capital expenditures to explore for, produce and process oil and natural gas and refined products. Oil and

31
natural gas prices, both current and projected, along with the costs necessary to produce oil and gas, impact other drivers of our business, including E&P spending, additions and maintenance to pipeline mileage, refinery utilization and petrochemical and other industrial processing activity.
• Economic Conditions. The demand for the products we distribute is dependent on the general economy, the energy and industrials sectors and other factors. Changes in the general economy or in the energy and industrials sectors (domestically or internationally) can cause demand for the products we distribute to materially change.
• Customer, Manufacturer and Distributor Inventory Levels of PVF and Related Products. Customer, manufacturer and distributor inventory levels of PVF and related products can change significantly from period to period. Increases in our customers’ inventory levels can have an adverse effect on the demand for the products we distribute when customers draw from their inventory rather than purchase new products. Reduced demand, in turn, would likely result in reduced sales volume and profitability. Increased inventory levels by manufacturers or other distributors can cause an oversupply of PVF and related products in the industry sectors we serve and reduce the prices that we are able to charge for the products we distribute. Reduced prices, in turn, would likely reduce our profitability. Conversely, decreased customer and manufacturer inventory levels may ultimately lead to increased demand for our products and would likely result in increased sales volumes and overall profitability.
• Steel Prices, Availability and Supply and Demand. Fluctuations in steel prices can lead to volatility in the pricing of the products we distribute, especially carbon steel tubular products, which can influence the buying patterns of our customers. A majority of the products we distribute contain various types of steel. The worldwide supply and demand for these products, or other steel products that we do not supply, impacts the pricing and availability of our products and, ultimately, our sales and operating profitability.
Recent Trends and Outlook During 2012, the average oil price of approximately $94.05 per barrel for West Texas Intermediate (“WTI”) was flat compared to 2011. Natural gas prices declined to an average price of $2.75/Mcf (Henry Hub) during 2012 from an average of $4.00/Mcf in 2011. We continue to see a shift in rig utilization from natural gas to oil, with oil drilling representing over 72% of the total North American rig count during 2012 compared to 55% in 2011.
Activity levels in the upstream sector remain strong. In the U.S., the average rig count was up 2% in 2012 as compared to 2011 although rig counts have leveled off since peaking in the fourth quarter of 2011. Continued development within the Eagle Ford and Bakken shale regions and the Permian Basin primarily drove this increase in rig count. In Canada, the average total rig count for 2012 declined 14% as compared to the same period in 2011 having peaked in the first quarter of 2012 primarily due to the decline in natural gas drilling. However, maintenance, repair and operations (“MRO”) activity, particularly in the heavy oil and oil sands regions, has remained strong, mitigating the downturn experienced in shallow natural gas drilling elsewhere in Canada.
Within the midstream sector, which includes gathering, transmission pipelines and natural gas utilities, new wells coming on line and the continued need for infrastructure within the shale basins continues to drive growth in gathering and transmission. As a result of the shift in E&P activity from natural gas to oil, we have experienced a shifting in activity from the primarily natural gas regions of the Barnett, Haynesville, Woodford and Fayetteville shales to the Marcellus, Bakken, Eagle Ford and Niobrara shales and the Permian Basin and Mississippian Lime region, which are regions producing relatively greater proportions of oil and natural gas liquids. At the same time, increasing focus on pipeline integrity work and the need for utilities to repair or replace aging pipeline infrastructure has had a similar positive impact on the gas utilities portion of our midstream business.
Our downstream and other industrials sector performance continues to improve. Within refining, market participants are experiencing higher utilization rates with corresponding need for MRO turnarounds but are still cautious with respect to major project capital spending because of international refining capacity additions and domestic demand levels. However, we believe there will continue to be increased turnaround activity by our major customers in the U.S. refining sector in 2013. The chemical portion of our downstream sector continues to experience strong levels of operational activity, driven at least in part by reduced pricing for the chemical industry’s key feedstocks, natural gas and natural gas liquids.
Internationally, we continue to see some improvement in prospects, although in Europe the outlook will be partly driven by Eurozone sentiment that will impact market confidence. Our Australasian business benefited from the March 2012 acquisition of MRC PSA. Refining customers remain cautious, particularly with the shift in production from Europe to Asia.
As part of our strategy to focus on our higher margin product lines, we continue to rebalance our OCTG business. We expect to accomplish this by continuing to reduce our OCTG inventory. Historically, this product line had contributed up to 25% of our revenue. It comprised 17% of our revenue in 2011 and 13% of our revenue in 2012.

32
Our backlog at December 31, 2012 was $664 million including $455 million, $62 million and $147 million in our US, Canadian and International segments, respectively. Our backlog at December 31, 2011 was $817 million including $631 million, $60 million and $126 million in our US, Canadian and International segments, respectively. The reduction in the U.S. 2012 backlog is primarily from repositioning the Company away from certain OCTG drilling programs.
Near the end of the fourth quarter of 2012, we experienced the impact of a general slow-down in the activities of our U.S. customers. The year-end slow down was expected, however, this year the slow down started earlier and was broader than in recent years driven in part by some of the uncertainty around the “fiscal cliff” negotiations at year end and the robustness of capital spending earlier in 2012, which may have exhausted certain customers’ capital budgets before the end of the year.
The following table shows key industry indicators for the years ended December 31, 2012, 2011 and 2010:
Year Ended December 31,
2012
2011
2010
Average Total Rig Count(1):
United States ..................................................................................... 1,919 1,875 1,546 Canada .............................................................................................. 364 422 351
Total North America ............................................................... 2,283 2,297 1,897 International ...................................................................................... 1,234 1,167 1,094
Total Worldwide ..................................................................... 3,517 3,464 2,991
Average Oil Rig Count(1):
United States ..................................................................................... 1,383 984 591 Canada .............................................................................................. 265 279 199
Total North America ............................................................... 1,648 1,263 790
Average Natural Gas Rig Count(1):
United States ..................................................................................... 557 888 943 Canada .............................................................................................. 102 141 148
Total North America ............................................................... 659 1,029 1,091
Average Commodity Prices(2):
WTI crude oil (per barrel) ................................................................. $ 94.05 $ 94.91 $ 79.48 Brent crude oil (per barrel) ............................................................... $ 111.63 $ 111.26 $ 79.61 Natural gas ($/Mcf) ........................................................................... $ 2.75 $ 4.00 $ 4.37
Average Monthly Well Permits(3): .................................................. 5,251 5,811 5,317 3:2:1 Crack Spread(4) ....................................................................... $ 30.02 $ 25.40 $ 12.92 PMI Index (as of December 1 of each year)(5) ................................ 50.7 53.1 57.3
(1) Source—Baker Hughes (www.bakerhughes.com(2) Source—Department of Energy, EIA (
) (Total rig count includes oil, natural gas and other rigs.) www.eia.gov
(3) Source—RigData (U.S.) )
(4) Source—Commodity Systems, Inc. (5) Source—Institute for Supply Management
Results of Operations for the years ended December 31, 2012, 2011 and 2010 The breakdown of our sales by sector for the years ended December 31, 2012, 2011 and 2010 was as follows (in millions):
Year Ended December 31,
2012
2011
2010
Upstream ................................................................................ $ 2,534.7 46% $ 2,257.7 47% $ 1,768.9 46% Midstream .............................................................................. 1,526.2 27% 1,269.5 26% 922.9 24% Downstream and other industrials .......................................... 1,509.9 27% 1,305.2 27% 1,153.7 30%
$ 5,570.8 100% $ 4,832.4 100% $ 3,845.5 100%

33
Our operating results by segment are as follows (in millions):
Year Ended December 31,
2012
2011
2010
Sales:
U.S. ............................................................................................. $ 4,238.4 $ 3,849.2 $ 3,124.7 Canada ........................................................................................ 765.2 653.6 465.2 International ................................................................................ 567.2 329.6 255.6
Consolidated ............................................................................... $ 5,570.8 $ 4,832.4 $ 3,845.5
Operating Income:
U.S. ............................................................................................. $ 358.3 $ 166.5 $ 60.0 Canada ........................................................................................ 27.2 17.4 (4.0) International ................................................................................ 21.5 10.7 10.4
Consolidated ............................................................................... $ 407.0 $ 194.6 $ 66.4
Year Ended December 31, 2012 Compared to the Year Ended December 31, 2011 For the years ended December 31, 2012 and 2011 the following table summarizes our results of operations (in millions):
Year Ended December 31,
$ Change
% Change
2012
2011
Sales:
U.S. ............................................................................... $ 4,238.4 $ 3,849.2 $ 389.2 10% Canada .......................................................................... 765.2 653.6 111.6 17% International ................................................................. 567.2 329.6 237.6 72%
Consolidated ....................................................... $ 5,570.8 $ 4,832.4 $ 738.4 15%
Gross profit:
U.S. ............................................................................... $ 729.1 $ 508.5 $ 220.6 43% Canada .......................................................................... 131.3 105.2 26.1 25% International ................................................................. 153.3 94.5 58.8 62%
Consolidated ....................................................... $ 1,013.7 $ 708.2 $ 305.5 43%
Selling, general and administrative expenses:
U.S. ............................................................................... $ 370.8 $ 342.0 $ 28.8 8% Canada .......................................................................... 104.1 87.8 16.3 19% International ................................................................. 131.8 83.8 48.0 57%
Consolidated ....................................................... $ 606.7 $ 513.6 $ 93.1 18%
Operating income:
U.S. ............................................................................... $ 358.3 $ 166.5 $ 191.8 115% Canada .......................................................................... 27.2 17.4 9.8 56% International ................................................................. 21.5 10.7 10.8 101%
Consolidated ....................................................... $ 407.0 $ 194.6 $ 212.4 109%
Interest expense ............................................................ (112.5) (136.8) 24.3 (18)% Loss on early extinguishment of debt ........................... (114.0) — (114.0) N/A Write off of deferred financing fees ............................. (1.7) (9.5) 7.8 (82)% Other, net ...................................................................... 2.9 7.5 (4.6) (61)% Income tax expense ...................................................... (63.7) (26.8) (36.9) 138%
Net income ................................................................... $ 118.0 $ 29.0 $ 89.0 307%
Adjusted Gross Profit(1) .............................................. $ 1,057.7 $ 849.6 $ 208.1 24%
Adjusted EBITDA(1) ................................................... $ 463.2 $ 360.5 $ 102.7 29%
(1) Adjusted Gross Profit and Adjusted EBITDA are non-GAAP financial measures. For a reconciliation of these measures to and equivalent GAAP measure, see pages 37-38 herein.

34
Sales. Sales include the revenue recognized from the sales of the products we distribute, services to customers and freight billings to customers, less cash discounts taken by customers in return for their early payment of our invoices to them. Our sales were $5,570.8 million for the year ended December 31, 2012 as compared to $4,832.4 million for the year ended December 31, 2011.
U.S. Segment—Our U.S. sales increased $389.2 million to $4,238.4 million for 2012 from $3,849.2 million for 2011. The 10% increase was due to an increase in volume related to the improved business environment, including, in particular, the upstream and midstream sectors, which have been driven by activity levels in the oil and natural gas shale regions in the U.S. The acquisition of Chaparral Supply in June 2012 contributed $37.9 million to the revenue increase.
Canadian Segment—Our Canadian sales increased $111.6 million to $765.2 million for 2012 from $653.6 million for 2011. The 17% increase was due to an increase in volume related to the improved business environment, including, in particular, the upstream sector, which was driven by activity levels in the heavy oil and oil sands regions of Canada.
International Segment—Our International sales increased $237.6 million to $567.2 million for 2012 from $329.6 million for 2012. Approximately $192 million of this increase was due to the acquisitions of MRC PSA and MRC SPF in March 2012 and June 2011, respectively, while the remainder of the increase was due to an improvement in volume in the downstream sector in Europe during 2012.
Gross Profit. Our gross profit was $1,013.7 million (18.2% of sales) for the year ended December 31, 2012 as compared to $708.2 million (14.7% of sales) for the year ended December 31, 2011. The 350 basis point improvement in gross profit percentage was driven, in part, by the impact of our LIFO inventory costing methodology which increased 2012 gross profit percentage by 40 basis points and decreased 2011 gross profit percentage by 150 basis points. Excluding the impact of LIFO, as well as depreciation and amortization of intangibles, gross profit percentage improved by 140 basis points.
U.S. Segment—Gross profit for our U.S. segment increased to $729.1 million (17.2% of sales) for 2012 from $508.5 million (13.2% of sales) for 2011. The increase of $220.6 million was significantly impacted by our LIFO inventory costing methodology which had the effect of increasing 2012 gross profit by $24.1 million and decreasing 2011 gross profit by $73.7 million. The remaining increase in gross profit of $122.8 million was due to an increase in the volume of products sold year over year. Excluding the impact of LIFO, gross profit percentage increased by 150 basis points. This improvement was attributable to a shift in our product mix away from lower margin OCTG to our higher margin product lines.
Canadian Segment—Gross profit for our Canadian segment increased to $131.3 million (17.2% of sales) for 2012 from $105.2 million (16.1% of sales) for 2011. The increase of $26.1 million was due to an increase in the volume of products sold year over year. The improvement of gross profit percentage was largely due to the volume of products sold and improved leveraging of the fixed cost component of cost of sales.
International Segment—Gross profit for our International segment increased to $153.3 million (27.0% of sales) for 2012 from $94.5 million (28.7% of sales) for 2011, an improvement of $58.8 million. The increase in gross profit was largely due to the impact of the acquisitions of MRC PSA and MRC SPF, while the remainder of the increase was due to an increase in sales, particularly in Europe. The decrease in the gross profit percentage was due to a change in product mix resulting from these acquisitions.
Certain purchasing costs and warehousing activities (including receiving, inspection, and stocking costs), as well as general warehousing expenses, are included in selling, general and administrative expenses and not in cost of sales. As such, our gross profit may not be comparable to others who may include these expenses as a component of costs of goods sold. Purchasing and warehousing activities costs approximated $34.8 million and $27.3 million for the years ended December 31, 2012 and 2011.
Adjusted Gross Profit. Adjusted Gross Profit increased to $1,057.7 million (19.0% of sales) for 2012 from $849.6 million (17.6% of sales) for 2011, an improvement of $208.1 million. Adjusted Gross Profit is a non-GAAP financial measure. We define Adjusted Gross Profit as sales, less cost of sales, plus depreciation and amortization, plus amortization of intangibles, and plus or minus the impact of our LIFO inventory costing methodology. We present Adjusted Gross Profit because we believe it is a useful indicator of our operating performance without regard to items, such as amortization of intangibles, that can vary substantially from company to company depending upon the nature and extent of acquisitions they have been involved in. Similarly, the impact of the LIFO inventory costing method can cause results to vary substantially from company to company depending upon whether they elect to utilize the LIFO method and depending upon which method they may elect. In particular, we believe that Adjusted Gross Profit is a useful indicator of our operating performance because Adjusted Gross Profit measures our Company’s operating performance without regard to acquisition transaction-related amortization expenses. We use Adjusted Gross Profit as a key performance indicator in managing our business. We believe that gross profit is the financial measure calculated and presented in accordance with U.S. generally accepted accounting principles that is most directly comparable to Adjusted Gross Profit.

35
The following table reconciles Adjusted Gross Profit with our gross profit, as derived from our financial statements (in millions):
Year Ended December 31,
2012
Percentage of Revenue
2011
Percentage of Revenue
Gross profit, as reported .................................................. $ 1,013.7 18.2% $ 708.2 14.7% Depreciation and amortization ........................................ 18.6 0.3% 17.0 0.4% Amortization of intangibles ............................................. 49.5 0.9% 50.7 1.0% (Decrease) increase in LIFO reserve ............................... (24.1) (0.4)% 73.7 1.5%
Adjusted Gross Profit ...................................................... $ 1,057.7 19.0% $ 849.6 17.6%
Selling, General and Administrative (“SG&A”) Expenses. Costs such as salaries, wages, employee benefits, rent, utilities, communications, insurance, fuel and taxes (other than state and federal income taxes) that are necessary to operate our branch and corporate operations are included in selling, general and administrative expenses. Also contained in this category are certain items that are nonoperational in nature, including certain costs of acquiring and integrating other businesses. Our selling, general and administrative expenses were $606.7 million (10.9% of sales) for the year ended December 31, 2012 as compared to $513.6 million (10.6% of sales) for the year ended December 31, 2011. U.S. Segment—SG&A for our U.S. segment increased to $370.8 million (8.7% of sales) for 2012 from $342.0 million (8.9% of sales) for 2011. The increase of $28.8 million was largely due to additional personnel costs such as headcount increases, overtime and incentives directly related to the overall increase in business activity. Canadian Segment—SG&A for our Canadian segment increased to $104.1 million (13.6% of sales) for 2012 from $87.8 million (13.4% of sales) for 2011. The increase of $16.3 million was due to additional personnel costs such as headcount increases, overtime and incentives directly related to the overall increase in business activity. Included among these costs was $7.9 million incurred under our heavy oil profit sharing arrangement with Europump, Inc. as compared to $5.8 million incurred under this profit sharing arrangement in 2011. International Segment— SG&A for our International segment increased to $131.8 million (23.3% of sales) for 2012 from $83.8 million (25.4% of sales) in 2011. The $48.0 million increase was driven by the acquisition of MRC PSA, which had SG&A expenses of $34.4 million during 2012, combined with the impact of incremental expenses of approximately $5.9 million for MRC SPF which was acquired in June 2011. Operating Income. Operating income was $407.0 million for the year ended December 31, 2012, as compared to operating income of $194.6 million for the year ended December 31, 2011, an improvement of $212.4 million. U.S. Segment—Operating income for our U.S. segment increased to $358.3 million for 2012 from $166.5 million for 2011. The improvement of $191.8 million was driven by a $220.6 million increase in gross profit offset by a $28.8 million increase in selling, general and administrative expenses. Canadian Segment—Operating income for our Canadian segment increased to $27.2 million for 2012 from $17.4 million for 2011. The improvement of $9.8 million was driven by a $26.1 million increase in gross profit offset by a $16.3 million increase in selling, general and administrative expenses. International Segment—Operating income for our International segment increased to $21.5 million for 2012 from $10.7 million in 2011. The $10.8 million improvement was driven by a $58.8 million improvement in gross profit that was largely offset by an $48.0 million increase in selling, general and administrative expenses that was principally the result of our March 2012 acquisition of MRC PSA. Interest Expense. Our interest expense was $112.5 million for the year ended December 31, 2012 as compared to $136.8 million for the year ended December 31, 2011. The decrease in interest expense was primarily due to a reduction of our weighted average interest rate. In a series of transactions from June to September 2012, we purchased in the open market $188.7 million in principal amount of our 9.50% senior secured notes due 2016 using our lower interest rate global asset-based lending facility (“Global ABL Facility”) to fund the purchases. In November 2012, we redeemed the remaining $861.3 million of senior secured notes utilizing proceeds from a new lower rate $650 million term loan (“Term Loan”) together with a draw under our Global ABL Facility. Other Income (Expense). During 2012, in various transactions, we purchased $188.7 million of our senior secured notes in the open market. In November 2012, we redeemed the remaining $861.3 million of senior secured notes outstanding. The purchase and redemption of the senior secured notes resulted in a loss on the early extinguishment of debt of $114.0 million. In March 2012, we refinanced certain of our credit facilities. As a result of their termination, we wrote off and expensed $1.7 million in debt issuance costs.

36
Income Tax Expense. Our income tax expense was $63.7 million for the year ended December 31, 2012, as compared to $26.8 million for the year ended December 31, 2011. Our effective tax rates were 35.1% and 48.0% for the years ended December 31, 2012 and 2011. These rates generally differ from the federal statutory rate of 35% principally as a result of state income taxes and differing foreign income tax rates. The 2011 effective tax rate of 48.0% includes adjustments made in the fourth quarter of $4.0 million in deferred income tax expense required to recognize a higher rate at which we expect certain deferred taxes in the Netherlands and Canada to be realized, and an additional $3.9 million in current income tax expense related to the taxation of our foreign operations primarily caused by a geographic shift in taxable income in different jurisdictions.
Net Income. Our net income was $118.0 million for the year ended December 31, 2012 as compared to net income of $29.0 million for the year ended December 31, 2011, an improvement of $89.0 million.
Adjusted EBITDA. We define Adjusted EBITDA as net income plus interest, income taxes, depreciation and amortization, amortization of intangibles and other non-cash charges (such as gains/losses on the early extinguishment of debt, changes in the fair value of derivative instruments and goodwill impairment) and plus or minus the impact of our LIFO inventory costing methodology. Adjusted EBITDA, a non-GAAP financial measure, was $463.2 million for the year ended December 31, 2012, as compared to $360.5 million for the year ended December 31, 2011. Our Adjusted EBITDA increased $102.7 million over that period primarily due to the increase in gross profit and other factors noted above.
We believe adjusted EBITDA provides investors a helpful measure for comparing our operating performance with the performance of other companies that have different financing and capital structures or tax rates. We believe that net income is the financial measure calculated and presented in accordance with U.S. generally accepted accounting principles that is most directly comparable to Adjusted EBITDA.
The following table reconciles Adjusted EBITDA with our net income, as derived from our financial statements (in millions):
Year Ended December 31,
2012
2011
Net income ....................................................................................... $ 118.0 $ 29.0 Income tax expense .......................................................................... 63.7 26.8 Interest expense ................................................................................ 112.5 136.8 Loss on early extinguishment of debt............................................... 114.0 — Write off of debt issuance costs ....................................................... 1.7 9.5 Depreciation and amortization ......................................................... 18.6 17.0 Amortization of intangibles .............................................................. 49.5 50.7 Change in fair value of derivative instruments................................. (2.2) (7.0) Share based compensation expense .................................................. 8.5 8.4 Legal and consulting expenses ......................................................... (1.2) 9.9 Joint venture termination .................................................................. — 1.7 Pension settlement ............................................................................ 4.4 — Other expenses ................................................................................. (0.2) 4.0 LIFO ................................................................................................. (24.1) 73.7
Adjusted EBITDA ............................................................................ $ 463.2 $ 360.5

37
Year Ended December 31, 2011 Compared to the Year Ended December 31, 2010 For the years ended December 31, 2011 and 2010 the following table summarizes our results of operations (in millions):
Year Ended December 31,
$ Change
% Change
2011
2010
Sales:
U.S. ............................................................................. $ 3,849.2 $ 3,124.7 $ 724.5 23% Canada ........................................................................ 653.6 465.2 188.4 40% International ............................................................... 329.6 255.6 74.0 29%
Consolidated ..................................................... $ 4,832.4 $ 3,845.5 $ 986.9 26%
Gross profit:
U.S. ............................................................................. $ 508.5 $ 378.8 $ 129.7 34% Canada ........................................................................ 105.2 63.9 41.3 65% International ............................................................... 94.5 75.4 19.1 25%
Consolidated ..................................................... $ 708.2 $ 518.1 $ 190.1 37%
Selling, general and administrative expenses:
U.S. ............................................................................. $ 342.0 $ 318.8 $ 23.2 7% Canada ........................................................................ 87.8 67.9 19.9 29% International ............................................................... 83.8 65.0 18.8 29%
Consolidated ..................................................... $ 513.6 $ 451.7 $ 61.9 14%
Operating income:
U.S. ............................................................................. $ 166.5 $ 60.0 $ 106.5 178% Canada ........................................................................ 17.4 (4.0) 21.4 N/A International ............................................................... 10.7 10.4 0.3 3%
Consolidated ..................................................... $ 194.6 $ 66.4 $ 128.2 193%
Interest expense .......................................................... (136.8) (139.6) 2.8 (2)% Write off of deferred financing fees ........................... (9.5) — (9.5) N/A Other, net .................................................................... 7.5 (2.0) 9.5 475% Income tax (expense) benefit ..................................... (26.8) 23.4 (50.2) (215)%
Net income (loss) ....................................................... $ 29.0 $ (51.8) $ 80.8 156%
Adjusted Gross Profit(1) ............................................ $ 849.6 $ 663.2 $ 186.4 28%
Adjusted EBITDA(1) ................................................. $ 360.5 $ 224.2 $ 136.3 61%
(1) Adjusted Gross Profit and Adjusted EBITDA are non-GAAP financial measures. For a reconciliation of these measures to and equivalent GAAP measure, see pages 40-42 herein.
Sales. Our sales were $4,832.4 million for the year ended December 31, 2011 as compared to $3,845.5 million for the year ended December 31, 2010.
U.S. Segment—Our U.S. sales increased $724.5 million to $3,849.2 million for 2011 from $3,124.7 million for 2010. The 23% increase was due to an increase in volume related to the improved business environment including, in particular, the upstream and midstream sectors, which were driven by activity levels in the oil and natural gas shale regions in the U.S..
Canadian Segment—Our Canadian sales increased $188.4 million to $653.6 million for 2011 from $465.2 million for 2010. The 40% increase was due to an increase in volume related to the improved business environment including, in particular, the upstream sector, which was driven by activity levels in the heavy oil and oil sands regions of Canada.
International Segment—Our International sales increased $74.0 million to $329.6 million for 2011 from $255.6 million for 2010. Approximately $56 million of this increase was due to the acquisition of MRC SPF in June 2011, while the remainder of the increase was due to an improvement in volume in the downstream sector in Europe during 2011.

38
Gross Profit. Our gross profit was $708.2 million (14.7% of sales) for the year ended December 31, 2011 as compared to $518.1 million (13.5% of sales) for the year ended December 31, 2010. The 120 basis point improvement in gross profit percentage reflected the growth in sales, relative to certain costs such as depreciation and amortization, amortization of intangibles, and the impact of our LIFO inventory costing methodology, which were not directly related to activity levels and which remained relatively consistent from period to period. Excluding the impact of these items, gross profit percentage improved by 40 basis points.
U.S. Segment—Gross profit for our U.S. segment increased to $508.5 million (13.2% of sales) for 2011 from $378.8 million (12.1% of sales) for 2010. The increase of $129.7 million was due to an increase in the volume of products sold year over year. The rig count increased 21% for that same period.
Canadian Segment—Gross profit for our Canadian segment increased to $105.2 million (16.1% of sales) for 2011 from $63.9 million (13.7% of sales) for 2010. The increase of $41.3 million was due to an increase in the volume of products sold year over year. The rig count increased 20% for that same period.
International Segment—Gross profit for our International segment increased to $94.5 million (28.7% of sales) for 2011 from $75.4 million (29.5% of sales) for 2010, an improvement of $19.1 million. The increase in gross profit was largely due to the acquisition of MRC SPF in June 2011, while the remainder of the increase was due to an increase in sales, particularly in Europe. The decrease in the gross profit percentage was due to the mix of products changing as a result of the acquisition of MRC SPF.
Purchasing and warehousing activities costs included in SG&A rather than cost of sales approximated $27.3 million and $25.5 million for the years ended December 31, 2011 and 2010.
Adjusted Gross Profit. Adjusted Gross Profit increased to $849.6 million (17.6% of sales) for 2011 from $663.2 million (17.2% of sales) for 2010, an improvement of $186.4 million. Adjusted Gross Profit is a non-GAAP financial measure. We define Adjusted Gross Profit as sales, less cost of sales, plus depreciation and amortization, plus amortization of intangibles, and plus or minus the impact of our LIFO inventory costing methodology. We present Adjusted Gross Profit because we believe it is a useful indicator of our operating performance without regard to items, such as amortization of intangibles, that can vary substantially from company to company depending upon the nature and extent of acquisitions they have been involved in. Similarly, the impact of the LIFO inventory costing method can cause results to vary substantially from company to company depending upon whether they elect to utilize the LIFO method and depending upon which method they may elect. In particular, we believe that Adjusted Gross Profit is a useful indicator of our operating performance because Adjusted Gross Profit measures our Company’s operating performance without regard to acquisition transaction-related amortization expenses. We use Adjusted Gross Profit as a key performance indicator in managing our business. We believe that gross profit is the financial measure calculated and presented in accordance with U.S. generally accepted accounting principles that is most directly comparable to Adjusted Gross Profit.
The following table reconciles Adjusted Gross Profit with our gross profit, as derived from our financial statements (in millions):
Year Ended December 31,
2011
Percentage of Revenue
2010
Percentage of Revenue
Gross profit, as reported ..................................................... $ 708.2 14.7% $ 518.1 13.5% Depreciation and amortization ........................................... 17.0 0.4% 16.6 0.4% Amortization of intangibles ................................................ 50.7 1.0% 53.9 1.4% Increase in LIFO reserve .................................................... 73.7 1.5% 74.6 1.9%
Adjusted Gross Profit ......................................................... $ 849.6 17.6% $ 663.2 17.2%
Selling, General and Administrative (“SG&A”) Expenses. Our selling, general and administrative expenses were $513.6 million (10.6% of sales) for the year ended December 31, 2011 as compared to $451.7 million (11.7% of sales) for the year ended December 31, 2010.
U.S. Segment—SG&A for our U.S. segment increased to $342.0 million (8.9% of sales) for 2011 from $318.8 million (10.2% of sales) for 2010. The increase of $23.2 million was largely due to additional personnel costs such as overtime and incentives directly related to the overall increase in business activity.
Canadian Segment—SG&A for our Canadian segment increased to $87.8 million (13.4% of sales) for 2011 from $67.9 million (14.6% of sales) for 2010. The increase of $19.9 million was due to additional personnel costs such as overtime and incentives directly related to the overall increase in business activity. Included in these costs was $5.7 million incurred under our heavy oil profit sharing arrangement with Europump, Inc. as compared to $1.1 million incurred under this profit sharing arrangement in 2010.

39
International Segment— SG&A for our International segment increased to $83.8 million (25.4% of sales) for 2011 from $65.0 million (25.4% of sales) in 2011. The $18.8 million increase was driven by the June 2011 acquisition of MRC SPF, which had SG&A expenses of $12.3 million.
Operating Income. Operating income was $194.6 million for the year ended December 31, 2011 as compared to operating income of $66.4 million for the year ended December 31, 2010, an improvement of $128.2 million.
U.S. Segment—Operating income for our U.S. segment increased to $166.5 million for 2011 from $60.0 million for 2010. The improvement of $106.5 million was driven by a $129.7 million increase in gross profit offset by a $23.2 million increase in selling, general and administrative expenses.
Canadian Segment—Operating income for our Canadian segment increased to $17.4 million for 2011 from an operating loss of $4.0 million for 2010. The improvement of $21.4 million was driven by a $41.3 million increase in gross profit offset by a $19.9 million increase in selling, general and administrative expenses.
International Segment—Operating income for our International segment increased to $10.7 million for 2011 from $10.4 million in 2010. The $0.3 million improvement was driven by a $19.1 million improvement in gross profit that was largely offset by an $18.8 million increase in selling, general and administrative expenses that was principally the result of our mid-year acquisition of MRC SPF.
Interest Expense. Our interest expense was $136.8 million for the year ended December 31, 2011 as compared to $139.6 million for the year ended December 31, 2010.
Other Income (Expense). We may use derivative instruments from time to time to help manage our exposure to interest rate risks and certain foreign currency risks. The change in the fair market value of our derivatives resulted in earnings of $7.0 million and losses of $4.9 million during the years ended December 31, 2011 and 2010, respectively. In June 2011, we refinanced certain of our credit facilities. As a result of their termination, we wrote off and expensed $9.5 million in deferred financing costs.
Income Tax (Expense) Benefit. Our income tax expense was $26.8 million for the year ended December 31, 2011, as compared to an income tax benefit of $23.4 million for the year ended December 31, 2010. Our effective tax rates were 48.0% and 31.1% for the years ended December 31, 2011 and 2010. These rates generally differ from the federal statutory rate of 35% principally as a result of state income taxes and differing foreign income tax rates. The 2011 effective tax rate of 48.0% includes adjustments made in the fourth quarter of $4.0 million in deferred income tax expense required to recognize a higher rate at which we expect certain deferred taxes in the Netherlands and Canada to be realized, and an additional $3.9 million in current income tax expense related to the taxation of our foreign operations primarily caused by a geographic shift in taxable income in different jurisdictions.
Net Income (Loss). Our net income was $29.0 million for the year ended December 31, 2011 as compared to a $51.8 million net loss for the year ended December 31, 2010, an improvement of $80.8 million.
Adjusted EBITDA. We define Adjusted EBITDA as net income plus interest, income taxes, depreciation and amortization, amortization of intangibles and other non-cash charges (such as gains/losses on the early extinguishment of debt, changes in the fair value of derivative instruments and goodwill impairment) and plus or minus the impact of our LIFO inventory costing methodology. Adjusted EBITDA, a non-GAAP financial measure, was $360.5 million for the year ended December 31, 2011, as compared to $224.2 million for the year ended December 31, 2010. Our Adjusted EBITDA increased $136.3 million over that period primarily due to the increase in gross profit and other factors noted above.
We believe adjusted EBITDA provides investors a helpful measure for comparing our operating performance with the performance of other companies that have different financing and capital structures or tax rates. We believe that net income (loss) is the financial measure calculated and presented in accordance with U.S. generally accepted accounting principles that is most directly comparable to Adjusted EBITDA.

40
The following table reconciles Adjusted EBITDA with our net income (loss), as derived from our financial statements (in millions):
Year Ended December 31,
2011
2010
Net income (loss) ............................................................................ $ 29.0 $ (51.8) Income tax (benefit) expense .......................................................... 26.8 (23.4) Interest expense ............................................................................... 136.8 139.6 Write off of debt issuance costs ...................................................... 9.5 — Depreciation and amortization ........................................................ 17.0 16.6 Amortization of intangibles ............................................................. 50.7 53.9 Change in fair value of derivative instruments................................ (7.0) 4.9 Share based compensation expense ................................................. 8.4 3.7 Legal and consulting expenses ........................................................ 9.9 4.2 Joint venture termination ................................................................. 1.7 — Other expenses ................................................................................ 4.0 1.9 Increase in LIFO reserve ................................................................. 73.7 74.6
Adjusted EBITDA ........................................................................... $ 360.5 $ 224.2
Financial Condition and Cash Flows Financial Condition The following table sets forth selected balance sheet data for the periods indicated below (in millions):
December 31, 2012
December 31, 2011
December 31, 2010
Inventory ...................................................................... $ 970.2 $ 899.1 $ 765.4 Working capital ........................................................... 1,200.5 1,074.7 842.6 Long-term debt, including current portion ................... 1,256.6 1,526.7 1,360.2
Since 2010, we have emphasized a shift in our sales to higher gross profit products. Typically, OCTG (within our energy carbon steel tubular product portfolio) has generated the lowest gross profit. In alignment with this shift in emphasis, we have been re-balancing our inventories. At December 31, 2012, our energy carbon steel tubular products constituted approximately 34% of our inventory balance, down from 45% at the end of 2010. Conversely, our valves, fittings, flanges and all other products, which typically generate a higher gross profit, comprised 66% of our inventory at December 31, 2012, up from 55% at the end of 2010.
Our working capital increased 11.7% from 2011 to 2012, as higher business activity levels drove volume related growth in inventories and accounts receivable. We closely monitor our working capital position to have the appropriate flexibility for our operations.
Cash Flows The following table sets forth our cash flows for the periods indicated below (in millions):
Year Ended December 31,
2012
2011
2010
Net cash provided by (used in):
Operating activities .................................................................. $ 240.1 $ (102.9) $ 112.7 Investing activities ................................................................... (183.0) (48.0) (16.2) Financing activities .................................................................. (60.5) 140.6 (98.2)
Net (decrease) increase in cash and cash equivalents ........................ $ (3.4) $ (10.3) $ (1.7)
Effect of foreign exchange rate on cash ............................................. $ (5.6) $ 0.3 $ 1.7
Operating Activities Net cash provided by operating activities was $240.1 million in 2012, compared to net cash used in operating activities of $102.9 million in 2011. The net cash provided by operations was primarily the result of significantly improved profitability excluding non-cash charges and slower growth in working capital.

41
Net cash used in operating activities was $102.9 million in 2011, compared to net cash provided by operating activities of $112.7 million in 2010. The increase in net cash used in operations was primarily the result of an increase in working capital required to meet the demands of increased business activity levels. Increased investment in working capital is typical in our business during periods of growth.
Investing Activities Net cash used in investing activities was $183.0 million in 2012, compared to $48.0 million in 2011. The $135.0 million increase in net cash used in investing activities was primarily due to the 2012 acquisitions of MRC PSA, PSS and Chaparral Supply. Our capital expenditures as a percentage of sales were 0.5% in 2012 and 0.4% in 2011. We believe that this level of capital expenditures is typical for our business.
Net cash used in investing activities was $48.0 million in 2011, compared to $16.2 million in 2010. The $31.8 million increase in net cash used in investing activities was primarily due to the 2011 acquisitions of MRC SPF and Valve Systems and Controls. Our capital expenditures excluding acquisitions as a percentage of sales were 0.4% in both 2011 and 2010.
Financing Activities Net cash used in financing activities was $60.5 million in 2012, compared to $140.6 million provided by financing activities in 2011. In 2012, we received net proceeds of $333.3 million from our initial public offering and $644 million at closing from borrowings under our $650 million Term Loan. We used $1.1 billion to redeem our outstanding senior secured notes with proceeds from borrowings under our Global ABL Facility as well as our Term Loan.
Net cash provided by financing activities was $140.6 million in 2011, compared to net cash used in financing activities of $98.2 million used in 2010. These activities generally reflected advances and payments on our revolving credit facilities. In 2011, we advanced $150.4 million under such facilities to fund growth in working capital in addition to the acquisitions of MRC SPF and VSC. By contrast, in 2010 we repaid $141.9 million under these facilities reflecting our efforts to reduce working capital, particularly inventory, in a weaker business environment.
Liquidity and Capital Resources Our primary sources of liquidity consist of cash generated from our operating activities, existing cash balances and borrowings under our existing Global ABL Facility. Our ability to generate sufficient cash flows from our operating activities will continue to be primarily dependent on our sales of products to our customers at profits sufficient to cover our fixed and variable expenses. As of December 31, 2012 and 2011, we had cash and cash equivalents of $37.1 million and $46.1 million, respectively. As of December 31, 2012 and 2011, $27.9 million and $41.0 million of our cash and cash equivalents was maintained in the accounts of our various foreign subsidiaries and, if such amounts were transferred among countries or repatriated to the U.S., such amounts may be subject to additional tax liabilities, which would be recognized in our financial statements in the period during which such decision was made. We currently have the intent and ability to permanently reinvest the cash held by our foreign subsidiaries and there are currently no plans for the repatriation of such amounts. In April 2012, we completed an initial public offering, which generated net proceeds to us of approximately $333.3 million. These proceeds were net of a $21.5 million underwriting discount of which $9.3 million was paid to Goldman, Sachs & Co. as a co-lead bookrunner. The proceeds of the offering were used to pay down borrowings on our Global ABL Facility. In a series of transactions from June to September 2012, we purchased in the open market $188.7 million in principal of our 9.50% senior secured notes due 2016 for $205.0 million. The purchases were funded with borrowings under our Global ABL Facility, and the weighted average price of these purchases was $108.65 per $100 of principal amount. We incurred a pre-tax loss on the purchase of the senior secured notes of $21.7 million related to the purchase premium, the write off of unamortized deferred financing costs and the write off of original discount. In November 2012, we redeemed the remaining $861.3 million of senior secured notes utilizing proceeds of the Company’s new $650 million Term Loan together with a draw under our Global ABL Facility. The early redemption required the payment of a premium of $68.9 million. When combined with the write off of unamortized deferred financing costs and the write off of original issue discount, this redemption resulted in a pre-tax loss of $92.2 million. Our credit facilities consist of a seven-year $650 million Term Loan maturing in November 2019 and a five year $1.25 billion Global ABL Facility maturing in March 2017. The Global ABL Facility provides for borrowings of up to $977 million in the United States, $170 million in Canada, $12 million in the United Kingdom, $75 million in Australia, $9 million in the Netherlands and $7 million in Belgium. The Global ABL Facility contains an accordion feature that allows us to increase the principal amount of the facility by up to $300 million. As of December 31, 2012, we had $429.6 million available under this Global ABL Facility, which represented approximately a $154.1 million decrease in availability under similar facilities at December 31, 2011. As noted above, our ability to transfer funds among countries could be hampered by additional tax liabilities imposed as a result of these transfers.

42
Our credit ratings are below “investment grade” and as such could impact both our ability to raise new funds as well as the interest rates on our future borrowings. Our ability to incur additional debt is restricted by our existing obligations. We were in compliance with the covenants contained in our various credit facilities as of and during the year ended December 31, 2012. We believe our sources of liquidity will be sufficient to satisfy the anticipated cash requirements associated with our existing operations for at least the next twelve months. However, our future cash requirements could be higher than we currently expect as a result of various factors. Additionally, our ability to generate sufficient cash from our operating activities depends on our future performance, which is subject to general economic, political, financial, competitive and other factors beyond our control. We may from time to time seek to raise additional debt or equity financing in the public or private markets, based on market conditions. There can be no assurance that we will be able to raise any such financing on terms acceptable to us or at all. We may also seek, from time to time, depending on market conditions, to refinance certain categories of our debt. From time to time, we may seek to consummate equity offerings. Any such transaction would be subject to market conditions, compliance with all of our credit agreements, and various other factors.
Contractual Obligations, Commitments and Contingencies Contractual Obligations The following table summarizes our minimum payment obligations as of December 31, 2012 relating to long-term debt, interest payments, capital leases, operating leases, purchase obligations and other long-term liabilities for the periods indicated (in millions):
Total
2013
2014-2015
2016-2017
More Than 5 Years
Long-term debt(1) ........................................................................ $ 1,256.6 $ 6.5 $ 19.6 $ 621.0 $ 609.5 Interest payments(2)..................................................................... 325.9 53.9 106.4 94.7 70.9 Capital leases ............................................................................... 2.1 0.5 0.6 0.3 0.7 Operating leases ........................................................................... 127.5 35.9 55.6 20.7 15.3 Purchase obligations(3) ................................................................ 343.0 343.0 — — — Other long-term liabilities ............................................................ 20.3 — — — 20.3
Total ............................................................................................. $ 2,075.4 $ 439.8 $ 182.2 $ 736.7 $ 716.7
(1) Long-term debt is based on debt outstanding on December 31, 2012. (2) Interest payments are based on interest rates in effect at December 31, 2012 and assume contractual amortization payments. (3) Purchase obligations reflect our commitments to purchase PVF products in the ordinary course of business. While our vendors
often allow us to cancel these purchase orders without penalty, in certain cases cancellations may subject us to cancellation fees or penalties, depending on the terms of the contract.
We historically have been an acquisitive company. We expect to fund future acquisitions primarily from (i) borrowings, either the unused portion of our facilities or new debt issuances, (ii) cash provided by operations, or (iii) the issuance of additional equity in connection with the acquisitions.
Description of Our Indebtedness Senior Secured Term Loan B In November 2012, we entered into a new $650 million seven-year Term Loan B (the “Term Loan”), with Bank of America N.A. as administrative agent, and other lenders from time to time parties thereto. The proceeds of the new Term Loan, together with a draw under the Company’s Global ABL Facility, were used to redeem all of McJunkin Red Man Corporation’s outstanding 9.50% Senior Secured Notes due 2016 (the “Notes”), totaling approximately $861.3 million. Accordion. The Term Loan allows for incremental increases up to an aggregate of $200 million, plus an additional amount such that the Company’s senior secured leverage ratio (the ratio of the Company’s Consolidated EBITDA (as defined under the Term Loan) to senior secured debt) (net of up to $75 million of unrestricted cash) would not exceed 3.50 to 1.00. Maturity. The scheduled maturity date of the Term Loan is November 9, 2019. The Term Loan will amortize in equal quarterly installments at 1% a year with the payment of the balance at maturity. Guarantees. The Term Loan is guaranteed by the Company and all of the U.S. borrower’s current and future wholly owned material U.S. subsidiaries, subject to certain exceptions. Security. The Term Loan is secured by a first lien on all of the Company’s assets and the assets of its domestic subsidiaries, subject to certain exceptions and other than the collateral securing the Global ABL Facility (which includes accounts receivable, inventory and related assets, collectively, the “ABL collateral”), and by a second lien on the ABL collateral. In addition, the Term Loan is secured by a pledge of all the capital stock of the Company’s domestic subsidiaries and 65% of the capital stock of its first tier foreign subsidiaries, subject to certain exceptions.

43
Interest Rates and Fees. The Company has the option to pay interest at a base rate, subject to a floor of 2.25%, plus an applicable margin, or at a rate based on LIBOR, subject to a floor of 1.25%, plus an applicable margin. The applicable margin for base rate loans is 400 basis points and the applicable margin for LIBOR loans is 500 basis points. The margin will step down by 25 basis points if the Company’s consolidated total leverage ratio (as defined under the Term Loan) is less than 2.50 to 1.00.
Voluntary Prepayment. The Company is able to voluntarily prepay the principal without penalty or premium, other than a 1% premium in the first year for re-pricing transactions only.
Mandatory Prepayment. The Company is required to repay the Term Loan with certain asset sale and insurance proceeds, certain debt proceeds and 50% of excess cash flow (reducing to 25% if the Company’s senior secured leverage ratio is no more than 2.75 to 1.00 and 0% if the Company’s senior secured leverage ratio is no more than 2.50 to 1.00).
Restrictive Covenants. The Term Loan does not include any financial covenants.
The Term Loan contains restrictive covenants (in each case, subject to exclusions) that limit, among other things, the ability of the Company and its restricted subsidiaries (including the Borrower) to:
• make investments; • prepay certain indebtedness; • grant liens; • incur additional indebtedness; • sell assets; • make fundamental changes; • enter into transactions with affiliates; and • in the case of the Company, to pay dividends.
The Term Loan also contains other customary restrictive covenants. The covenants are subject to various baskets and materiality thresholds, with certain of the baskets permitted by the restrictions on the repayment of subordinated indebtedness, restricted payments and investments being available only when the senior secured leverage ratio of the Company and its restricted subsidiaries is less than 3.25:1.00.
The Term Loan provides that the Company and its restricted subsidiaries may incur any first lien indebtedness that is pari passu to the Term Loan so long as the pro forma senior secured leverage ratio of the Company and its restricted subsidiaries is less than or equal to 3.50:1.00. The Company and its restricted subsidiaries may incur any second lien indebtedness so long as the pro forma junior secured leverage ratio of the Company and its restricted subsidiaries is less than or equal to 4.00:1.00. The Company and its restricted subsidiaries may incur any unsecured indebtedness so long as the total leverage ratio of the Company and its restricted subsidiaries is less than or equal to 5.00:1.00. Additionally, under the Term Loan, the Company and its restricted subsidiaries may incur indebtedness under the Global ABL Facility (or any replacement facility) in an amount not to exceed the greater of $1.3 billion and a Borrowing Base (equal to, subject to certain exceptions, 85% of all accounts receivable and 65% of the book value of all inventory owned by the Company and its restricted subsidiaries).
The Term Loan contains certain customary representations and warranties, affirmative covenants and events of default, including, among other things, payment defaults, breaches of representations and warranties, covenant defaults, cross-defaults to certain indebtedness, certain events of bankruptcy, certain events under ERISA, judgment defaults, actual or asserted failure of any material guaranty or security documents supporting the Term Loan to be in full force and effect and change of control. If such an event of default occurs, the Agent under the Term Loan is entitled to take various actions, including the acceleration of amounts due under the Term Loan and all other actions that a secured creditor is permitted to take following a default.
Global ABL Credit Facility In March 2012, we entered into a new multi-currency global asset-based revolving credit facility (the “Global ABL Facility”) which replaced our then existing asset-based lending credit facility (“ABL Credit Facility”), our MRC Transmark term loan and revolving credit facility and our MRC Transmark overdraft facility. The five-year Global ABL Facility is comprised of $1.25 billion of total revolving credit facilities, including $977 million in the United States, $170 million in Canada, $12 million in the United Kingdom, $75 million in Australia, $9 million in the Netherlands and $7 million in Belgium. The facility contains an accordion feature that allows us to increase the principal amount of the facility by up to $300 million.

44
Each of our current and future wholly owned material U.S. subsidiaries and MRC Global Inc. guarantees the obligations of our borrower subsidiaries under the Global ABL Facility. Additionally, each of our non-U.S. borrower subsidiaries guarantees the obligations of our other non-U.S. borrower subsidiaries under the Global ABL Facility.
Obligations under the U.S. tranche are primarily secured, subject to certain exceptions, by a first-priority security interest in the accounts receivable, inventory and related assets of our wholly owned, material U.S. subsidiaries. The obligations of any of our non-U.S. borrower subsidiaries are primarily secured, subject to certain exceptions, by a first-priority security interest in the accounts receivable, inventory and related assets of the non-U.S. subsidiary and our wholly owned material U.S. subsidiaries.
No non-U.S. subsidiary guarantees the U.S. tranche and no property of our non-U.S. subsidiaries secures the U.S. tranche. The security interest in accounts receivable, inventory and related assets of the U.S. borrower subsidiaries ranks prior to the security interest in this collateral which secures the Term Loan.
Each of our non-U.S. borrower subsidiaries has a separate stand alone borrowing base that limits the non-U.S. subsidiary’s ability to borrow under its respective tranche, provided that the non-U.S. subsidiaries may utilize excess availability under the U.S. tranche to borrow amounts in excess of their respective borrowing bases (but not to exceed the applicable commitment amount for the foreign subsidiary’s jurisdiction), which utilization will reduce availability under the U.S. tranche dollar for dollar.
Subject to the foregoing, our ability to borrow in each jurisdiction, other than Belgium, under the Global ABL Facility is limited by a borrowing base in that jurisdiction equal to 85% of eligible receivables, plus the lesser of 70% of eligible inventory and 85% of appraised net orderly liquidation value of the inventory. In Belgium, our borrowing is limited by a borrowing base determined under Belgian law.
U.S. borrowings under the facility bear interest at LIBOR plus a margin varying between 1.50% and 2.00% based on our fixed charge coverage ratio. Borrowings by our foreign borrower subsidiaries are generally subject to the same interest rate margins with the benchmark rate for such borrowings varying based on the currency in which such borrowings are made.
Other Commitments In the normal course of business with customers, vendors and others, we are contingently liable for performance under standby letters of credit and bid, performance and surety bonds. We were contingently liable for approximately $40.4 million of standby letters of credit, trade guarantees given by bankers and bid, performance and surety bonds at December 31, 2012. Management does not expect any material amounts to be drawn on these instruments.
Legal Proceedings Asbestos Claims. We are involved in various legal proceedings and claims, both as a plaintiff and a defendant, which arise in the ordinary course of business. These legal proceedings include claims that individuals brought against a large number of defendant entities, including us, seeking damages for injuries that certain products containing asbestos allegedly caused. As of December 31, 2012, we are a defendant in lawsuits involving approximately 885 of these claims. Each claim involves allegations of exposure to asbestos-containing materials by an individual or his or her family members. The complaints typically name many defendants. In a majority of these lawsuits, little or no information is known regarding the nature of the plaintiff’s alleged injuries or their connection with products that we distributed. Through December 31, 2012, lawsuits involving 11,975 claims have been brought against us. No asbestos lawsuit has resulted in a judgment against us to date, with the majority being settled, dismissed or otherwise resolved. In total, since the first asbestos claim brought against us in 1984 through December 31, 2012, approximately $2.0 million has been paid to asbestos claimants in connection with settlements of claims against us without regard to insurance recoveries. Of this amount, approximately $1.5 million has been paid to settle claims alleging mesothelioma, $0.4 million for claims alleging lung cancer and $0.1 million for non-malignant claims. The following chart summarizes, for each year since 2008, the approximate number of pending claims, new claims, settled claims, dismissed claims, and approximate total settlement payments, average settlement amount and total defense costs:
Claims Pending at End of Period
Claims Filed
Claims Settled
Claims Dismissed
Settlement Payments
$
Average Settlement
Amount $
Defense Costs
$
Fiscal year ended December 31, 2008 ........ 846 43 16 6 295,500 18,469 336,497 Fiscal year ended December 31, 2009 ........ 905 81 12 10 193,500 16,125 463,213 Fiscal year ended December 31, 2010 ........ 948 89 28 18 481,000 17,179 604,565 Fiscal year ended December 31, 2011 ........ 981 96 33 30 571,500 17,318 562,964 Fiscal year ended December 31, 2012 ........ 885 144 27 213 467,500 17,315 631,500

45
As the table above shows, there has been an increase in the number of claims filed since the fiscal year ending December 31, 2008. We believe that this increase is primarily due to an increase in the marketing efforts by personal injury law firms in West Virginia and Pennsylvania. Although we do not know whether this is a trend that will continue in the near term, in the long term, we anticipate that asbestos-related litigation against us will decrease as the incidence of asbestos-related disease in the general U.S. population decreases.
We annually conduct analyses of our asbestos-related litigation to estimate the adequacy of the reserve for pending and probable asbestos-related claims. These analyses consist of separately estimating our reserve with respect to pending claims (both those scheduled for trial and those for which a trial date had not been scheduled), mass filings (including lawsuits brought in West Virginia each involving many, in some cases over a hundred, plaintiffs, which include little information regarding the nature of each plaintiff’s claim and historically have rarely resulted in any payments to plaintiff) and probable future claims. A key element of the analysis is categorizing our claims by the type of disease the plaintiffs allege and developing “benchmark” estimated settlement values for each claim category based on our historical settlement experience. These estimated settlement values are applied to each of our pending individual claims. With respect to pending claims where the disease type is unknown, the outcome is projected based on historic experience. The reserve with respect to mass filings is estimated by determining the number of individual plaintiffs included in the mass filings likely to have claims resulting in settlements based on our historical experience with mass filings. Finally, we estimate the value of probable claims that plaintiffs may assert against us over the next 15 years based on public health estimates of future incidences of certain asbestos-related diseases in the general U.S. population. Estimated settlement values are applied to those projected claims. Our annual assessment, dated December 31, 2012, projected that our payments to asbestos claimants over the next 15 years are estimated to range from $5.2 million to $13.1 million. Given these estimates and existing insurance coverage that historically has been available to cover substantial portions of our past payments to claimants and defense costs, we believe that our current accruals and associated estimates relating to pending and probable asbestos-related litigation likely to be asserted over the next 15 years are currently adequate. Our belief that our accruals and associated estimates are currently adequate, however, relies on a number of significant assumptions, including:
• That our future settlement payments, disease mix and dismissal rates will be materially consistent with historic experience;
• That future incidences of asbestos-related diseases in the U.S. will be materially consistent with current public health estimates;
• That the rates at which future asbestos-related mesothelioma incidences result in compensable claims filings against us will be materially consistent with its historic experience;
• That insurance recoveries for settlement payments and defense costs will be materially consistent with historic experience; • That legal standards (and the interpretation of these standards) applicable to asbestos litigation will not change in material
respects; • That there are no materially negative developments in the claims pending against us; and • That key co-defendants in current and future claims remain solvent.
If any of these assumptions prove to be materially different in light of future developments, liabilities related to asbestos-related litigation may be materially different than amounts accrued or estimated. Further, while we anticipate that additional claims will be filed in the future, we are unable to predict with any certainty the number, timing and magnitude of such future claims.
Also, there is a possibility that resolution of certain legal contingencies for which there are no liabilities recorded could result in a loss. Management is not able to estimate the amount of such loss, if any. However, in our opinion, the ultimate resolution of all pending matters is not expected to have a material effect on our financial position, although it is possible that such resolutions could have a material adverse impact on results of operations in the period of resolution. Further, given the relatively small amounts we have paid in recent periods and our expectations regarding future required payments, we do not believe that the ultimate resolution of these matters for any period will have a material impact on our liquidity in any period on either a short term or long term basis.
Other Legal Claims and Proceedings. From time to time, we have been subject to various claims and involved in legal proceedings incidental to the nature of our businesses. We maintain insurance coverage to reduce financial risk associated with certain of these claims and proceedings. It is not possible to predict the outcome of these claims and proceedings. However, in our opinion, there are no material pending legal proceedings that are likely to have a material effect on our business, financial condition, results of operations or cash flows. See also “Item 7—Management’s Discussion and Analysis of Financial Condition and Results of Operations—Contractual Obligations, Commitments and Contingencies—Legal Proceedings” and “Note 15—Commitments and Contingencies” to the audited consolidated financial statements as of December 31, 2012.
Product Claims. From time to time, in the ordinary course of our business, our customers may claim that the products that we distribute are either defective or require repair or replacement under warranties that either we or the manufacturer may provide to the customer. These proceedings are, in the opinion of management, ordinary and routine matters incidental to our normal business. Our

46
purchase orders with our suppliers generally require the manufacturer to indemnify us against any product liability claims, leaving the manufacturer ultimately responsible for these claims. In many cases, state, provincial or foreign law provides protection to distributors for these sorts of claims, shifting the responsibility to the manufacturer. In some cases, we could be required to repair or replace the products for the benefit of our customer and seek our recovery from the manufacturer for our expense. In the opinion of management, the ultimate disposition of these claims and proceedings is not expected to have a material adverse effect on our financial position, results of operations or cash flows.
NiSource Claim. In the summer of 2010, our customer NiSource, Inc. notified us that certain polyethylene pipe that PolyPipe, Inc. manufactured may be defective. On April 28, 2011, PolyPipe filed a petition in the District Court in Cooke County, Texas against the Company and NiSource seeking, among other things, a declaratory judgment that PolyPipe was not responsible for the costs relating to NiSource’s alleged failure to track and record the installation locations of the pipe and NiSource’s expenditures to implement a potential remediation plan including finding the pipe and removing the pipe. On June 1, 2011, the Court entered an order of non-suit, dismissing PolyPipe’s claims without prejudice to their re-filing the same claims. After a period of factual investigation and settlement discussions, PolyPipe again filed a petition in the District Court in Cooke County, Texas against NiSource and the Company seeking a similar declaratory judgment. In the fourth quarter of 2012, the parties settled the dispute, and the court dismissed the case. The Company settled its portion of the lawsuit for an immaterial amount.
Off-Balance Sheet Arrangements We do not have any material “off-balance sheet arrangements” as such term is defined within the rules and regulations of the SEC.
Critical Accounting Estimates We prepare our consolidated financial statements in accordance with GAAP. To apply these principles, management must make judgments and assumptions and develop estimates based on the best available information at the time. Actual results may differ based on the accuracy of the information utilized and subsequent events. Our accounting policies are described in the notes to our audited financial statements included elsewhere in this report. These critical accounting policies could materially affect the amounts recorded in our financial statements. We believe the following describes significant judgments and estimates used in the preparation of our consolidated financial statements: Allowance for Doubtful Accounts: We evaluate the adequacy of the allowance for losses on receivables based upon periodic evaluation of accounts that may have a higher credit risk using information available about the customer and other relevant data. This formal analysis is inherently subjective and requires us to make significant estimates of factors affecting doubtful accounts, including customer-specific information, current economic conditions, volume, growth and composition of the account, and other factors such as financial statements, news reports and published credit ratings. The amount of the allowance for the remainder of the trade balance is not evaluated individually, but is based upon historical loss experience. Because this process is subjective and based on estimates, ultimate losses may differ from those estimates. Receivable balances are written off when we determine that the balance is uncollectible. Subsequent recoveries, if any, are credited to the allowance when received. The provision for losses on receivables is included in SG&A expenses in the accompanying consolidated statements of income. At December 31, 2012, 2011 and 2010, the allowance for doubtful accounts was $5.3 million, $4.8 million and $4.5 million, or 0.6%, 0.6% and 0.7% of gross accounts receivable, respectively. Inventories: Our U.S. inventories are valued at the lower of cost (principally using the LIFO method) or market. We record an estimate each quarter, if necessary, for the expected annual effect of inflation or deflation and estimated year-end inventory volume. These estimates are adjusted to actual results determined at year-end. Our inventories that are held outside of the U.S., totaling $318.9 million and $217.0 million at December 31, 2012 and 2011, respectively, were valued at the lower of weighted-average cost or market. Under the LIFO inventory valuation method, changes in the cost of inventory are recognized in cost of sales in the current period even though these costs may have been incurred at significantly different values. Since the Company values most of its inventory using the LIFO inventory costing methodology, a rise in inventory costs has a negative effect on operating results, while, conversely, a fall in inventory costs results in a benefit to operating results. In a period of rising prices, cost of sales recognized under LIFO is generally higher than the cash costs incurred to acquire the inventory sold. Conversely, in a period of declining prices, costs of sales recognized under LIFO are generally lower than cash costs of the inventory sold. The LIFO inventory valuation methodology is not utilized by many of the companies with which we compete, including foreign competitors. As such, our results of operations may not be comparable to those of our competitors during periods of volatile material costs due, in part, to the differences between the LIFO inventory valuation method and other acceptable inventory valuation methods. Impairment of Long-Lived Assets: Our long-lived assets consist primarily of amortizable intangible assets, which comprise approximately 15% of our total assets as of December 31, 2012. These assets are recorded at fair value at the date of acquisition and are amortized over their estimated useful lives. We make significant judgments and estimates in both calculating the fair value of these assets, as well as determining their estimated useful lives.

47
The carrying value of these assets is subject to an impairment test when events or circumstances indicate a possible impairment. When events or circumstances indicate a possible impairment, we assess recoverability from future operations using an undiscounted cash flow analysis, derived from the lowest appropriate asset group. If the carrying value exceeds the undiscounted cash flows, we would recognize an impairment charge to the extent that the carrying value exceeds the fair value, which is determined based on a discounted cash flow analysis. During 2012, 2011 and 2010, no indicators of impairment existed. While we believe our assumptions and estimates are reasonable, the actual results may differ materially from the projected results.
Goodwill and Other Indefinite-Lived Intangible Assets: Our goodwill and other indefinite-lived intangible assets comprise approximately 26% of our total assets as of December 31, 2012. Goodwill and intangible assets with indefinite useful lives are tested for impairment annually, each October, or more frequently if circumstances indicate that impairment may exist. We evaluate goodwill for impairment at three reporting units that mirror our three reportable segments (U.S., Canada and International). Within each reporting unit, we have elected to aggregate the component countries and regions into a single reporting unit based on their similar economic characteristics, products, customers, suppliers, methods of distribution and the manner in which we operate each segment. We perform our annual tests for indications of goodwill impairment as of October of each year, updating on an interim basis should indications of impairment exist.
The goodwill impairment test compares the carrying value of the reporting unit that has the goodwill with the estimated fair value of that reporting unit. If the carrying value is more than the estimated fair value, the second step is performed, whereby we calculate the implied fair value of goodwill by deducting the fair value of all tangible and intangible net assets of the reporting unit from the estimated fair value of the reporting unit. Impairment losses are recognized to the extent that recorded goodwill exceeds implied goodwill. Our impairment methodology uses discounted cash flow and multiples of cash earnings valuation techniques, plus valuation comparisons to similar businesses. These valuation methods require us to make certain assumptions and estimates regarding future operating results, the extent and timing of future cash flows, working capital, sales prices, profitability, discount rates and growth trends. No impairment charges were recognized during the years ended December 31, 2012, 2011 and 2010 as the estimated fair value of each of our three reporting units substantially exceeded their carrying values. While we believe that such assumptions and estimates are reasonable, the actual results may differ materially from the projected results.
Intangible assets with indefinite useful lives are tested for impairment annually or more frequently if circumstances indicate that impairment may exist. This test compares the carrying value of the indefinite-lived intangible assets with their estimated fair value. If the carrying value is more than the estimated fair value, impairment losses are recognized in amount equal to the excess of the carrying value over the estimated fair value. Our impairment methodology uses discounted cash flow and estimated royalty rate valuation techniques. These valuation methods require us to make certain assumptions and estimates regarding future operating results, sales prices, discount rates and growth trends. No impairment charges were recognized during the years ended December 31, 2012, 2011 and 2010, as the estimated fair value of our indefinite-lived intangible assets substantially exceeded their carrying value. While we believe that such assumptions and estimates are reasonable, the actual results may differ materially from the projected results.
Income Taxes: We use the liability method for determining our income taxes, under which current and deferred tax liabilities and assets are recorded in accordance with enacted tax laws and rates. Under this method, the amounts of deferred tax liabilities and assets at the end of each period are determined using the tax rate expected to be in effect when taxes are actually paid or recovered.
Deferred tax assets and liabilities are recorded for differences between the financial reporting and tax bases of assets and liabilities using the tax rate expected to be in effect when the taxes will actually be paid or refunds received. The effect on deferred tax assets and liabilities of a change in tax rates is recognized in earnings in the period that includes the enactment date. A valuation allowance to reduce deferred tax assets is established when it is more likely than not that some portion or all of the deferred tax assets will not be realized.
In determining the need for valuation allowances, we have considered and made judgments and estimates regarding estimated future taxable income and ongoing prudent and feasible tax planning strategies. These estimates and judgments include some degree of uncertainty and changes in these estimates and assumptions could require us to adjust the valuation allowances for our deferred tax assets. The ultimate realization of the deferred tax assets depends on the generation of sufficient taxable income in the applicable taxing jurisdictions.
Our tax provision is based upon our expected taxable income and statutory rates in effect in each country in which we operate. We are subject to the jurisdiction of numerous domestic and foreign tax authorities, as well as to tax agreements and treaties among these governments. Determination of taxable income in any jurisdiction requires the interpretation of the related tax laws and regulations and the use of estimates and assumptions regarding significant future events such as the amount, timing and character of deductions, permissible revenue recognition methods under the tax law and the sources and character of income and tax credits. Changes in tax laws, regulations, agreements and treaties, foreign currency exchange restrictions or our level of operations or profitability in each taxing jurisdiction could have an impact on the amount of income taxes we provide during any given year.

48
A tax benefit from an uncertain tax position may be recognized when it is more likely than not that the position will be sustained upon examination, including any related appeals or litigation processes, on the basis of the technical merits. We adjust these liabilities when our judgment changes as a result of the evaluation of new information not previously available. Because of the complexity of some of these uncertainties, the ultimate resolution may result in a payment that is materially different from our current estimate of the tax liabilities. These differences will be reflected as increases or decreases to income tax expense in the period in which the new information is available.
We classify interest and penalties related to unrecognized tax positions as income taxes in our financial statements. We intend to permanently reinvest certain earnings of our foreign subsidiaries in operations outside of the U.S., and accordingly, we have not provided for U.S. income taxes on such earnings.
Recently Issued Accounting Standards In July 2012, the Financial Accounting Standards Board (FASB) issued Accounting Standards Update No. 2012-02, Intangibles—Goodwill and Other (Topic 350)—Testing Indefinite-Lived Intangible Assets for Impairment (ASU 2012-02), to allow entities to use a qualitative approach to test indefinite-lived intangible assets for impairment. ASU 2012-02 permits an entity to first perform a qualitative assessment to determine whether it is more likely than not that the fair value of an indefinite-lived intangible asset is less than its carrying value. If it is concluded that this is the case, it is then necessary to perform the currently prescribed quantitative impairment test by comparing the fair value of the indefinite-lived intangible asset with its carrying value. Otherwise, the quantitative impairment test is not required. ASU 2012-02 is effective for us in fiscal 2013 and early adoption is permitted. We do not believe that ASU No. 2012-02 will have a material impact on our consolidated financial statements.
In October 2012, the Financial Accounting Standards Board (FASB) issued Accounting Standards Update No. 2012-04, Technical Corrections and Improvements, to clarify the codification and correct unintended applications of guidance that are not expected to have a significant effect on current accounting practice or create a significant administrative cost to most entities. The amendments in ASU 2012-04 cover a wide range of topics in the codification and are classified as either technical corrections and improvements or conforming amendments related to fair value measurements. The amendments in ASU 2012-04 that do not have transition guidance are effective for us in fiscal 2012, while the amendments that are subject to the transition guidance are effective for us in fiscal 2013. We do not believe that ASU No. 2012-04 will have a material impact on our consolidated financial statements.
ITEM 7A. QUANTITATIVE AND QUALITATIVE DISCLOSURES ABOUT MARKET RISK Interest Rate Risk As of December 31, 2012, all of our outstanding term and revolving debt was at floating rates. These facilities prescribe the percentage point spreads from U.S. prime, LIBOR, Canadian prime and EURIBOR. Our facilities generally allow us to fix the interest rate, at our option, for a period of 30 to 180 days.
As of December 31, 2012, a 1% increase in the LIBOR rate would result in an increase in our interest expense of approximately $6.1 million per year if the amounts outstanding under our Global ABL Facility remained the same for an entire year. Because of a LIBOR floor in our Term Loan, as of December 31, 2012, a 1% increase in the LIBOR rate would not result in a significant change in our interest expense. An additional 1% increase in the LIBOR rate would result in an increase in our interest expense of approximately $6.5 million per year under our Term Loan.
Foreign Currency Exchange Rates Our operations outside of the U.S. expose us to foreign currency exchange rate risk, as these transactions are primarily denominated in currencies other than the U.S. dollar, our functional currency. Our exposure to changes in foreign exchange rates is managed primarily through the use of forward foreign exchange contracts. These contracts increase or decrease in value as foreign exchange rates change, protecting the value of the underlying transactions denominated in foreign currencies. All currency contracts are entered into for the sole purpose of hedging existing or anticipated currency exposure; we do not use foreign currency contracts for trading or speculative purposes. The terms of these contracts generally do not exceed one year. We record all changes in the fair market value of forward foreign exchange contracts in income. We recorded losses related to foreign currency contracts of $0.2 million, $0.1 million and $0.6 million in the years ended December 31, 2012, 2011 and 2010, respectively.
Steel Prices Our business is sensitive to steel prices, which can impact our product pricing, with steel tubular prices generally having the highest degree of sensitivity. While we cannot predict steel prices, we manage this risk by managing our inventory levels, including maintaining sufficient quantity on hand to meet demand, while reducing the risk of overstocking.

49
ITEM 8. FINANCIAL STATEMENTS
Audited Consolidated Financial Statements of MRC Global Inc. and Subsidiaries:
Management’s Report on Internal Control over Financial Reporting ............................................................................................... F-1 Reports of Ernst & Young LLP, Independent Registered Public Accounting Firm ......................................................................... F-2 Consolidated Balance Sheets as of December 31, 2012 and 2011 .................................................................................................... F-4 Consolidated Statements of Operations for the years ended December 31, 2012 , 2011, and 2010 ................................................. F-5 Consolidated Statements of Comprehensive Income for the years ended December 31, 2012 , 2011, and 2010 ............................. F-6 Consolidated Statements of Stockholders’ Equity for the years ended December 31, 2012 , 2011, and 2010 ................................. F-7 Consolidated Statements of Cash Flows for the year ended December 31, 2012 , 2011, and 2010.................................................. F-8 Notes to Consolidated Financial Statements ..................................................................................................................................... F-9

50
ITEM 9. CHANGES IN AND DISAGREEMENTS WITH ACCOUNTANTS ON ACCOUNTING AND FINANCIAL DISCLOSURE
None.
ITEM 9A. CONTROLS AND PROCEDURES (i) Evaluation of disclosure controls and procedures
As required by SEC Rule 13a-15(b), we have evaluated, under the supervision and with the participation of our management, including our principal executive officer and principal financial officer, the effectiveness of the design and operation of our disclosure controls and procedures (as defined in Rules 13a-15(e) and 15d-15(e) under the Exchange Act) as of the end of the period covered by this report. Our disclosure controls and procedures are designed to provide reasonable assurance that the information required to be disclosed by the Company in reports that it files under the Exchange Act is accumulated and communicated to the Company’s management, including our principal executive officer and principal financial officer, as appropriate, to allow timely decisions regarding required disclosure and is recorded, processed, summarized and reported within the time periods specified in the rules and forms of the SEC. Our principal executive officer and principal financial officer have concluded that our current disclosure controls and procedures were effective as of December 31, 2012 at the reasonable assurance level.
Pursuant to section 302 of the Sarbanes-Oxley Act of 2002, our Chief Executive Officer and Chief Financial Officer have provided certain certifications to the Securities and Exchange Commission. These certifications are included herein as Exhibits 31.1 and 31.2.
(ii) Internal Control Over Financial Reporting
(a) Management’s annual report on internal control over financial reporting.
The Company’s management report on internal control over financial reporting is set forth on page F-1 of this annual report and is incorporated herein by reference.
(b) Attestation report of our registered public accounting firm.
The Company’s registered public accounting firm’s attestation report on our internal control over financial reporting is set forth on page F-2 of this annual report and is incorporated herein by reference.
(c) Changes in internal control
There were no changes in the Company’s internal control over financial reporting that occurred during the Company’s last fiscal quarter covered by this report that have materially affected, or are reasonably likely to materially affect, the Company’s internal control over financial reporting.
ITEM 9B. OTHER INFORMATION None.

51
PART III
ITEM 10. DIRECTORS, EXECUTIVE OFFICERS AND CORPORATE GOVERNANCE The information regarding our directors and nominees for director required by Item 401 of Regulation S-K will be presented under the heading “Proposal 1—Election of Directors” in our Proxy Statement prepared for the solicitation of proxies in connection with our annual Meeting of Stockholders to be held May 8, 2013 (Proxy Statement), which information is incorporated by reference herein.
Information regarding our executive officers required by Item 401(b) of Regulation S-K is presented at the end of Part I herein and captioned “Executive Officers of the Registrant” as permitted by General Instruction G(3) to Form 10-K and Instruction 3 to Item 401(b) of Regulation S-K.
Information required by Item 405 of Regulation S-K will be included under the heading “Section 16(a) Beneficial Ownership Reporting Compliance” in our Proxy Statement, which information is incorporated by reference herein.
Information required by paragraphs (c)(3), (d)(4) and (d)(5) of Item 407 of Regulation S-K will be included under the heading “Questions and Answers About the Annual Meeting and Voting” and “Corporate Governance and Board Matters” in our Proxy Statement, which information is incorporated by reference herein.
We have adopted a Code of Ethics for Senior Officers that applies to our Chief Executive Officer, Chief Financial Officer, and Controller, or persons performing similar functions. The Code of Ethics for Senior Officers, together with our Corporate Governance Guidelines, the charters for each of our board committees, and our Code of Ethics applicable to all employees are available on our Internet website at www.mrcglobal.com. We will provide, free of charge, a copy of our Code of Ethics or any of our other corporate documents listed above upon written request to our Corporate Secretary at 2 Houston Center, Suite 3100, 909 Fannin, Houston, Texas 77010. We intend to disclose any amendments to or waivers of the Code of Ethics on behalf of our Chief Executive Officer, Chief Financial Officer, Controller, and persons performing similar functions on our Internet website at www.mrcglobal.com
ITEM 11. EXECUTIVE COMPENSATION
under the Investor Relations page, promptly following the date of any such amendment or waiver.
The information required by Item 402 and paragraphs (e)(4) and (e)(5) of Item 407 of Regulations S-K regarding executive compensation will be presented under the headings “Compensation Discussion and Analysis,” “Executive Compensation and Other Information,” “Compensation of Directors,” “Compensation Committee Report on Executive Compensation,” and “Compensation Committee Interlocks and Insider Participation” in our Proxy Statement, which information is incorporated by reference herein. Notwithstanding the foregoing, the information provided under the heading “Compensation Committee Report on Executive Compensation” in our Proxy Statement is furnished and shall not be deemed to be filed for purposes of Section 18 of the Securities Exchange Act of 1934, as amended, is not subject to the liabilities of that section and is not deemed incorporated by reference in any filing under the Securities Act of 1933, as amended.

52
ITEM 12. SECURITY OWNERSHIP OF CERTAIN BENEFICIAL OWNERS AND MANAGEMENT AND RELATED STOCKHOLDER MATTERS
The information regarding the security ownership of certain beneficial owners and management required by Item 403 of Regulation S-K will be presented under the heading “Security Ownership of Certain Beneficial Owners and Management and Related Stockholder Matters” in our Proxy Statement, which information is incorporated by reference herein.
The following table summarizes information, as of December 31, 2012, relating to our equity compensation plans pursuant to which grants of options, restricted stock, or certain other rights to acquire our shares may be granted from time to time.
(a) (b) (c)
Plan Category
Number of securities to be issued upon
exercise of outstanding options, warrants and
rights
Weighted-average exercise price of
outstanding options, warrants and rights
Number of securities remaining available for future issuance under equity compensation
plans (excluding securities reflected in
column (a))
Equity compensation plans approved by security holders:
Stock options and restricted stock ...................................................... 3,892,969 $ 18.05 2,185,239
Equity compensation plans not approved by security holders ........... None N/A None
ITEM 13. CERTAIN RELATIONSHIPS AND RELATED TRANSACTIONS, AND DIRECTOR INDEPENDENCE The information regarding certain relationships and related transactions required by Item 404 and Item 407(a) of Regulation S-K will be presented under the heading “Corporate Governance and Board Matters” in our Proxy Statement, which information is incorporated by reference herein.
ITEM 14. PRINCIPAL ACCOUNTANT FEES AND SERVICES The information regarding our principal accounting fees and services required by Item 9(e) of Schedule 14A will be presented under the heading “Principal Accounting Fees and Services” in Proposal IV Ratification of the Appointment of Independent Registered Public Accounting Firm of our Proxy Statement, which information is incorporated by reference herein.

53
PART IV
ITEM 15. EXHIBITS AND FINANCIAL STATEMENT SCHEDULES (a) Documents Filed as Part of this Annual Report: 1. Financial Statements.
See “Item 8—Financial Statements and Supplementary Data.” 2. Financial Statement Schedules.
All schedules are omitted because they are not applicable, not required or the information is included in the financial statements or the notes thereto. 3. List of Exhibits.
Exhibit Number
Description
3.1 Amended and Restated Certificate of Incorporation of MRC Global Inc. dated April 11, 2012. (Incorporated by reference to Exhibit 3.1 to the Current Report on Form 8-K of MRC Global Inc. filed with the SEC on April 17, 2012).
3.2 Amended and Restated Bylaws of MRC Global Inc. dated April 11, 2012. (Incorporated by reference to Exhibit 3.2 to the Current Report on Form 8-K of MRC Global Inc. filed with the SEC on April 17, 2012).
10.1 Amended and Restated Loan, Security and Guarantee Agreement, dated as of March 27, 2012, among McJunkin Red Man Corporation, Greenbrier Petroleum Corporation, McJunkin Red Man Development Corporation, Midway–Tristate Corporation, Milton Oil & Gas Company, MRC Management Company, Ruffner Realty Company and The South Texas Supply Company, Inc., as U.S. Borrowers and Guarantors, MRC Transmark Pty Ltd and MRC SPF Pty Ltd., as Australian Borrowers, MRC Transmark NV, as a Belgian Borrower, Midfield Supply ULC, as a Canadian Borrower, MRC Transmark B.V. and MRC Transmark International B.V., as Dutch Borrowers, MRC Transmark Holdings UK Limited, MRC Transmark Limited, MRC Transmark (Dragon) Limited and MRC SPF Scanfit Limited, as UK Borrowers, any other Borrower party thereto from time to time and certain Persons party thereto from time to time as Guarantors, certain financial institutions, as lenders, Bank of America, N.A., as Administrative Agent and Collateral Agent, and Barclays Bank PLC and Wells Fargo Capital Finance LLC, as Co-Syndication Agents (incorporated by reference to Exhibit 10.1 to Amendment No. 2 to the Registration Statement on Form S-1 of MRC Global Inc. (formerly known as McJunkin Red Man Holding Corporation) (No. 333-153091), filed with the SEC on March 28, 2012). (Incorporated by reference to Exhibit 10.1 to Amendment No. 2 of the Registration Statement on Form S-1 of MRC Global Inc. (formerly known as McJunkin Red Man Holding Corporation) (No. 333-178980), filed with the SEC on March 28, 2012).
10.2 Registration Rights Agreement, dated as of April 11, 2012, between MRC Global Inc. and PVF Holdings LLC. (Incorporated by reference to Exhibit 10.2 to Form 10-Q of MRC Global Inc. for the quarterly period ended March 31, 2012, filed with the SEC on May 7, 2012).
10.2.1 Amendment No. 2 to the Amended and Restated Registration Rights Agreement, dated as of April 11, 2012, by and among MRC Global Inc., PVF Holdings LLC and the other parties thereto. (Incorporated by reference to Exhibit 10.2.1 to Form 10-Q of MRC Global Inc. for the quarterly period ended March 31, 2012, filed with the SEC on May 7, 2012).
10.3 Form of Indemnification Agreement between MRC Global Inc. (formerly McJunkin Red Man Holding Corporation) and Executive Officers. (Incorporated by reference to Exhibit 10.4 to Amendment No. 3 to the Registration Statement on Form S-1 of MRC Global Inc. (No. 333-178980), filed with the SEC on April 4, 2012).
10.3.1 Form of Indemnification Agreement between MRC Global Inc. (formerly known as McJunkin Red Man Holding Corporation) and Directors. (Incorporated by reference to Exhibit 10.4.1 to Amendment No. 3 of the Registration Statement on Form S-1 of MRC Global Inc. (No. 333-178980), filed with the SEC on April 4, 2012).
10.4† Employment Agreement, dated as of September 10, 2008, by and among MRC Global Inc. (formerly known as McJunkin Red Man Holding Corporation) and Andrew R. Lane. (Incorporated by reference to Exhibit 10.29 to the Amendment No. 1 of the Registration Statement on Form S-1 of MRC Global Inc. (formerly known as McJunkin Red Man Holding Corporation) (No. 333-153091), filed with the SEC on September 28, 2008).

54
Exhibit Number
Description
10.4.1† Amendment to Employment Agreement by and among MRC Global Inc. (formerly known as McJunkin Red Man Holding Corporation) and Andrew R. Lane, dated February 23, 2011. (Incorporated by reference to Exhibit 10.7.1 to the Registration Statement on Form S-4 of McJunkin Red Man Corporation (No. 333-173035), filed with the SEC on March 24, 2011).
10.5† Amended and Restated Employment Agreement, dated as of December 5, 2011, by and among MRC Global Inc. (formerly known as McJunkin Red Man Holding Corporation) and James Underhill. (Incorporated by reference to Exhibit 10.6 to the Registration Statement on Form S-1 of MRC Global Inc. (No. 333-178980), filed with the SEC on January 12, 2012).
10.6*† Employment Agreement, dated as of March 30, 2012, by and between MRC Transmark Pte Ltd. and Neil P. Wagstaff.
10.7† Letter Agreement, dated as of September 24, 2008, by and among H.B. Wehrle, III, PVF Holdings LLC and McJunkin Red Man Corporation. (Incorporated by reference to Exhibit 10.11 to Amendment No. 1 of the Registration Statement on Form S-1 of MRC Global Inc. (formerly known as McJunkin Red Man Holding Corporation ) (No. 333-153091), filed with the SEC on September 26, 2008).
10.8† Letter Agreement, dated as of December 22, 2008, by and among MRC Global Inc. (formerly known as McJunkin Red Man Holding Corporation ) and Craig Ketchum. (Incorporated by reference to Exhibit 10.12 to the Registration Statement on Form S-4 of McJunkin Red Man Corporation (No. 333-173035), filed with the SEC on March 24, 2011).
10.9† 2007 Stock Option Plan, as amended. (Incorporated by reference to Exhibit 10.13.1 to the Registration Statement on Form S-4 of McJunkin Red Man Corporation (No. 333-173035), filed with the SEC on March 24, 2011).
10.9.1† Form of MRC Global Inc. (formerly known as McJunkin Red Man Holding Corporation) Nonqualified Stock Option Agreement. (Incorporated by reference to Exhibit 10.17.1 to Amendment No. 1 to the Registration Statement on Form S-1 of MRC Global Inc. (formerly known as McJunkin Red Man Holding Corporation) (No. 333-153091), filed with the SEC on September 26, 2008).
10.9.2† Form of MRC Global Inc. (formerly known as McJunkin Red Man Holding Corporation) Nonqualified Stock Option Agreement (Director Grant May 2010—Dutch residents). (Incorporated by reference to Exhibit 10.9.1 to the Registration Statement on Form S-4 of McJunkin Red Man Corporation (No. 333-173035), filed with the SEC on March 24, 2011).
10.9.3† Form of MRC Global Inc. (formerly known as McJunkin Red Man Holding Corporation) Nonqualified Stock Option Agreement (Director Grant May 2010—US residents). (Incorporated by reference to Exhibit 10.9.1 to the Registration Statement on Form S-4 of McJunkin Red Man Corporation (No. 333-173035), filed with the SEC on March 24, 2011).
10.10† 2007 Restricted Stock Plan, as amended. (Incorporated by reference to Exhibit 10.14.1 to the Registration Statement on Form S-4 of McJunkin Red Man Corporation (No. 333-173035), filed with the SEC on March 24, 2011).
10.11† Form of MRC Global Inc. (formerly known as McJunkin Red Man Holding Corporation) Restricted Stock Award Agreement. (Incorporated by reference to Exhibit 10.18.1 to the Registration Statement on Form S-1 of MRC Global Inc. (formerly known as McJunkin Red Man Holding Corporation) (No. 333-153091) filed with the SEC on September 26, 2008).
10.12† MRC Global Inc. (formerly known as McJunkin Red Man Holding Corporation) 2007 Stock Option Plan (Canada). (Incorporated by reference to Exhibit 10.19 to Amendment No. 1 of the Registration Statement on Form S-1 of MRC Global Inc. (formerly known as McJunkin Red Man Holding Corporation) (No. 333-153091), filed with the SEC on September 26, 2008).
10.12.1† Form of MRC Global Inc. (formerly known as McJunkin Red Man Holding Corporation) Nonqualified Stock Option Agreement (Canada) (for plan participants who are parties to non-competition agreements). (Incorporated by reference to Exhibit 10.19.1 to Amendment No. 1 of the Registration Statement on Form S-1 of MRC Global Inc. (formerly known as McJunkin Red Man Holding Corporation) (No. 333-153091), filed with the SEC on September 26, 2008).

55
Exhibit Number
Description
10.12.2† Form of MRC Global Inc. (formerly known as McJunkin Red Man Holding Corporation) Nonqualified Stock Option Agreement (Canada) (for plan participants who are not parties to non-competition agreements). (Incorporated by reference to Exhibit 10.19.2 to Amendment No. 1 of the Registration Statement on Form S-1 of MRC Global Inc. (formerly known as McJunkin Red Man Holding Corporation) (No. 333-153091), filed with the SEC on September 26, 2008).
10.13† MRC Global Inc. (formerly known as McJunkin Red Man Holding Corporation) Deferred Compensation Plan. (Incorporated by reference to Exhibit 10.20 to Amendment No. 1 of the Registration Statement on Form S-1 of MRC Global Inc. (formerly known as McJunkin Red Man Holding Corporation) (No. 333-153091), filed with the SEC on September 26, 2008).
10.14 Indemnity Agreement, dated as of December 4, 2006, by and among MRC Global Inc. (formerly known as McJunkin Red Man Holding Corporation), Hg Acquisition Corp., McJunkin Red Man Corporation, and certain shareholders of McJunkin Red Man Corporation named therein. (Incorporated by reference to Exhibit 10.21 to Amendment No. 1 of the Registration Statement on Form S-1 of MRC Global Inc. (formerly known as McJunkin Red Man Holding Corporation) (No. 333-153091), filed with the SEC on September 26, 2008).
10.15† Amended and Restated Limited Liability Company Agreement of PVF Holdings LLC, dated as of October 31, 2007. (Incorporated by reference to Exhibit 10.19 to the Registration Statement on Form S-4 of McJunkin Red Man Corporation (No. 333-173035), filed with the SEC on March 24, 2011).
10.15.1† Amendment No. 1, dated as of December 18, 2007, to the Amended and Restated Limited Liability Company Agreement of PVF Holdings LLC. (Incorporated by reference to Exhibit 10.20.1 to the Registration Statement on Form S-4 of McJunkin Red Man Corporation (No. 333-173035), filed with the SEC on March 24, 2011).
10.15.2† Amendment No. 2, dated as of October 31, 2009, to the Amended and Restated Limited Liability Company Agreement of PVF Holdings LLC. (Incorporated by reference to Exhibit 10.20.2 to the Registration Statement on Form S-4 of McJunkin Red Man Corporation (No. 333-173035), filed with the SEC on Mach 24, 2011).
10.16† Subscription Agreement, dated as of September 10, 2008, by and among MRC Global Inc. (formerly known as McJunkin Red Man Holding Corporation), Andrew R. Lane, and PVF Holdings LLC. (Incorporated by reference to Exhibit 10.30 to the Amendment No. 1 to the Registration Statement on Form S-1 of MRC Global Inc. (formerly known as McJunkin Red Man Holding Corporation (No. 333-153091), filed with the SEC on September 26, 2008).
10.17† MRC Global Inc. (formerly known as McJunkin Red Man Holding Corporation) Nonqualified Stock Option Agreement, dated as of September 10, 2008, by and among MRC Global Inc. (formerly known as McJunkin Red Man Holding Corporation), PVF Holdings LLC, and Andrew R. Lane. (Incorporated by reference to Exhibit 10.31 to Amendment No. 1 to the Registration Statement on Form S-1 of MRC Global Inc. (formerly known as McJunkin Red Man Holding Corporation) (No. 333-153091), filed with the SEC on September 26, 2008).
10.17.1† Amendment to the MRC Global Inc. (formerly known as McJunkin Red Man Holding Corporation) Nonqualified Stock Option Agreement, dated as of June 1, 2009, by and among McJunkin Red Man Holding Corporation, PVF Holdings LLC, and Andrew R. Lane. (Incorporated by reference to Exhibit 10.23.2 to the Registration Statement on Form S-4 of McJunkin Red Man Corporation (No. 333-173035), filed with the SEC on March 24, 2011).
10.17.2† Second Amendment to the MRC Global Inc. (formerly known as McJunkin Red Man Holding Corporation) Nonqualified Stock Option Agreement, dated as of September 10, 2009, by and among MRC Global Inc. (formerly known as McJunkin Red Man Holding Corporation), PVF Holdings LLC, and Andrew R. Lane. (Incorporated by reference to Exhibit 10.23.3 to the Registration Statement on Form S-4 of McJunkin Red Man Corporation (No. 333-173035), filed with the SEC on March 24, 2011).
10.18† MRC Global Inc. (formerly known as McJunkin Red Man Holding Corporation) Restricted Stock Award Agreement, dated as of February 24, 2009, by and among MRC Global Inc. (formerly known as McJunkin Red Man Holding Corporation), PVF Holdings LLC, and Andrew R. Lane. (Incorporated by reference to Exhibit 10.24.1 to the Registration Statement on Form S-4 of McJunkin Red Man Corporation (No. 333-173035), filed with the SEC on March 24, 2011).

56
Exhibit Number
Description
10.18.1† Amendment to the MRC Global Inc. (formerly known as McJunkin Red Man Holding Corporation) Restricted Stock Award Agreement, dated as of June 1, 2009, by and among MRC Global Inc. (formerly known as McJunkin Red Man Holding Corporation), PVF Holdings LLC, and Andrew R. Lane. (Incorporated by reference to Exhibit 10.24.2 to the Registration Statement on Form S-4 of McJunkin Red Man Corporation (No. 333-173035), filed with the SEC on March 24, 2011).
10.19† Subscription Agreement, dated as of October 3, 2008, by and among MRC Global Inc. (formerly known as McJunkin Red Man Holding Corporation), Len Anthony, and PVF Holdings LLC. (Incorporated by reference to Exhibit 10.25 to the Registration Statement on Form S-4 of McJunkin Red Man Corporation (No. 333-173035), filed with the SEC on March 24, 2011).
10.19.1† MRC Global Inc. (formerly known as McJunkin Red Man Holding Corporation) Nonqualified Stock Option Agreement, dated as of October 3, 2008, by and among MRC Global Inc. (formerly known as McJunkin Red Man Holding Corporation, PVF Holdings LLC, and Len Anthony. (Incorporated by reference to Exhibit 10.26.1 to the Registration Statement on Form S-4 of McJunkin Red Man Corporation (No. 333-173035), filed with the SEC on March 24, 2011).
10.19.2† Amendment to the MRC Global Inc. (formerly known as McJunkin Red Man Holding Corporation) Nonqualified Stock Option Agreement, dated as of September 10, 2009, by and among MRC Global Inc. (formerly known as McJunkin Red Man Holding Corporation), PVF Holdings LLC, and Len Anthony. (Incorporated by reference to Exhibit 10.26.2 to the Registration Statement on Form S-4 of McJunkin Red Man Corporation (No. 333-173035), filed with the SEC on March 24, 2011).
10.20† MRC Global Inc. (formerly known as McJunkin Red Man Holding Corporation) Restricted Stock Award Agreement, dated as of September 10, 2009, by and among MRC Global Inc. (formerly known as McJunkin Red Man Holding Corporation), PVF Holdings LLC, and Len Anthony. (Incorporated by reference to Exhibit 10.27 to the Registration Statement on Form S-4 of McJunkin Red Man Corporation (No. 333-173035, filed with the SEC on March 24, 2011).
10.21† Subscription Agreement, dated as of October 30, 2009, by and among MRC Global Inc. (formerly known as McJunkin Red Man Holding Corporation), John A. Perkins, and PVF Holdings LLC. (Incorporated by reference to Exhibit 10.28 to the Registration Statement on Form S-4 of McJunkin Red Man Corporation (No. 333-173035), filed with the SEC on March 24, 2011).
10.22† MRC Global Inc. (formerly known as McJunkin Red Man Holding Corporation) Nonqualified Stock Option Agreement, dated as of December 3, 2009, by and among MRC Global Inc. (formerly known as McJunkin Red Man Holding Corporation), PVF Holdings LLC, and John A. Perkins. (Incorporated by reference to Exhibit 10.29 to the Registration Statement on Form S-4 of McJunkin Red Man Corporation (No. 333-173035), filed with the SEC on March 24, 2011).
10.23† Indemnification Agreement by and between the Company and Peter C. Boylan, III dated August 11, 2010. (Incorporated by reference to Exhibit 10.30 to the Registration Statement on Form S-4 of McJunkin Red Man Corporation (No. 333-173035), filed with the SEC on March 24, 2011).
10.24† Employment Agreement, dated as of November 15, 2011, by and among MRC Global Inc. (formerly known as McJunkin Red Man Holding Corporation) and Daniel J. Churay. (Incorporated by reference to Exhibit 10.26 to the Registration Statement on Form S-1 of MRC Global Inc. (No. 333-178980), filed with the SEC on January 12, 2012).
10.25† Employment Agreement, dated as of November 15, 2011, by and among MRC Global Inc. (formerly known as McJunkin Red Man Holding Corporation) and James E. Braun. (Incorporated by reference to Exhibit 10.3 to Current Report on Form 8-K of MRC Global Inc. (formerly known as McJunkin Red Man Holding Corporation), filed with the SEC on November 16, 2011).
10.26† MRC Global Inc. (formerly known as McJunkin Red Man Holding Corporation) 2011 Omnibus Incentive Plan. (Incorporated by reference to Exhibit 10.27 to the Annual Report on Form 10-K of MRC Global Inc. (formerly known as McJunkin Red Man Holding Corporation), filed with the SEC on March 5, 2012).
10.26.1† Form of MRC Global Inc. (formerly known as McJunkin Red Man Holding Corporation) Director Option Agreement. (Incorporated by reference to Exhibit 10.28.1 to the Registration Statement on Form S-1 of MRC Global Inc. (No. 333-178980), filed with the SEC on January 12, 2012).

57
Exhibit Number
Description
10.26.2† Form of MRC Global Inc. (formerly known as McJunkin Red Man Holding Corporation) Nonqualified Stock Option Agreement. (Incorporated by reference to Exhibit 10.28.2 to the Registration Statement on Form S-1 of MRC Global Inc. (No. 333-178980), filed with the SEC on January 12, 2012).
10.26.3† Form of MRC Global Inc. (formerly known as McJunkin Red Man Holding Corporation) Director Restricted Stock Award Agreement. (Incorporated by reference to Exhibit 10.28.3 to the Registration Statement on Form S-1 of MRC Global Inc. (No. 333-178980), filed with the SEC on January 12, 2012).
10.26.4† Form of MRC Global Inc. (formerly known as McJunkin Red Man Holding Corporation) Restricted Stock Award Agreement. (Incorporated by reference to Exhibit 10.28.4 to the Registration Statement on Form S-1 of MRC Global Inc. (No. 333-178980), filed with the SEC on January 12, 2012).
10.27† MRC Global Inc. (formerly known as McJunkin Red Man Holding Corporation) Director Compensation Plan. (Incorporated by reference to Exhibit 10.1 to the Current Report on Form 8-K of MRC Global Inc. (formerly known as McJunkin Red Man Holding Corporation), filed with the SEC on November 26, 2011).
10.28 Governance Agreement, dated as of April 11, 2012, by and between MRC Global Inc. and PVF Holdings LLC. (Incorporated by reference to Exhibit 10.4 to the Form 10-Q of MRC Global Inc. for the quarterly period ended March 31, 2012, filed with the SEC on May 7, 2012).
10.29 Term Loan Credit Agreement, dated as of November 9, 2012, among McJunkin Red Man Corporation, as the Borrower, MRC Global Inc., as Guarantor, each other Subsidiary Guarantor from time to time party thereto, the several lenders from time to time party thereto, Banc of America, N.A., as Administrative Agent, U.S. Bank National Association, as Collateral Trustee, Goldman Sachs Lending Partners LLC, Merrill Lynch, Pierce, Fenner & Smith Incorporated, Barclays Bank PLC and Wells Fargo Securities, LLC, as Joint Lead Arrangers and Joint Bookrunners, Key Bank National Association and SunTrust Robinson Humphrey, Inc., as Co-Managers, Wells Fargo Bank, National Association, as Documentation Agent and Merrill Lynch, Pierce, Fenner & Smith Incorporated and Barclays Bank PLC, as Co-Syndication Agents. (Incorporated by reference to Exhibit 10.1 to the Current Report on Form 8-K of MRC Global Inc. filed with the SEC on November 9, 2012).
10.30 Term Loan Guarantee and Acknowledgment, dated as of November 9, 2012, by each of the signatories listed on the signature pages thereto and each of the other entities that becomes a party thereto, in favor of the Administrative Agent (as defined therein) for the benefit of the Guaranteed Parties (as defined therein). (Incorporated by reference to Exhibit 10.2 to the Current Report on Form 8-K of MRC Global Inc. filed with the SEC on November 9, 2012).
10.31 Security Agreement, dated as of November 9, 2012, among McJunkin Red Man Corporation, MRC Global Inc., each of the subsidiaries of MRC Global Inc. listed on the signature pages thereto and U.S. Bank National Association, as Collateral Trustee for the benefit of the Secured Parties (as defined therein). (Incorporated by reference to Exhibit 10.3 to the Current Report on Form 8-K of MRC Global Inc. filed with the SEC on November 9, 2012).
10.32 Term Loan Pledge Agreement, dated as of November 9, 2012, among McJunkin Red Man Corporation, MRC Global Inc., each of the subsidiaries of MRC Global Inc. listed on the signature pages thereto and U.S. Bank National Association, as Collateral Trustee, for the benefit of the Secured Parties (as defined therein). (Incorporated by reference to Exhibit 10.4 to the Current Report on Form 8-K of MRC Global Inc. filed with the SEC on November 9, 2012).
10.33 First Amendment to Amended and Restated Loan, Security and Guarantee Agreement, dated as of November 9, 2012, among MRC Global Inc., McJunkin Red Man Corporation, Greenbrier Petroleum Corporation, McJunkin Red Man Development Corporation, Midway-Tristate Corporation, Milton Oil & Gas Company, MRC Management Company, Ruffner Realty Company, The South Texas Supply Company, Inc., MRC Transmark Pty Ltd, and MRC SPF Pty Ltd., MRC Transmark B.V., MRC Canada ULC (f/k/a Midfield Supply ULC), MRC Transmark B.V., and MRC Transmark International B.V., MRC Transmark Holdings UK Limited, MRC Transmark Limited, MRC Transmark (Dragon) Limited, and MRC SPF Scanfit Limited, the financial institutions party thereto constituting Required Lenders (as defined in the Loan Agreement referred to therein) and Bank of America, N.A., in its capacity as collateral agent and administrative agent for itself and the other Secured Parties (as defined in the Loan Agreement referred to therein). (Incorporated by reference to Exhibit 10.5 to the Current Report on Form 8-K of MRC Global Inc. filed with the SEC on November 9, 2012).

58
Exhibit Number
Description
21.1* List of Subsidiaries of MRC Global Inc.
23.1* Consent of Ernst & Young LLP, Independent Registered Public Accounting Firm.
31.1* Certification of the Chief Executive Officer pursuant to Rules 13a-14(a) and 15d-14(a) promulgated under the Securities and Exchange Act of 1934, as amended, and Item 601(b)(31) of Regulation S-K, as adopted pursuant to Section 302 of the Sarbanes-Oxley Act of 2002.
31.2* Certification of the Chief Financial Officer pursuant to Rules 13a-14(a) and 15d-14(a) promulgated under the Securities and Exchange Act of 1934, as amended, and Item 601(b)(31) of Regulation S-K, as adopted pursuant to Section 302 of the Sarbanes-Oxley Act of 2002.
32** Certification of the Chief Executive Officer and the Chief Financial Officer pursuant to 18 U.S.C. Section 1350, as adopted pursuant to Section 906 of the Sarbanes-Oxley Act of 2002.
100* The following financial information from MRC Global Inc.’s Annual Report on Form 10-K for the period ended December 31, 2012, formatted in Extensible Business Reporting Language (XBRL): (i) the Consolidated Balance Sheet at December 31, 2012 and December 31, 2011, (ii) the Consolidated Statement of Income for the three and twelve month periods ended December 31, 2012 and 2011, (iii) the Consolidated Statement of Comprehensive Income for the three and twelve month periods ended December 31, 2012 and 2011, (iv) the Consolidated Statement of Cash Flows for the twelve month period ended December 31, 2012 and 2011 and (v) Notes to Condensed Consolidated Financial Statements.
101* Interactive data file.
101.INS* XBRL Instance Document
101.SCH* XBRL Taxonomy Extension Schema
101.CAL* XBRL Taxonomy Extension Calculation Linkbase
101.DEF* XBRL Taxonomy Extension Definition Linkbase
101.LAB* XBRL Taxonomy Extension Label Linkbase
101.PRE* XBRL Taxonomy Extension Presentation Linkbase
† Management contract or compensatory plan or arrangement required to be posted as an exhibit to this report. * Filed herewith. ** Furnished herewith.

59
Pursuant to the requirements of the Securities Exchange Act of 1934, the registrant has duly caused this report to be signed on its behalf by the undersigned, thereunto duly authorized.
SIGNATURES
MRC GLOBAL INC. By: /s/ ANDREW R. LANE
Andrew R. Lane
Chairman, President and Chief Executive Officer
Date: February 22, 2013
Pursuant to the requirements of the Securities Exchange Act of 1934, this report has been signed below by the following persons on behalf of the registrant and in the capacity and on the dates indicated.
Signature
Title
Date
/S/ ANDREW R. LANE
Andrew R. Lane Chairman, President and Chief Executive Officer (principal executive officer)
February 22, 2013
/S/ JAMES E. BRAUN
James E. Braun Executive Vice President and Chief Financial Officer (principal financial officer)
February 22, 2013
/S/ ELTON BOND
Elton Bond Senior Vice President and Chief Accounting Officer (principal accounting officer)
February 22, 2013
/S/ LEONARD M. ANTHONY
Leonard M. Anthony Director February 22, 2013
/S/ RHYS J. BEST
Rhys J. Best Director February 22, 2013
/S/ PETER C. BOYLAN, III
Peter C. Boylan, III Director February 22, 2013
/S/ HENRY CORNELL
Henry Cornell Director February 22, 2013
/S/ CHRISTOPHER A.S. CRAMPTON
Christopher A.S. Crampton Director February 22, 2013
/S/ JOHN F. DALY
John F. Daly Director February 22, 2013
/S/ CRAIG KETCHUM
Craig Ketchum Director February 22, 2013
/S/ GERARD P. KRANS
Gerard P. Krans Director February 22, 2013
/S/ DR. CORNELIS ADRIANUS LINSE
Dr. Cornelis Adrianus Linse Director February 22, 2013
/S/ JOHN A. PERKINS
John A. Perkins Director February 22, 2013
/S/ H.B. WEHRLE, III
H.B. Wehrle, III Director February 22, 2013
F-1
MANAGEMENT’S REPORT ON INTERNAL CONTROL OVER FINANCIAL REPORTING MRC Global Inc.’s management is responsible for establishing and maintaining adequate internal control over financial reporting. MRC Global Inc.’s internal control system was designed to provide reasonable assurance regarding the reliability of financial reporting and the preparation of financial statements for external purposes in accordance with generally accepted accounting principles.
Internal control over financial reporting cannot provide absolute assurance of achieving financial reporting objectives because of its inherent limitations. Internal control over financial reporting is a process that involves human diligence and compliance and is subject to lapses in judgment and breakdowns resulting from human failures. Internal control over financial reporting also can be circumvented by collusion or improper management override. Because of such limitations, there is a risk that material misstatements may not be prevented or detected on a timely basis by internal control over financial reporting. However, these inherent limitations are known features of the financial reporting process. Therefore, it is possible to design into the process safeguards to reduce, though not eliminate, this risk.
Management has used the framework set forth in the report entitled “Internal Control—Integrated Framework” published by the Committee of Sponsoring Organizations (“COSO”) of the Treadway Commission to evaluate the effectiveness of the Company’s internal control over financial reporting. Management has concluded that the Company’s internal control over financial reporting was effective as of December 31, 2012.
Management has excluded OneSteel Piping Systems and Production Specialty Services, Inc. from its assessment of internal controls over financial reporting as of December 31, 2012 because the Company acquired the assets and operations of OneSteel Piping Systems effective March 5, 2012, and Production Specialty Services, Inc. effective December 31, 2012. OneSteel Piping Systems and Production Specialty Services, Inc. constituted approximately 6% and 3% of consolidated assets and revenues, respectively, as of and for the year ended December 31, 2012.
Ernst & Young LLP, the independent registered public accounting firm that audited the Company’s consolidated financial statements included in this Form 10-K, has issued an attestation report on the Company’s internal control over financial reporting. Ernst & Young LLP’s attestation report on the Company’s internal control over financial reporting is included in this Form 10-K.
/S/ ANDREW R. LANE
Andrew R. Lane Chairman, President and Chief Executive Officer
/s/ JAMES E. BRAUN
James E. Braun Executive Vice President and Chief Financial Officer
Houston, TX February 22, 2013

F-2
Report of Independent Registered Public Accounting Firm The Board of Directors and Stockholders MRC Global Inc. and Subsidiaries
We have audited MRC Global Inc. and subsidiaries’ internal control over financial reporting as of December 31, 2012, based on criteria established in Internal Control—Integrated Framework issued by the Committee of Sponsoring Organizations of the Treadway Commission (the COSO criteria). MRC Global Inc. and subsidiaries’ management is responsible for maintaining effective internal control over financial reporting, and for its assessment of the effectiveness of internal control over financial reporting included in the accompanying Management’s Report on Internal Control over Financial Reporting. Our responsibility is to express an opinion on the company’s internal control over financial reporting based on our audit.
We conducted our audit in accordance with the standards of the Public Company Accounting Oversight Board (United States). Those standards require that we plan and perform the audit to obtain reasonable assurance about whether effective internal control over financial reporting was maintained in all material respects. Our audit included obtaining an understanding of internal control over financial reporting, assessing the risk that a material weakness exists, testing and evaluating the design and operating effectiveness of internal control based on the assessed risk, and performing such other procedures as we considered necessary in the circumstances. We believe that our audit provides a reasonable basis for our opinion.
A company’s internal control over financial reporting is a process designed to provide reasonable assurance regarding the reliability of financial reporting and the preparation of financial statements for external purposes in accordance with generally accepted accounting principles. A company’s internal control over financial reporting includes those policies and procedures that (1) pertain to the maintenance of records that, in reasonable detail, accurately and fairly reflect the transactions and dispositions of the assets of the company; (2) provide reasonable assurance that transactions are recorded as necessary to permit preparation of financial statements in accordance with generally accepted accounting principles, and that receipts and expenditures of the company are being made only in accordance with authorizations of management and directors of the company; and (3) provide reasonable assurance regarding prevention or timely detection of unauthorized acquisition, use or disposition of the company’s assets that could have a material effect on the financial statements.
Because of its inherent limitations, internal control over financial reporting may not prevent or detect misstatements. Also, projections of any evaluation of effectiveness to future periods are subject to the risk that controls may become inadequate because of changes in conditions, or that the degree of compliance with the policies or procedures may deteriorate.
As indicated in the accompanying “Management’s Report on Internal Control over Financial Reporting,” management’s assessment of and conclusion on the effectiveness of internal control over financial reporting did not include the internal controls of the businesses of OneSteel Piping Systems and Production Specialty Services, Inc. which are included in the December 31, 2012 consolidated financial statements of MRC Global Inc. and subsidiaries and constituted approximately 6% and 3% of consolidated assets and revenues, respectively, as of and for the year ended December 31, 2012. Our audit of internal control over financial reporting of MRC Global Inc. and subsidiaries also did not include an evaluation of the internal control over financial reporting of OneSteel Piping Systems and Production Specialty Services, Inc.
In our opinion, MRC Global Inc. and subsidiaries maintained, in all material respects, effective internal control over financial reporting as of December 31, 2012, based on the COSO criteria.
We also have audited, in accordance with the standards of the Public Company Accounting Oversight Board (United States), the consolidated balance sheets of MRC Global Inc. and subsidiaries as of December 31, 2012 and 2011, and the related consolidated statements of operations, comprehensive income, stockholders’ equity and cash flows for each of the three years in the period ended December 31, 2012 and our report dated February 22, 2013 expressed an unqualified opinion thereon.
/s/ Ernst & Young LLP
Charleston, West Virginia February 22, 2013

F-3
Report of Independent Registered Public Accounting Firm The Board of Directors and Stockholders MRC Global Inc. and Subsidiaries
We have audited the accompanying consolidated balance sheets of MRC Global Inc. and subsidiaries as of December 31, 2012 and 2011, and the related consolidated statements of operations, comprehensive income, stockholders’ equity and cash flows for each of the three years in the period ended December 31, 2012. These financial statements are the responsibility of the Company’s management. Our responsibility is to express an opinion on these financial statements based on our audits.
We conducted our audits in accordance with the standards of the Public Company Accounting Oversight Board (United States). Those standards require that we plan and perform the audit to obtain reasonable assurance about whether the financial statements are free of material misstatement. An audit includes examining, on a test basis, evidence supporting the amounts and disclosures in the financial statements. An audit also includes assessing the accounting principles used and significant estimates made by management, as well as evaluating the overall financial statement presentation. We believe that our audits provide a reasonable basis for our opinion.
In our opinion, the financial statements referred to above present fairly, in all material respects, the consolidated financial position of MRC Global Inc. and subsidiaries at December 31, 2012 and 2011, and the consolidated results of their operations and their cash flows for each of the three years in the period ended December 31, 2012, in conformity with U.S. generally accepted accounting principles.
We also have audited, in accordance with the standards of the Public Company Accounting Oversight Board (United States), MRC Global Inc. and subsidiaries’ internal control over financial reporting as of December 31, 2012, based on criteria established in Internal Control-Integrated Framework issued by the Committee of Sponsoring Organizations of the Treadway Commission and our report dated February 22, 2013 expressed an unqualified opinion thereon.
/s/ Ernst & Young LLP
Charleston, West Virginia February 22, 2013

F-4
CONSOLIDATED BALANCE SHEETS MRC GLOBAL INC.
December 31,
2012
2011
(In thousands, except per share amounts) Assets
Current assets:
Cash $ 37,090 $ 46,127 Accounts receivable, net 823,236 791,280 Inventories 970,228 899,064 Deferred income taxes 6,603 2,215 Income taxes receivable 248 — Other current assets 13,169 11,437
Total current assets 1,850,574 1,750,123
Other assets 37,031 39,212
Property, plant and equipment, net 122,458 107,430
Intangible assets:
Goodwill, net 610,392 561,270 Other intangible assets, net 749,272 771,867
1,359,664 1,333,137
$ 3,369,727 $ 3,229,902
Liabilities and stockholders’ equity
Current liabilities:
Trade accounts payable $ 438,344 $ 479,584 Accrued expenses and other current liabilities 124,026 108,973 Income taxes payable — 11,950 Deferred revenue 1,573 4,450 Deferred income taxes 79,661 70,425 Current portion of long-term debt 6,500 —
Total current liabilities 650,104 675,382
Long-term obligations:
Long-term debt, net 1,250,089 1,526,740 Deferred income taxes 261,448 288,985 Other liabilities 22,164 17,933
1,533,701 1,833,658 Commitments and contingencies
Stockholders’ equity:
Common stock, $0.01 par value per share; 500,000 shares authorized, 101,563 and 84,427 issued and outstanding, respectively 1,016 844
Preferred stock, $0.01 par value per share; 100,000 shares authorized, no shares issued and outstanding — —
Additional paid-in-capital 1,625,900 1,282,949 Retained (deficit) (418,830) (536,791) Accumulated other comprehensive loss (22,164) (26,140)
1,185,922 720,862
$ 3,369,727 $ 3,229,902
See notes to consolidated financial statements.

F-5
CONSOLIDATED STATEMENTS OF OPERATIONS MRC GLOBAL INC.
Year Ended December 31,
2012
2011
2010
(In thousands, except per share amounts) Sales $ 5,570,858 $ 4,832,423 $ 3,845,536 Cost of sales 4,557,115 4,124,271 3,327,434
Gross profit 1,013,743 708,152 518,102
Selling, general and administrative expenses 606,753 513,563 451,680
Operating income 406,990 194,589 66,422
Other income (expense):
Interest expense (112,519) (136,844) (139,641) Loss on early extinguishment of debt (113,961) — — Write off of debt issuance costs (1,685) (9,450) — Change in fair value of derivative instruments 2,186 7,044 (4,926) Other, net 685 429 2,968
Income (loss) before income taxes 181,696 55,768 (75,177) Income tax expense (benefit) 63,738 26,784 (23,353)
Net income (loss) $ 117,958 $ 28,984 $ (51,824)
Basic earnings (loss) per common share $ 1.22 $ 0.34 $ (0.61) Diluted earnings (loss) per common share $ 1.22 $ 0.34 $ (0.61) Weighted-average common shares, basic 96,465 84,417 84,384 Weighted-average common shares, diluted 96,925 84,655 84,384
See notes to consolidated financial statements.
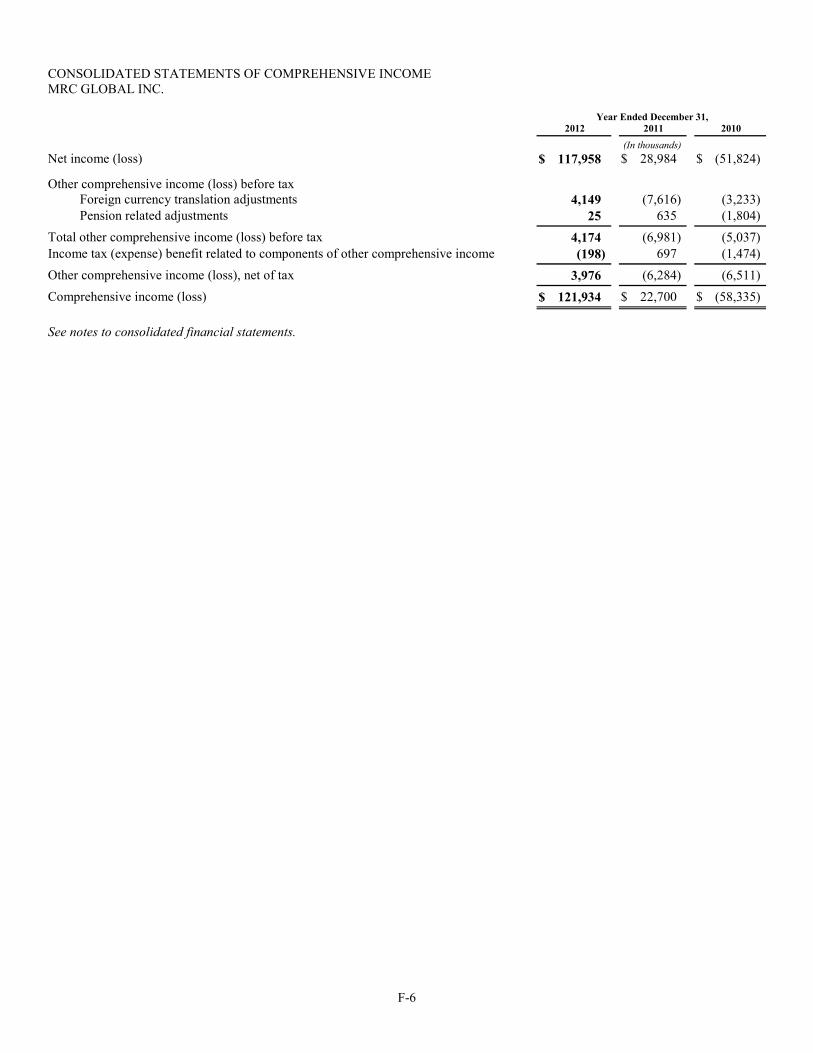
F-6
CONSOLIDATED STATEMENTS OF COMPREHENSIVE INCOME MRC GLOBAL INC.
Year Ended December 31,
2012
2011
2010
(In thousands) Net income (loss) $ 117,958 $ 28,984 $ (51,824)
Other comprehensive income (loss) before tax
Foreign currency translation adjustments 4,149 (7,616) (3,233) Pension related adjustments 25 635 (1,804)
Total other comprehensive income (loss) before tax 4,174 (6,981) (5,037) Income tax (expense) benefit related to components of other comprehensive income (198) 697 (1,474)
Other comprehensive income (loss), net of tax 3,976 (6,284) (6,511)
Comprehensive income (loss) $ 121,934 $ 22,700 $ (58,335)
See notes to consolidated financial statements.

F-7
CONSOLIDATED STATEMENTS OF STOCKHOLDERS’ EQUITY MRC GLOBAL INC.
Common Stock
Additional Paid-in Capital
Retained Earnings (Deficit)
Accumulated Other
Comprehensive Income (Loss)
Total Stockholders’
Equity
Shares
Amount
(In thousands) Balance at December 31, 2009 84,368 $ 843 $ 1,270,616 $ (514,216) $ (13,345) $ 743,898
Net loss — — — (51,824) — (51,824) Foreign currency translation, net of tax — — — — (4,707) (4,707) Pension related adjustments, net of tax — — — — (1,804) (1,804)
Net comprehensive loss
(58,335) Equity contribution 11 — 200 — — 200 Restricted stock vested during period 25 1 — — — 1 Forfeited dividends on forfeited
unvested restricted stock — — — 250 — 250 Equity-based compensation expense — — 3,744 — — 3,744
Balance at December 31, 2010 84,404 844 1,274,560 (565,790) (19,856) 689,758 Net Income — — — 28,984 — 28,984 Foreign currency translation, net of tax — — — — (6,919) (6,919) Pension related adjustments, net of tax — — — — 635 635
Net comprehensive loss
22,700 Restricted stock vested during period 23 — 1 — — 1 Forfeited dividends on forfeited
unvested restricted stock — — — 15 — 15 Equity-based compensation expense — — 8,385 — — 8,385 Exercise of stock options — — 3 — — 3
Balance at December 31, 2011 84,427 844 1,282,949 (536,791) (26,140) 720,862 Net income — — — 117,958 — 117,958 Foreign currency translation, net of tax — — — — 3,793 3,793 Pension related adjustments, net of tax — — — — 183 183
Net comprehensive income 121,934
Common stock issued in initial public offering 17,046 171 333,171 — — 333,342
Restricted stock vested during period 22 — — — — — Forfeited dividends on forfeited
unvested restricted stock — — — 3 — 3 Equity-based compensation expense — — 8,475 — — 8,475 Exercise of stock options 68 1 676 — — 677 Tax benefit on stock based
compensation — — 629 — — 629
Balance at December 31, 2012 101,563 $ 1,016 $ 1,625,900 $ (418,830) $ (22,164) $ 1,185,922
See notes to consolidated financial statements.

F-8
CONSOLIDATED STATEMENTS OF CASH FLOWS MRC GLOBAL INC.
(In thousands) Year Ended December 31,
2012
2011
2010
Operating activities
Net income (loss) $ 117,958 $ 28,984 $ (51,824) Adjustments to reconcile net income (loss) to net cash provided by (used in) operations:
Depreciation and amortization 18,585 17,046 16,579 Amortization of intangibles 49,466 50,652 53,852 Equity-based compensation expense 8,475 8,385 3,744 Deferred income tax (benefit) expense (20,432) (16,362) 2,673 Amortization of debt issuance costs 8,782 10,456 11,800 Loss on early extinguishment of debt 113,961 — — Write off of debt issuance costs 1,685 9,450 — (Decrease) increase in LIFO reserve (24,140) 73,703 74,557 Change in fair value of derivative instruments (2,186) (7,044) 4,926 Hedge termination — — (25,038) Provision for uncollectible accounts 2,428 433 (2,042) Other non-cash items 6,961 4,025 622 Changes in operating assets and liabilities:
Accounts receivable 22,399 (177,744) (83,648) Inventories 26,674 (182,173) 27,098 Income taxes (12,593) 45,333 (12,278) Other current assets (681) (35) 1,249 Accounts payable (84,380) 36,550 85,074 Deferred revenue (2,921) (13,642) 1,071 Accrued expenses and other current liabilities 10,031 9,086 4,293
Net cash provided by (used in) operations 240,072 (102,897) 112,708
Investing activities
Purchases of property, plant and equipment (26,189) (18,056) (14,307) Proceeds from the disposition of property, plant & equipment 2,272 3,087 3,054 Acquisitions, net of cash acquired of $0, $2,036, and $781 (152,367) (39,865) (12,393) Proceeds from the sale of assets held for sale — 10,594 4,060 Other investment and notes receivable transactions (6,755) (3,795) 3,351
Net cash used in investing activities (183,039) (48,035) (16,235)
Financing activities
Proceeds from the sale of common stock 333,342 — — Net proceeds from/(payments) on revolving credit facilities 149,699 150,428 (141,899) Purchases and redemption of senior secured notes (1,135,223) — — Proceeds from issuance of term loan 643,500 — — Proceeds from issuance of senior secured notes — — 47,897 Payments on long-term obligations (33,081) — — Debt issuance costs paid (20,038) (9,836) (4,386) Proceeds from exercise of stock options 677 3 — Tax benefit on stock options 629 — — Forfeited dividends on forfeited unvested restricted stock 3 — — Cash equity contributions — — 200
Net cash (used in) provided by financing activities (60,492) 140,595 (98,188)
Decrease in cash (3,459) (10,337) (1,715) Effect of foreign exchange rate on cash (5,578) 262 1,673 Cash—beginning of year 46,127 56,202 56,244
Cash—end of year $ 37,090 $ 46,127 $ 56,202
Supplemental disclosures of cash flow information:
Cash paid for interest $ 104,846 $ 124,039 $ 125,419 Cash paid for (received from) income taxes $ 96,526 $ (1,051) $ (10,250)
See notes to consolidated financial statements.

F-9
NOTES TO CONSOLIDATED FINANCIAL STATEMENTS MRC GLOBAL INC. December 31, 2012 NOTE 1—SIGNIFICANT ACCOUNTING POLICIES Business Operations: MRC Global Inc. is a holding company headquartered in Houston, Texas. We are a majority owned subsidiary of PVF Holdings LLC. Our wholly owned subsidiaries, McJunkin Red Man Corporation and its subsidiaries, are global distributors of pipe, valves, fittings and related products and services across each of the upstream (exploration, production and extraction of underground oil and gas), midstream (gathering and transmission of oil and gas, gas utilities, and the storage and distribution of oil and gas) and downstream (crude oil refining, petrochemical processing and general industrials) sectors. We have branches in principal industrial, hydrocarbon producing and refining areas throughout the United States, Canada, Europe, Asia and Australasia. Our products are obtained from a broad range of suppliers.
Basis of Presentation: The consolidated financial statements include the accounts of MRC Global Inc. and its wholly owned and majority owned subsidiaries (collectively referred to as the “Company” or by such terms as “we,” “our” or “us”). All material intercompany balances and transactions have been eliminated in consolidation.
Use of Estimates: The preparation of financial statements in conformity with the accounting principles generally accepted in the United States of America requires us to make estimates and assumptions that affect the reported amounts of assets and liabilities and disclosure of contingent assets and liabilities at the date of the financial statements and the reported amounts of revenues and expenses during the reported period. We believe that our most significant estimates and assumptions are related to estimated losses on accounts receivable, the last-in, first-out (“LIFO”) inventory costing methodology, estimated realizable value on excess and obsolete inventories, goodwill, intangibles, deferred taxes and self-insurance programs. Actual results could differ materially from those estimates.
Cash Equivalents: We consider all highly liquid investments with maturities of three months or less at the date of purchase to be cash equivalents.
Allowance for Doubtful Accounts: We evaluate the adequacy of the allowance for losses on receivables based upon periodic evaluation of accounts that may have a higher credit risk using information available about the customer and other relevant data. This formal analysis is inherently subjective and requires us to make significant estimates of factors affecting doubtful accounts, including customer specific information, current economic conditions, volume, growth and composition of the account, and other factors such as financial statements, news reports and published credit ratings. The amount of the allowance for the remainder of the trade balance is not evaluated individually but is based upon historical loss experience. Because this process is subjective and based on estimates, ultimate losses may differ from those estimates. Receivable balances are written off when we determine that the balance is uncollectible. Subsequent recoveries, if any, are credited to the allowance when received. The provision for losses on receivables is included in selling, general and administrative expenses in the accompanying consolidated statements of operations.
Inventories
Allowances for excess and obsolete inventories are determined based on analyses comparing inventories on hand to sales trends. The allowance, which totaled $19.0 million and $16.5 million at December 31, 2012 and 2011, is the amount deemed necessary to reduce the cost of the inventory to its estimated realizable value.
: Our inventories are valued at the lower of cost, principally LIFO, or market. We believe that the use of LIFO results in a better matching of costs and revenues. This practice excludes certain inventories, which are held outside of the United States, approximating $318.9 million and $217.0 million at December 31, 2012 and 2011, which are valued at the lower of weighted-average cost or market. Our inventory is substantially comprised of finished goods.
Debt Issuance Costs: We defer costs directly related to obtaining financing and amortize them over the term of the indebtedness on a straight-line basis. The use of the straight-line method does not produce results that are materially different from those which would result from the use of the effective interest method. Such amounts are reflected in the consolidated statement of operations as a component of interest expense. Debt issuance costs are shown net of accumulated amortization of $4.8 million and $3.5 million at December 31, 2012 and 2011.
Fixed Assets: Land, buildings and equipment are stated on the basis of cost. For financial statement purposes, depreciation is computed over the estimated useful lives of such assets principally by the straight-line method; accelerated depreciation and cost recovery methods are used for income tax purposes. Leasehold improvements are amortized using the straight-line method over the shorter of the remaining lease term or the estimated useful life of the improvements. When assets are retired or otherwise disposed of, the cost and related accumulated depreciation are removed from the accounts and any gain or loss is reflected in income for the period. Maintenance and repairs are charged to expense as incurred.

F-10
Goodwill and Other Intangible Assets
The goodwill impairment test compares the carrying value of the reporting unit that has the goodwill with the estimated fair value of that reporting unit. If the carrying value is more than the estimated fair value, we then calculate the implied fair value of goodwill by deducting the fair value of all tangible and intangible net assets of the reporting unit from the estimated fair value of the reporting unit. Impairment losses are recognized to the extent that recorded goodwill exceeds implied goodwill. Our impairment methodology uses discounted cash flow and multiples of cash earnings valuation techniques, plus valuation comparisons to similar businesses. These valuation methods require us to make certain assumptions and estimates regarding future operating results, the extent and timing of future cash flows, working capital, sales prices, profitability, discount rates and growth trends. While we believe that such assumptions and estimates are reasonable, the actual results may differ materially from the projected results.
: Goodwill represents the excess of cost over the fair value of net assets acquired. Goodwill is tested for impairment annually or more frequently if circumstances indicate that impairment may exist. We evaluate goodwill for impairment at three reporting units that mirror our three segments (U.S., Canada and International).
Intangible assets with indefinite useful lives are tested for impairment annually or more frequently if circumstances indicate that impairment may exist. This test compares the carrying value of the indefinite lived intangible assets with their estimated fair value. If the carrying value is more than the estimated fair value, impairment losses are recognized in an amount equal to the excess of the carrying value over the estimated fair value. Our impairment methodology uses discounted cash flow and estimated royalty rate valuation techniques. These valuation methods require us to make certain assumptions and estimates regarding future operating results, sales prices, discount rates and growth trends. While we believe that such assumptions and estimates are reasonable, the actual results may differ materially from the projected results.
Other intangible assets primarily include trade names, customer bases and noncompetition agreements resulting from business acquisitions. Other intangible assets are recorded at fair value at the date of acquisition. Amortization is provided using the straight-line method over their estimated useful lives, ranging from two to twenty years.
The carrying value of amortizable intangible assets is subject to an impairment test when events or circumstances indicate a possible impairment. When events or circumstances indicate a possible impairment, we assess recoverability from future operations using undiscounted cash flows derived from the lowest appropriate asset group. If the carrying value exceeds the undiscounted cash flows, an impairment charge would be recognized to the extent that the carrying value exceeds the fair value, which is determined based on a discounted cash flow analysis. While we believe that assumptions and estimates utilized in the impairment analysis are reasonable, the actual results may differ materially from the projected results. These impairments are determined prior to performing our goodwill impairment test.
Derivatives and Hedging
We utilize foreign exchange forward contracts (exchange contracts) to manage our foreign exchange rate risks resulting from purchase commitments and sales orders. Changes in the fair values of our exchange contracts are based upon independent market quotes. We do not designate our exchange contracts as hedging instruments; therefore, we record our exchange contracts on the consolidated balance sheets at fair value, with the gains and losses recognized in earnings in the period of change.
: From time to time, we utilize interest rate swaps to reduce our exposure to potential interest rate increases. Changes in the fair values of our derivative instruments are based upon independent market quotes. We do not designate our interest rate swaps as hedging instruments; therefore, we record our interest rate swaps on the consolidated balance sheets at fair value, with the gains and losses recognized in earnings in the period of change.
Fair Value
Level 1: Quoted prices (unadjusted) in active markets for identical assets or liabilities that the entity has the ability to access at the measurement date.
: We measure certain of our assets and liabilities at fair value on a recurring basis. Fair value is an exit price, representing the amount that would be received to sell an asset or be paid to transfer a liability in an orderly transaction between market participants. As such, fair value is a market-based measurement that is determined based on assumptions that market participants would use in pricing an asset or a liability. A three-tier fair value hierarchy is established as a basis for considering such assumptions for inputs used in the valuation methodologies to measuring fair value:
Level 2: Significant observable inputs other than quoted prices included within Level 1 that are observable for the asset or liability, either directly or indirectly, such as quoted prices for similar assets or liabilities, quoted prices in markets that are not active, and other inputs that are observable or can be corroborated by observable market data. Level 3: Significant unobservable inputs for the asset or liability. Unobservable inputs reflect our own assumptions about the assumptions that market participants would use in pricing an asset or liability (including all assumptions about risk).
Certain assets and liabilities are measured at fair value on a nonrecurring basis. Our assets and liabilities measured at fair value on a nonrecurring basis include property, plant and equipment, goodwill and other intangible assets. We do not measure these assets at fair value on an ongoing basis; however, these assets are subject to fair value adjustments in certain circumstances, such as when there is evidence of impairment.

F-11
Our impairment methodology for goodwill and other intangible assets uses both (i) a discounted cash flow analysis requiring certain assumptions and estimates to be made regarding the extent and timing of future cash flows, discount rates and growth trends and (ii) valuation based on our publicly traded common stock. As all of the assumptions employed to measure these assets and liabilities on a nonrecurring basis are based on management’s judgment using internal and external data, these fair value determinations are classified as Level 3. We have not elected to apply the fair value option to any of our eligible financial assets and liabilities.
Insurance: We are self-insured for first party automobile coverage, product recall, ocean cargo shipments and portions of employee healthcare and asbestos claims. In addition, we maintain a nonmaterial deductible program as it relates to workers’ compensation, automobile liability, property and general liability claims including, but not limited to, certain product liability claims, which are secured by various letters of credit totaling $5.6 million. Our estimated liability and related expenses for claims are based in part upon estimates provided by insurance carriers, third-party administrators, and actuaries. Insurance reserves are deemed by us to be sufficient to cover outstanding claims, including those incurred but not reported as of the estimation date. Further, we maintain a commercially reasonable umbrella/excess policy that covers liabilities in excess of the primary limits.
Income Taxes
Deferred tax assets and liabilities are recorded for differences between the financial reporting and tax bases of assets and liabilities using the tax rate expected to be in effect when the taxes will actually be paid or refunds received. The effect on deferred tax assets and liabilities of a change in tax rates is recognized in earnings in the period that includes the enactment date. A valuation allowance to reduce deferred tax assets is established when it is more likely than not that some portion or all of the deferred tax assets will not be realized.
: We use the liability method for determining our income taxes, under which current and deferred tax liabilities and assets are recorded in accordance with enacted tax laws and rates. Under this method, the amounts of deferred tax liabilities and assets at the end of each period are determined using the tax rate expected to be in effect when taxes are actually paid or recovered.
Our tax provision is based upon our expected taxable income and statutory rates in effect in each country in which we operate. We are subject to the jurisdiction of numerous domestic and foreign tax authorities, as well as to tax agreements and treaties among these governments. Determination of taxable income in any jurisdiction requires the interpretation of the related tax laws and regulations and the use of estimates and assumptions regarding significant future events such as the amount, timing and character of deductions, permissible revenue recognition methods under the tax law and the sources and character of income and tax credits. Changes in tax laws, regulations, agreements and treaties, foreign currency exchange restrictions or our level of operations or profitability in each taxing jurisdiction could have an impact on the amount of income taxes we provide during any given year.
A tax benefit from an uncertain tax position may be recognized when it is more likely than not that the position will be sustained upon examination, including any related appeals or litigation processes, on the basis of the technical merits. We adjust these liabilities when our judgment changes as a result of the evaluation of new information not previously available. Because of the complexity of some of these uncertainties, the ultimate resolution may result in a payment that is materially different from our current estimate of the tax liabilities. These differences will be reflected as increases or decreases to income tax expense in the period in which the new information is available. We classify interest and penalties related to unrecognized tax positions as income taxes in our financial statements.
We intend to permanently reinvest certain earnings of our foreign subsidiaries in operations outside the U.S., and accordingly, we have not provided for U.S. income taxes on such earnings.
Foreign Currency Translation and Transactions: The functional currency of our foreign operations is the applicable local currency. The cumulative effects of translating the balance sheet accounts from the functional currency into the U.S. dollar at current exchange rates are included in accumulated other comprehensive income. The balance sheet accounts (with the exception of stockholders’ equity) are translated using current exchange rates as of the balance sheet date. Stockholders’ equity is translated at historical exchange rates and revenue and expense accounts are translated using a weighted-average exchange rate during the year. Gains or losses resulting from foreign currency transactions are recognized in the consolidated statements of income within other, net.
Equity-Based Compensation: Our equity-based compensation consists of (1) restricted common units and profit units of PVF Holdings LLC and (2) restricted stock and nonqualified stock options of our Company. The cost of employee services received in exchange for an award of an equity instrument is measured based on the grant-date fair value of the award. Our policy is to expense equity-based compensation using the fair-value of awards granted, modified or settled. Restricted common units, profit units and restricted stock are credited to equity as they are expensed over their vesting periods based on the grant date value of the shares vested. The fair value of nonqualified stock options is measured on the grant date of the related equity instrument using the Black-Scholes option-pricing model and is recognized as compensation expense over the applicable vesting period.
Revenue Recognition: Sales to our principal customers are made pursuant to agreements that normally provide for transfer of legal title and risk upon shipment. We recognize revenue as products are shipped, title has transferred to the customer and the customer assumes the risks and rewards of ownership, and collectability is reasonably assured. Freight charges billed to customers are reflected

F-12
in revenues. Return allowances are estimated using historical experience. Amounts received in advance of shipment are deferred and recognized as revenue when the products are shipped and title transfers. Sales taxes collected from customers and remitted to governmental authorities are accounted for on a net basis and therefore are excluded from net sales in the accompanying consolidated statements of income.
Cost of Sales: Cost of sales includes the cost of inventory sold and related items, such as vendor rebates, inventory allowances, and shipping and handling costs associated with inbound and outbound freight. Certain purchasing costs and warehousing activities (including receiving, inspection and stocking costs), as well as general warehousing expenses, are included in selling, general and administrative expenses and not in cost of sales. As such, our gross margin may not be comparable to others that may include these expenses as a component of cost of sales. Purchasing and warehousing costs approximated $34.8 million, $27.3 million, and $25.5 million for the years ended December 31, 2012, 2011, and 2010.
Earnings per Share: Basic earnings per share are computed based on the weighted-average number of common shares outstanding, excluding any dilutive effects of unexercised stock options and unvested restricted stock. Diluted earnings per share are computed based on the weighted-average number of common shares outstanding including any dilutive effect of unexercised stock options and unvested restricted stock. The dilutive effect of unexercised stock options and unvested restricted stock is calculated under the treasury stock method.
Concentration of Credit Risk
We have a broad supplier base, sourcing our products in most regions of the world. During 2012 and 2011, we did not have purchases from any one vendor in excess of 10% of our gross purchases, while during 2010 we had purchases from one vendor in excess of 10% of our gross purchases (11%). At those respective year-ends no individual vendor balance exceeded 10% of gross accounts payable.
: Most of our business activity is with customers in the energy and industrial sectors. In the normal course of business, we grant credit to these customers in the form of trade accounts receivable. These receivables could potentially subject us to concentrations of credit risk; however, we minimize this risk by closely monitoring extensions of trade credit. We generally do not require collateral on trade receivables. We have a broad customer base doing business in many regions of the world. During 2012, 2011 and 2010, we did not have sales to any one customer in excess of 10% of gross sales. At those respective year-ends, no individual customer balances exceeded 10% of gross accounts receivable.
We maintain the majority of our cash and cash equivalents with several financial institutions. These financial institutions are located in many different geographical regions with varying economic characteristics and risks. Deposits held with banks may exceed insurance limits. We believe the risk of loss associated with our cash equivalents to be remote.
Segment Reporting: We have three operating and reportable segments, the United States of America, Canada, and International, which includes Europe, Asia, and Australasia. These segments represent our global business of providing pipe, valves, fittings and related products and services to the energy and industrial sectors, across each of the upstream (exploration, production and extraction of underground oil and gas), midstream (gathering and transmission of oil and gas, gas utilities, and the storage and distribution of oil and gas) and downstream (crude oil refining and petrochemical processing) markets, through our distribution operations located throughout the world. We have recast segment operating results for 2011 and 2010 to conform with certain organizational realignments in 2012.
Reclassifications: Certain immaterial amounts in the prior years’ balance sheet, statements of operations and statements of cash flows have been reclassified to conform to the current year’s presentation.
Recently Issued Accounting Standards:
In October 2012, the Financial Accounting Standards Board (FASB) issued Accounting Standards Update No. 2012-04, Technical Corrections and Improvements, to clarify the codification and correct unintended applications of guidance that are not expected to have a significant effect on current accounting practice or create a significant administrative cost to most entities. The amendments in ASU 2012-04 cover a wide range of topics in the codification and are classified as either technical corrections and improvements or conforming amendments related to fair value measurements. The amendments in ASU 2012-04 that do not have transition guidance are effective for us in fiscal 2012, while the amendments that are subject to the transition guidance are effective for us in fiscal 2013. We do not believe that ASU No. 2012-04 will have a material impact on our consolidated financial statements.
In July 2012, the Financial Accounting Standards Board (FASB) issued Accounting Standards Update No. 2012-02, Intangibles—Goodwill and Other (Topic 350)—Testing Indefinite-Lived Intangible Assets for Impairment (ASU 2012-02), to allow entities to use a qualitative approach to test indefinite-lived intangible assets for impairment. ASU 2012-02 permits an entity to first perform a qualitative assessment to determine whether it is more likely than not that the fair value of an indefinite-lived intangible asset is less than its carrying value. If it is concluded that this is the case, it is then necessary to perform the currently prescribed quantitative impairment test by comparing the fair value of the indefinite-lived intangible asset with its carrying value. Otherwise, the quantitative impairment test is not required. ASU 2012-02 is effective for us in fiscal 2013 and early adoption is permitted. We do not believe that ASU No. 2012-02 will have a material impact on our consolidated financial statements.

F-13
In 2012, we completed three acquisitions for an aggregate purchase price of $152.4 million. These acquisitions included: NOTE 2—ACQUISITIONS
• The assets and operations of OneSteel Piping Systems, now known as MRC Piping Systems Australia (“MRC PSA”), a leading PVF distributor supplying the oil and gas, mining and mineral processing industries in Australia.
• The assets of Chaparral Supply of Cherokee, Oklahoma which provided us support in the Mississippian Lime formation in Oklahoma and Kansas.
• The assets and operations of Production Specialty Services, Inc. (“PSS”), a regional PVF distributor with 17 locations within the Permian Basin and Eagle Ford shale regions of Texas and New Mexico.
The preliminary purchase price allocation of each acquisition was based on preliminary valuations. Our estimates and assumptions are subject to change upon the receipt and review of final valuations. Goodwill recorded in connection with these transactions is deductable. The consideration paid for these acquisitions has been allocated as follows (in millions):
2012 Acquisitions
Net assets acquired:
Current assets, net of cash acquired $ 129.1 Other long-term assets 11.8 Customer base intangibles 23.1 Other intangible assets 2.6 Goodwill 46.9 Current liabilities (52.4) Other long-term liabilities (8.7)
Cash consideration paid $ 152.4
In 2011, we completed two acquisitions for an aggregate purchase price of $41.9 million. These acquisitions included Stainless Pipe and Fittings Australia Pty. Ltd. (“MRC SPF”), a distributor of stainless steel piping products, and certain assets and operations of Valve Systems and Controls (“VSC”), a Houston, Texas based company specializing in valve automation.
In 2010, we completed two acquisitions for an aggregate purchase price of $13.2 million. These acquisitions included The South Texas Supply Company, Inc. (“South Texas”) and the operations and assets from Dresser Oil Tools, Inc. (“Dresser”) with operations in the Eagle Ford and Bakken Shale regions, respectively.
The impact of these transactions was not material to our financial statements in each of these respective years. Accordingly, no pro forma information has been presented.
The rollforward of our allowance for doubtful accounts is as follows (in thousands): NOTE 3—ACCOUNTS RECEIVABLE
December 31,
2012
2011
2010
Allowance for doubtful accounts
Beginning balance $ 4,815 $ 4,451 $ 8,790 Net charge-offs (1,973) (69) (2,297) Provision 2,428 433 (2,042)
Ending balance $ 5,270 $ 4,815 $ 4,451
Our accounts receivable is also presented net of other volume related allowances. Those allowances approximated $3.3 million and $4.2 million at December 31, 2012 and 2011.

F-14
The composition of our inventory is as follows (in thousands): NOTE 4—INVENTORIES
December 31,
2012
2011
Finished goods inventory at average cost:
Energy carbon steel tubular products $ 387,609 $ 488,938 Valves, fittings, flanges and all other products 752,630 601,706
1,140,239 1,090,644 Less: Excess of average cost over LIFO cost (LIFO reserve) (150,982) (175,122) Less: Other inventory reserves (19,029) (16,458)
$ 970,228 $ 899,064
During 2012, our inventory quantities were reduced, resulting in a liquidation of a LIFO inventory layer that was carried at a lower cost prevailing from a prior year, as compared with current costs in the current year (a “LIFO decrement”). A LIFO decrement results in the erosion of layers created in earlier years, and, therefore, a LIFO layer is not created for years that have decrements. In 2012 and 2010, the effect of this LIFO decrement decreased cost of sales by approximately $1.3 million and $14.1 million, respectively. There was no LIFO decrement in 2011.
Property, plant and equipment consisted of the following (in thousands): NOTE 5—PROPERTY, PLANT AND EQUIPMENT
December 31,
Depreciable Life
2012
2011
Land and improvements — $ 17,465 $ 16,894 Building and building improvements 40 years 55,930 55,458 Machinery and equipment 3 to 10 years 130,289 103,224 Construction in progress — 2,160 638 Property held under capital leases 20 to 30 years 3,500 3,217
209,344 179,431 Allowances for depreciation and amortization (86,886) (72,001)
$ 122,458 $ 107,430
The changes in the carrying amount of goodwill by segment for the years ended December 31, 2012, 2011 and 2010 are as follows (in thousands):
NOTE 6—GOODWILL AND OTHER INTANGIBLE ASSETS
US
Canada
International
Total
Goodwill at December 31, 2009(1) $ 506,574 $ — $ 43,159 $ 549,733 Acquisition of South Texas and Dresser 3,591 — — 3,591 Other (687) — — (687) Effect of foreign currency translation — — (3,253) (3,253)
Goodwill at December 31, 2010(1) $ 509,478 $ — $ 39,906 $ 549,384 Acquisition of VSC 2,780 — — 2,780 Acquisition of MRC SPF — — 11,565 11,565 Other (211) — — (211) Effect of foreign currency translation — — (2,248) (2,248)
Goodwill at December 31, 2011(1) $ 512,047 $ — $ 49,223 $ 561,270 Acquisition of MRC PSA — — 21,829 21,829 Acquisition of PSS 25,051 — — 25,051 Adjustment of MRC SPF purchase price — — 1,197 1,197 Effect of foreign currency translation — — 1,045 1,045
Goodwill at December 31, 2012 $ 537,098 $ — $ 73,294 $ 610,392
(1) Net of accumulated impairment losses of $240.9 and $69.0 in the U.S and Canadian segments, respectively.

F-15
Other intangible assets by major classification consist of the following (in thousands):
Weighted- Average
Amortization Period (in years)
Gross
Accumulated Amortization
Net Book Value
December 31, 2012
Customer base 15.8 $ 721,010 $ (242,355) $ 478,655 Amortizable trade names 6.7 15,671 (6,577) 9,094 Indefinite lived trade names(1) N/A 260,023 — 260,023 Noncompete agreements 3.8 2,470 (970) 1,500
15.6 $ 999,174 $ (249,902) $ 749,272
December 31, 2011
Customer base 16.1 $ 696,326 $ (194,836) $ 501,490 Amortizable trade names 6.0 21,980 (11,642) 10,338 Indefinite lived trade names(1) N/A 260,023 — 260,023 Noncompete agreements 5.0 970 (954) 16
15.8 $ 979,299 $ (207,432) $ 771,867
(1) Net of accumulated impairment losses of $76,200.
Total amortization of intangible assets for each of the years ending December 31, 2013 to 2017 is currently estimated as follows (in thousands):
Amortization of Intangible Assets
2013 $ 53,283 2014 52,709 2015 52,071 2016 51,272 2017 49,680
The significant components of our long-term debt are as follows (in thousands): NOTE 7—LONG-TERM DEBT
December 31,
2012
2011
Senior secured term loan B, net of discount of $6,345 $ 642,030 $ — Global ABL Facility 608,006 — 9.50% senior secured notes due 2016, net of discount of $18,358 — 1,031,642 ABL Credit Facility — 456,411 MRC Transmark term loan facility — 30,824 Other 6,553 7,863
1,256,589 1,526,740 Less current portion 6,500 —
$ 1,250,089 $ 1,526,740
Senior Secured Term Loan B:
Accordion. The Term Loan allows for incremental increases up to an aggregate of $200 million, plus an additional amount such that the Company’s senior secured leverage ratio (the ratio of the Company’s Consolidated EBITDA (as defined under the Term Loan) to senior secured debt) (net of up to $75 million of unrestricted cash) would not exceed 3.50 to 1.00.
In November 2012, we entered into a new $650 million seven-year Term Loan B (the “Term Loan”), with Bank of America N.A. as administrative agent, and other lenders from time to time parties thereto. The proceeds of the new Term Loan, together with a draw under the Company’s Global ABL Facility, were used to redeem all of McJunkin Red Man Corporation’s outstanding 9.50% Senior Secured Notes due 2016 (the “Notes”), totaling approximately $861.3 million.
Maturity. The scheduled maturity date of the Term Loan is November 9, 2019. The Term Loan will amortize in equal quarterly installments at 1% a year with the payment of the balance at maturity.

F-16
Guarantees. The Term Loan is guaranteed by the Company and all of the U.S. borrower’s current and future wholly owned material U.S. subsidiaries, subject to certain exceptions.
Security. The Term Loan is secured by a first lien on all of the Company’s assets and the assets of its domestic subsidiaries, subject to certain exceptions and other than the collateral securing the Global ABL Facility (which includes accounts receivable, inventory and related assets, collectively, the “ABL collateral”), and by a second lien on the ABL collateral. In addition, the Term Loan is secured by a pledge of all the capital stock of the Company’s domestic subsidiaries and 65% of the capital stock of its first tier foreign subsidiaries, subject to certain exceptions.
Interest Rates and Fees. The Company has the option to pay interest at a base rate, subject to a floor of 2.25%, plus an applicable margin, or at a rate based on LIBOR, subject to a floor of 1.25%, plus an applicable margin. The applicable margin for base rate loans is 400 basis points and the applicable margin for LIBOR loans is 500 basis points. The margin will step down by 25 basis points if the Company’s consolidated total leverage ratio (as defined under the Term Loan) is less than 2.50 to 1.00.
Voluntary Prepayment. The Company is able to voluntarily prepay the principal without penalty or premium, other than a 1% premium in the first year for re-pricing transactions only.
Mandatory Prepayment. The Company is required to repay the Term Loan with certain asset sale and insurance proceeds, certain debt proceeds and 50% of excess cash flow (reducing to 25% if the Company’s senior secured leverage ratio is no more than 2.75 to 1.00 and 0% if the Company’s senior secured leverage ratio is no more than 2.50 to 1.00).
Restrictive Covenants. The Term Loan does not include any financial covenants.
The Term Loan contains restrictive covenants (in each case, subject to exclusions) that limit, among other things, the ability of the Company and its restricted subsidiaries (including the Borrower) to:
• make investments; • prepay certain indebtedness; • grant liens; • incur additional indebtedness; • sell assets; • make fundamental changes; • enter into transactions with affiliates; and • in the case of the Company, to pay dividends.
The Term Loan also contains other customary restrictive covenants. The covenants are subject to various baskets and materiality thresholds, with certain of the baskets permitted by the restrictions on the repayment of subordinated indebtedness, restricted payments and investments being available only when the senior secured leverage ratio of the Company and its restricted subsidiaries is less than 3.25:1.00.
The Term Loan provides that the Company and its restricted subsidiaries may incur any first lien indebtedness that is pari passu to the Term Loan so long as the pro forma senior secured leverage ratio of the Company and its restricted subsidiaries is less than or equal to 3.50:1.00. The Company and its restricted subsidiaries may incur any second lien indebtedness so long as the pro forma junior secured leverage ratio of the Company and its restricted subsidiaries is less than or equal to 4.00:1.00. The Company and its restricted subsidiaries may incur any unsecured indebtedness so long as the total leverage ratio of the Company and its restricted subsidiaries is less than or equal to 5.00:1.00. Additionally, under the Term Loan, the Company and its restricted subsidiaries may incur indebtedness under the Global ABL Facility (or any replacement facility) in an amount not to exceed the greater of $1.3 billion and a Borrowing Base (equal to, subject to certain exceptions, 85% of all accounts receivable and 65% of the book value of all inventory owned by the Company and its restricted subsidiaries).
The Term Loan contains certain customary representations and warranties, affirmative covenants and events of default, including, among other things, payment defaults, breaches of representations and warranties, covenant defaults, cross-defaults to certain indebtedness, certain events of bankruptcy, certain events under ERISA, judgment defaults, actual or asserted failure of any material guaranty or security documents supporting the Term Loan to be in full force and effect and change of control. If such an event of default occurs, the Agent under the Term Loan is entitled to take various actions, including the acceleration of amounts due under the Term Loan and all other actions that a secured creditor is permitted to take following a default.

F-17
Global ABL Credit Facility:
Each of our current and future wholly owned material U.S. subsidiaries and MRC Global Inc. guarantees the obligations of our borrower subsidiaries under the Global ABL Facility. Additionally, each of our non-U.S. borrower subsidiaries guarantees the obligations of our other non-U.S. borrower subsidiaries under the Global ABL Facility.
In March 2012, we entered into a new multi-currency global asset-based revolving credit facility (the “Global ABL Facility”) which replaced our then existing asset-based lending credit facility (“ABL Credit Facility”), our MRC Transmark term loan and revolving credit facility and our MRC Transmark overdraft facility. The five-year Global ABL Facility is comprised of $1.25 billion of total revolving credit facilities, including $977 million in the United States, $170 million in Canada, $12 million in the United Kingdom, $75 million in Australia, $9 million in the Netherlands and $7 million in Belgium. The facility contains an accordion feature that allows us to increase the principal amount of the facility by up to $300 million.
Obligations under the U.S. tranche are primarily secured, subject to certain exceptions, by a first-priority security interest in the accounts receivable, inventory and related assets of our wholly owned, material U.S. subsidiaries. The obligations of any of our non-U.S. borrower subsidiaries are primarily secured, subject to certain exceptions, by a first-priority security interest in the accounts receivable, inventory and related assets of the non-U.S. subsidiary and our wholly owned material U.S. subsidiaries.
No non-U.S. subsidiary guarantees the U.S. tranche and no property of our non-U.S. subsidiaries secures the U.S. tranche. The security interest in accounts receivable, inventory and related assets of the U.S. borrower subsidiaries ranks prior to the security interest in this collateral which secures the Term Loan.
Each of our non-U.S. borrower subsidiaries has a separate stand alone borrowing base that limits the non-U.S. subsidiary’s ability to borrow under its respective tranche, provided that the non-U.S. subsidiaries may utilize excess availability under the U.S. tranche to borrow amounts in excess of their respective borrowing bases (but not to exceed the applicable commitment amount for the foreign subsidiary’s jurisdiction), which utilization will reduce availability under the U.S. tranche dollar for dollar.
Subject to the foregoing, our ability to borrow in each jurisdiction, other than Belgium, under the Global ABL Facility is limited by a borrowing base in that jurisdiction equal to 85% of eligible receivables, plus the lesser of 70% of eligible inventory and 85% of appraised net orderly liquidation value of the inventory. In Belgium, our borrowing is limited by a borrowing base determined under Belgian law.
U.S. borrowings under the facility bear interest at LIBOR plus a margin varying between 1.50% and 2.00% based on our fixed charge coverage ratio. Borrowings by our foreign borrower subsidiaries are generally subject to the same interest rate margins with the benchmark rate for such borrowings varying based on the currency in which such borrowings are made.
Availability: At December 31, 2012, availability under our revolving credit facilities was $429.6 million.
Senior Secured Notes:
In November 2012, we redeemed the remaining $861.3 million of senior secured notes utilizing proceeds of the Company’s new $650 million Term Loan together with a draw under our Global ABL Facility. The early redemption required the payment of a premium of $68.9 million. When combined with the write off of unamortized deferred financing costs and the write off of original issue discount, this redemption resulted in a pre-tax loss of $92.2 million.
In a series of transactions from June to September 2012, we purchased in the open market $188.7 million in principal of our 9.50% senior secured notes due 2016 for $205.0 million. The purchases were funded with borrowings under our Global ABL Facility, and the weighted average price of these purchases was $108.65 per $100 of principal amount. We incurred a pre-tax loss on the purchase of the senior secured notes of $21.7 million related to the purchase premium, the write off of unamortized deferred financing costs and the write off of original discount.
Interest on Borrowings
: The interest rates on our borrowings outstanding at December 31, 2012 and 2011 were as follows:
December 31,
2012
2011
Senior secured term loan B, net of discount 6.39% — Global ABL Facility 2.21% — 9.50% senior secured notes due 2016, net of discount — 9.88% ABL Credit Facility — 2.66% MRC Transmark term loan facility — 7.17% Other 0.84% 1.85%

F-18
Maturities of Long-Term Debt
: At December 31, 2012, annual maturities of long-term debt during the next five fiscal years and thereafter are as follows (in thousands):
2013 $ 6,500 2014 13,011 2015 6,542 2016 6,500 2017 614,506 Thereafter 609,530
We use derivative financial instruments to help manage our exposure to interest rate risk and fluctuations in foreign currencies. All of our derivative instruments are freestanding and, accordingly, changes in their fair market value are recorded in earnings.
NOTE 8—DERIVATIVE FINANCIAL INSTRUMENTS
The table below provides data about the fair value of the derivative instruments that are recorded in our consolidated balance sheets (in thousands):
December 31, 2012
December 31, 2011
Assets
Liabilities
Assets
Liabilities
Derivatives not designated as hedging instruments:
Foreign exchange forward contracts(1) $ 3 $ — $ — $ 144 Interest rate contracts(1) — — — 2,010
(1) Included in “Accrued expenses and other current liabilities” or “other current assets” in our consolidated balance sheets. The total notional amount of our interest rate swaps was $0 and approximately $519 million at December 31, 2012 and December 31, 2011, respectively. The total notional amount of our forward foreign exchange contracts was approximately $69 million and $39 million at December 31, 2012 and December 31, 2011.
The table below provides data about the amount of gains and (losses) recognized in our consolidated statements of operations related to our derivative instruments (in thousands):
Year Ended December 31,
2012
2011
2010
Derivatives not designated as hedging instruments:
Interest rate contracts $ 2,010 $ 6,973 $ (5,548) Foreign exchange forward contracts 176 71 622
The components of our income (loss) before income taxes were (in thousands): NOTE 9—INCOME TAXES
Year Ended December 31,
2012
2011
2010
United States $ 156,226 $ 50,654 $ (59,375) Foreign 25,470 5,114 (15,802)
$ 181,696 $ 55,768 $ (75,177)

F-19
Income taxes included in the consolidated statements of operations consist of (in thousands):
Year Ended December 31,
2012
2011
2010
Current:
Federal $ 65,563 $ 32,080 $ (26,111) State 6,569 2,878 (1,709) Foreign 12,038 8,188 1,794
84,170 43,146 (26,026) Deferred:
Federal (15,776) (14,960) 5,801 State (1,256) (1,177) 458 Foreign (3,400) (225) (3,586)
(20,432) (16,362) 2,673
Income tax expense (benefit) $ 63,738 $ 26,784 $ (23,353)
Our effective tax rate varied from the statutory federal income tax rate for the following reasons (in thousands):
Year Ended December 31,
2012
2011
2010
Federal tax expense at statutory rates $ 63,474 $ 19,518 $ (26,311) State taxes 3,453 977 (813) Nondeductible expenses 1,123 1,121 1,024 Effect of tax rate changes on existing temporary differences — 3,993 — Effect of foreign operations (3,565) (499) 701 Change in valuation allowance (78) 522 1,615 Other (669) 1,152 431
Income tax expense (benefit) $ 63,738 $ 26,784 $ (23,353)
Effective tax rate 35.1% 48.0% 31.1%
Significant components of our current deferred tax assets and liabilities are as follows (in thousands):
December 31,
2012
2011
Deferred tax assets:
Accounts receivable valuation $ 2,046 $ 2,336 Accruals and reserves 12,617 4,009 Net operating loss carryforwards 5,453 5,250 Other 1,504 3,352
Subtotal 21,620 14,947 Valuation allowance (2,059) (2,137)
Total 19,561 12,810
Deferred tax liabilities:
Accounts receivable (4,550) (4,550) Inventory valuation (79,575) (70,198) Property, plant and equipment (11,210) (23,554) Interest in foreign subsidiary — (11,880) Intangible assets (252,976) (253,351) Debt (5,745) (5,745) Other (11) (727)
Total (354,067) (370,005)
Net deferred tax liability $ (334,506) $ (357,195)

F-20
We record a valuation allowance when it is more likely than not that some portion or all of the deferred tax assets will not be realized. The ultimate realization of the deferred tax assets depends on the ability to generate sufficient taxable income of the appropriate character in the future and in the appropriate taxing jurisdictions. We have provided a valuation allowance for operating loss carryforwards in certain non-U.S. jurisdictions.
In the United States, we had approximately $108.9 million of state net operating loss carryforwards as of December 31, 2012, which will expire in future years through 2032. In certain non-U.S. jurisdictions, we had $18.4 million of net operating loss carryforwards, of which $13.8 million have no expiration and $4.6 million will expire in future years through 2020.
We consider the undistributed earnings of our foreign subsidiaries to be indefinitely reinvested, as we have no current intention to repatriate these earnings. As such, deferred income taxes are not provided for temporary differences of approximately $189.4 million, and $98.8 million as of December 31, 2012 and 2011, representing earnings of non-U.S. subsidiaries intended to be permanently reinvested. These additional foreign earnings could become subject to additional tax if remitted, or deemed remitted, as a dividend. Computation of the potential deferred tax liability associated with these undistributed earnings and any other basis difference is not practicable.
Our tax filings for various periods are subject to audit by the tax authorities in most jurisdictions where we conduct business. We are no longer subject to U.S. federal income tax examination for all years through 2007 and the statute of limitations at our international locations is generally six to seven years.
At December 31, 2012 and 2011, our unrecognized tax benefits were immaterial to our consolidated financial statements.
NOTE 10—STOCKHOLDERS’ EQUITY
We have authorized 100,000,000 shares of preferred stock. Our Board of Directors has the authority to issue shares and set the terms of the shares of preferred stock. As of December 31, 2012 and 2011, there were no shares of preferred stock issued or outstanding.
Preferred Stock
Accumulated other comprehensive loss net of tax in the accompanying consolidated balance sheets consists of the following (in thousands):
Accumulated Other Comprehensive Loss
December 31,
2012
2011
Currency translation adjustments $ (21,829) $ (25,622) Pension related adjustments (335) (518)
Accumulated other comprehensive loss $ (22,164) $ (26,140)
Earnings per share are calculated in the table below (in thousands, except per share amounts). Earnings per Share
Year Ended December 31,
2012
2011
2010
Net income (loss) $ 117,958 $ 28,984 $ (51,824)
Average basic shares outstanding 96,465 84,417 84,384 Effect of dilutive securities 460 238 —
Average diluted shares outstanding $ 96,925 $ 84,655 $ 84,384
Net income (loss) per share:
Basic $ 1.22 $ 0.34 $ (0.61) Diluted $ 1.22 $ 0.34 $ (0.61)
Stock options and shares of restricted stock are disregarded in this calculation if they are determined to be anti-dilutive. For the years ended December 31, 2012, 2011 and 2010, our anti-dilutive stock options approximated 2.1 million, 2.3 million and 2.0 million.

F-21
NOTE 11—EMPLOYEE BENEFIT PLANS Equity Compensation Plans
Under the terms of our 2007 Restricted Stock Plan, up to 500,000 shares of restricted stock could have been granted at the direction of the Board of Directors and vesting generally occurred in one-fourth increments on the second, third, fourth and fifth anniversaries of the date specified in the employees’ respective restricted stock agreements, subject to accelerated vesting under certain circumstances set forth in the restricted stock agreements. Fair value is based on the fair value of our stock on the date of issuance. We expense the fair value of the restricted stock grants on a straight-line basis over the vesting period.
: Our 2007 Stock Option Plan permitted the grant of stock options to our employees, directors and consultants for up to 3,750,000 shares of common stock. The options were not to be granted with an exercise price less than the fair market value of the Company’s common stock on the date of the grant, nor for a term exceeding ten years. Vesting generally occurred over a five year period on the anniversaries of the date specified in the employees’ respective option agreements, subject to accelerated vesting under certain circumstances set forth in the option agreements.
Under the 2007 Stock Option Plan, 381,698 stock options with exercise prices ranging from $22.10 to $24.96 were modified in May 2012. The exercise price of these options was changed to $21.05. The impact of the modification was to increase stock based compensation expense over the remaining vesting period of the modified options. In January and December 2012, 14,451 and 8,174 shares of restricted stock vested. In February 2012, 15,561 shares of restricted stock were granted to two members of our Board of Directors. During 2012, 68,838 stock options were exercised and no stock options were granted under this plan.
In April 2012, we replaced the 2007 Stock Option Plan and the 2007 Restricted Stock Plan with the 2011 Omnibus Incentive Plan. No additional shares or other equity interests will be awarded under the prior plans. The 2011 Omnibus Incentive Plan has 3,250,000 shares reserved for issuance pursuant to the plan. The plan permits the issuance of stock options, stock appreciation rights, restricted stock, restricted stock units, performance shares, performance units and other stock-based and cash-based awards. Since the adoption of the 2011 Omnibus Incentive Plan, the Company’s Board of Directors has periodically granted stock options to directors and employees, but no other types of awards have been granted under the plan. Options and stock appreciation rights may not be granted at prices less than their fair market value on the date of the grant, nor for a term exceeding ten years. Vesting generally occurs over a four or five year period on the anniversaries of the date specified in the employees’ respective agreements, subject to accelerated vesting under certain circumstances set forth in the option agreements. From May through August 2012, 1,064,761 stock options were granted to executive management, members of our Board of Directors and new employees under this plan.
We expense the fair value of the stock option grants on a straight-line basis over the vesting period. A Black-Scholes option-pricing model is used to estimate the fair value of the stock options. One of the key inputs into the Black-Scholes option pricing model is the fair value of the Company’s common equity. Prior to the initial public offering in April 2012, the Company determined the fair value of its common stock by a combination of consistently applied valuation procedures based on an internally prepared discounted cash flow analysis and multiples of cash earnings valuation techniques, plus valuation comparisons to similar businesses. Following the initial public offering, the Company uses the actual stock price to determine the fair value of its common stock.
Options
Weighted Average Exercise
Price
Weighted Average
Remaining Contractual
Term
Aggregate Intrinsic
Value
(years) (thousands) Stock Options
Balance at December 31, 2011 2,845,688 $ 17.04 7.7 $ 3,616 Granted 1,446,459 20.97
Exercised (68,838) 9.84
Forfeited (460,739) 22.35
Expired (3,812) 9.62
Balance at December 31, 2012 3,758,758 $ 18.05 7.4 $ 36,585
At December 31, 2012:
Options outstanding, vested and exercisable 1,352,308 $ 15.59 5.4 $ 16,486 Options outstanding, vested and expected to vest 3,626,562 $ 17.99 7.4 $ 35,494

F-22
Shares
Weighted Average
Grant-Date Fair Value
Restricted Stock
Nonvested at December 31, 2011 141,997 $ 14.36 Granted 15,561 18.10 Vested (22,625) 9.42 Forfeited (722) 9.42
Nonvested at December 31, 2012 134,211 $ 15.65
The following table summarizes award activity under our stock option and restricted stock plans:
Year Ended December 31,
2012
2011
2010
Stock Options
Weighted-average, grant-date fair value of awards granted $ 6.52 $ 3.46 $ 5.10 Total intrinsic value of stock options exercised $ 1,089,830 $ 1,715 $ — Total fair value of stock options vested $ 1,370,130 $ 1,833,836 $ 727,441
Year Ended December 31,
2012
2011
2010
Restricted Stock
Weighted-average, grant-date fair value of awards granted $ 15.65 $ 14.36 $ — Total fair value of restricted stock vested $ 484,141 $ 378,670 $ 514,082
Following are the weighted-average assumptions used to estimate the fair values of our stock options: Stock Options
Year Ended December 31,
2012
2011
2010
Risk-free interest rate 0.90% 1.32% 2.54% Dividend yield(1) 0.00% 0.00% 0.00% Expected volatility 41.87% 46.05% 22.07% Expected life (in years) 6.6 5.0 6.2
(1) The expected dividend yield reflects the restriction on our ability to pay dividends and does not anticipate “special” dividends.
Restricted Common Units: Certain of our key employees received restricted common units of PVF Holdings LLC that vested over a three-to-five year requisite service period. At December 31, 2012, all of the restricted common units were either vested or forfeited. Prior to full vesting or forfeiture, the expense was being recognized on a straight-line basis over the vesting period.
Profits Units
: Certain of our key employees received profit units in PVF Holdings LLC that vest over a five-year requisite service period. The holders of these units are entitled to a share of any distributions made by PVF Holdings LLC once common unit holders have received a return of their capital contributions (for purposes of the Amended and Restated Limited Liability Company Agreement of PVF Holdings LLC, dated October 31, 2007, as amended). At December 31, 2012, all of the profits units were either vested or forfeited. Prior to full vesting or forfeiture, the expense was being recognized on a straight-line basis over the vesting period.

F-23
Recognized compensation expense and related income tax benefits under our equity-based compensation plans are set forth in the table below (in thousands):
Year Ended December 31,
2012
2011
2010
Equity-based compensation expense:
Stock options $ 7,533 $ 6,707 $ 2,425 Restricted stock 481 412 253 Restricted common units — (1) (337) Profit units 461 1,267 1,403
Total equity-based compensation expense $ 8,475 $ 8,385 $ 3,744
Income tax benefits related to equity-based compensation $ 3,114 $ 3,081 $ 1,383
Unrecognized compensation expense under our equity-based compensation plans is set forth in the table below (in thousands):
Weighted- Average Vesting Period (in years)
December 31, 2012
Unrecognized equity-based compensation expense:
Stock options 3.4 $ 15,809 Restricted stock 3.5 1,322
Total unrecognized equity-based compensation expense $ 17,131
Defined Contribution Employee Benefit Plans
Our provisions for the expense under defined contribution plans are set forth in the table below (in thousands):
: We maintain defined contribution employee benefit plans in a number of countries in which we operate including the U.S., Canada, the United Kingdom, Australia, France, Belgium, and New Zealand. These plans generally allow employees the option to defer a percentage of their compensation in accordance with local tax laws. In addition, we make contributions under these plans ranging from 1% to 10% of eligible compensation.
Year Ended December 31,
2012
2011
2010
Defined contribution plans $ 9,016 $ 6,531 $ 5,179
Defined Benefit Employee Benefit Plans
The following tables set forth the benefit obligations, the fair value of the plan assets and the funded status of our pension plans; and the amounts recognized in our consolidated financial statements (in thousands):
: We sponsor a defined benefit pension plan for one subsidiary in Belgium. An independent insurance company administers this plan. Benefits are dependent on years of service and the employees’ compensation. Pension costs under our retirement plan are actuarially determined. Effective December 31, 2012, we elected to replace a defined benefit plan in the Netherlands with a defined contribution plan. Our obligation with respect to this defined benefit plan was terminated as of that date.
December 31,
2012
2011
Change in projected benefit obligation:
Projected benefit obligation at beginning of period $ 27,898 $ 27,538 Service cost 1,220 1,073 Interest cost 1,322 1,465 Curtailment for change in projected benefit obligation (1,518) (311) Actuarial loss 1,156 511 Benefits paid (1,148) (1,528) Expenses paid (141) (146) Settlement (26,553) — Foreign currency exchange (135) (704)
Projected benefit obligation at end of period $ 2,101 $ 27,898
Accumulated benefit obligation at end of period $ 1,545 $ 25,892

F-24
December 31,
2012
2011
Change in plan assets:
Fair value of plan assets at beginning of period $ 30,453 $ 29,231 Return on plan assets 3,892 2,692 Employer contributions 691 556 Participant contributions 414 459 Benefits paid (1,148) (1,528) Expenses paid (141) (146) Settlement (32,546) — Foreign currency exchange (172) (811)
Fair value of plan assets at end of period $ 1,443 $ 30,453
Funded status and net amounts recognized:
Plan assets, net of projected benefit obligation $ (658) $ 2,555 Unrecognized actuarial loss 475 947
Net amount recognized in the consolidated balance sheets $ (183) $ 3,502
Amounts recognized in the consolidated balance sheets consist of:
Noncurrent other assets $ — $ 2,798 Noncurrent other liabilities (658) (243)
Accrued benefit obligation (658) 2,555 Other comprehensive loss 475 947
Net amount recognized in the consolidated balance sheets $ (183) $ 3,502
The following table sets forth our net periodic pension cost (in thousands):
Year Ended December 31,
2012
2011
Service cost $ 1,220 $ 1,073 Interest cost 1,322 1,465 Curtailment gain (1,518) (311) Settlement loss 5,317 — Expected return on plan assets (1,437) (1,762)
Net periodic pension cost $ 4,904 $ 465
Valuation: We use the corridor approach in the valuation of our defined benefit plans. The corridor approach defers all actuarial gains and losses resulting from variances between actual results and economic estimates or actuarial assumptions. These unrecognized gains and losses are amortized when the net gains and losses exceed 10% of the greater of the market-related value of plan assets or the projected benefit obligation at the beginning of the year. The amount in excess of the corridor is amortized over the average remaining service period to retirement date for active plan participants or, for retired participants, the average remaining life expectancy.
The following table sets forth the principal weighted-average assumptions used to determine benefit obligation and benefit costs:
Year Ended December 31,
2012
2011
Benefit obligation:
Discount rate 2.50% 4.70% Rate of compensation increase 2.00% 2.00%
Benefit cost:
Discount rate 2.50% 4.70% Rate of compensation increase 2.00% 2.00% Expected return on plan assets 4.00% 5.27%
We determine our discount rates in the Euro zone using the iBoxx Euro Corporate AA Bond indices, with appropriate adjustments for the duration of the plan obligations.

F-25
The expected rate of return is assessed annually and is based on long-term relationships among major asset classes and the level of incremental returns that can be earned by investment management strategies. Equity returns are based on estimates of long-term inflation rates, real rates of return, fixed income premiums over cash and equity risk premiums. Fixed income returns are based on maturity, long-term inflation, real rates of return and credit spreads. Insurance contract returns are based upon the average fixed return on contracts and the historical supplemental profit sharing of the insurers.
Plan Assets: The investment objective for the plan is to earn a long-term expected rate of return, net of investment fees and transaction costs, to satisfy the benefit obligations of the plan, while at the same time maintaining sufficient liquidity to pay benefit obligations and expenses and meet any other cash needs, in the short-to-medium term.
The following table sets forth the asset allocations for our pension plans:
2012
2011
Fixed income securities — 78% Equity securities — 18% Insurance contracts 100% 4%
Total 100% 100%
Our investment policies and strategies for the pension benefit plans do not use target allocations for the individual asset categories. Our goals are to maximize returns subject to specific risk management policies. We address diversification by the use of investments in domestic and international fixed income securities and domestic and international equity securities. These investments are readily marketable and can be sold to fund benefit obligations as they become payable.
Our defined benefit plan assets are measured at fair value on a recurring basis and include the following items: Cash and cash equivalents: Foreign and domestic currencies, as well as short-term securities, are valued at cost plus accrued interest, which approximates fair value.
Equity securities and fixed income: Valued at the closing price reported on the active market in which the individual securities are traded. These securities are traded on exchanges, as well as in the over-the-counter market.
Insurance contracts: Valued at contributions made, plus earnings, less participant withdrawals and administrative expenses, which approximates fair value.
The following table sets forth the fair values of our pension plan assets (in thousands):
Total
Level 1
Level 2
Level 3
December 31, 2012
Cash and cash equivalents $ — $ — $ — $ — Fixed income — — — — Mutual fund — — — — Insurance contracts 1,443 — 1,443 —
$ 1,443 $ — $ 1,443 $ —
December 31, 2011
Cash and cash equivalents $ 66 $ 66 $ — $ — Fixed income 21,438 — 21,438 — Mutual fund 5,399 — 5,399 — Insurance contracts 3,550 — 3,550 —
$ 30,453 $ 66 $ 30,387 $ —
The financial objectives of the qualified pension plans are determined in conjunction with a comprehensive review of each plan’s liability structure. Our asset allocation policy is based on detailed asset/liability analyses. In developing investment policy and financial goals, consideration is given to each plan’s demographics, the returns and risks associated with alternative investment strategies and the current and projected cash, expense and funding ratios of each plan. Investment policies must also comply with local statutory requirements as determined by each country. We have adopted a long-term investment horizon such that the risk and duration of investment losses are weighed against the long-term potential for appreciation of assets. Although there cannot be complete assurance that these objectives will be realized, it is believed that the likelihood for their realization is reasonably high, based

F-26
upon the asset allocation chosen and the historical and expected performance of the asset classes utilized by the plans. The intent is for investments to be broadly diversified across asset classes, investment styles, market sectors, investment managers, developed and emerging markets and securities in order to moderate portfolio volatility and risk. Investments may be in separate accounts, commingled trusts, mutual funds and other pooled asset portfolios provided they all conform to fiduciary standards.
External investment managers are hired to manage pension assets. Over the long-term, the investment portfolio is expected to earn returns that exceed a composite of market indices that are weighted to match each plan’s target asset allocation. The portfolio return should also (over the long-term) meet or exceed the return used for actuarial calculations in order to meet the future needs of the plan.
Europump Systems Inc. NOTE 12—RELATED PARTY TRANSACTIONS
Certain MRC Canada ULC employees, who are shareholders of the Company, serve as executive officers of Europump Systems Inc. (“Europump”). Europump is engaged in the business of selling, servicing and renting industrial pumps. During the years ended December 31, 2012, 2011 and 2010, our purchases from Europump approximated $39.3 million, $42.0 million and $28.1 million. At December 31, 2012 and 2011, we had payables to Europump of approximately $4.9 million and $5.2 million. During the years ended December 31, 2012, 2011 and 2010, our sales to Europump approximated $1.2 million, $2.5 million and $0.8 million. At December 31, 2012 and 2011, we had receivables of approximately $0.2 and $0.3 million from Europump. We also agreed to make certain profit sharing payments to the Europump shareholders in respect of certain oilfield supply and service stores located in Western Canada. For the years ended December 31, 2012, 2011 and 2010, the expense we recognized for the aggregate profit participation for Europump was approximately $7.9 million, $5.8 million and $1.1 million.
Leases We lease land and buildings at various locations from Hansford Associates Limited Partnership (“Hansford Associates”), and Prideco LLC (“Prideco”), as well as certain employees. We lease equipment and vehicles from Prideco. Certain of our directors participate in ownership of Hansford Associates and Prideco. Most of these leases are renewable for various periods through 2019 and are renewable at our option. The renewal options are subject to escalation clauses. These leases contain clauses for payment of real estate taxes, maintenance, insurance and certain other operating expenses of the properties.
Rent expense attributable to related parties is set forth in the following table (in thousands):
Year Ended December 31,
2012
2011
2010
Hansford Associates $ 1,969 $ 2,284 $ 2,545 Prideco 116 596 1,510 Employees 2,238 2,572 2,484
$ 4,323 $ 5,452 $ 6,539
Future minimum rental payments required under operating leases with related parties that have initial or remaining non-cancelable lease terms in excess of one year are set forth in the following table (in thousands):
2013
2014
2015
2016
2017 and thereafter
Hansford Associates $ 1,533 $ 1,281 $ 1,087 $ 1,109 $ 2,344 Prideco 81 43 44 45 27 Employees 2,895 2,091 1,476 1,018 1,421
$ 4,509 $ 3,415 $ 2,607 $ 2,172 $ 3,792
Debt and Equity Transactions Goldman Sachs Credit Partners L.P. (“GSCP”), an affiliate of the Goldman Sachs Funds, was a co-lead arranger and joint bookrunner under our Global ABL Facility and our Term Loan as well as the syndication agent under those facilities. In addition, Goldman Sachs Lending Partners L.L.C. is a participant in our Global ABL Credit Facility. Goldman, Sachs & Co. was the co-lead bookrunner on our initial public offering and our November 2012 secondary offering.

F-27
Payments made to affiliates of the Goldman Sachs Funds in connection with these transactions are set forth in the following table (in thousands):
Year Ended December 31,
2012
2011
2010
Affiliates of the Goldman Sachs Funds $ 13,194 $ 250 $ 700
Affiliates of the Goldman Sachs Funds From time to time, we sell products to affiliates of the Goldman Sachs Funds. The total revenues from these affiliates are set forth in the following table (in thousands):
Year Ended December 31,
2012
2011
2010
Affiliates of the Goldman Sachs Funds $ 23,094 $ 12,049 $ 24,430
The total receivables due from these affiliates are set forth in the following table (in thousands):
Year Ended December 31,
2012
2011
Affiliates of the Goldman Sachs Funds $ 5,048 $ 1,390
In 2010, we engaged an affiliate of the Goldman Sachs Funds to provide insurance brokerage services. During 2012 and 2011, we paid this affiliate approximately $0.2 million and $0.3 million, respectively. As of December 31, 2012, this insurance broker was no longer affiliated with the Goldman Sachs Funds.
In 2012, we engaged an affiliate of the Goldman Sachs Funds to provide services for treasury, accounts receivables collection software and disaster recovery systems and paid them approximately $0.9 million.

F-28
We operate as three business segments, U.S., Canada and International. Our International segment consists of our operations outside of the U.S. and Canada, principally Europe, Asia and Australasia. These segments represent our business of selling pipe, valves and fittings to the energy and industrial sectors, across each of the upstream (exploration, production and extraction of underground oil and gas), midstream (gathering and transmission of oil and gas, gas utilities, and the storage and distribution of oil and gas) and downstream (crude oil refining, petrochemical processing and general industrials) markets. The following table presents financial information for each segment (in millions):
NOTE 13—SEGMENT, GEOGRAPHIC AND PRODUCT LINE INFORMATION
Year Ended December 31,
2012
2011
2010
Sales
U.S. $ 4,238.4 $ 3,849.2 $ 3,124.7 Canada 765.2 653.6 465.2 International 567.2 329.6 255.6
Consolidated revenues $ 5,570.8 $ 4,832.4 $ 3,845.5
Depreciation and amortization
U.S. $ 11.2 $ 11.6 $ 11.7 Canada 2.1 2.5 3.1 International 5.3 2.9 1.8
Total depreciation and amortization expense $ 18.6 $ 17.0 $ 16.6
Amortization of intangibles
U.S. $ 40.0 $ 40.1 $ 39.8 Canada 2.5 4.5 4.3 International 7.0 6.1 9.8
Total amortization of intangibles expense $ 49.5 $ 50.7 $ 53.9
Operating income
U.S. $ 358.3 $ 166.5 $ 60.0 Canada 27.2 17.4 (4.0) International 21.5 10.7 10.4
Total operating income 407.0 194.6 66.4
Interest expense 112.5 136.8 139.6 Loss on early extinguishment of debt 114.0 — — Other (income) expense (1.2) 2.0 2.0
Income (loss) before income taxes $ 181.7 $ 55.8 $ (75.2)
December 31,
2012
2011
Goodwill
United States $ 537.1 $ 512.1 Canada — — International 73.3 49.2
Total goodwill $ 610.4 $ 561.3
Total assets
United States $ 2,732.4 $ 2,749.4 Canada 249.1 176.1 International 388.2 304.4
Total assets $ 3,369.7 $ 3,229.9

F-29
The percentages of our fixed assets relating to the following geographic areas are as follows:
December 31,
2012
2011
Fixed assets
U.S. 56% 60% Canada 24% 25% International 20% 15%
100% 100%
Our net sales by product line are as follows (in thousands):
Year Ended December 31, Type
2012
2011
2010
Energy carbon steel tubular products:
Line pipe $ 1,158,512 21% $ 1,033,976 21% $ 692,197 18% Oil country tubular goods 715,108 13% 809,163 17% 769,107 20%
$ 1,873,620 34% $ 1,843,139 38% $ 1,461,304 38%
Valves, fittings, flanges and other products:
Valves and specialty products $ 1,431,888 26% $ 1,143,234 24% $ 961,384 25% Carbon steel fittings and flanges and stainless steel
and alloy pipe and fittings 1,175,276 21% 870,581 18% 653,741 17% Other 1,090,074 19% 975,469 20% 769,107 20%
$ 3,697,238 66% $ 2,989,284 62% $ 2,384,232 62%
We used the following methods and significant assumptions to estimate fair value for assets and liabilities recorded at fair value. NOTE 14—FAIR VALUE MEASUREMENTS
Interest Rate Contracts: Interest rate contracts are reported at fair value utilizing Level 2 inputs. We obtain dealer quotations to value our interest rate swap agreements. These quotations rely on observable market inputs such as yield curves and other market-based factors.
Foreign Exchange Forward Contracts
The following table presents assets and liabilities measured at fair value on a recurring basis, and the basis for that measurement (in thousands):
: Foreign exchange forward contracts are reported at fair value utilizing Level 2 inputs, as the fair value is based on broker quotes for the same or similar derivative instruments.
Fair Value Measurements at Reporting Date Using
Total
Quoted Prices in Active
Markets for Identical
Assets (Level 1)
Significant Other
Observable Inputs
(Level 2)
Significant Unobservable
Inputs (Level 3)
December 31, 2012
Assets: $ 3 $ — $ 3 $ —
Liabilities: — — — —
December 31, 2011
Assets: $ — $ — $ — $ —
Liabilities:
Foreign exchange forward contracts 144 — 144 — Interest rate swap agreements 2,010 — 2,010 —

F-30
With the exception of long-term debt, the fair values of our financial instruments, including cash and cash equivalents, accounts receivable, trade accounts payable and accrued liabilities approximate carrying value. The carrying value of our debt was $1.257 billion and $1.527 billion at December 31, 2012 and 2011, respectively. We estimate the fair value of the Term Loan and senior secured notes using Level 2 inputs, or quoted market prices as of December 31, 2012 and December 31, 2011, respectively. The fair value of our debt was $1.261 billion and $1.542 billion at December 31, 2012 and December 31, 2011, respectively. The carrying values of our Global ABL Facility and remaining portions of our long-term debt approximate their fair values.
Leases NOTE 15—COMMITMENTS AND CONTINGENCIES
We regularly enter into operating and capital lease arrangements for certain of our facilities and equipment. Our leases are renewable at our option for various periods through 2021. Certain renewal options are subject to escalation clauses and contain clauses for payment of real estate taxes, maintenance, insurance and certain other operating expenses of the properties. Leases with escalation clauses based on an index, such as the consumer price index, are expensed and projected based on current rates. Leases with specified escalation steps are expensed and projected based on the rate in effect in the respective period which is not materially different than the straight-line method. We amortize leasehold improvements over the remaining life of the lease. Rental expense under our operating lease arrangements is as follows:
Year Ended December 31,
2012
2011
2010
Operating rental expense $ 48,321 $ 40,255 $ 37,804
Future minimum lease payments under noncancelable operating and capital lease arrangements having initial terms of one year or more are as follows (in thousands):
Operating Leases
Capital Leases
2013 $ 35,923 $ 459 2014 29,560 441 2015 26,071 217 2016 12,175 158 2017 8,501 117 Thereafter 15,333 699
$ 127,563 $ 2,091
Litigation Asbestos Claims. We are involved in various legal proceedings and claims, both as a plaintiff and a defendant, which arise in the ordinary course of business. These legal proceedings include claims that individuals brought against a large number of defendant entities, including us, seeking damages for injuries that certain products containing asbestos allegedly caused. As of December 31, 2012, we are a defendant in lawsuits involving approximately 885 of these claims. Each claim involves allegations of exposure to asbestos-containing materials by an individual or his or her family members. The complaints typically name many defendants. In a majority of these lawsuits, little or no information is known regarding the nature of the plaintiff’s alleged injuries or their connection with products that we distributed. Through December 31, 2012, lawsuits involving 11,975 claims have been brought against us. No asbestos lawsuit has resulted in a judgment against us to date, with the majority being settled, dismissed or otherwise resolved. In total, since the first asbestos claim brought against us in 1984 through December 31, 2012, approximately $2.0 million has been paid to asbestos claimants in connection with settlements of claims against us without regard to insurance recoveries. Of this amount, approximately $1.5 million has been paid to settle claims alleging mesothelioma, $0.4 million for claims alleging lung cancer and $0.1 million for non-malignant claims.
We annually conduct analyses of our asbestos-related litigation to estimate the adequacy of the reserve for pending and probable asbestos-related claims. These analyses consist of separately estimating our reserve with respect to pending claims (both those scheduled for trial and those for which a trial date had not been scheduled), mass filings (including lawsuits brought in West Virginia each involving many, in some cases over a hundred, plaintiffs, which include little information regarding the nature of each plaintiff’s claim and historically have rarely resulted in any payments to plaintiff) and probable future claims. A key element of the analysis is categorizing our claims by the type of disease the plaintiffs allege and developing “benchmark” estimated settlement values for each claim category based on our historical settlement experience. These estimated settlement values are applied to each of our pending individual claims. With respect to pending claims where the disease type is unknown, the outcome is projected based on historic experience. The reserve with respect to mass filings is estimated by determining the number of individual plaintiffs included in the

F-31
mass filings likely to have claims resulting in settlements based on our historical experience with mass filings. Finally, we estimate the value of probable claims that plaintiffs may assert against us over the next 15 years based on public health estimates of future incidences of certain asbestos-related diseases in the general U.S. population. Estimated settlement values are applied to those projected claims. Our annual assessment, dated December 31, 2012, projected that our payments to asbestos claimants over the next 15 years are estimated to range from $5.2 million to $13.1 million. Given these estimates and existing insurance coverage that historically has been available to cover substantial portions of our past payments to claimants and defense costs, we believe that our current accruals and associated estimates relating to pending and probable asbestos-related litigation likely to be asserted over the next 15 years are currently adequate. Our belief that our accruals and associated estimates are currently adequate, however, relies on a number of significant assumptions, including:
• That our future settlement payments, disease mix and dismissal rates will be materially consistent with historic experience;
• That future incidences of asbestos-related diseases in the U.S. will be materially consistent with current public health estimates;
• That the rates at which future asbestos-related mesothelioma incidences result in compensable claims filings against us will be materially consistent with its historic experience;
• That insurance recoveries for settlement payments and defense costs will be materially consistent with historic experience; • That legal standards (and the interpretation of these standards) applicable to asbestos litigation will not change in material
respects; • That there are no materially negative developments in the claims pending against us; and • That key co-defendants in current and future claims remain solvent.
If any of these assumptions prove to be materially different in light of future developments, liabilities related to asbestos-related litigation may be materially different than amounts accrued or estimated. Further, while we anticipate that additional claims will be filed in the future, we are unable to predict with any certainty the number, timing and magnitude of such future claims.
Also, there is a possibility that resolution of certain legal contingencies for which there are no liabilities recorded could result in a loss. Management is not able to estimate the amount of such loss, if any. However, in our opinion, the ultimate resolution of all pending matters is not expected to have a material effect on our financial position, although it is possible that such resolutions could have a material adverse impact on results of operations in the period of resolution. Further, given the relatively small amounts we have paid in recent periods and our expectations regarding future required payments, we do not believe that the ultimate resolution of these matters for any period will have a material impact on our liquidity in any period on either a short term or long term basis.
Other Legal Claims and Proceedings. From time to time, we have been subject to various claims and involved in legal proceedings incidental to the nature of our businesses. We maintain insurance coverage to reduce financial risk associated with certain of these claims and proceedings. It is not possible to predict the outcome of these claims and proceedings. However, in our opinion, there are no material pending legal proceedings that are likely to have a material effect on our business, financial condition, results of operations or cash flows.
Product Claims. From time to time, in the ordinary course of our business, our customers may claim that the products that we distribute are either defective or require repair or replacement under warranties that either we or the manufacturer may provide to the customer. These proceedings are, in the opinion of management, ordinary and routine matters incidental to our normal business. Our purchase orders with our suppliers generally require the manufacturer to indemnify us against any product liability claims, leaving the manufacturer ultimately responsible for these claims. In many cases, state, provincial or foreign law provides protection to distributors for these sorts of claims, shifting the responsibility to the manufacturer. In some cases, we could be required to repair or replace the products for the benefit of our customer and seek our recovery from the manufacturer for our expense. In the opinion of management, the ultimate disposition of these claims and proceedings is not expected to have a material adverse effect on our financial position, results of operations or cash flows.
NiSource Claim. In the summer of 2010, our customer NiSource, Inc. notified us that certain polyethylene pipe that PolyPipe, Inc. manufactured may be defective. On April 28, 2011, PolyPipe filed a petition in the District Court in Cooke County, Texas against the Company and NiSource seeking, among other things, a declaratory judgment that PolyPipe was not responsible for the costs relating to NiSource’s alleged failure to track and record the installation locations of the pipe and NiSource’s expenditures to implement a potential remediation plan including finding the pipe and removing the pipe. On June 1, 2011, the Court entered an order of non-suit, dismissing PolyPipe’s claims without prejudice to their re-filing the same claims. After a period of factual investigation and settlement discussions, PolyPipe again filed a petition in the District Court in Cooke County, Texas against NiSource and the Company seeking a similar declaratory judgment. In the fourth quarter of 2012, the parties settled the dispute, and the court dismissed the case. The Company settled its portion of the lawsuit for an immaterial amount.

F-32
Customer Contracts We have contracts and agreements with many of our customers that dictate certain terms of our sales arrangements (pricing, deliverables, etc.). While we make every effort to abide by the terms of these contracts, certain provisions are complex and often subject to varying interpretations. Under the terms of these contracts, our customers have the right to audit our adherence to the contract terms. Historically, any settlements that have resulted from these customer audits have been immaterial to our consolidated financial statements.
Letters of Credit Our letters of credit outstanding at December 31, 2012 approximated $38.5 million.
Bank Guarantees Certain of our international subsidiaries have trade guarantees given by bankers on their behalf. The amount of these guarantees at December 31, 2012 was approximately $1.9 million.
Purchase Commitments We have purchase obligations consisting primarily of inventory purchases made in the normal course of business to meet operating needs. While our vendors often allow us to cancel these purchase orders without penalty, in certain cases, cancellations may subject us to cancellation fees or penalties depending on the terms of the contract.
Warranty Claims We are involved from time to time in various warranty claims, which arise in the ordinary course of business. Historically, any settlements that have resulted from these warranty claims have been immaterial to our consolidated financial statements.
Our quarterly financial information is presented in the table below (in thousands, except per share amounts): NOTE 16—QUARTERLY INFORMATION (UNAUDITED)
First
Second
Third
Fourth
Year
2012
Revenues $ 1,382.6 $ 1,430.4 $ 1,451.1 $ 1,306.7 $ 5,570.8 Gross profit 236.6 241.7 277.2 258.3 1,013.7
Net income (loss) 37.5 31.3 55.5 (6.4) 118.0 EPS:
Basic(1) $ 0.44 $ 0.32 $ 0.55 $ (0.06) $ 1.22 Diluted(1) $ 0.44 $ 0.32 $ 0.54 $ (0.06) $ 1.22
2011
Revenues $ 991.8 $ 1,168.0 $ 1,366.2 $ 1,306.4 $ 4,832.4 Gross profit 147.0 172.7 201.1 187.4 708.2
Net income (loss) (1.1) 4.7 21.9 3.5 29.0 EPS:
Basic(1) $ (0.01) $ 0.06 $ 0.26 $ 0.04 $ 0.34 Diluted(1) $ (0.01) $ 0.06 $ 0.26 $ 0.04 $ 0.34
(1) EPS does not add across due to rounding and transactions resulting in differing weighted average shares outstanding on a
quarterly basis.

ANDREW R. LANE Chairman, President and CEO – MRC Global Inc.
JAMES E. BRAUN Executive Vice President and Chief Financial Officer
DANIEL J. CHURAY Executive Vice President – Corporate Affairs, General Counsel and Corporate Secretary
ALAN H. COLONNA Executive Vice President –Global Business Development & Supply Chain Management
SCOTT A. HUTCHINSON Executive Vice President – Canada
RORY M. ISAAC Executive Vice President – Corporate Strategy and Mergers & Acquisitions
GARY A. ITTNER Executive Vice President – Corporate Strategy and Mergers & Acquisitions
JAMES F. UNDERHILL Executive Vice President and Chief Operating Officer – U.S. Operations
NEIL P. WAGSTAFF Executive Vice President – International Operations
ANDREW R. LANE Chairman, President and CEO – MRC Global Inc. – Director since 2008
LEONARD M. ANTHONY Retired President and CEO – WCI Steel Inc. – Director since 2008
RHYS J. BEST Chairman – Crosstex Energy, L..P. and Retired Chairman and CEO – Lone Star Technologies, Inc. – Director since 2007
PETER C. BOYLAN, III President and CEO – Cypress Energy Partners, LLC and CEO – Boylan Partners, LLC – Director since 2010
HENRY CORNELL Managing Director of Goldman, Sachs & Co. – Director since 2006
CHRISTOPHER A.S. CRAMPTON Managing Director of Goldman, Sachs & Co. – Director since 2007
JOHN F.X. DALY Managing Director of Goldman, Sachs & Co. – Director since 2007
CRAIG KETCHUM Former Chairman, President and CEO – MRC Global Inc. and former co-President and co-CEO – McJunkin Red Man Corporation – Director since 2007
GERARD P. KRANS Chairman and CEO – Transmark Holdings N.V. – Director since 2009
CORNELIS A. LINSE Former Director of Common Infrastructure Management, Shell International, The Netherlands – Director since 2010
JOHN A. PERKINS Former CEO of Truflo International plc – Director since 2009
H. BERNARD WEHRLE, III Former President and CEO – MRC Global Inc. and former co-President and co-CEO – McJunkin Red Man Corporation – Director since 2007
BOARD OF DIRECTORS
CORPORATE INFORMATION
CORPORATE HEADQUARTERS
ANNUAL MEETING OF STOCKHOLDERS
MRC Global Inc.2 Houston Center 909 Fannin, Suite 3100Houston, Texas 77010
Phone 877.294.7574www.mrcglobal.com
Wednesday, May 8, 20132:00 p.m. (Eastern), Nosotri Room, Millenium Hilton Hotel, 55 Church Street, New York, New York 10007
COMMON STOCK LISTED
INDEPENDENT PUBLIC ACCOUNTING FIRM
SENIOR CORPORATE OFFICERS
New York Stock Exchange - Symbol: MRC
Ernst & Young LLP
TRANSFER AGENT
Computershare, Inc.P.O. Box 43078Providence, RI 02940

CORPORATE HEADQUARTERS
MRC GLOBAL INC.2 Houston Center
909 Fannin Suite 3100
Houston, Texas 77010
Phone 877.294.7574
www.mrcglobal.com


![C-MRC it gb de Ed01 2007reducta-im.hr/katalozi/zupcasti_reduktori_rc.pdfSELEZIONE RIDUTTORE - MRC 1400 [min-1] SPEED REDUCER SELECTION - MRC GETRIEBEAUSWAHL - MRC 0.09 kW (0.12 HP)](https://img.dokumen.tips/doc/110x75/6108c986e8f90f642023ce89/c-mrc-it-gb-de-ed01-2007reducta-imhrkatalozizupcastireduktorircpdf-selezione.jpg)