Embed Size (px)
Citation preview

The Egyptian Journal of Radiology and Nuclear Medicine (2014) 45, 859–867
Egyptian Society of Radiology and Nuclear Medicine
The Egyptian Journal of Radiology andNuclearMedicine
www.elsevier.com/locate/ejrnmwww.sciencedirect.com
ORIGINAL ARTICLE
MR spectroscopy and diffusion MR imaging
in characterization of common sellar and
supra-sellar neoplastic lesions
* Corresponding author. Tel.: +20 1224444297.
E-mail addresses: [email protected] (F.F. Mohammad),
[email protected] (D.I. Hasan), [email protected]
(M.G. Ammar).
Peer review under responsibility of Egyptian Society of Radiology and
Nuclear Medicine.
0378-603X � 2014 Production and hosting by Elsevier B.V. on behalf of Egyptian Society of Radiology and Nuclear Medicine.
http://dx.doi.org/10.1016/j.ejrnm.2014.04.012Open access under CC BY-NC-ND license.
Faten Fawzy Mohammada,*, Doaa Ibrahim Hasan
a, Mohamed Gouda Ammar
b
a Diagnostic Radiology Department, Zagazig University, Egyptb Neurosurgery Department, Zagazig University, Egypt
Received 18 February 2014; accepted 11 April 2014
Available online 5 May 2014
KEYWORDS
MRS;
DWI;
Supra-sellar
Abstract Background: MR spectroscopy and diffusion-weighted imaging are useful non invasive
imaging modalities used for characterization of different sellar and suprasellar lesions.
Patient and methods: We studied 30 cases of suprasellar SOLs (as proved by conventional MRI),
MRS and DWI. Our findings were correlated with histopathological analysis after surgical resection.
Results: Three false positive cases in which cMRI give diagnosis mismatched with that obtained
after adding the MRS findings and ADC values. MR spectrum type IIC is found in macroadenoma,
craniopharyngioma, meningioma and germinoma with characteristic broad lipid peak in the second
and forth types and elevated alanine peak in meningioma. Glioma hadMRS appearance of type IIB.
Simple differentiation between tumor types were achieved by the mean ADC values which were sta-
tistically significant (p< 0.001) when correlated to the histological diagnosis. When the ADC value
of 0.6 · 10�3 mm2/s this strongly points to macroadenoma, ADC value of 1.05 · 10�3 mm2/s in
meningiomas, ADC value 1.88 8 · 10�3 mm2/s strongly points to craniopharyngioma, while gliomas
and germinoma had ADC values 1.6 · 10�3 mm2/s and 1.0 · 10�3 mm2/s respectively.
Conclusion: MR spectroscopy and DWMRI are considered important diagnostic tools complemen-
tary to cMRI in pre-surgical evaluation and discrimination between different sellar and suprasellar
lesions.� 2014 Production and hosting by Elsevier B.V. on behalf of Egyptian Society of Radiology and Nuclear
Medicine. Open access under CC BY-NC-ND license.
1. Introduction
Accurate diagnosis is essential for optimum clinical manage-
ment of patients with sellar and supra-sellar tumors. Currently,there is a widespread use of MRI in determining tumor extentfor surgery and radiotherapy planning as well as for post ther-
apy monitoring (1–3).

860 F.F. Mohammad et al.
Pituitary tumors are classified into tumors of adenohy-pophyseal cells (adenoma and carcinoma) and other pituitarytumors of the sellar region that include; craniopharyngioma,
schwannomas, germ cell tumors, neuronal tumors (ganglio-neuromas), mesenchymal tumors, gliomas, chordomas andmetastatic tumors (4).
Recently, diffusion-weighted magnetic resonance imaging(DWI) has been used in the investigation of intracranialtumors (5–7). DW imaging allows the measurement of tissue
water diffusion, which is affected by the size and integrity ofstructures that normally restrict diffusion, in the brain. Theapparent diffusion coefficient (ADC) can be increased as aresult of pathologic processes that modify tissue integrity,
and thus these processes reduce ‘‘restricting’’ barriers (8).At present 1H-MRS represents a standard method for clin-
ical evaluation of intracranial tumors (9,10). It provides non-
invasively a wide spectrum of the biochemical information,which can be used for differentiation of neoplastic and non-neoplastic pathology, estimation of the tumor type, grade
and proliferative activity, prediction of the response to therapyand prognosis, and monitoring of the therapeutic response.The majority of published 1H-MRS studies are devoted to
investigation of parenchymal brain lesions, whereas only fewreports dealt with supra-sellar neoplasm. The reason for thisis evident––in such cases it is difficult to get good quality spec-tra, because clinical MR imagers with magnetic field strength
of 1.5 Tesla usually do not permit to use 1H-MRS voxel, lessthan 1 cc, which results in its frequent contamination withskull base structures (11,12).
2. Patients and methods
The study was carried in the time frame between June 2012 and
September 2013, included 30 consecutive patients referredfrom Neurology and Neurosurgery Departments to the MRunit, Radiology Department, Zagazig University. All our
patients were known cases of sellar and/or supra-sellar SOLas proved by CT and MRI. The study was approved by thelocal ethics committee and informed consent was obtained
from the patients.
2.1. Imaging sequences
(1) cMRI with a 1.5 T clinical imager (Philips Medical Sys-tem-Achiva-class II, USA) equipped with a standard
head coil. The following protocol was used:� Non contrast axial, coronal and sagittal T1WIs (TR
400–550 m/s, TE 15 m/s, FOV 250, matrix
256 · 256, section thickness 3 mm, interslice gap1 mm).
� Axial T2WI (TR 3500–4800 m/s, TE 110 m/s, FOV
250, matrix 256 · 256, slice thickness 3 mm, interslicegap 1 mm).
� Post contrast coronal and sagittal T1WI after admin-
istration of gadolinium 0.1 mm/kg body weight.(2) Prior to contrast agent administration, breath hold
DWI was done with a single-shot spin-echo echo-plan-ner sequence (TR/TE: 2000/33–55, matrix size
128 · 128, section thickness 6 mm, interslice gap1 mm, FOV 38 cm, b values 0 and 1000 s/mm2).
(3) ADC maps were calculated automatically and ADC
values were measured by using circumferential ROI(8–50 mm2) in the central and solid appearing portionsof lesions.
(4) Single voxel MRS was performed by applying the voxelon the region of the interest which was the solid part ofthe lesion. Single voxel acquisition was used and datafrom the voxel were obtained using a point resolved
spectroscopy sequence (TR 2000 m/s, TE 135 m/s).
The time domain signal intensity was recognized and pro-cessed to remove residual water signal. Post processing ofthe spectroscopic data consisted of frequency shift and phase
and linear baseline corrections after Fourier transformation.Frequency domain curve was fitted by the manufacturer todefine metabolites. The main metabolites identified by1H-MRS were NAA at 2.0 ppm, Cr at 3.0 ppm, Cho-contain-ing compounds at 3.2 ppm, myoinositol (mI), lactate as a dou-blet at 1.33 ppm and lipids resonating between 0.8 and1.4 ppm. Presence of each metabolite peak was initially evalu-
ated qualitatively by visual inspection, and type of the patho-logical 1H-MR spectra was determined according to thepreviously proposed classification (Table 1). Type I if NAA
is the predominant peak, type II if the Cho is the predominantpeak and type III if the predominant peak is not NAA or Cho.Each type further sub-typing into A, B ad C according to spe-
cific spectral findings e.g. in types I and II if there is Lip peak,it is given the subtype C. If No Lip peak it is given A or B(according to Lac peak). Type III is subdivided differently, ifthe predominant peak in the spectrum is Lipid, it is given
the subtype A, or B (according to Cho peak). Type IIIC (theflat spectrum), if the MRS does not detect metabolite peaksat all (13,14).
2.2. Operative data
Operative approach was guided according to preoperative dif-
fusion MRI and MRI spectroscopy. All pituitary adenomasoperated by endoscopic trans-septal trans sphenoidalapproach where curettage and suction could remove most of
the midline tumor and different angles rigid endoscope enabledsurgeons for better visualization and inspection of sellar andparasellar contents.
� Good evaluation of sphenoid sinus anatomy, defining
sinus type (conchal, presellar, sellar), and sinus septawhether midline or paramedian.
� Sellar localization was confirmed intra-operatively by
the C-arm.� Other sellar lesions which may need proximal vascular
control as meningioma, glioma, craniopharyngioma,
teratoma, dermoid operated by microscopic subfrontalapproach and frontal craniotomy.
� All patients kept at least one night at ICU for the
assessment of postoperative courses regarding con-scious level, visual, clinical, the fluid chart, electrolytesdisturbances and managing complications if any.
2.3. Histopathological diagnosis
Our diagnosis was confirmed pathologically after surgicaltreatment.
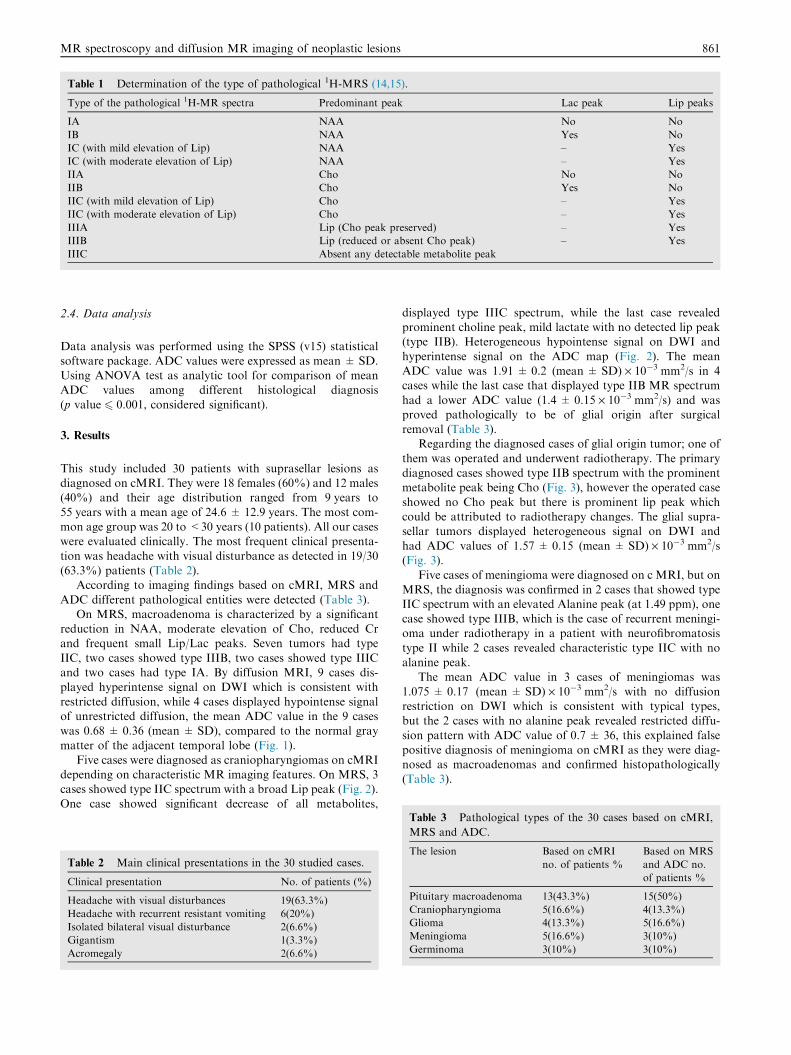
Table 1 Determination of the type of pathological 1H-MRS (14,15).
Type of the pathological 1H-MR spectra Predominant peak Lac peak Lip peaks
IA NAA No No
IB NAA Yes No
IC (with mild elevation of Lip) NAA – Yes
IC (with moderate elevation of Lip) NAA – Yes
IIA Cho No No
IIB Cho Yes No
IIC (with mild elevation of Lip) Cho – Yes
IIC (with moderate elevation of Lip) Cho – Yes
IIIA Lip (Cho peak preserved) – Yes
IIIB Lip (reduced or absent Cho peak) – Yes
IIIC Absent any detectable metabolite peak
MR spectroscopy and diffusion MR imaging of neoplastic lesions 861
2.4. Data analysis
Data analysis was performed using the SPSS (v15) statisticalsoftware package. ADC values were expressed as mean ± SD.Using ANOVA test as analytic tool for comparison of meanADC values among different histological diagnosis
(p value 6 0.001, considered significant).
3. Results
This study included 30 patients with suprasellar lesions asdiagnosed on cMRI. They were 18 females (60%) and 12 males(40%) and their age distribution ranged from 9 years to
55 years with a mean age of 24.6 ± 12.9 years. The most com-mon age group was 20 to <30 years (10 patients). All our caseswere evaluated clinically. The most frequent clinical presenta-
tion was headache with visual disturbance as detected in 19/30(63.3%) patients (Table 2).
According to imaging findings based on cMRI, MRS and
ADC different pathological entities were detected (Table 3).On MRS, macroadenoma is characterized by a significant
reduction in NAA, moderate elevation of Cho, reduced Crand frequent small Lip/Lac peaks. Seven tumors had type
IIC, two cases showed type IIIB, two cases showed type IIICand two cases had type IA. By diffusion MRI, 9 cases dis-played hyperintense signal on DWI which is consistent with
restricted diffusion, while 4 cases displayed hypointense signalof unrestricted diffusion, the mean ADC value in the 9 caseswas 0.68 ± 0.36 (mean ± SD), compared to the normal gray
matter of the adjacent temporal lobe (Fig. 1).Five cases were diagnosed as craniopharyngiomas on cMRI
depending on characteristic MR imaging features. On MRS, 3cases showed type IIC spectrum with a broad Lip peak (Fig. 2).
One case showed significant decrease of all metabolites,
Table 2 Main clinical presentations in the 30 studied cases.
Clinical presentation No. of patients (%)
Headache with visual disturbances 19(63.3%)
Headache with recurrent resistant vomiting 6(20%)
Isolated bilateral visual disturbance 2(6.6%)
Gigantism 1(3.3%)
Acromegaly 2(6.6%)
displayed type IIIC spectrum, while the last case revealedprominent choline peak, mild lactate with no detected lip peak(type IIB). Heterogeneous hypointense signal on DWI and
hyperintense signal on the ADC map (Fig. 2). The meanADC value was 1.91 ± 0.2 (mean ± SD) · 10�3 mm2/s in 4cases while the last case that displayed type IIB MR spectrum
had a lower ADC value (1.4 ± 0.15 · 10�3 mm2/s) and wasproved pathologically to be of glial origin after surgicalremoval (Table 3).
Regarding the diagnosed cases of glial origin tumor; one of
them was operated and underwent radiotherapy. The primarydiagnosed cases showed type IIB spectrum with the prominentmetabolite peak being Cho (Fig. 3), however the operated case
showed no Cho peak but there is prominent lip peak whichcould be attributed to radiotherapy changes. The glial supra-sellar tumors displayed heterogeneous signal on DWI and
had ADC values of 1.57 ± 0.15 (mean ± SD) · 10�3 mm2/s(Fig. 3).
Five cases of meningioma were diagnosed on c MRI, but on
MRS, the diagnosis was confirmed in 2 cases that showed typeIIC spectrum with an elevated Alanine peak (at 1.49 ppm), onecase showed type IIIB, which is the case of recurrent meningi-oma under radiotherapy in a patient with neurofibromatosis
type II while 2 cases revealed characteristic type IIC with noalanine peak.
The mean ADC value in 3 cases of meningiomas was
1.075 ± 0.17 (mean ± SD) · 10�3 mm2/s with no diffusionrestriction on DWI which is consistent with typical types,but the 2 cases with no alanine peak revealed restricted diffu-
sion pattern with ADC value of 0.7 ± 36, this explained falsepositive diagnosis of meningioma on cMRI as they were diag-nosed as macroadenomas and confirmed histopathologically(Table 3).
Table 3 Pathological types of the 30 cases based on cMRI,
MRS and ADC.
The lesion Based on cMRI
no. of patients %
Based on MRS
and ADC no.
of patients %
Pituitary macroadenoma 13(43.3%) 15(50%)
Craniopharyngioma 5(16.6%) 4(13.3%)
Glioma 4(13.3%) 5(16.6%)
Meningioma 5(16.6%) 3(10%)
Germinoma 3(10%) 3(10%)

Fig. 1 A case of macroadenoma. 55-Year-old female patient presented with persistent headache. (A) Coronal T2WI revealed relatively
hyperintense sellar SOL with supra-sellar and left para-sellar extension. (B) Coronal post Gd DTPA revealed homogeneous enhancement
of the lesion. (C) Axial DWI revealed intermediate signal intensity of the lesion. (D) Axial ADC map revealed intermediate signal intensity
of the lesion with ADC value = 1.1 denoting tumor with low cellularity (firm adenoma). (E) Single voxel MRS revealed type IIB:
predominant Cho, reduced NAA, and mild Lip peak.
862 F.F. Mohammad et al.

Fig. 2 A case of craniopharyngioma. 9-Year-old female presented with severe persistent headache. (A) Axial T2WI showing abnormal
signal intensity lobulated lesion at the sellar and suprasellar region displays heterogeneous hyperintense signal. (B) Axial DWI showed
heterogeneous hypointense supra-sellar lesion. (C) Axial ADC maps displayed heterogeneous hyperintensity of the lesion with ADC
value = 1.7 · 10�3 mm2/s. (D) Single voxel MRS revealed type IIC spectrum of the lesion by showing predominant peak of Cho, reduced
NAA and broad Lip peak.
MR spectroscopy and diffusion MR imaging of neoplastic lesions 863
The three germinoma cases showed characteristic elevationof Cho, decreased NAA and Cr, along with prominent Lip
peak type IIC. In DWI, the lesions displayed a hyperintensesignal on DWI and intermediate signal intensity on the ADCmap and had mean an ADC value of 1 · 10�3 mm2/s (Fig. 4).
Using ANOVA as a statistical analytic tool = 27.5
p < 0.001. ADC values can significantly be correlated to thehistological diagnosis (p < 0.001), for example, If the ADCvalue is 1.88 · 10�3 mm2/s this strongly points to craniopha-
ryngioma, but with the ADC value of 0.6 · 10�3 mm2/s thisstrongly points to macroadenoma (Table 4).
4. Discussion
MRI can provide an initial diagnosis of an intracranial masswith a success rate of 30–90% (15). Proton MR Spectroscopy
has been categorized as a safe diagnostic technique that canimprove the non-invasive categorization of brain disorders
and that they are starting to have a role in everyday clinicalmedicine (16).
In the present study we used long TE in MRS imaging as itallows good differentiation between lactate, lipid and alanine
and lower base line distortion, similarly Mikhail et al. (17)and Majos et al. (18) used long TE. On the other hand, Fanet al. (11) used a short echo time in his study for brain gliomas
and metastasis. Added that, metabolites such as myoinositol,are readily observed at short echo time only.
In our study we used single voxel MRS technique. Single
voxel is considered to have major advantages when spatial res-olution is not required. The advantages include short timerequirement, quicker data processing for obtaining quantita-
tive assessment and better magnetic field homogeneity(11,17). On the other hand Haughton et al. (16), recommended

Fig. 3 A case of optic chiasma glioma. 17-Year old male patient presented with headache, vomiting, and bilateral diminution of vision
and left sided proptosis. (A and B) Axial and coronal T2WI displayed hyperintense supra-sellar lesion with extension through the left optic
foramen into the optic nerve with subsequent proptosis. (C) Axial T1WI post Gd DTPA revealed intense uniform enhancement of the
lesion. (D) Axial DWI revealed hypointensity of the lesion, but relatively hyperintense to CSF excluding cystic lesion and support solid
lesion with low cellularity. (E) Axial ADC map revealed inhomogeneous hyperintensity of the lesion with ADC value = 1.4 · 10–3 mm2/s.
(F) Single voxel MRS revealed type IIC spectrum: elevated Cho reduced NAA and mild Lip peak.
864 F.F. Mohammad et al.

Fig. 4 A case of supra-sellar germinoma. 5-Year old female patient presented with bilateral diminution of vision. (A) Sagittal T1WI with
Gd DTPA revealed supra-sellar SOL with mild inhomogeneous enhancement. (B) Axial DWI revealed slight hyperintense signal. (C)
Axial ADC map showed intermediate signal intensity of the lesion with ADC value = 1.0 · 10–3 mm2/s. (D) Single voxel MRS revealed
type IIIA spectrum: predominant peak of Lip, high choline peak, and decreased NAA and only residual Cr.
Table 4 Showing comparison of mean ADC values among
different histological diagnosis.
No. X�± SD (range) Median
Macroadenoma 15 0.7 ± 0.28 (0.37–1.3) 0.6
Craniopharyngioma 4 1.9 ± 0.2 (1.7–2.2) 1.88
Glioma 5 1.57 ± 0.15 (0.4–1.7) 1.6
Meningioma 3 1.07 ± 0.17 (0.9–1.3) 1.05
Germinoma 3 1.0 ± 0.1(0.9–1.1) 1.00
MR spectroscopy and diffusion MR imaging of neoplastic lesions 865
multivoxel spectroscopy i.e. has higher SNR. In addition muti-voxel can provide information on tumor heterogeneity andinfiltration not available by single voxel spectroscopy.
The most common suprasellar tumor in our study was themacroadenoma which revealed type IIC MRS metabolite pro-file pattern was in agreement with previous studies of Faliniet al. (9), who stated that adenomas had pathological 1H-
MRS type IIC which was characterized by a significant reduc-tion of the NAA peak, residual Cr peak, moderate elevation ofCho and infrequent presence of small Lip and Lac peaks. In
our study all adenomas with type II were exclusively type IIC.

866 F.F. Mohammad et al.
Regarding DWI we found a heterogeneous signal and dif-ferent values for ADC according to their consistency. Ninecases displayed hyperintense signal on DWI which is consistent
with restricted diffusion and had a mean ADC value of0.68 ± 0.36 (mean ± SD), while 4 cases displayed hypointensesignal of unrestricted diffusion with higher ADC values due to
low cellularity. Our results were similar to Pierallini et al. (19)who stated that macroadenomas are of soft consistency withADC values (0.66 ± 0.1) · 10�3 mm2/s, intermediate consis-
tency with ADC values (0.84 ± 0.08) · 10�3 mm2/s and hardconsistency with ADC values (1.36 ± 0.26) · 10�3 mm2/s.Moreover, Rogg et al. (20) stated in their studies that theDW signal and ADC values probably depend on the phase
of hemorrhage and/or infarction in the pituitary gland or thepituitary adenoma.
In craniopharyngiomas cases we found MR spectra type
IIC in three cases and III C in one case with a significantdecrease of all metabolites, but we did not investigate anycysts. We focused the voxel over the solid portions of the
tumor avoiding any cystic components. While Mikhail et al.(17) proved that 80% of craniopharyngioma showed type IIICspectrum. He added that it seems that such a metabolic pattern
resulted from the presence of calcifications and microcystswithin the investigated volume of tissue. Elevated lipid peakwith only small quantities of other metabolites correlated withthe histological findings revealing high amounts of cholesterol
in the cyst fluid.Additionally craniopharyngiomas appeared as heteroge-
neously hypointense on DWI with high ADC values. In the
current study, average ADC values for craniopharyngiomaswas (1.91 ± 0.2) · 10�3 mm2/s. in agreement with Seneret al. (21).
MR spectra for our glioma cases were typically character-ized by decreased NAA, Cr peaks and increase of Cho peak.Three tumors had pathological 1H-MR spectra type II: 1 –
type IIA, 2 – type IIB, and 3 – type IIC. The recurrent tumorshowed type IIIB spectrum. In agreement with Mikhail et al.(17), but in disagreement regarding the spectrum of the recur-rent glioma that showed type IIIC. Hypointense signal of low
grade pilocytic astrocytoma is useful in the differential diagno-sis because MR spectroscopy shows a high Cho level, lowNAA and Lac peak despite the benign histology of the tumor
(16).On DWI, all of them showed hypointensity on DWI and
hyperintensity on ADC map with mean ADC
(1.57 ± 0.15) · 10�3 mm2/s which is consistent with lowtumeral cellularity in consistence with Murakami et al. (22)who found that ADC values in pilocytic astrocytoma is oftenhigher than 1.5 · 10�3 mm2/s. High ADC value probably
reflects relatively lower cellularity, a lower nuclear-to-cytoplas-mic ratio and a high concentration of glycosaminoglycans,which is highly hydrophilic causing the shift of water molecules
in the extracellular matrix.Two meningioma cases in our study showed type IIC spec-
trum and an elevated alanine peak (at 1.49 ppm). These find-
ings were partially consistent with those of Majos et al. (18)who stated that alanine is the most characteristic metaboliteof meningioma, thus he considered it as a marker for meningi-
oma. One case of meningioma showed type IIIB which was arecurrence under radiotherapy in a patient with neurofibroma-tosis type II. This is in agreement with Sumer (23) who also
stated that post radiation lesions show a large peak between0 and 2 ppm, indicating cell necrosis products.
Regarding the DWI of the meningioma cases appeared
slightly hypointense in 3 out of 5 cases with an averageADC value of 1.07 ± 17 · 10�3 mm2/s, while two cases withno alanine peak on MRS showed restricted diffusion with a
mean ADC (0.7 ± 36 · 10�3 mm2/s,), so the diagnosis asmeningioma on cMRI was incorrect and they were diagnosedas macroadenoma on MRS and DWI. Our results near the
results reported by Okamoto et al. (24) in their study as theyfound that 66% of meningiomas (8 out of 12 cases) appearedisointense on DWI while partial hyperintensity was noted inthe other cases (33%), while other authors found that the
signal characteristics of meningiomas on DWI are variable(20).
Regarding germinoma cases in our study, typically charac-
terized type IIC with moderate elevation of Lip, which wascharacterized by the absence of NAA peak, residual Cr peak,and significant elevation of Cho. This is in agreement with the
authors (17). On DWI, we found them hyperintense on DWI(b1000) with an ADC value of 0.9–1.0 · 10�3 mm2/s. On thecontrary Annette et al. (25) found that the majority of germi-
noma cases were isointense (54.4%) on DWI with normal dif-fusion and an ADC value of 0.94 ± 0.54 · 10–3 mm2/s, while36% were hyperintense on DWI with restricted diffusion anda mean ADC value of 0.69 ± 0.74 · 10�3 mm2/s. They also
found no significant correlation between the histological com-ponents and the ADC values.
In the current study, MRS and diffusion-weighted imaging
are proved to be helpful as a non-invasive modality for thediagnosis of supra-sellar lesions. ADC values were statisticallysignificant when correlated to the histological diagnosis
(p < 0.001).
5. Conclusion
MRS and diffusion-weighted MRI are considered importantdiagnostic tools complementary to cMRI examination andpromise to contribute to pre-surgical evaluation and discrimi-
nation between different suprasellar lesions.
Conflict of interest
None declared.
References
(1) Rennert J, Doerfler A. Imaging of sellar and parsellar lesions.
Clin Neurol Neurosurg 2007;109:111–2.
(2) Dowling C, Bollen AW, Noworolski SM. Preoperative proton
MR spectroscopic imaging of brain tumours: correlation with
histopathologic analysis of resection specimens. Am J Neurora-
diol 2001;22:604–12.
(3) Kwock L, Smith JK, Castillo M, Ewend MG, Cush S, Hensing T,
et al. Clinical applications of proton MR spectroscopy in
oncology. Technol Cancer Res Treat 2002;1:17–28.
(4) Sylvia L. Asa. Neuroendocrinology of hypothalamus and pitui-
tary, Chapter 3. www.endotext.org/neuroend/index.htm [last
updated 10.07.07].
(5) Brunberg J, Chenevert T, McKeever P, Ross D, Junck L,
Muraszko K, et al. In vivo MR determination of water diffusion
MR spectroscopy and diffusion MR imaging of neoplastic lesions 867
coefficients and diffusion anisotropy: correlation with structural
alteration in gliomas of the cerebral hemispheres. AJNR
1995;16:361–71.
(6) Byun W, Kim O, Kim D. MR imaging findings of Rathke’s cleft
cysts: significance of intracystic nodules. AJNR 2000;21:485–8.
(7) Castillo M, Smith J, Kwock L, Wilber K. Apparent diffusion
coefficients in the evaluation of high-grade cerebral gliomas.
AJNR 2001;22:60–4.
(8) Castillo M, Mukherji SK. Diffusion-weighted imaging in the
evaluation of intracranial lesions. Semin Ultrasound CT MR
2000;21(6):405–16.
(9) Falini A, Calabrese G, Origgi D, Lipari S, Triulzi F, Losa M,
et al. Proton magnetic resonance spectroscopy and intracranial
tumours: clinical perspectives.. J Neurol 1996;243:706–14.
(10) Kozic D, Medic-Stojanoska M, Ostojic J, Ljubomir P, Nada V.
Clinical applications of proton MR spectroscopy and treatment
approaches in a patient with extrapituitary GH secreting macro-
adenoma. Neuro Endocrinol Lett 2007;28:560–4.
(11) Fan G, Sun B, Wu Z, Guo Q. Invivo single voxel proton MR
spectroscopy in the differentiation of high grade gliomas and
solitary metastasis. Clin Radiol 2004;59:77–85.
(12) Kwock L, Smith J, Castillo M, Ewend M, Cush S, Hensing T,
et al. Clinical applications of proton MR spectroscopy in
oncology. Technol Cancer Res Treat 2002;1:17–28.
(13) ChernovM,HayashiM, IzawaM,OnoY,Hori T. Protonmagnetic
resonance spectroscopy (MRS) of metastatic brain tumors: varia-
tions of metabolic profile. Int J Clin Oncol 2006;11:375–84.
(14) ChernovM, Ono Y, Muragaki Y, Kubo O, Nakamura R, Iseki H,
et al. Differentiation of high-grade and low-grade gliomas using
pattern analysis of long-echo single-voxel proton magnetic reso-
nance spectroscopy (1H-MRS). Neuroradiol J 2008;21:338–49.
(15) Dumrongpisutikul N, Wang Y, Zou L, Gao B. Distinguishing
between germinomas and pineal cell tumors on MR imaging.
AJNR 2012;33:550–5.
(16) Haughton V, Prost D, Rand S. Accuracy of single voxel proton
MRS in distinguishing neoplastic from non-neoplastic brain
lesions. Am J Neuroradiol 2003;18:1695–704.
(17) Mikhail F, Chernov, Takakazu K, Kosaku A, Yuko Ono, Suzek
T, et al. Possible role of single-voxel 1H-MRS in differential
diagnosis of suprasellar tumors. J Neuroncol 2009;91:191–8.
(18) Majos C, Julia-Sape M, Alonso J, Serrallonga M, Aguilera C,
Acebes JJ, et al. Brain tumor classification by proton MR
spectroscopy: comparison of diagnostic accuracy at short and
long TE. AJNR 2004;25:1696–704.
(19) Pierallini A, Caramia F, Falcone C, Tinelli E, Paonessa A, Ciddio
A, et al. Pituitary macroadenomas: preoperative evaluation of
consistency with diffusion-weighted MR imaging – initial expe-
rience. Radiology 2006;239(1):223–31.
(20) Rogg JM, Tung GA, Andrson G, Cortez S. Pituitary apoplexy:
early detection with diffusion-weighted MR imaging. Am J
Neuroradiol 2002;23:1240–5.
(21) Sener RN, Proton MR. Spectroscopy of craniopharyngioma.
Comput Med Imaging Graph 2001;25:417–22.
(22) Murakami R, Hirari T, Kitajima M, Fukuoka H, Toya R,
Nakamura H, et al. MRI of pilocytic astrocytomas: usefulness of
minimum ADC value for differentiation from high-grade gliomas.
Acta Radiol 2008;49:462–7.
(23) Sumer Sethi. Spectroscopy in meningioma. AJNR Am J Neuro-
radiol May 1999;20:882–5.
(24) Okamoto K, Ito J, Ishkawa K, Sakai K, Tokigushi S. Diffusion-
weighted echo-planner MR imaging in differential diagnosis of
brain tumours and tumor-like conditions. Eur Radiol
2000;10:1342–50.
(25) Annette C, Douglas A, Jun Y, Zahirabbas M, Amr M, Eyas M.
Diffusion-weighted imaging characteristics of primary CNS
germinoma with histopathologic correlation: a retrospective
study. Acad Radiol 2009;16(11):1356–65.