Embed Size (px)
Citation preview

MPH Second Year Project
Professional Publication Framework .
Knowledge assessment of care – takers of children from 2 to 6 years old living in Bureghavan about
lead exposure and lead poisoning
Prepared by Aleksandrian Gohar
1

Table of content
1. Abstract ---- 3
2. Introduction---- 4
2.1Background ----- 4
2.2 Situational analysis of Armenia------------ 5
3.Objectives of the Research and Research Questions------ 8
4. Methods---- 9
4.1.Study design------- 9
4.2.Study population------ 9
4.3.Study instrument------ 10
4.4.Validity of the study ------- 11
4.5.Data analysis------- 11
5 .Data collection methods------
Key informant interviews ------ 12
Key informant interviews with physicians ------ 12
Key informant interviews with teachers-------- 13
Key informant interviews with mothers -------- 13
6.Results-----
Analysis of key informant interviews-------- 14
Analysis of self –administered questionnaire-------- 14
7. Discussion ------- 18
8.Recommendations----- 21
9. References------ 24
.10. Appendices ------ 26
2

Abstract
Introduction . Adverse health effects from exposure to lead are a most important environmental
health problem in the world. Studies have shown that relatively low blood concentrations of lead may
be associated with toxic health effects.
In the United States more than 6 million preschool metropolitan children and 400, 000fetuses
were believed to have lead concentrations above maximum permissible .
In Armenia the content of lead in the atmospheric air, soil , water of some rivers , and in the dust
on internal surfaces of dwellings and public houses ,significantly exceeds the permissible levels.
Studies conducted in Bureghavan , where the environment is more polluted compared to
Yerevan ,have shown that the blood level in children was high; moreover in 44,4% of the children ,the
content of lead exceeded the safe level for children .
These data dictate importance to develop and implement a preventive program in Bureghavan .
Taking into consideration that caretakers of children at age of interest are responsible for their health ,
we decided to conduct a study which is aimed to identify the level of knowledge of caretakers about
lead exposure and lead poisoning , and assess the needs for a health education program .
The study consisted of key informant interviews and a self –administered questionnaire for
caretakers . The study population was identified by systematic random sampling of Bureghavan
caretakers. The study explored the relationship between age, gender, education, number of children ,
family member worked at the plant , social status and the level of knowledge about lead exposure and
lead poisoning. The analysis of the study was done using “Stata” program . Results of the analysis
have shown a positive association ( OR=13, p= 0.017 ) between presence of family member who
worked at the plant and the level of knowledge about lead . The correlation between social –economic
status of caretakers and the level of knowledge of lead was another important relationship (OR=3, p
=0.014).There was no association between level of knowledge and other independent variables . Study
showed the necessity of an educational program parents , school teachers and health personnel at the
community level .
3

Introduction
Lead poisoning in children is the most important pediatric environmental health
problems . In the United States more than 6 million preschool metropolitan children and 400,
000 fetuses were believed to have lead concentrations above 10 µg /dL . That is the maximum
permissible concentration from the stand point of protecting the health of children been established by
the U.S Public Health Service , 20µg /dL is the concentration at which medical intervention should be
considered . (1), (2).
The adverse health effects noted at 10 µg /dL are the following : impairments of CNS such as
weakening of memory and of the activity to concentrate , impairments in cognitive function and
various behavioral disorders in young children .(3) , (4). Impairment in biosynthesis of hemoglobin by
which lead causes anemia . The lead –induced derangement of heme synthesis causes abnormally high
excretion of metabolites in urine . Of these the levels of ALA and coproporphyrin are elevated in lead
poisoning and measurements of these metabolites have been used in diagnostic tests(5).
Studies have shown that blood lead levels as low as 10 to 15 mcg/ dL are associated with
diminished intelligence ,impaired neurobehavioral development, decreased hearing acuity, and growth
inhibition. (4).
Risk factors
Children’s total lead exposure is made up by the background exposure from food ,
beverages, dust, paint and ambient air , which is unavoidable in modern society(6) .The
ingestion of leaded paint today constitute the greatest single source of lead available to children
, and an important source to many adults , especially those involved in home remodeling and
renovation . Since lead concentration in paint flakes may reach 40 % by weight , only small
amounts are needed to produce poisoning in young children . Active hand- to – mouth activity,
leading to toxic ingestion , is common in children . It has been estimated that as many as12
million American Children under 7 years of age live in housing containing some lead paint,
and of these , a substantial proportion suffer from undue lead exposure. (4)
4

Soils may contain lead from airborne contamination , from the use of leaded pesticides ,or from
paint on the exterior of nearby buildings; food crops derived from such soils may contain high amounts
of lead (7) .
In the early 20-th century , lead water pipes and lead- lined storage tanks were common in
homes . Lead has been found to leach into domestic water supplies . A 1972 survey from Glasgow,
Scotland , identified several persons suffering from lead poisoning as a consequence of extremely high
lead levels in drinking water (8) .
Lead exposure from beverages stored in lead crystal decanters is also considered to be a hazard (9)
Improperly glazed earthenware has a history of causing lead poisoning (10). Acidic foods and
beverages , such as tomatoes, tomato juice , fruit juices , soft drinks , pickles may dissolve lead from
the glaze . In countries where such pottery is produced such as Mexico, Central America and
Mediterranean countries, lead poisoning from this is common and even endemic (11) . It was shown
that lead –soldered cans could introduce contamination into processed foods intended for consumption
by young children (6).
Yet another recently rediscovered source of human lead contamination , that of medications, has
ancient antecedents as well .Lead has been applied as a cosmetic and folk remedy for thousands of
years , and such medications are still used in developing countries .(7)
In literature many cases of lead poisoning in children of lead workers were described .Home
contamination of children took place by the industrial dust on working clothes while worker came
home in working clothes , or work clothes or shoes were taken home (12) .
Situational analysis of Armenia .
In Armenia, the background level of soil contamination is such similar to that
registered in developed countries (1),(13) .The sources of additional environmental
contamination are industry ( mining and ore dressing , melting of coper concentrates , production
of the ceramic and crystal etc) .(13)
The environment of the industrial cities of Armenia like Yerevan ,Alaverdi, Bureghavan and
others, in which live half of the population of the republic , is polluted by lead. The content of lead in
the atmospheric air, soil ,and water of some rivers ,according to data of limited and irregularly
conducted monitoring, significantly exceeds the Maximum Permissible Concentration .(MPC) levels(1).
According to the data of the HydroMet Center in 1989-1991 , the maximal acute dose of
MPC (maximum permissible concentrations ) which exceeds the norms has been observed in
Yerevan and Bureghavan (14) .
5

According to the data of Research Institute of General Hygiene and Occupational Diseases in of
1995, when the activity of motor transport was partially restored , lead in significantly high
concentration was found in samples of air taken from the street intersections .
In 1996, in the air of Bureghavan ,lead in the average daily concentrations which exceeded the
level of MPC, - 0,5 mg/ m3 and 0,89 mg/ m3 has been discovered in 2 samples from 5 ones. (15)
We can also judge about lead pollution of atmospheric air by the lead content in the dust
precipitated on the surfaces of the streets , dwellings and public buildings . In the samples of dust
that formed the sediment in the streets of Yerevan, the content oflead reached 1100 µg / m² ,and on
the surfaces of dwellings, 150- 180 µg / m² . When in Bureghavan the main source of lead, crystal
plant, did not work, the content of lead in the surface wipe samples of polyclinics and shops was
1700mcg/ m² , of classrooms , dining- rooms , sleeping –rooms , halls and toilets of the boarding
schools – 115,462 , 450, 600 and 756 µg/ m² respectively . In the sleepping – rooms of the dwellings
of the residents of Bureghavan , the content of lead has fluctuated within the limits of 385-1300 mcg/
m² (1) . In Armenia , there are no norms of lead content in the dust precipitated on surfaces, which
makes difficult the assessment of pollution . However, there is a norm in the US, according to
which the amount of lead in the dust which is formed on the internal surfaces of dwellings and public
houses should not exceed 1050µg /m² (16) .Taking into consideration this norm, the maximal values in
the figures above exceed the permissible US lead levels .(16)
According to the data of Ecological – Noospheric investigations of Armenia (17) , the whole
territory of Yerevan city is intensively polluted by lead. The center of Yerevan is more polluted
.Here the content of lead in soil and dust exceeds the MPC 100 times (14).
Pollution of soil .The investigations of vegetables ( tomatoes, egg- plant , pepper , haricot bean)
cultivated on the territory of Yerevan showed that the content of heavy metals in them is high ,
including the lead . In more polluted sites , the content in tomatoes exceeded the level MPC 8 times
and twice in less polluted sites(14),(15) .
The cooperative investigations of the Center of Ecological – Noospheric investigations of the level
and distribution of soil pollution in Yerevan by lead , and the pollution impact on perinatal mortality,
reveals the correlative dependence between mortality and pollution by this metal . (17)
Results of the investigation of paints . In the former USSR it was strictly limited and forbidden
to use lead containing paints on surfaces of dwellings and public houses . This contributed to decreasing
the level of pollution of the environment by lead by means of paints . However , according to the
above investigations, paints continue to remain as a source of lead pollution of the environment (2) .
The content of lead in air of working zone and in precipitated dust taken from industrial surfaces .
Hygienic investigation of three industrial enterprises showed that due to objective reasons –
6

technological incompetence , low efficiency of warning measures , low productive culture and so on in
the mentioned above enterprises, there are predisposing conditions for air pollution of working zones by
lead (3) ,(18-20).
Health effects in workers exposed to lead . In enterprises with such high levels of air
pollution of working zone by lead cases of chronic intoxication by lead have been registered
during last years (in1989–I case, in 1990–3 cases , in 1991 – one case ). Medical examinations
of workers of the Crystal Plant in 1993 and of the Crystal Chandelier Plant in 1996 have not
discovered new cases of occupational poisoning; however the range of. specific disorders
inherent to lead exposure have been revealed. Of those workers who have lead levels
higher than 40mcg/dL , contents of luteinine hormone, testosterone and prolactine changes
were more apparent in workers of CrystalPlant and Chandelier Crystal Plant ( 13).
Study of blood of children living in Bureghavan. The study of blood of children living in Bureghavan
and Yerevan on the content of hemoglobin and protoporphyrin did not discover apparent disorders
caused by lead ,although in both cities the level of hemoglobin in blood is low .In Bureghavan , where
the environment is more polluted compared to Yerevan , the average level of lead in blood of children
constituted 10 mcg/ dL . Moreover , in 44,45 % of children the content of lead exceeded the safe for
children level of 9,9 mcg/ dL . This dangerous level has been reported in 3,7 5% of examined children
in Yerevan, during different years it has been fluctuated between 2-12 mcg / dL and 1-18 mcg /dL (21) .
In Armenia as well as in other countries ,lead poisoning in children is most frequently a consequence
of the ingestion of leaded paint chips ,or dust or soil which have become contaminated with lead
derived from such paint .This type of poisoning is a great tragedy but is entirely preventable .The
principles for prevention of childhood lead poisoning are (1) prohibition of the use of lead –based pints
for interior and exterior applications , toys ,and household items; (2)sanitation ;(3) improvement of
social conditions (4)education (22-24) .
The economic impact of lead on the population health, which is calculated by experts of the World
Bank and local specialists, is estimated as 40-55 million US dollars and expected benefit due to the
implementation of the reducing lead pollution measures is 59 million US dollars per year (21) .
The personal hygiene of children is a very important factor in the hand – mouth way of lead
transmission and mothers are responsible for it, since children of this age need the care of adults
Therefore the level of the knowledge of care – takers of children from 2 to 6 years of age about lead
poisoning becomes very important .Taking into consideration the fact that care-takers can obtain some
information about lead exposure and lead poisoning from the medical personnel during their visits to
the polyclinic, and from the school and kindergarten teachers at the time of daily visits to them ; we
7

were interested in the assessment of knowledge of medical personnel and teachers, as well as care-
takers of the children.
In order to reduce lead exposure and lead poisoning of children educational program is
needed which would target as much caretakers as possible .To make program effective and
targeted preliminary information is needed on the Bureghavan caretakers ‘knowledge of lead
exposure and lead poisoning .
Objectives
The study is aimed :
• to assess the level of knowledge of caretakers about lead exposure and lead .
• to assess the level of knowledge of medical personnel about lead exposure and lead poisoning .
• to assess the level of knowledge of school and kindergarten teachers about lead exposure and lead
poisoning .
The main research questions of the present study are
• what is the level of knowledge of caretakers about lead exposure and lead
• what is the level of knowledge of medical personnel about lead exposure and lead poisoning
• what is the level of knowledge of school and kindergarten teachers about lead exposure and lead
poisoning .
The following hypothesis were planned to be tested in this study:
1.There is an association between age of care-takers and the level of knowledge regarding lead
exposure and lead poisoning.
2.There is the association between gender of care-takers and the level of knowledge
regarding lead exposure and lead poisoning.
3.There is the association between education of care-takers and the level of knowledge
regarding lead exposure and lead poisoning.
4.There is the association between social status of care-takers and the level of knowledge regarding
lead exposure and lead poisoning.
5.There is the association between the number of children of care-takers and the level of knowledge
regarding lead exposure and lead poisoning.
6. There is the association between presence of a family member who worked at the plant and the
level of knowledge of care-takers regarding lead exposure and lead poisoning.
8

Methods
Study dersign
The study was descriptive . Author of the study used mixed methodology : qualitative and
quantitative methods .The knowledge cross - sectional qualitative and quantitative surveys were used
for the investigation of general knowledge of care – takers of children from 2 to 6 years old living in
Bureghavan regarding lead exposure and lead poisoning.
The first phase of the study was qualitative .Key informant interviews with caretakers ,
physicians , nurses, school and kindergarten teachers were conducted in order to explore their
knowledge of lead exposure and lead poisoning , provide greater understanding of research questions
and to assess the needs for health educational program in Bureghavan . Qualitative research method was
done in Bureghavan by the author of the study.
In order to make data on knowledge of caretakers generalizable for Bureghavan and generate
the statistics which will provide the assessment of the need for the educational program related to Lead
Poisoning , the second phase was conducted using quantitative method . The telephone interviewing
of caretakers would be more cost -effective . However the majority of people in Bureghavan had not
telephones , therefore the survey was conducted through the self-administered questionnaire.
Systematic random sampling was used in this study , so the caretakers of each child age 2 to 6
had the same probability of being drawn . Sampling was done on the basis of journal (Registration )
book of children registered in the district polyclinic of Bureghavan.
Self –administered questionnaires were distributed and collected starting in August 8 until
August 22 1999.
Study population.
The target population were residents of Bureghavan . Due to Crystal plant in this district
Bureghavan was selected as one of the most lead polluted districts of Armenia . The authors were
interested in question whether the population of such polluted district were aware about lead exposure
and lead poisoning ,and was there any need for education related to lead exposure and lead poisoning ..
9

Inclusion criteria for selection of population :care- takers of child(ren) from 2 to 6 years old, registered
and living in Bureghavan .
Exclusion criteria:
• Care- takers of children from 2 to 6 who are registered in the district polyclinic but do not live in
Bureghavan .
• The 6 care- takers who had undergone pre-testing.
Sample universe constituted all men or women from 18 till 6 years old who took care of
children 2 to 6 years old , and lived in Bureghavan. Sample frame was list of children from 2
to 6 years old who were registered in the district polyclinic.Sample unit was men or women
from 18 till 65 years old who took care of children from 2 till 6 years old ,and lived in
Bureghavan . All children born from August 1992(6 years ) till August 1997. ( 2 years old)
were selected from the registration book of polyclinic .The sample size was calculated using
the following formula:
n =zα-0.5 2x p x q / ∆2 , where zα-.5 =1.96 (is a cut-off for two-sided test with 95% CI)
p- proportion of respondents who answered correctly
q -proportion of respondents who answered incorrectly
where d is precision of 0.1 . (estimate will be +/- 0.10 ) . This precision
is acceptable .So , for precision 0.1 we need sample size equal to 96. .
The whole number of children at age of interest was 368 . The first element of the
sample was selected randomly in order to avoid selection bias. From the list was drawn random
the number 29. According to the formula the sample size was equal to 96. Therefore to find
the sample interval we divided 368/96=3.83., which is approximately 4. So , sample interval
k= 4 . Every 4-th one after 29 was drawn .
Study instrument
The telephone interviewing of caretakers would be more cost -effective . However the majority
of people in Bureghavan had not telephones , therefore the survey was conducted through the self-
administered questionnaire. Questionnaire consisted of 31 questions (See Appendix 3) . The
questionnaire included the information regarding caretakers’ demographics, lead containing items,
exposure to lead , hazardous for health habits in terms of lead poisoning , symptoms of lead poisoning
10

. The questionnaire was pre-tested and revised . Designing the questionnaire was based on the
Michigan Standardized Lead –screening program questionnaire.
Validity of the study . Content validity conveys the degree to which questions chosen in the questionnaire , and in the
guide to the interviews , represent the concepts they are intended to reflect (25). Review of the
literature on the concepts and measures within each dimension has been done in order to analyze the
content validity .
Criterion validity is the extent to which the survey measure agrees with some criterion of the
“true ‘ value of the measure .(25) Some of the questions were taken from the standardized questionnaire
of survey on knowledge about lead done in Michigan state .
Construct validity. On the basis of literature review we developed hypotheses about the
relationship of variables measured in the study .
Data analysis
Large set of independent variables such as age ,gender, education ,social -economic
status, number of children in the family and family member who worked at the plant . The level of
knowledge was dependent variable on which the study was focused.
Data collection methods included key informant interviews and quantitative self –
administered questionnaire . Interviews with key informant were done in the Armenian
language . Subjects for interviews were physicians , nurses, teachers , mothers and grand –
mothers .Subjects for self- administered questionnaire were mothers . Data were collected from
8 to22 of August by 2 trained distributors of self-administered questionnaires.
All responses of the questionnaire and variables were coded and introduced into
“Excel” program in the computer. Then the data were introduced into the “STATA“
computer program and the statistical analysis was carried out . To identify the association
between each independent variable and dependent variable the Pearson χ2 test of association
was applied . To analyze independent ordinal variables and interpret the associations found
with nominal variables the logistic regression was used .
11

Results During the data collection it was discovered that 2 left Bureghavan with their parents and 3
addresses were wrong. Besides this ,one respondent refused to fill the questionnaire and one was not
at home. During the coding process it was revealed that 2 respondents had completed the questionnaire
incorrectly and their answers were excluded from the analysis . Results of the sampling are presented
in the TableA.(SeeApp5)
So , 87 completely filled questionnaires were collected .
Key informant interviews .
Types and numbers of respondents are presented in Table B. (App.5) To make it more
convenient for respondents , interviews were conducted at their workplaces . Interviews with 4 mothers
and one grandmother were conducted at the time of their visit to the polyclinic . One interview was
conducted simultaneously with mother and grand- mother . The standardized approach was used . Oral
consent protocol has been read by researcher to the physicians ,nurses, teachers and mothers before
starting interview. After getting agreement from the interviewees, interviews were conducted
.Interviews were done by asking open –ended questions and recording field notes Then field notes
were extended and translated into English from Armenia.
The same procedure across different interviews was applied in order to decrease interviewer
bias . Use of words , use of probes , clarification of questions and allowable answers all were
standardized by author .The purpose of in depth interviewing was to understand what they knew about
risk factors of lead poisoning
Key informant interviews’ results
Key informant interviews with physicians .
Both physicians lived in Yerevan and came to the polyclinic from Yerevan . Both physicians
knew about the existence of the Crystal plant in Bureghavan. .One of the physicians worked about 6
months at the Crystal plant .Both physicians knew very well about goods and items which produced at
the crystal plant , particularly crystal vases , bottles , but now only glass bottles .Both answered by
guessing “ May be lead “
12

“ If you speak about lead , so probably lead . “ , “ I was not informed till now , but may be lead
, because you are interested in lead “ , “ Possibly , lead if you ask me about it “ . “ You know that my
father was working at the crystal plant for a long period of time . He told me that at the crystal plant all
windows and doors were covered by a thick cover of white dust . Now I understand that probably it
was a covering of lead . “ near to the plant was growing grass which was always covered by white
covering . As you told me , may be it was a lead . ““ My husband worked few years at the plant . He
usually came home in his working clothes which were covered by dust of lead .”
The physicians did not know about lead poisoning. They just guessed the possibility of such
complication ( influence ) from the question . One of them said : “ If you ask about it , probably “ Yes” .
The second one said : “ When I gave you agreement of interview yesterday I came home and began to
seek something about lead from the medical literature and obtained some information . So , by the time
of this interview I know ,but I did not know before your visit. “ First physician mentioned only soil-
plant way of pollution by lead .Neither one mentioned pollution by beverages and canned products .
Key informant interviews with teacher of the kindergarten .
The teacher lived in Bureghavan . The teacher was an indigenous inhabitant of Bureghavan.
She did not work at the Crystal plant ,although she knew very well about the existence of the plant
and its production . She was not able to mention anything which was harmful to children’s health in
crystal containers . Related to the working clothes she answered that it was certainly better to have
working clothes for the working place but change them before coming home .However, she could not
explain how contamination by lead can take place through clothes . With regard to lead poisoning , the
teacher heard about it for the first time .She did not say anything about lead pollution by food and
beverages .
Key informant interviews with mothers.
All of them lived in Bureghavan and knew about the plant. They did not work at the plant.
They mentioned about crystal goods as a production of the plant . The mothers did not know about any
harmful items which were contained in crystal goods . One of them said : “ In any case , a worker
should have working clothes for his workplace. But I do not see any thing harmful for children when
father or grandfather comes home in his working clothes . “ The second one answered : “ There is no
difference in what clothes family members come home. “ Mothers even do not know what is lead ,
and consequently they could not speak about lead poisoning . One of them asked : “ What is lead ? Is
this a drug ?”The second one answered : I can not understand your question . I do not know what is
13

lead . “Mothers were not able to speak about pollution of food and beverages by lead . One of them
said “ Sorry , I do not know anything about lead . “
Analysis of the key informant interviews
The following data have been revealed during the key informant interviews
1. All of them without exception knew about existence of the Crystal plant and its production
2. All of them excluding two physicians, were residents of Bureghavan.
3. Nobody knew about pollution of beverages by lead .
4. Nobody knew about existence of lead in crystal containers.
5. Neither teachers and mothers nor physicians know clearly what is lead
poisoning .
Survey analysis
Social -Demographic characteristics ( see Table C,App.6)
All respondents were married women. . The mean age of caretakers was 56 ± 10. About 47%
of interviewees had 8 years of education , 47 % of ones had 10 years of education, 5% of respondents
had 11 years of education ( technical)and only had graduated from University . All female were
married. 44% of respondents belonged to the low level of income ,32 %of them belonged to the
medium level of income and only 6% of caretakers belonged to the high level of income . 29 %of
women had one child ,52% of them had two children and 19% of caretakers had more than two children
.58% of caretakers had a family member who worked at the Crystal plant and 42% of them had not
family member who worked at the plant .
Lead
Knowledge of caretakers about lead exposure and lead poisoning were of interest in this study .
Women were asked what is a lead . Only 29% mentioned that it is “a chemical element “. 30% of
women mentioned mistakenly that it is a “medicine“.( App.4,Table#1)Several lead containing items
were listed and respondents were asked to select items which contain lead . 24% of the sample
mentioned “crystal bottle”, 37% of respondents selected only “can “ and 24% of women gave answer
“antique pottery”. The lowest proportion 5% gave absolutely correct answer indicating all three items .
(SeeApp.4,Table#2) .
14

Lead exposure. Places and actions.
Only 1/3 of respondents considered that painting and remodeling of the houses could be
harmful for their children health .Several hazardous lead polluted places were mentioned .
(SeeApp.4,Table#3)Only 36% of women answered correctly that the staying of their child in the
mentioned places was harmful in terms of lead poisoning . (SeeApp.4,Table#4) .
Cosmetics
Women were asked whether they used “surma” cosmetics . Among those 29 women who had
ever used “surma” cosmetics, 36% were sure that this type of cosmetics did not contain lead
And 26% did not know whether “surma” contained lead (SeeApp.4, Tables #5,6) .
Soil pollution
Caretakers were asked about soil pollution in Bureghavan lead. Only 31%(27persons)
considered that soil in Bureghavan was polluted due to Crystal plant (See Table#7) .From 54%(47) of
respondents who had adjacent plot .47% (22persons ) grew vegetables on it . Among 22persons
growing vegetables only 33% (7persons) thought that it was harmful regarding lead pollution .The
remaining 32% believed that it was not harmful and 35% did not know whether it is harmful or not
(See App.4,Tables #8,9,10).
Among those75%(64) mothers whose children played with soil 32% were sure that it was not
harmful in terms of lead poisoning. 26% of caretakers did not know whether it is harmful or not. Only
26% of respondents were sure that it was harmful for their children to play with soil in terms of the
possibility to be exposed to lead (SeeApp.4 ,Tables # 11,12) .
Food pollution
From those 41 persons who had antique pottery,43 %(18persons) cooked food in them .Among
caretakers cooking food in such “ pottery” only 26% ( 5 persons) considered that it was harmful . 35%
of respondents consider that it is harmless and 39% of them do not know anything about this issue
(See App.4,Tables # 13,14,15) .
Caretakers were asked whether the water storage in lead containing reservoirs was harmful .
Only 31% (27) of respondents agreed that the water keeping in lead containing reservoirs was harmful
(See Table # 16) those 46 persons who gave to their children canned products only 25%(12 persons )
thought that canned products contained lead. 37% of caretakers considered that it was harmless and
38% of mothers did not know whether it is harmless or harmful (See Tables #17,18). High rate of
correct answers had question related to the existence of the Crystal plant in Bureghavan. Approximately
70%(59persons) of respondents knew about the Crystal plant in Bureghavan (See App.4, Table#19) .
15

Dust pollution
Women were asked whether they had a family member who worked at the plant . 58%of
caretakers indicated that they had . 37%(18 persons) of respondents who had worker in their family
mentioned that he came home in working clothes (See App.4 Table # 20,21) .21 % of respondents
knew that dust on the object surfaces surrounding them contained lead(See App.4,Table#22) .
Lead poisoning Question about lead poisoning was given in open –ended option . 84% of respondents answered
that they knew “nothing “ about lead poisoning(See Table#23) .In multiple choice questions the
physical and mental symptoms of lead poisoning were listed. 37% of women mentioned mistakenly
“diarrhea” as a physical symptom of lead poisoning- , and only 17% indicated correctly ”anemia”.
Only 7% of caretakers mentioned correctly “ hearing problems “ among mental symptoms of lead
poisoning.
Association between gender and level knowledge . As the convenience sample consisted entirely of women , it was not possible to assess the
hypothesis that there is association between gender and level of knowledge about lead exposure and
lead poisoning (See Appendix 4,Table #27) .
Association between age and level of knowledge . Table shows the women’s knowledge by age categories . 10% of women of age 19 to 26 were
aware about lead poisoning, and 20 % of women of 26 to 35 answered correctly to open-ended question
related to lead poisoning.
The chi2 test showed that knowledge of caretakers was not associated with their age. ( p=0.14)
(See Appendix8 Table (f) .The logistic regression analysis showed that there is no association between
this variable and knowledge of caretakers (p=0.15) (See Appendix7 Table(a) ) .
Association between education and level of knowledge .
No association was found between education of women and their knowledge about lead .The
chi2 test showed no association (p=0.43) (See Appendix8Table (h)) . The logistic regression showed
that the knowledge of caretakers did not increase with being women more educated (p=0.56)
(SeeAppendix7Table (b)).
16

Association between number of children and level of knowledge No association was found between number of children of caretakers and their knowledge about
lead .The chi2 test showed that there is no association . (p=0.55). (SeeAppendix8Table (h))The same
result showed the logistic regression (p=0.55) (SeeAppendix7Table (c)).
Association between monthly expenditure and level of knowledge . Significant association was found with this variable. It was shown that the higher income , the more
likely is that the woman has knew about lead poisoning p=0.001)(SeeAppendix8Table (i))for Pearson
association ). It was estimated that with the raise in income category (from lower to higher) the odds of
knowing about lead poisoning increase by 3.4 (p=0.014 )However , it should be noted that the
confidence intervals for OR=3 ,obtained by logistic regression included 1 (SeeAppendix7Table (d)) .
Table (i). Association between SES(monthly expenditures) and level of knowledge
“Lead poisoning” SES | No Yes | Total
-----------+----------------------+----------
No | 35 4 | 39
Yes | 1 3 | 4
-----------+----------------------+----------
Total | 36 7 | 43
Pearson chi2(1) = 11.1580 Pr = 0.001
Association between presence a family member who worked at the plant
and level of knowledge about of lead .
The chi2 test showed statistically significant difference between two groups of caretakers .(p=
0.004 ) (SeeAppendix8Table (j)).The logistic regression analysis showed that those caretakers who had
family member who worked at the plant had much higher level of knowledge about lead. The odds of
17

having knowledge about lead increase by 13 if caretaker has a family member who worked at the plant.
(p=0.017) (SeeAppendix7Table (e)) . However , it should be noted that the confidence intervals for
OR=13 ,obtained by logistic regression included 1 .
Family member “Lead poisoning”
who worked
at the plant No Yes | Total
-- --------- +----------------------+----------
No | 38 1 | 39
Yes | 36 12 | 48
---------- -+----------------------+----------
Total | 74 13 | 87
Pearson chi2(1) = 8.5219 Pr = 0.004
Discussion
It was supposed at the beginning of the study basing on the literature review that (reference104
l.Sarian ) that male are informed better about lead . Since all respondents were female , so author was
not able to find the correlation between gender of caretakers and their knowledge of lead .
By the author of the study was hypothesized that caretakers of children in Bureghavan of
different age categories will differ in their knowledge of lead . However the results of the study showed
that all respondents were young mothers .It can be concluded on the basis of mothers’ age distribution
(see graph “Age distribution “) . Lack of association between age of caretakers and the level of
knowledge of lead is explained by the fact that all respondents were young women (19 –35 years old).
Older women could probably have more information about lead .
In respect of the education , the difference in the knowledge of women having the different.
educational levels was not found. As a possible reason for not detecting a difference a very small
number of mothers having higher education ( 4 persons) involved in the survey should be considered
As regards to the number of children , the association was not found . It was supposed that increased
number of children would increase the visits of caretakers to the polyclinic, kindergarten and school .
18

School and kindergarten teachers as well as medical personnel could share information about lead
during mothers’ visits to them .However , the results of the study showed that teachers and physicians
also had poor knowledge about lead .
One of the interesting findings of the study is the correlation between SES and the level of
knowledge . It is also supported by statistically significant difference between the two income
categories regarding their knowledge of lead . It was found that the odds of mothers having more
knowledge about lead increases with the increases in income .This finding is difficult to interpret.
Probably, caretakers who belonged to high income group had more access to the different sources of
information about lead .
The study revealed that there is an association between the level of the knowledge and a
presence in the family member who worked at the plant. The association was found due to the Pearson
correlation test and logistic regression . The correlation between presence a family member who worked
at the plant and awareness of other members of family about lead was found in other studies as well (2).
Thus , analysis of the data showed that the overwhelming majority of care-takers of children
from 2 to 6 years old had poor knowledge about the main sources of lead exposure and the main
symptoms of lead poisoning .
Although the Crystal plant does not now function, and pollution of air by lead does not take
place however other sources of pollution such as soil , water, paints , cosmetics , gasoline, antique
pottery continue to be a serious source of lead exposure.
The results of the key interviews showed that school and kindergarten teachers also had not
knowledge about lead .Even medical personnel ( physicians , nurses ) had no sufficient knowledge
about lead .
These facts dictate the necessity for the development and conduction of an educational program for
care-takers of children of 2 to 6 years old living in Bureghavan .
At the same time, during the data collection process it was revealed that medical personnel of
the polyclinic (pediatricians and nurses) carried out their responsibilities very thoroughly : they
complete accurately medical records, call patients to the polyclinic for monthly examinations and visit
their patients at home .So , an educational program for care-takers of children can be conducted through
the polyclinic and its medical personnel . The medical personnel of the polyclinic of Bureghavan can
be involved in the distribution of the educational materials .
Statistical analysis of the study showed that the predominant age of mothers was from 22 till 27
years old .So, if mothers were informed at the school about lead they could not forget received
information during such short period of time before study .
19

The data suggest that the educational program also should involve teachers and students of the
schools in Bureghavan .
Strengths and weaknesses of the study . Weaknesses
• Accuracy of responses There was no control over who actually filled out a
questionnaire . Women could ask other members of the family to fill it out .
• Noncoverage bias. Distribution of self -administered was carried out from 11AM till 16 PM . At
the time almost in all houses were only young women . However ., probably grandmothers also
take care about children of interest besides mothers .We suppose that grandmothers, being older
,could know more about lead pollution .If there is a significant difference between the level of
knowledge mothers who were included in the study and grandmothers who were not included,
the knowledge estimate for the survey can be biased . Although the two grandmothers whose we
surveyed had a low level of knowledge about lead .
• Non-respondents . 87 respondents answered from the 96 .We have no any information about 9
persons , which constitute 9% of the study sample . .The study was conducted during the summer
holidays . We had no opportunity to interview teachers of the school . Only one teacher of the
kindergarten was available
Strengths.
• High response rate of the quantitative study due to the self-administered questionnaires which is
equal to 91%.
• Systematic random sampling which increases the external validity of the study .
• Analysis of the study was done using the “Stata” which gave accurate data and shorten the time of
analysis .
• Key informant interviews were conducted by the same person , the author, which allows to avoid
interviewer bias .
20

Recommendations
Survey results dictate a necessity for the development and conduct of an educational program
for care-takers . Our data also suggest that there is a strongly perceived need for education of school
teachers and physicians and nurses of the polyclinic.
Educational program for caretakers and medical personnel
Location : polyclinic
In the district polyclinic of Bureghavan will be organized an education course for medical personnel and
caretakers .
1.Education course curriculum
1 . Education course curriculum will consist of :
• Video-presentation (10 min)
• Lecture (15 min)
• Discussion (25 min)
Before each lecture will be distributed lecture handouts with relevant topics
2.Distribution of education materials Caretakers who will not be able to attend the lectures will be provided with educational
materials during their regular visits to the polyclinic .Nurses can be involved in the distribution
of the educational materials : brochures and booklets.
Education course curriculum for school and kindergarten teachers .
Statistical analysis of the study showed that the predominant age of mothers was from 22 till
27 years old . So , if mothers were informed at the school about lead they could not forget received
information during such short period of time before study .
Data suggest that educational program also should involve teachers and students of the
schools in Bureghavan .
21

Schools and kindergartens
The following interventions are recommended to be done in the schools and kindergartens :To
organize lectures for school and kindergarten teachers about lead exposure and lead poisoning .To
include into the school curriculum lectures about lead exposure and its adverse health effects. To
provide teachers of the school and kindergarten with relevant educational materials: brochures ,booklets,
handouts , relevant literature .
Rationale : to increases knowledge of caretakers of children at age of interest about lead
exposure and lead poisoning .
Location : schools and kindergarten
In the schools and kindergartens should be conducted health education classes .
A total 4 classes ( 1 class per week ) can be conducted .
Time . Each class will last an hour .
Class structure video- presentation ( 10min)
• lecture about lead(20 min)
• discussion (30min)
Class instructor
Lectures can be conducted by hygienists, toxicologists, residents of Medical institute and
students of Public Health of AUA.
Class materials
• Educational video tapes
• Projector
• Transparencies
• Lecture handouts
Other recommendations
Reduction of lead exposure and lead poisoning requires also other measures which should be
done at the State level , MoH level and community level .
State level 1. Prohibition of the use of lead -based paints for interior and exterior applications , toys , furniture
and household (24) .
2. . Improvement of social conditions that are underlying factors in the exposure( 22).
3. Sanitation or in the extreme cases removal and abatement of lead in decaying buildings (22) .
22

Ministry of Health level
1.To develop a comprehensive manual produced by MoH to guide such companies as Crystal plant ,
Crystal Chandelier plant and Printing plant step –by –step creating a lead poisoning prevention
program .
2. To establish of a national surveillance for children (26), (27) .
4. To develop medical education courses on lead – poisoning screening program (26) .
Community level
1 .Identify mothers in high risk situations (9):
• Live or visit home with dilapidated paint or with recent or ongoing renovation or remodeling
• Have close contact with a person who has an elevated lead level
• Live near Crystal plant or heavy traffic
• Live with someone whose job or hobby involves lead exposure
2 .Determination of lead levels is recommended for children from 2 to 6 years old , women who live in
Bureghavan where there is a high prevalence of increased blood lead levels .
ACKNOWLEDGEMENTS The author is grateful to Dr. Soghikian – advisor of this project for his excellent assistance,
and valuable input in the formulation of this project .
The author also gratefully acknowledges Dr. Thompson for the guidance and feedback of
the project .
23

References
1. Don J. Lofgren.: Dangerous premises ,1989,Ithaca.N.Y.Lead .p .p 115-119.
2.Harrel B ,et al : Surveillance of elevated blood lead levels among adults –United
States,1002,MMWR 41:285,1992 .
3. Saryan L.A., Zenz Carl : Lead and its compounds, “Occupational Medicine”, Third edition ,Mosby,
St.Luis, 1994, page 506-54.
4.Lane RE, et al,: Diagnosis of inorganic lead poisoning : statement ,Br Med J 4:501 ,1968.
5. Hovhannisian H.A., Muradian A.H., Arevshatian S.H. : The Phitoindication of Pollution with Heavy
metals in the city of Yerevan ,Environmental Contamination with Heavy Metals,
Yerevan , 1996 , p.p98-99.
6. Randail C.Baselt : Biological Monitoring Methods for industrial chemicals, Davis C.A, 1980, p.p
159-166.
7. Karakeshishian G.M., Babayan N.R.,.Grigorian K. A : Contamination of soil of Yerevan and its
suburbs with heavy metals , Biological journal of Armenia ,1987,vol. 40 ,p.p 618-6218 .
8. National Environmental Action Plan . Report working group “ Environment and health “, 1-st stage ,
Yerevan , 1997.
9. Lin-FuJS;Modern history of lead poisoning;a century of discovery and rediscovery .In Needleman
HL,editor;Human lead exposure, Boca Raton , 1992, CRC press.
10.Patterson CC: Contaminated and natural lead environments of man ,Arch Environ
Health11:334,1960.
11. Needleman HL,et al :Deficits in physiologic and classroom performance of children with elevated
dentine levels, N Engl J Med 308 :660,1983.
12. Sagatelian A.K., Arakelian S.A.,.Simonian T.S : Contamination with Lead of the Territory of
Yerevan , “Environmental contamination with Heavy Metals , Yerevan , 1996 , p.p98-99.
13. Baker.Ejr, Folland D,Taylor T, et al: Lead poisoning in children of lead workers –home
contamination with industrial dust . , N Engl J Med 296 :260,1977 .
14. Hovhannisyan H. A., Muradian A.H., Arevshatian S.H : Heavy Metals in the Agrocenosis in the city
of Yerevan ,Environmental Contamination with Heavy Metals , Yerevan , 1996, p.p87-88
15. Lester B.Lave and Artur C. Upton(editors) :Toxic chemicals , Health and the Environment1997 ,The
Johns Hopkins University Press.
16. Josef La Don :Occupational Medicine, Appleton and Lange , Norwalk,1990,page 280-326.
17. Edvard G.Carmines , Richard A. Zeller. Reliability and validity assessment . p. 23 Sage
Publications /Beverly Hills / London 1979 ;67: 17 .
24

18. Babayan E. A.,.Kogan V.Y, Ovannisian R.D ,et all : Lead as Hygienic and Ecological problem in
Armenia , Medical Aspects of Consequences Earthquake in Armenia–10 years After (Report of
International Symposium Materials ),Yervan , 1998,p.p244-245
19. Ntiagu JO: Saturnine drugs and medicinal exposure to lead :an historical outline. In Needleman
HL,editor:Human lead exposure.Boca Raton 1992, CRC Press.
20. Europe Ecology commission. Environment for Europe .OUN, New York, Geneva , 1995
21.SBaghrust PA,et al : Environmental exposure to lead and children’ s intelligence at the age of
seven years :the Port Pirie cohort study ,N Eng J .
22.Mahaffey KR: Exposure to lead in childhood : the importance of prevention . N Eng.J Med
327;1308,1992
23.Berk PD ,et al: Hematologic and biochemical studies in a case of lead poisoning , Am J Med
48: 137, 1970.
24.Daines RH , et al: Air levels of lead inside and outside of homes , Ind Med Surg 41:26,1972
25. Declaration about actions on environment protection in Europe . Second Europe conference on
environment and health protection . Helsinki. June 20-22, 1994
26.Beattie AD,et al: Environmental lead pollution in an urban soft - water area , Br Med J 2:491, 1972
27. Appel BR , et al ;Potential lead exposures from lead crystal decanters, Am J Public Health 82
1671,1992.
25

Appendix1
Oral Consent Protocol
Note: the following is to be read by the interviewer to the informant before they participate in the key interview.
My name is Gohar Aleksandrian . I am a student at the American University of Armenia and do research related to knowledge of care-takers of children from 2 to 6 years old about lead exposure and lead poisoning .
Your opinion and personal experience are very important for us . It will help us to develop program which will prevent lead exposure and reduce the adverse health effects on children’ health .
Your name and information you will give will kept private. Your participation is voluntary . You have right to stop or refuse to fill the questionnaire. Do you have any question ? Thank you very much. Let’s begin.
26

Appendix 2.
Semi –structured interviews
Field interview guide
Questions for physicians , nurses , teachers and mothers 1 . How long do you live in Bureghavan ?
2. Do you know that there is a crystal plant in Bureghavan ?
3. Do you work in the crystal plant?
4. What does the crystal plant produce?
5. Is there any thing harmful to children ‘s health in crystal containers?
If “Yes” , what is it ? ( Lead)
If “No “ go to next question .
6.Is it harmful to children when family members come home from the crystal plant in
their working clothes ?
If “Yes, why ? (Contamination of clothes )
If “No “ go to next question .
7. Do you know that exposure to lead causes lead poisoning in children ?
8. Can food or beverages be polluted by lead?
27

Appendix 3.
Self- administered questionnaire
1. What is a lead? (Circle correct answer)
a) medicine
b) paint
c) chemical element
d) DK
2. What of the mentioned items contains lead?
(Circle correct answer)
a)crystal bottle
b)can
c)antique pottery
d)no one of the mentioned
e)all of the mentioned
3. Which of the following actions can be harmful for your children’s health in terms of lead poisoning?
(Circle all appropriate answers)
a)painting or remodeling your house
b)building a brick wall
c)use cosmetics like “surma”
d)no one of the mentioned
e)all of the mentioned
4. Whether the staying of your child in the mentioned places is harmful in terms of lead poisoning?
( circle all appropriate answers )
• smelter
28

• hazardous waste sites
• place where batteries are repaired
• house construction site
• place where cars are abandoned or repaired
is harmful for your child in terms of lead poisoning
Yes No DK
5. Have you ever used “surma” cosmetics?
Yes No DK
6. Does surma contain lead?)
Yes No DK
7. Whether soil is polluted by lead in Bureghavan ?
Yes No DK
8. Whether you have adjacent plot?
Yes No (Skip to Q#11)
9. Do you grow vegetables on it ?
Yes No DK
10. Whether the growing of vegetables on the polluted by lead soil is harmful ?
Yes No DK
11. Does your child play with soil?
Yes No DK
29

12. Can the contamination by lead through hand –mouth way take place while your child plays with
soil?
Yes No DK
13. Have you antique pottery covered with glazes?
Yes No(Skip to Q#15) DK
14.Do you cook in antique pottery?
Yes No DK
15.Whether cooking in such pottery is harmful?
Yes No DK
16 Is the storage of water in lead containing reservoirs harmful
Yes No DK
17.Do you give your child canned products?
Yes No DK
18. Do canned products contain lead?
Yes No DK
19. Do you know that there is Crystal plant in Bureghavan?
Yes No
20. Have you family member who worked at the Crystal plant?
Yes No(Skip to the Question #22)
21. Did he /she come home in his /her working clothes?
Yes No DK
30

22. Does the dust on the object surfaces surrounding you contain lead ?
Yes No DK
23. What do you know about lead poisoning ?
24. What are the physical symptoms of lead poisoning ?
a) anemia
b) diarrhea
c) high temperature
d) cough
25.What are the mental symptoms of lead poisoning?
a) hearing problems
b) irritation
c blindness
d) depression
26. Age
27. Gender
28. Marital status
single married divorced widowed
29.How many children do you have ?
a) 1
b) 2
c) more than 2
30. How many years of education do you have?
a) 8 years
31
b) 10 years
d) technical (11years)
e) higher
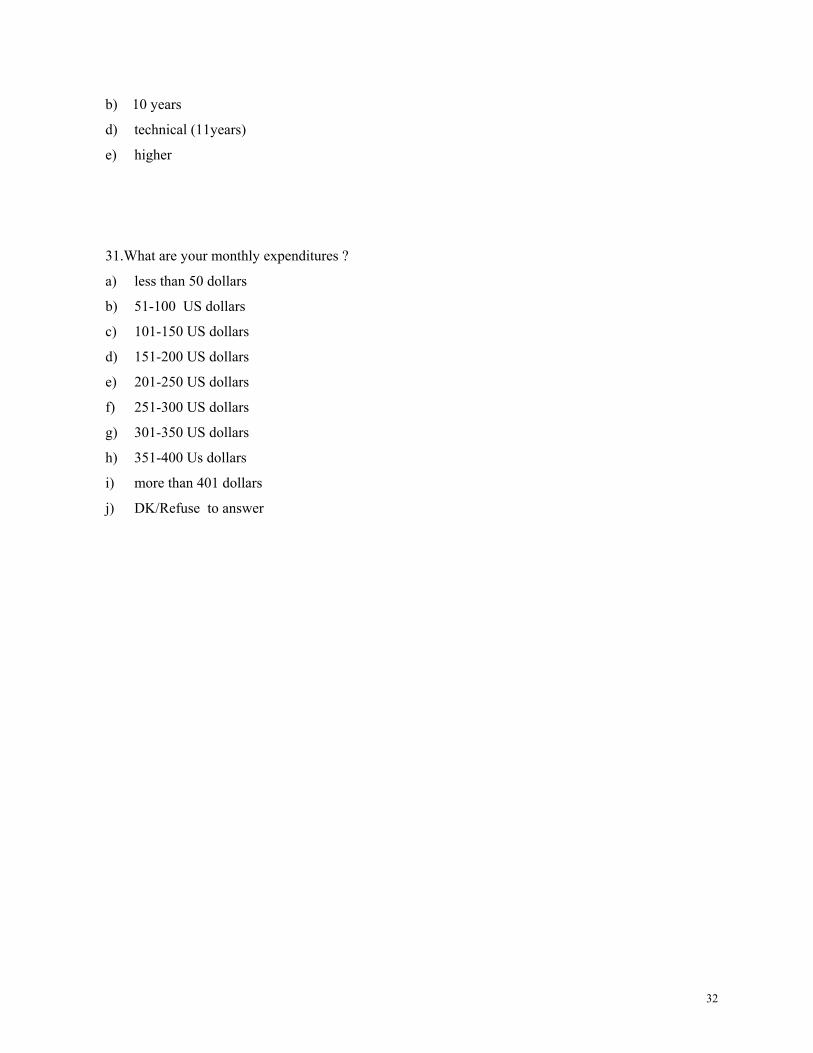
31.What are your monthly expenditures ?
a) less than 50 dollars
b) 51-100 US dollars
c) 101-150 US dollars
d) 151-200 US dollars
e) 201-250 US dollars
f) 251-300 US dollars
g) 301-350 US dollars
h) 351-400 Us dollars
i) more than 401 dollars
j) DK/Refuse to answer
32

Appendix4
Tables of the”Stata” results Table #1
1. What is a lead?
lead Freq. Percent Cum. 1 21 24.14 24.14 2 26 29.89 54.02 3 25 28.74 82.76 99 15 17.24 100.00 Total 87 100.00 Table #2
2. What of the mentioned items contains lead?
Freq. Percent Cum.
1 21 24.14 24.14 2 32 36.78 60.92 3 21 24.14 85.06 4 9 10.34 95.40 5 4 4.60 100.00 Total 87 100.00
Table #3
3. What of the mentioned actions can be harmful for your children in terms of lead poisoning?
Freq. Percent Cum.
1 34 39.08 39.08 2 20 22.99 62.07 3 15 17.24 79.31 4 18 20.69 100.00 Total 87 100.00
Table #4
2. Whether the staying of your child in the mentioned places is harmful in terms of lead poisoning?
Freq . Percent Cum.
1(Yes) 31 35.63 35.63 2(No) 39 44.83 80.46 99(DK) 17 19.54 100.00
33

Total 87 100.00 .
Table #5
5. Have you ever used “surma” cosmetics?
Freq. Percent Cum.
1(Yes) 29 33.33 33.33 2(No) 40 45.98 79.31 99(DK) 18 20.69 100.00 Total 87 100.00 Table #6
6. Does surma contain lead?
Freq Percent Cum.
1 10 35.63 35.63 2 11 37.93 73.56 99 8 26.44 100.00 Total 29 100.00
Table #7
7. Whether soil is polluted by lead in Bureghavan ?
* Freq. Percent Cum.
1(Yes) 27 31.03 31.03 2(No) 38 43.6 74.71 99(DK) 22 25.29 100.00 Total 87 100.00
Table #8
8. Whether you have adjacent plot?
Freq. Percen Cum.
1(Yes) 47 54.02 54.02 2(No) 40 45.98 100.00 Total 87 100.00 Table #9
9. Do you grow vegetables on it?
Freq. Percent Cum.
1(Yes) 22 46.67 46.67
34

2(No) 25 53.33 100.00 Total 47 100.00 Table #10
10. Whether the growing vegetables is harmful ?
Freq. Percent Cum.
1(Yes) 7 33.33 33.33 2(No) 8 32.18 65.52 99(DK) 9 34.48 100.00
Total 22 100.00 Table #11
11. Does your child play with soil?
Freq. Percent Cum.
1(Yes) 64 73.56 73.56 2(No) 16 18.39 91.95 99(D 7 8.05 100.00 Total 87 100.00 Table #12
12. Is possible hand –mouth way of pollution by lead while your child plays with soil?
Freq. Percent Cum.
1(Yes) 26 41.38 41.38 2(No 21 32.18 73.56 99(DK) 17 26.44 100.00 Total 64 100.00 Table #13
13. Whether you have antique pottery covered with glazes?
Freq. Percent Cum.
1(Yes) 41 47.13 47.13 2(No) 46 52.87 100.00 Total 87 100.00 Table #14
14. Do you cook in antique pottery ?
Freq. Percent Cum.
1(Yes) 18 43.24 43.24 2(No) 23 56.76 100.00 Total 41 100.00
35

Table #15
15. Whether the cooking in such pottery is harmful or not ?
Freq. Percent Cum.
1(Yes) 5 26.44 26.44 2(No) 6 34.48 60.92 99(DK) 7 39.08 100.00 Total 18 100.00
Table #16
16. Whether the water storage in lead containing storage is harmful?
Freq. Percent Cum.
1(Yes) 27 31.03 31.03 2(No) 34 39.08 70.11 99(DK) 26 29.89 100.00 Total 87 100.00 Table #17
17. Do you give your child canned products?
Freq. Percent Cum.
1(Yes) 46 52.87 52.87 2(No) 40 45.98 98.85 99(DK) 1 1.15 100.00 Total 87 100.00 Table #18
18. Whether canned products contain lead?
Freq. Percent Cum
1(Yes) 12 25.29 25.29 2(No) 17 36.78 62.07 99(DK) 17 37.93 100.00 Total 46 100.00 Table #19
19. Do you know that there is Crystal plant in Bureghavan?
Freq. Percent Cum.
1(Yes) 59 69.41 69.41 2(No) 26 30.59 100.00 Total 85 100.00 Table #20
Have you family member who worked at the Crystal plant?
36

Freq. Percent Cum.
1(Yes) 50 58.14 58.14 2(No) 36 41.86 100.00 Total 86 100.00 Table #21
21. Does he/she come home in working clothes?
Freq. Percent Cum.
1(Yes) 18 36.54 36.54 2(No) 5 50.00 86.54 99(DK) 7 13.46 100.00 Total 50 100.00 Table #22.
22. Does the dust on the object surfaces surrounding you contain lead ?
l Freq. Percent Cum.
1 18 20.69 20.69 2 33 37.93 58.62 99 36 41.38 100.00 Total 87 100.00 Table #23 23. What do you know about lead poisoning? l.poisng Freq. Percent Cum. I do not know what it causes ,but lead 1 1.15 1.15 I have heard that lead is harmful and 1 1.15 2.30 It is dangerous for health 1 1.15 3.45 as I know it is dangerous for health 1 1.15 4.60 it irritates eyes 1 1.15 5.75 it is harmful for health 1 1.15 6.90 it is harmful 1 1.15 8.05 it looks like general intoxication 1 1.15 9.20 my brother told me it irritates his eye 1 1.15 10.34 my father had headache due to lead as h 1 1.15 11.49 my father in law is bad ,he says due to 1 1.15 12.64 my father was undergone to blood analysis 1 1.15 13.79 nothing 73 83.91 97.70 . Respir pois from soil 1 1.15 98.85 when there is headache , vomiting , 1 1.15 100.00 Total 87 100.00 84% of respondents answered “nothing” Table #24
37

24.What are the physical symptoms of lead poisoning?
Freq . Percent Cum.
1(correct) 15 17.24 17.24 2 32 36.78 54.02 3 19 21.84 75.864 4 21 24.09 100.00 Total 87 100.00 Table #25
25.What are the mental symptoms of lead poisoning?
Freq. Percent Cum.
1 6 6.90 6.90
2 21 24.14 31.03 3 14 16.09 47.13 4 46 52.87 57.47 100.00 100.00 Total 87
Table #26
26. What is your age ?
Freq. Percent Cum.
19 4 4.60 4.60
21 3 3.45 8.05 22 11 12.64 20.69 23 6 6.90 27.59 24 13 14.94 42.53 25 11 12.64 55.17 26 7 8.05 63.22 27 10 11.49 74.71 28 7 8.05 82.76 29 1 1.15 83.91 30 3 3.45 87.36 31 1 1.15 88.51 32 4 4.60 93.10 33 2 2.30 95.40 34 2 2.30 97.70 35 2 2.30 100.00 Total 87 100.00 Age distribution
38

Variable | Obs Mean Std. Dev. Min Max ---------+----------------------------------------------------- age | 87 25.70115 3.748224 19 35 .Age distribution
Fraction
age19 35
0
.344828
From the table and graph we see that the minimal age was 19 years old and the maximal age
was 35 years old The mean age was 25.7 years old .
Table #27
27. Gender
Freq. Percent Cum.
F 87 100.00 100.00
Total 87 100.00 Table #28
28. What is your family status ?
Freq. Percent Cum. 3 (maried) 87 100.00 100.00 Total 87 100.00 Table #29
29. How many children do you have?
39

Freq. Percent Cum.
1(1) 25 29.07 29.07 2(2) 45 52.33 81.40 3(>2) 17 18.60 100.00 Total 87 100.00 Table #30
30. How many years of education have you?
Freq. Percent Cum. 1(8years) 41 47.13 47.13 2(10years) 41 47.13 94.25 3(11years) 4 4.60 98.85 4(Higher) 1 1.15 100.00 Total 87 100.00 Table #31
31. What are your monthly expenditures?
Freq. Percent Cum.
1 38 43.68 43.68
2 28 32.18 75.86 3 4 4.60 80.46 5 1 1.15 81.61 99 16 18.39 100.00 Total 87 100.00
Appendix5
40

Table A. Study method and population
Methods
Type of respondents Place of interview Number of
respondents
Key informant
interviews
Caretakers
Physicians
Nurses
Teacher
Polyclinic
Polyclinic
Polyclinic
Kindergarten
5
2
3
1
Table B. Results of the sampling . Sampling elements
Numbers
Needed sample size 96
Sample interval 4
Respondents left Bureghavan 2
Wrong addresses 3
Absent at home 1
Refused 1
Incorrectly filled questionnaires 2
Completely filled questionnaires(final sample) 87
Appendix6
41

Table C. Social-demographic characteristics of the study population Variables Age(mean ± SD)
26 ± 4
Gender : Male Female
0 87
Level of education (%) 8years 10years 11years University
47
47 5
1
Socio-economic status (%) Low Medium High
44 32 1
Marital status (%) Married Single
100 0
Number of children in the family One Two More than two
29 52 19
A family member who worked at the plant Presence Absence
58 42
Appendix7
42

Logistic Regression
Results
Table(a).Association between age and level of knowledge
------------------------------------------------------------------------------
lpoisng | Odds Ratio Std. Err. z P>|z| [95% Conf. Interval]
---------+--------------------------------------------------------------------
age | 2.430556 1.480825 1.458 0.145 .7363897 8.022383
Table(b). Association between education and level of knowledge
------------------------------------------------------------------------------
lpoisng | Odds Ratio Std. Err. z P>|z| [95% Conf. Interval]
---------+--------------------------------------------------------------------
educ | 1.303246 .5932001 0.582 0.561 .5340521 3.180305
------------------------------------------------------------------------------
Table(c). Association between number of children and level of knowledge
------------------------------------------------------------------------------
lpoisng | Odds Ratio Std. Err. z P>|z| [95% Conf. Interval]
---------+--------------------------------------------------------------------
chnumb | 1.301945 .5740001 0.598 0.550 .5486759 3.089367
Table(d). Association between SES(monthly expenditures) and level of knowledge
43

------------------------------------------------------------------------------
lpoisng | Odds Ratio Std. Err. z P>|z| [95% Conf. Interval]
---------+--------------------------------------------------------------------
mexpend | 3.442677 1.729172 2.461 0.014 1.286348 9.213696
------------------------------------------------------------------------------
Table(e). Association between presence a family member who work at the plant and level
of knowledge
------------------------------------------------------------------------------
lpoisng | Odds Ratio Std. Err. z P>|z| [95% Conf. Interval]
---------+--------------------------------------------------------------------
fmwork | 12.66667 13.50903 2.381 0.017 1.566225 102.4402
------------------------------------------------------------------------------
Appendix8
44

chi2 test Results
Table (f).Association between age and level of knowledge
| “Lead poisoning”
Age | No Yes | Total
-----------+----------------------+----------
>26 | 50 6 | 56
<26 | 24 7 | 31
-----------+----------------------+----------
Total | 74 13 | 87
Pearson chi2(1) = 2.2107 Pr = 0.137
Table (g). Association between education and level of knowledge
“Lead poisoning”
|
Education | No Yes | Total
-----------+----------------------+----------
No | 38 6 | 44
Yes | 4 0 | 4
-----------+----------------------+----------
Total | 42 6 | 48
Pearson chi2(1) = 0.6234 Pr = 0.430
Table (h). Association between number of children and level of knowledge “Lead poisoning”
Number of
children | No Yes | Total
-----------+---------------------- +----------
No | 62 10 | 72
Yes | 12 3 | 15
-----------+---------------------- +----------
Total | 74 13 | 87
Pearson chi2(1) = 0.3648 Pr = 0.546
Table (i). Association between SES(monthly expenditures) and level of knowledge
45

“Lead poisoning” SES | No Yes | Total
-----------+----------------------+----------
No | 35 4 | 39
Yes | 1 3 | 4
-----------+----------------------+----------
Total | 36 7 | 43
Pearson chi2(1) = 11.1580 Pr = 0.001
Table (j). Association between presence a family member who work at the plant and level
knowledge Family member “Lead poisoning”
who worked
at the plant No Yes | Total
-- --------- +----------------------+----------
No | 38 1 | 39
Yes| 36 12 | 48
---------- -+----------------------+----------
Total | 74 13 | 87
Pearson chi2(1) = 8.5219 Pr = 0.004
46