Embed Size (px)
Citation preview

Report No. 32416-MZ
MozambiqueAgricultural Development StrategyStimulating Smallholder Agricultural Growth February 23, 2006
AFTS1Agriculture, Environment, and Social Development Unit Country Department 2Africa Region
______________________________________________________
Document of the World Bank
This document has a restricted distribution and may be used by recipients only in the performance of their official duties. Its contents may not otherwise be disclosed without World Bank authorization.

ii

iii
CURRENCY EQUIVALENTS
Currency Unit = Metical (Mt), plural = MeticaisUS$1.00 = Mt 24,792.3 (exchange rate effective February 22, 2006)
FISCAL YEAR
January 1 to December 31
WEIGHTS AND MEASURES
Metric System
Vice President: Gobind NankaniCountry Director: Michael BaxterSector Manager: Richard ScobeyTask Team Leader: Jeeva Perumalpillai-Essex
iv
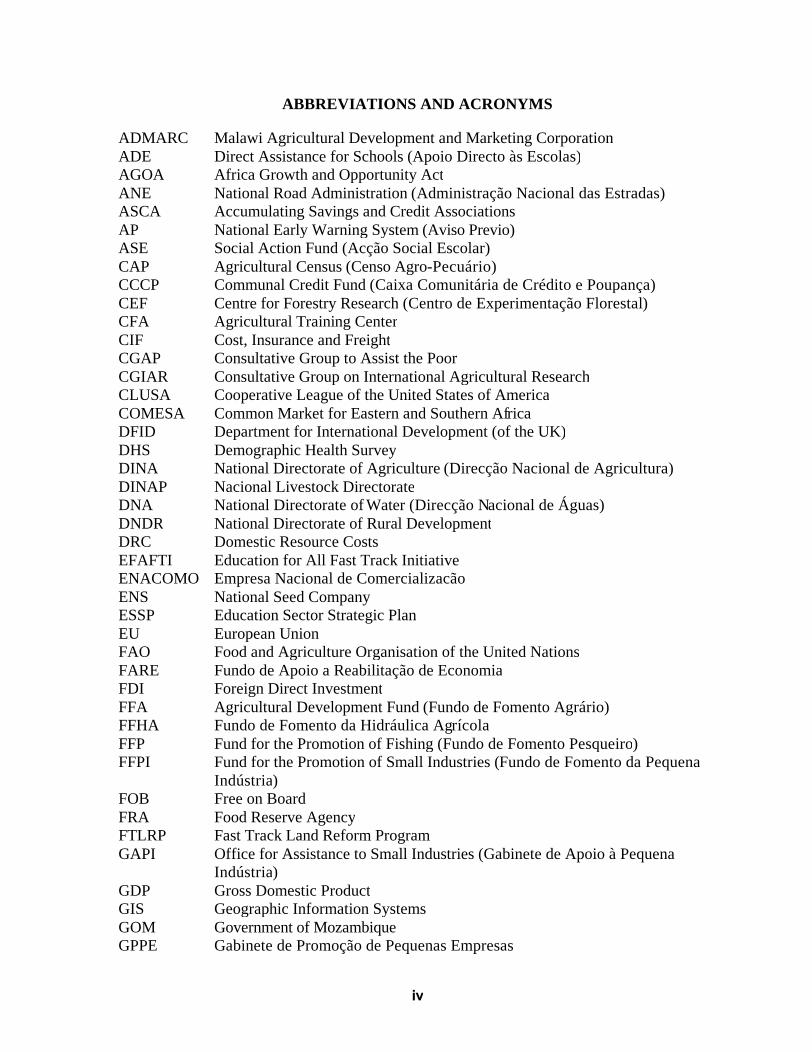
ABBREVIATIONS AND ACRONYMS
ADMARC Malawi Agricultural Development and Marketing CorporationADE Direct Assistance for Schools (Apoio Directo às Escolas)AGOA Africa Growth and Opportunity ActANE National Road Administration (Administração Nacional das Estradas)ASCA Accumulating Savings and Credit AssociationsAP National Early Warning System (Aviso Previo)ASE Social Action Fund (Acção Social Escolar)CAP Agricultural Census (Censo Agro-Pecuário)CCCP Communal Credit Fund (Caixa Comunitária de Crédito e Poupança)CEF Centre for Forestry Research (Centro de Experimentação Florestal)CFA Agricultural Training CenterCIF Cost, Insurance and FreightCGAP Consultative Group to Assist the PoorCGIAR Consultative Group on International Agricultural ResearchCLUSA Cooperative League of the United States of AmericaCOMESA Common Market for Eastern and Southern AfricaDFID Department for International Development (of the UK)DHS Demographic Health SurveyDINA National Directorate of Agriculture (Direcção Nacional de Agricultura)DINAP Nacional Livestock DirectorateDNA National Directorate of Water (Direcção Nacional de Águas)DNDR National Directorate of Rural DevelopmentDRC Domestic Resource CostsEFAFTI Education for All Fast Track Initiative ENACOMO Empresa Nacional de ComercializacãoENS National Seed CompanyESSP Education Sector Strategic PlanEU European UnionFAO Food and Agriculture Organisation of the United NationsFARE Fundo de Apoio a Reabilitação de EconomiaFDI Foreign Direct InvestmentFFA Agricultural Development Fund (Fundo de Fomento Agrário)FFHA Fundo de Fomento da Hidráulica AgrícolaFFP Fund for the Promotion of Fishing (Fundo de Fomento Pesqueiro)FFPI Fund for the Promotion of Small Industries (Fundo de Fomento da Pequena
Indústria)FOB Free on BoardFRA Food Reserve AgencyFTLRP Fast Track Land Reform ProgramGAPI Office for Assistance to Small Industries (Gabinete de Apoio à Pequena
Indústria)GDP Gross Domestic ProductGIS Geographic Information SystemsGOM Government of MozambiqueGPPE Gabinete de Promoção de Pequenas Empresas

v
IAM Mozambique Cotton InstituteIAF National Household Survey (Inquérito ao Agregado Familar sobre
Orçamento Familiar)ICM Mozambique Cereals InstituteICRISAT International Crops Research Institute for the Semi-Arid TropicsIDA International Development AssociationIFAD International Fund for Agricultural DevelopmentIIAM Institute of Agrarian Research of MozambiqueIIVM Mozambican Institute for Vetenary Research INCAJU Institute for the Promotion of Cashew (Instituto de Fomento de Caju)INDER Rural Development InstituteINIA National Agricultural Research Institute (Instituto Nacional de Investigação
Agrária)INIVE National Institute for Veterinarian Research (Instituto Nacional de
Investigação Veterinária)IPA National Institute for Animal Production (Instituto de Produção Animal)IRAM Institut de Recherches et d’Applications de Méthodes de DéveloppementJVC Joint Venture CompaniesKRII Japanese Aid ProgramLOLE Law on Local State Entities (Lei dos Orgãos do Estado)MADER Ministry of Agriculture and Rural Development (Ministério de Agricultura e
Desenvolvimento Rural)MASIP Malawi Agricultural Sector Investment ProgramMINAG Ministry of AgricultureMISAU Ministry of Health (Ministério de Saude)MFI Micro-Finance InstitutionMMF Mozambique Microfinance FacilityMSE Micro and small-sized enterprisesMt MeticaisNDV Newcastle Disease VaccineNHS National Health ServicesNRE Natural Resource ExtractionOECD Organisation for Economic Co-operation and DevelopmentORT Oral Rehydration TherapyPA Prime-agePAAO Plano Anual de Actividades e OrçamentoPARPA Action Plan for the Reduction of Absolute Poverty (Programa de Acção para
a Redução de Pobreza Absoluta)PCR Poupança e Credito RotativoPNS National Seed ProgramPROAGRI Agriculture Sector Public Expenditure ProgramPRSC Poverty Reduction Support CreditRGE Rural Group Enterprise Development ProgrammeRNF Rural Non-farmROCS Roads and Coastal Shipping ProgramsRWSS Rural Water Supply and Sanitation

vi
SADC South African Development CommunitySDC Swiss Agency for Development CorporationSEMOC Sementes de MoçambiqueSIMA Agricultural Market Information SystemSOCREMO Sociedade de Credito de MoçambiqueSPS Sanitary and Phytosanitary StandardsTIA Agricultural household survey (Trabalho de Inquérito Agrícola ao Sector
Familiar)TIP Targeted Input ProgramT&V Training and VisitUEM University of Eduardo MondlaneUNDP United Nations Development ProgrammeWFP United Nations World Food ProgrammeWTO World Trade Organization

vii
ACKNOWLEDGEMENTS
We would like to acknowledge the wide range of inputs, comments and suggestions during the course of this strategy. It was undertaken by a World Bank team to provide strategic guidance for the future development of Mozambique’s agriculture sector.
The strategy was led by Jeeva Perumalpillai-Essex and included Josef Loening, Daniel Liborio da Cruz Sousa, Eduardo da Sousa (AFTS1) and Isabelle Tsakok (consultant). Overall guidance was provided by Michael Baxter, Country Director Mozambique, AFCO2, and Richard Scobey, Sector Manager, AFTS1. Assistance with communication, budget management and arranging of meetings was provided by Caroline Guazzo (AFTS1) and Luísa Matsinhe (AFCO2). Seth Beckerman (consultant) edited the final draft of this document. The strategy benefited from contributions from Peter Moll (AFTP1), Louise Fox (AFTPM), Katleen van den Broeck (AFTPM), Elena Bardasi (AFTPM), Asmara Achcar (WBIHD), Alexander Lotsch (DEC) as well as David Mather, Duncan Boughton, Tom Walker and Rui Benfica (Michigan State University). The background papers were funded by the Belgium Poverty Reduction Partnership, Norwegian and Danish Trust Funds. Peer reviewers were Louise Cord (PRMPR) and Sushma Ganguly (ARD).
The strategy also benefited from valuable comments from the Government of Mozambique and many of the donors in Maputo from the workshop that was held in September 26, 2006.
viii
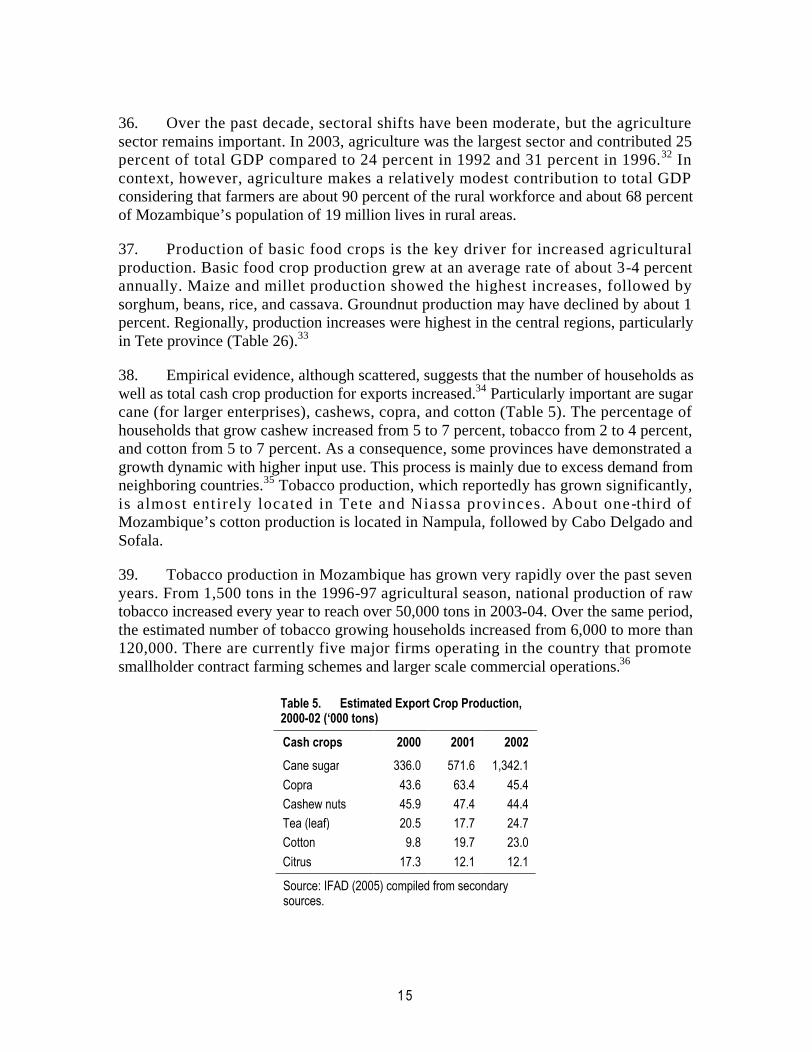
ContentsExecutive Summary......................................................................................................... xiii
Extensive Agricultural Growth Has Reduced Rural Poverty....................................... xiiiFuture Growth Requires Action ................................................................................. xivOverall Conducive Policy Environment .......................................................................xvHigh Costs of Business and Non-transparent Public Expenditures ...............................xvMain Structural Challenges: Infrastructure, Markets, and Institutions ........................ xviAgricultural Strategy: A Two-pronged Approach to Promote Growth....................... xviiSupportive Environment and Reduced Vulnerability: Cross-cutting Issues............... xviiiGovernment, Donors, and Civil Society Need to Think Together............................... xix
1. Past Decade of Agriculture and Poverty in Rural Mozambique .............................. 1Mozambique’s Agricultural Sector ............................................................................... 3
Dominance of Smallholder Agriculture................................................................. 3Livelihood in a Risky Environment ...................................................................... 4Regional Variation of Crop Production................................................................. 5Food Crops, Cash Crops, and Livestock ............................................................... 6Effects of Three Decades of War on Commercial Farming ................................. 11
Determinants of Agricultural Growth.......................................................................... 13Rapid Growth in Agriculture .............................................................................. 13Extensive Cultivation Is the Main Source of Agricultural Growth....................... 16Stagnant Land and Labor Productivity................................................................ 22
Decline of Rural Poverty ............................................................................................ 22Rural Poverty Declined but Remains Widespread............................................... 23Agricultural Growth Is the Main Determinant to Reducing Rural Poverty........... 23Further Determinants of Rural Poverty ............................................................... 25Moderate Increase in Rural Inequality ................................................................ 25
Non-farm Economy and Rural Labor Markets ............................................................ 27Rising Importance of the Non-farm Sector.......................................................... 27Strong Performance of the Rural Non-farm Sector in the North and Center ........ 28Sources of Rural Income Growth........................................................................ 28Determinants of Rural Non-farm Income............................................................ 30
2. Enabling the Rural Environment............................................................................. 35Natural Resource Endowment..................................................................................... 37
Land Abundance and Major Conflicts................................................................. 38Managing Water, Irrigation Investments, and Forest Resources .......................... 39Strong Environmental Regulatory Institutions Are Necessary............................. 40
Macroeconomic Environment..................................................................................... 41Positive Record of Inflation, Trade, and Exchange Rates .................................... 41Significant Weaknesses in Public Expenditures .................................................. 42
Structural Factors and Institutions............................................................................... 46Weak Rural Infrastructure .................................................................................. 46Rural Labor and HIV/AIDS................................................................................ 47Insufficient Use and Adoption of Agricultural Technologies............................... 48Lack of Rural Finance ........................................................................................ 49

ix
Price Policy and Marketing Environment in Agriculture..................................... 50Major Institutional Challenges: Decentralization ................................................ 52
Vulnerability and Risk................................................................................................ 53
3. Strategy to Promote Growth of Smallholder Agriculture....................................... 55Necessary Conditions ................................................................................................. 55
Maintaining a Stable and Supportive Macro and Sector Framework ................... 55Good Governance............................................................................................... 57Control of HIV/AIDS ......................................................................................... 57
Two-pronged Strategy ................................................................................................ 58Priorities for the Food and Cash Crop Sectors: Basic Infrastructure ................... 58Strategy for Growth of Food Crops: Develop Rural Markets............................... 67Other Recommendations..................................................................................... 67Strategy for Growth in Cash Crops: Development of Out-grower/Contract Farming Schemes ............................................................................................................. 70Other recommendations...................................................................................... 71
Recommendations for Cash Crops .............................................................................. 73Sugar and Tea..................................................................................................... 73Cashew Nuts ...................................................................................................... 73Horticulture Crops.............................................................................................. 73Livestock............................................................................................................ 74
Reducing Vulnerability and Risks............................................................................... 75Food Security ............................................................................................................. 76
4. Implementation of the Strategy................................................................................ 77Enabling Environment ................................................................................................ 77
Macroeconomic Framework ............................................................................... 77Rural Infrastructure ............................................................................................ 77Other Rural Services........................................................................................... 78Policies............................................................................................................... 78Agricultural Statistics ......................................................................................... 79Public Expenditures............................................................................................ 79Research and Extension...................................................................................... 79
Institutions.................................................................................................................. 80Rural Producer Organizations............................................................................. 80Local Government.............................................................................................. 80
Role of Private Sector................................................................................................. 81Role of Donors ........................................................................................................... 81
References ........................................................................................................................129
Notes.................................................................................................................................137
Appendices1. Challenges to Measuring Agricultural Production in Mozambique............................. 832. Regression Analyses.................................................................................................. 853. Statistical Tables ....................................................................................................... 914. Agroclimatic Regions and Farming Systems.............................................................. 99

x
5. The Significance of Extension ..................................................................................1036. Effects of Neighboring Countries on Mozambique Agriculture.................................1077. HIV/AIDS and Agriculture.......................................................................................1138. Comparative Advantage of Major Cash Crops in Mozambique.................................1179. Horticultural Export Sector.......................................................................................12310. Public and Donor Sector Initiatives to Develop Rural Finance in Mozambique.........127
FiguresFigure 1. Maize Yields in Mozambique and Neighboring Countries, 1962-03 .................. 2Figure 2. Growth of Agricultural GDP, 1992-03 ............................................................. 14Figure 3. Maize Production, 1993-03 ............................................................................. 14Figure 4. Main Source of Land Acquisition, 2000 ........................................................... 17Figure 5. Impact of Extension on Crop Production by Income Quintile, 2002.................. 21Figure 6. Correlation of Food Crop Production and Poverty ........................................... 26Figure 7. Rural Growth Incidence Curve, 1996-03 .......................................................... 27Figure 8. Rural Household Income Sources, 2002 .......................................................... 31Figure 9. Rural Households Income Sources, 2002 ......................................................... 31Figure 10. Growth of Rural Household Income, 1996-02 ................................................. 32Figure 11. Total and Foreign Investments in Agriculture, 1998-04 ................................... 43Figure 12. Evolution of Crop Yields (from surveys), 1994-03 .......................................... 93Figure 13. Evolution of Mozambique Crop Yields (from Aviso Previo), 1993-01 ............ 93Figure 14. Rural Household Conditions Compared With Previous Year, 2004 .................104Figure 15. Responses to Prime-Age Adult Chronic Illness by Gender, 1999-02................113Figure 16. Responses to Prime-Age Adult Death from Illness by Region, 1999-02...........114
TablesTable 1. Estimated Actual and Potential Crop Yields ....................................................... 2Table 2. Basic Characteristics of the Agriculture Sector, 2000 and 2003 .......................... 4Table 3. Agroecological Conditions and Regional Crop Production Patterns.................... 6Table 4. Livestock in Mozambique, 1994-2003.............................................................. 10Table 5. Estimated Export Crop Production, 2000-02 .................................................... 15Table 6. Average Annual Growth Rates for Land, Labor, and Rainfall, 1993-03 ............ 17Table 7. Condition of Classified Road Network, 1995 to 2000....................................... 18Table 8. Crop Commercialization, 1996 to 2003 ........................................................... 18Table 9. Source of Extension Service by Poverty Quintile, 2002 ................................... 21Table 10. Decomposition of Poverty Change by Sector, 1996-03..................................... 26Table 11. Indices of Rural Inequality, 1996-97 and 2002-03 ............................................ 27Table 12. Rural Employment by Sector and Gender, 1996-97 and 2002-03...................... 29Table 13. Rural Employment by Type of Labor, 1996-97 and 2002-03 ............................ 29Table 14. Relative Consumption of Rural Household Head by Main Activity, 1996-97
and 2002-03 ..................................................................................................... 29Table 15. Relative Consumption of Household Head by Region, 1996-97 and 2002-03 ... 30Table 16. Natural Resource Extraction Activities of Rural Households, 2000 .................. 32

xi
Table 17. A Scorecard for the Enabling Environment in 2005.......................................... 36Table 18. Government Expenditures by Selected Priority Sectors, 1998-04...................... 44Table 19. Proposed Agricultural and Rural Development Strategy................................... 59Table 20. Determinants of Smallholder Maize Production, 1993-01................................. 85Table 21. Determinants of Rural Crop Income, 2002 ....................................................... 86Table 22. Determinants of Rural Self-Employment Income, 2002.................................... 87Table 23. Determinants of Rural Wage Income, 2002 ...................................................... 88Table 24. Determinants of Rural Consumption, 2003....................................................... 89Table 25. Provincial Changes in Crop Production, 1996-02 ............................................ 91Table 26. Rural Poverty Rates by Province, 1996-03 ....................................................... 91Table 27. Mozambique Household Assets, Crop Diversification, and Agricultural Input
Use, 1996-02.................................................................................................... 92Table 28. Key Characteristics of the Mozambique Agricultural Sector, 2000-03.............. 94Table 29. Food Crop Production for Small- and Medium-size Farms by Province, 2003 .. 96Table 30. Cash Crop Production for Small- and Medium-size Farms by Province, 2003 . 96Table 31. Number of Livestock by Province, 2003........................................................... 96Table 32. Sole Crops of Basic Foods, 2000...................................................................... 97Table 33. Unmixed Area by Main Cash Crops, 2000 ....................................................... 97Table 34. Number of Holdings and Unmixed Areas, Selected Horticultural Crops, 2000 . 98Table 35. Main Agroecological Zones and Farming Systems in Mozambique.................100Table 36. Use of Agricultural Techniques by Availability of Extension Advice, 2004.....105Table 37. Summary of Profitability Analysis for Major Cash Crops, 2004-05 .................120
MapsMap 1. Major Food Crops and Rural Poverty in Mozambique, 2003................................. 7Map 2. Major Cash Crops and Rural Poverty in Mozambique, 2003................................. 9Map 3. Cattle Population and Rural Poverty in Mozambique, 2003 ................................ 12Map 4. Rural Poverty Changes in Mozambique, 1996-03 ............................................... 24Map 5. Main Agroclimatic Regions and Agricultural Research Stations, 2002................ 99
BoxesBox 1. Basic Provisions of the 1997 Land Law.............................................................. 38Box 2. Non-tariff Trade Barriers with Neighboring Countries........................................ 42Box 3. Agricultural and Rural Expenditures in Mozambique: Positive but Limited
Impacts............................................................................................................... 45Box 4. Impacts of Extension in Mozambique................................................................. 49Box 5. Why Credit Markets Function Poorly in Mozambique ........................................ 50Box 6. Main Types of Rural Producer Organizations in Mozambique ............................ 54

xii

xiii
Executive Summary
Extensive Agricultural Growth Has Reduced Rural Povertyi. Rural poverty has declined substantially over the last decade as the agriculture sector has shown remarkable improvements. Over 70 percent of the 19 million Mozambicans live in rural areas, with nearly 40 percent in the northern and central regions. The sector is dominated by 3.2 million smallholder families. The majority of smallholders grow food crops, and about 16 percent also participate in cotton and tobacco out-grower schemes. While overall annual agricultural growth has averaged 6 percent, increases in the food and cash crop sectors led to an impressive reduction in rural poverty over the period 1996 to 2003 — the rural poverty headcount decreased from 69 percent in 1996 to 54 percent in 2003. The largest decline was in the central region, followed by the north.
ii. The agriculture sector grew primarily through area expansion and an increase in the labor force, with a large increase in cultivated area in the central region. From 1992 to 2001, cultivated area expanded at 3.3 percent annually. The labor force grew at about 1.7 percent annually, which approximates rural population growth of 1.9 percent. After the 1992 peace accords, the increased rural labor force was primarily returned migrants. Basic food crop production was the key driver for growth, but cash crop production was
Key Messages of Mozambique’s Agricultural Development Strategy
Extensive agricultural growth has been the key factor in reducing rural poverty, however, current patterns of growth are unsustainable and future growth requires close attention.
Poor rural infrastructure and markets are major constraints for agricultural growth, thus for food crops, the strategy highlights the importance of rural markets.
For cash crops, the strategy emphasizes promotion of contract farming arrangements.
For both food and cash crops, this strategy focuses on crops that are among the most important and for which data or background analysis was readily available.
Basic infrastructure, such as rural roads and irrigation, and a number of factors related to the enabling environment, including malaria and HIV/AIDS, are important cross-cutting issues.
While the overall policy environment is considered to be more or less conducive to growth, the overall business environment, transparency of public expenditures, and donor coordination in the rural sector should be improved.
Finally, attention should be given to better monitor and evaluate the impact of agricultural and rural investments. In this regard, there is a need to significantly improve the statistical system of the sector.
This strategy is intended to cover a time horizon of five years, and is largely based on a synthesis of existing literature.
xiv
also important and is promoted mainly through out-grower schemes in northern and central Mozambique. However, access to and use of improved crop technologies remains limited, crop yields are stagnant, and thus rural incomes are also likely to stagnate. Other important findings include:
Extension significantly affects crop production but farmer education level does not affect adoption of technology nor income. Extension services have limited coverage but where such services are available, farmer income from crops has risen by 8 percent. Extension services provided by NGOs are more effective, however, public extension systems better address the rural poor. Extension messages have focused on use of improved seed and planting techniques. Educational level does not seem to significantly affect agricultural production —on average, one additional year of schooling is associated with only 1.9 percent increase in crop income.
There is evidence that crop diversification is a coping mechanism. From 1995 to 2003, the mean number of crops almost doubled from five to nine per household across all income groups, especially with food crops. This is not surprising where smallholders practice rainfed agriculture. Crop diversification does not seem to have affected income, however, which may be an issue of quality and quantity at the farm household level.
Market integration and cross-border trade are becoming crucial. With the improved infrastructure since peace was established, markets are more integrated and prices are more stable. There is increased cross-border trade with Malawi, Zambia, and Zimbabwe, with estimated total informal trade in maize over 100,000 tons. Mozambique supplies more than 90 percent of the trade to Malawi. There is increasing evidence that other food grain crops, such as sorghum and beans, are also traded.
The effects from neighboring countries are positive and important. Because north-south infrastructure is underdeveloped, a large part of trade is east-west. Zimbabwean farmers grow tobacco and other high-value export crops across the border in Mozambique as a result of the tumultuous political situation in their own country. Heavily subsidized inputs from Malawi and Zambia also find their way to Mozambique. The land-locked countries are also heavily dependent on Mozambican ports, hence the country earns substantial sums from the transit of freight.
Future Growth Requires Actioniii. The current sources of agricultural growth are not sustainable. Without close attention to the use and adoption of improved agricultural technologies, production growth may slow and rural poverty will remain widespread. Over the past decade, improved agricultural technologies have played only a minor role. For example, smallholder households that use fertilizer, animal traction, or small-scale irrigation increased to about 7 percent from a low of 4 percent. A limited number of smallholders use drought-resistant varieties or have access to improved seeds. The highest- and the lowest-income quintiles were more likely to adopt new technologies compared to middle-

xv
income groups. Among determinants of crop income, use of improved technologies, especially fertilizer, significantly affects income.
iv. Although constraints exist, Mozambique possesses the fundamentals to realize its considerable agricultural potential. The country is endowed with natural resources, including numerous fertile agroecological zones, but only about 10 percent of its 36 million arable hectares are cultivated. Mozambique has 104 river basins, 20 million hectares of forests, and a long coast line with three major ports. The current government is committed to rural growth and development, however, the potential can only be achieved through public-private partnerships in which the Government provides an enabling environment and the private sector assumes the risks and reaches out to rural areas.
Overall Conducive Policy Environmentv. The enabling macroeconomic environment is generally positive but with some constraining factors. Since the 1992 peace agreement the country has maintained positive macroeconomic growth, with an annual growth exceeding 9 percent since 1997. Mozambique has been supported by substantial foreign aid that contributes 15 percent of GDP, compared to the African average of 4 percent of GDP. Inflation has been reduced to single digits from a high of about 70 percent in the mid-1990s. A key constraint to investments, however, is the high cost of capital, with an average lending rate over 30 percent and credit for smallholders almost non-existent.
vi. Conditions are suitable to expand trade. The exchange rate is a managed float and hence there is no evidence that it is overvalued and works against exports. Additionally, the trade framework has been more liberal since the early 1990s, and Mozambique is working closely with SADC on free trade agreements. The trade-weighted average tariff is 9 percent, one of the lowest in the continent. Agriculture inputs such as fertilizer and agrochemicals, are not subject to any tariff.
High Costs of Business and Non-transparent Public Expendituresvii. The high cost of business development negatively affects private sector investments. Although the macro framework is positive, doing business in the country is a major challenge. Not only are procedures cumbersome, it also takes valuable time to obtain licenses and navigate other processes. Corruption and informal payments to government officials are cited as major deterrents, and in addition, the judicial system is not conducive to settling disputes fairly and quickly. Labor laws are also archaic and require modernization — hiring and firing processes are drawn out and it is not easy to hire foreign workers.
viii. Spending in the social sector has increased. About 65 percent of the budget is allocated to lending in the education, health, agriculture, water supply, and sanitation sectors, of which 50 percent is for education and health. Enrollment in primary education has increased, but retention is an issue, perhaps because of quality and capacity of the

xvi
teaching staff. Health indicators have improved but there is still much progress to be made — malaria and HIV (prevalence rate of 13 percent) are major problems, nearly 50 percent of rural children are malnourished, and as with the education sector, distance and poor infrastructure are major constraints to accessing services.
ix. The total annual budget for the agriculture sector is only about 4 percent of the total national budget, a problem that is compounded because funds are not provided on time or at critical times during the growing season. Fifty percent of agriculture expenditures are off-budget, hence it is difficult to assess efficacy of various activities. The total invested in rural areas from other sectors is not known because expenditures are not disaggregated. The Mozambican economy continues to be centralized with funds disbursed from central ministries.
Main Structural Challenges: Infrastructure, Markets, and Institutionsx. Constraints to agricultural growth are numerous. The 17-year conflict destroyed the basic infrastructure and institutions that were created during the colonial period. Rebuilding roads and bridges is now a priority and a necessary condition for any growth in the agriculture sector. The vast terrain and scattered and sparse population makes it all the more critical to ensure rural connectivity, but per capita investment costs are considerable and would have to be borne by the Government. The dismantling of state-owned organizations that provided agricultural inputs and bought and marketed production has created a vacuum. In its infancy, the private sector has yet to find it cost effective and profitable to reach out to rural areas.
Poor roads and markets and unexploited irrigation potential are key constraints to agricultural development. Despite recent investments in roads, the density of the road network is the lowest in southern Africa (32 kilometers per square kilometer), which to some extent is due the size of the country and difficulty in building and maintaining roads. With a sparse population, the unit costs of serving rural areas are high. Although building roads is essential for rural development, a major concern is the positive correlation between transport routes and transmission and prevalence of HIV/AIDS. Other key infrastructure such as power and telecommunications are also very poorly developed, especially in rural areas, as is irrigation, another key factor for agriculture. Total irrigated area is only about 3 percent of its potential.
Institutions in Mozambique are weak, lack capacity, and were largely shaped by its history. The war, colonialism, and socialism dictated the types of institutions and their thinking — during the socialist era, colonial farms became state farms, parastatals were established to supply inputs and market outputs, and smallholders were considered constraints to modernizing agriculture. Today, the Ministry of Agriculture formulates policies and regulations, and the private sector supplies inputs and markets. A major issue for many public sector entities is the lack of trained personnel. Colonial Mozambique did not train an adequate number of people and after the war many who were trained left the country. Today this deficit is a major constraint so that the country continues to rely on outside
xvii
technical assistance. Additionally, low salaries in government departments do not attract and retain skilled and qualified staff.
Agricultural Strategy: A Two-pronged Approach to Promote Growthxi. A boost to the agricultural economy is critical to ensure growth of the rural sector. Any strategy must promote sustained production and productivity for smallholders who depend on agriculture, thus improving their livelihood and reducing vulnerability and risk. The transformation of agriculture from low-productivity subsistence to high-productivity commercial is long-term, and the current strategy involves short-term activities to lay a foundation for a long-term transformation. Such growth should be highly productive and environmentally sustainable, along with strengthening the cash crop sector by promotion of out-grower schemes.
xii. A two-pronged strategy is required in the agriculture sector to promote growth in the rural sector. Given the subsistence nature of smallholder agriculture and emerging out-grower schemes, two elements are required. For the smallholder whose efforts produce food grains and other products for the domestic market, enhancing productivity is critical. For the growing number of smallholders who participate in out-grower schemes, strengthening their power to bargain for better farm-gate prices and improve industries that add value are essential.
The food crop sector currently dominates and will for years in the future. Yield increases are required through the use of improved seed and other inputs such as fertilizer and irrigation. Public sector activities such as research and extension services must be demand-driven and reach out to farmers. Given that most farmers are women, extension staff should reach out to this group and ensure that appropriate technology is gender-oriented.
The cash crop sector, already an important source of income growth, has substantial potential. Depending on the crop, there is a need to develop expertise and mechanisms to balance the interests of out-growers, companies, and the institutional environment. For example, out-growers need fair prices, companies do not want to be undermined by side-selling, and both groups need the results of research and extension to keep a competitive edge. Farmers need to organize into producer organizations so that they have the power to negotiate with companies. Companies need to feel the confidence to invest, and it is important that competitors with very short-term agendas do not undermine their efforts. Side selling is a major issue, and building a long-term relationship will need additional efforts.
Cashew, an important smallholder cash crop, needs to be revitalized. Given the age and diseased nature of most trees, structural characteristics of domestic and foreign markets, and the past controversial liberalization, experience should be reviewed. Replanting is important and farmers need the power to negotiate prices with processors and export marketers.
Horticultural exports have been a major source of export-led growth in many developing countries, and Mozambique has the potential for further

xviii
development of this sector. Especially in the central region, there are opportunities to cultivate high-value vegetable crops and flowers for export to Europe. Zimbabwe farmers are already investing in Mozambique because of the political situation in their own country. The public sector can support such endeavors to develop the quality standards required for higher income markets. There is also a need for a better marketing infrastructure essential to integrate smallholders in this high-value chain.
Productivity of the livestock sector is undermined by disease, high mortality, and inadequate feed. One essential support element is to deliver more widespread extension services, including those addressed specifically to women who tend small livestock and men who tend cattle. Currently they are neglected by an extension system that assists only cattle owners. As with crop cultivation, different types of livestock are demarcated along gender lines.
Supportive Environment and Reduced Vulnerability: Cross-cutting Issuesxiii. One necessary condition is that the overall macroeconomic framework and other sectoral investments must remain stable, including reducing the fiscal deficit and controlling inflation. Greater accountability and transparency to reduce corruption are critical to improving the business environment. Although education does not seem to be highly correlated with increasing agricultural income at a subsistence level, as the sector becomes more sophisticated, the capacity of farmers to absorb new technologies becomes important. Similarly, the health system must respond to the needs of poor smallholders, especially in dealing with HIV/AIDS. A short-term agricultural strategy that would build on the Government’s PROAGRI II strategy should include these cross-cutting elements:
BASIC INFRASTRUCTURE DEVELOPMENT. Any development of the agriculture sector requires development of good roads. The current cost of transportation is a major constraint. Additionally, markets need to include storage facilities and function well. This will also increase participation by the private sector in the rural economy.
EXPANDED USE OF IRRIGATION. Irrigation helps to diversify income and reduce risk. In addition to improving management of existing irrigation infrastructure, new irrigation systems for smallholders — from small dams to groundwater —will mitigate vulnerability from unpredictable rainfall. Irrigation infrastructure must be considered as a public good given that investments are high.
IMPROVED MANAGEMENT OF PUBLIC EXPENDITURES. As the Government embarks on a medium-term financial framework, one critical aspect is to include all expenditures in rural areas within the budgeting framework. This requires that all off-budget expenditures be identified and brought into the budget system.
PROMOTION OF A GOOD BUSINESS ENVIRONMENT. Such promotion requires (i) reducing corruption, (ii) reducing the cost to register a business, (iii) facilitating dispute settlement mechanisms, (iv) easing the application of regulations, (v) expediting payment of refunds by the Government, (vi) maintaining flexible labor regulations, and (vii) facilitating access to land.

xix
xiv. Reducing vulnerability and risks requires diversifying income sources from primary agriculture to wage income in rural non-farm areas. Such diversification includes improving the flexibility of labor markets, developing marketing infrastructure, improving market access, and improving the business environment through good governance. Reducing vulnerability also requires helping to curb the HIV/AIDS epidemic. Households need practical help to deal with labor shortages and nutritional deficiencies. A multisectoral approach to counter this epidemic is urgently needed.
xv. Food security is still a concern for rural households given Mozambique’s vulnerability to the vagaries of climate. The Government should continue to ensure that its food aid policy does not undermine domestic production incentives while instituting monitoring mechanisms that enable it and donors to respond quickly during emergencies.
Government, Donors, and Civil Society Need to Think Togetherxvi. Coordination requires multiple stakeholders — the Government, beneficiaries, the private sector, NGOs, and donors. Because unit investment costs are high to develop infrastructure, it is appropriate for the public sector to provide such services, including roads, railways, and surface irrigation facilities. The private sector should sell inputs and buy outputs. One deterrent for the private sector to be actively involved in selling inputs is that transaction costs are high to reach all farmers. Input distribution and produce marketing costs would be lower if farmers organized into rural producer organizations so they can participate in bulk buying and group marketing schemes.
THE GOVERNMENT NEEDS TO BE CLOSER TO THE PEOPLE. Given that the country is so large, decentralization becomes an important objective. The Government is committed to a decentralization framework and is working toward it, however, the strategy is still at a nascent stage. Together with strengthening government at the provincial and district levels it is important to empower communities and community-based organizations so they ensure that local governments are accountable and transparent.
CIVIL SOCIETY AND NGOs ARE IMPORTANT STAKEHOLDERS. To ensure that services are delivered to grassroots smallholders, civil society and NGOs must be closely
Limits of this Strategy
The fiscal implications of this strategy are not addressed. Such an analysis is beyond the scope of the document and would require more transparent documentation of public expenditures in the agriculture sector.
Natural resource management is only partially addressed because it is already included in the 2005 CEM (World Bank, 2005e) and its background papers.
Labor is obviously a vital issue in an agricultural development strategy, and the health of the population is a major component of that issue. Malaria is a key problem in the Mozambican health sector, and many believe it is a larger threat to rural health than HIV/AIDS. In this strategy, however, malaria is only partially addressed because the Bank expects to tackle this disease in the upcoming Country Assistance Strategy (CAS).
xx
aligned with agricultural development programs. At the district and provincial levels they should be involved in identifying and planning development programs. Government administration cannot be everywhere and hence in such a large country it is all the more important for these organizations to be involved. Local NGOs need to be strengthened so that when international organizations depart the capacity exists to mobilize communities, ensure that people are heard, and hold the Government accountable.
CURRENT DONOR PROGRAMS ARE NOT WELL COORDINATED. For the agriculture sector, the Ministry of Agriculture must inventory all activities and establish how and in what way donor programs complement its own programs. Additionally, the donor community must play an important role in providing long-term financing to the public sector. The stability of donor support is also an important factor.
DONORS NEED TO ENSURE FUNDING. Given that the Mozambican budget is funded primarily by external resources, the donor role is critical. Donors need to think together — not so much for their own interests as much as for the interests of the country. Programs should be jointly developed with the Government and communities, and should not compete with other donors. A truly empowered Government is one that can tell donors what it wants financed and where it wants the money to be invested with “government in the driver’s seat.”
1
1. Past Decade of Agriculture and Poverty in Rural Mozambique
1. Mozambique’s agricultural sector has shown remarkable progress in the recent past, with rural poverty declining by 16 percentage points from 1996-97 to 2002-03. Increased smallholder agricultural production was a fundamental part of this impressive achievement, and rural inequality increased only slightly because the decline in poverty was broad-based. The non-farm economy* also performed strongly, including small businesses and increased self-employment related to extracting natural resources, as well as increased wage labor opportunities. These factors contributed to reducing rural poverty for the upper income quintiles, however, despite substantial growth of the agricultural and rural non-farm sectors, poverty remains widespread.
2. Current patterns of agricultural growth are not sustainable and rural incomes face a substantial risk of stagnating. Over the past decade, agricultural growth was almost entirely driven by farming more land with a larger rural labor force, with few technological improvements. Improved agricultural technologies played only a minor role. Access to and use of improved crop technologies remains very limited, and there is evidence that crop yields are stagnant. If appropriate action is not taken, agricultural growth will slow and rural poverty will remain widespread.
3. In the medium term, incomes can only improve with higher land and labor productivity, and future growth particularly depends on adaptation of new agricultural technologies. These include more and better extension services; adoption of best practices; introduction of new seed varieties, increased use of fertilizer, animal traction, and irrigation; and construction of more roads. Development input and output markets are critical because farmers have little incentive to improve yields if they cannot sell what they produce. In the non-farm sectors, primary education and measures to increase labor market access for women are important, as well as establishing marketing links to the local economy and neighboring countries. Finally, adoption of higher-value crops is crucial.
*In this strategy, rural non-farm activities occur outside of owner-operated farms. The non-farm sector thus includes wage labor on farms. Agriculture includes all primary production of food and cash crops, however, it excludes food processing, agricultural services, and other primary sectors such as mining or quarrying although they may take place on the farm.
2
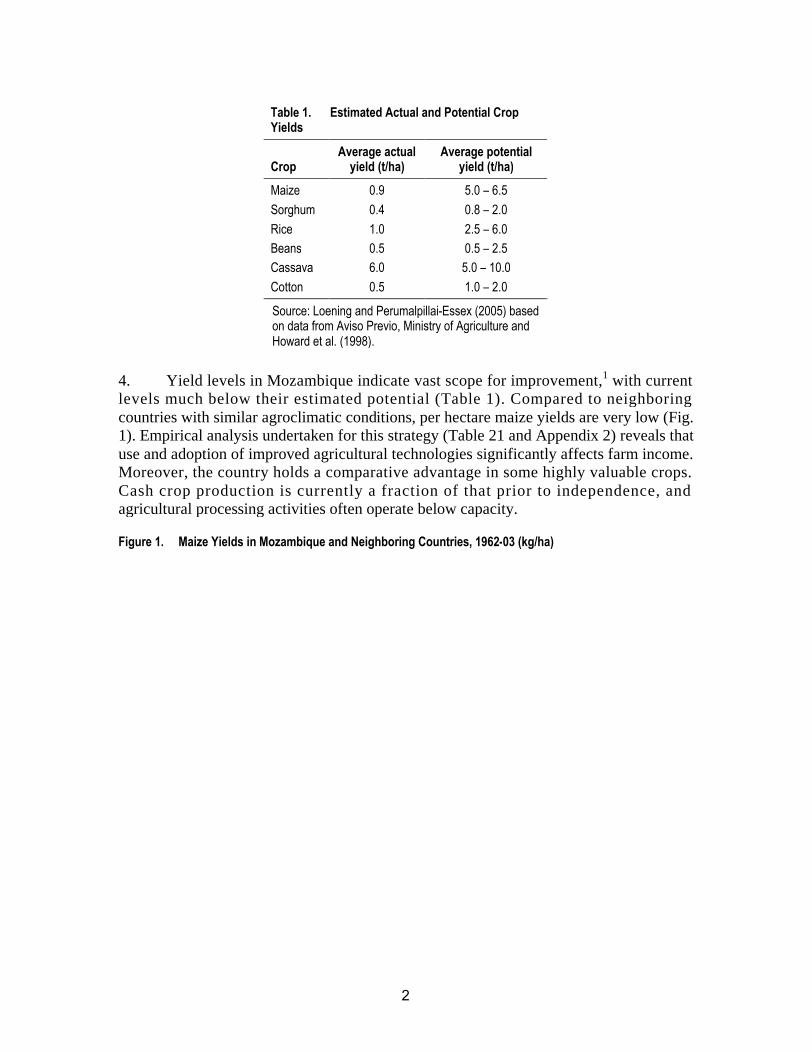
Table 1. Estimated Actual and Potential Crop Yields
CropAverage actual
yield (t/ha)Average potential
yield (t/ha)Maize 0.9 5.0 – 6.5Sorghum 0.4 0.8 – 2.0Rice 1.0 2.5 – 6.0Beans 0.5 0.5 – 2.5Cassava 6.0 5.0 – 10.0Cotton 0.5 1.0 – 2.0
Source: Loening and Perumalpillai-Essex (2005) based on data from Aviso Previo, Ministry of Agriculture and Howard et al. (1998).
4. Yield levels in Mozambique indicate vast scope for improvement,1 with current levels much below their estimated potential (Table 1). Compared to neighboring countries with similar agroclimatic conditions, per hectare maize yields are very low (Fig. 1). Empirical analysis undertaken for this strategy (Table 21 and Appendix 2) reveals that use and adoption of improved agricultural technologies significantly affects farm income. Moreover, the country holds a comparative advantage in some highly valuable crops. Cash crop production is currently a fraction of that prior to independence, and agricultural processing activities often operate below capacity.
Figure 1. Maize Yields in Mozambique and Neighboring Countries, 1962-03 (kg/ha)
0
500
1000
1500
2000
2500
62 64 66 68 70 72 74 76 78 80 82 84 86 88 90 92 94 96 98 '00 '02
Mozambique Zambia Malawi Tanzania Zimbabwe
Source: Loening and Perumalpillai-Essex (2005) based on FAOSTAT, three-year moving averages

3
5. Only about 4.5 million of 36 million hectares of potentially arable land are cultivated. The country has considerable untapped opportunities for irrigation, with only 14 percent of a potential 3.3 million hectares irrigated. In addition, major river systems remain largely unexploited (for example, the Zambézi, Save, and Limpono systems).
6. Mozambique benefits from its location and neighbors. With a long coastline and three major ports, the country provides shipping services to the land-locked countries of Malawi, Zambia, and Zimbabwe. Informal cross-border trade between Mozambique and its neighbors enables farmers to take advantage of input and output markets in other countries, and mobility across borders is already important. For example, labor currently migrates from Malawi to Mozambique to help sustain growth in the tobacco sector. Likewise, due to the political situation in their country, a number of Zimbabwe farmers cultivate tobacco and other high-value crops in Mozambique.
7. This chapter describes the factors behind agricultural growth and the decline of rural poverty over the past decade. In addition, it analyzes the constraints facing smallholder agriculture and rural non-farm employment, provides a snapshot of the agricultural sector, analyzes the determinants of agricultural growth, discusses the determinants of the decline in rural poverty, and briefly examines the non-farm sector and labor markets in rural Mozambique.
Mozambique’s Agr icul tural Sector8. Agriculture in Mozambique is dominated by smallholders who farm in a risky environment that is vulnerable to droughts and floods, with 15 over the last 25 years. Crop production varies by region, with large differences in rainfall, temperature, soil types, and market access. Farming in Mozambique was dramatically affected by three decades of war.
Dominance of Smallholder Agriculture
9. Agriculture in Mozambique is almost entirely dominated by smallholders. The agricultural economy is a major source of livelihood, and food represents about two-thirds of total consumption, especially among the rural poor. An estimated 68 percent or about 12.5 million people live in rural areas. Rural households are predominantly smallholders who provide about 95 percent of agricultural GDP with the balance from a small number of medium and large commercial farms.2 Average cultivated area per household is only about 1.4 hectares. In 2003, there were an estimated 3.2 million farm families cultivating some 4.5 million hectares (Table 2). Medium- and large-scale farmers are almost insignificant in terms of land area and numbers of farms.3 Two-thirds of agricultural production is for home consumption and only 5 percent is generated by large-scale agriculture. Most of the agricultural land area for small (less than 10 hectares) and medium farms (10-50 hectares) is cultivated for basic food crops. By contrast, large farm enterprises (more than 50 hectares) produce mostly cash-crops.
10. Landless wage earners are often women and are among the poorest. Seasonal and casual farm laborers are also often women and from some of the poorest rural households. As in much of Sub-Saharan Africa, these female-headed households tend to
4
be more disadvantaged than the average rural household in terms of access to productive assets and education. Anecdotal evidence suggests that many must rely entirely on their meager wage income because they do not receive remittances from male members of the household. Because of the protracted wars, women were 53 percent of the population in 1997, the year of the latest population census, compared to 51 percent in 1981. Also, in rural areas women tend to work predominantly in the agriculture sector and are about two-thirds of the total agricultural labor force.4 Although in 2003 about 23 percent of rural households were headed by females, it should be noted that landless labor in Mozambique is somewhat rare. It is the combination of a lack of productive factors and human capital that makes land-constrained rural households among the poorest.
11. Migration has been an important feature of rural life. Migration in rural Mozambique has different patterns: rural-rural, rural-urban, and from Mozambique to its neighbors (in particular, the male out-migration to South Africa). In its tumultuous past during the protracted wars of independence (until 1975) and the subsequent civil war (until 1992), the rural population migrated significantly. The exact magnitude of rural migration flows are poorly documented. During the civil war, an estimated 1.5 million people left Mozambique, while some 4 million moved internally. Migrants typically moved to more secure rural areas and to urban or peri-urban areas. To this point more than 1 million refugees have returned,5 which has enormous implications for agricultural land use. Also, the promotion of communal production has affected population settlements and agricultural land use.
Livelihood in a Risky Environment
12. Mozambique is highly vulnerable to droughts and floods, with a total of 15 over the last 25 years. These events greatly affected the rural sector and the country’s overall economy. For example, the major floods of 2000 led to an abrupt fall of agricultural GDP and affected some 2 million people. Similarly, the regional droughts of 1994 and 1996 slowed total agricultural GDP growth and affected some 1.5 million people in the southern and central parts of the country, and were then followed by a cholera epidemic.6
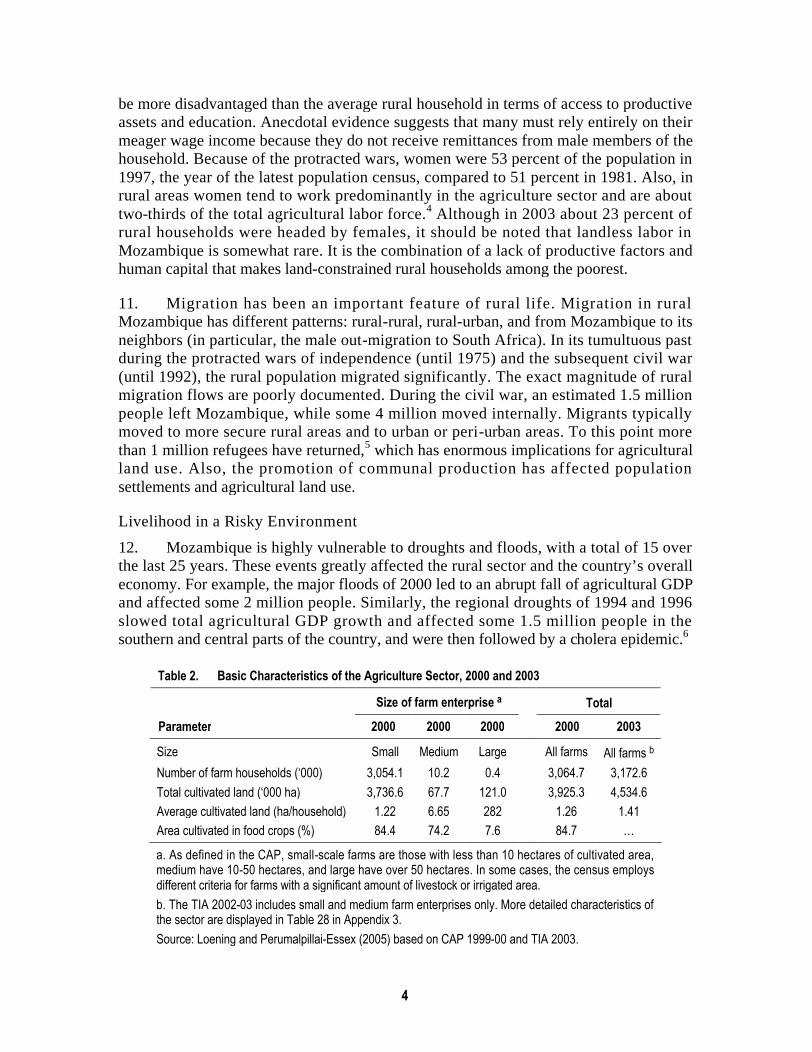
Table 2. Basic Characteristics of the Agriculture Sector, 2000 and 2003
Size of farm enterprise a TotalParameter 2000 2000 2000 2000 2003
Size Small Medium Large All farms All farms b
Number of farm households (‘000) 3,054.1 10.2 0.4 3,064.7 3,172.6Total cultivated land (‘000 ha) 3,736.6 67.7 121.0 3,925.3 4,534.6Average cultivated land (ha/household) 1.22 6.65 282 1.26 1.41Area cultivated in food crops (%) 84.4 74.2 7.6 84.7 …
a. As defined in the CAP, small-scale farms are those with less than 10 hectares of cultivated area, medium have 10-50 hectares, and large have over 50 hectares. In some cases, the census employs different criteria for farms with a significant amount of livestock or irrigated area. b. The TIA 2002-03 includes small and medium farm enterprises only. More detailed characteristics of the sector are displayed in Table 28 in Appendix 3.Source: Loening and Perumalpillai-Essex (2005) based on CAP 1999-00 and TIA 2003.
5
13. Low productivity agriculture provides a precarious livelihood. The smallholder sector in Mozambique is characterized by holdings of multiple small plots, multiple crops, low input use, and low productivity. Average crop yields (Table 1)are about one-half of the regional average.7 Smallholders have limited access to capital, little schooling, are at the mercy of highly variable rainfall, and suffer seasonal price risks. Farms typically use manual cultivation techniques and little or no purchased inputs. In 2003, only about 4 percent of farmers used chemical fertilizers and only about 5 percent used pesticides. The use of chemical inputs is generally concentrated among cash crop growers. Only about 11 percent of households use some form of irrigation.8
14. Food crop production is Mozambique’s most important agriculture sub-sector. Most rural households diversify to cope with low productivity and income, and smallholders are poorly integrated with markets. The majority practice extensive shifting cultivation, only about one-third sell any crop output, and almost two-thirds live in households that lack food security. The most important food crops are cassava and maize, followed by sorghum and rice. Cassava is an important component of the smallholder’s risk reduction strategy in the context of Mozambique’s variable climate because it is drought tolerant and resistant to disease.9 For the most part, food crop producers use seeds reserved from the previous year’s crop. About 82 percent of rural households identify seed supply as their predominant agricultural problem.10
15. Smallholders do, however, contribute to the production of export crops, particularly cashew, cotton, and tobacco. An estimated 16 percent of rural households engage in cash crop production. These smallholders are contracted by larger firms under out-grower schemes. Contracting arrangements are one way to overcome the failure of input and credit markets. These arrangements allow farmers to access extension advice, inputs, and credit, but oblige them to sell their output to the input provider . As a consequence, the number of farmers growing tobacco and cotton has risen significantly from 1995-96 to 2002-03.11
Regional Variation of Crop Production
16. Mozambique is a vast country with a wide variety of regional cropping patterns. Large regional differences include rainfall, temperature, soil types, and market access. Although the country is grouped into 10 agroecological zones, it can be broadly divided into three geographical regions: North (Niassa, Cabo Delgado, and Nampula), Center (Zambézia, Tete, Manica, and Sofala) and South (Inhambane, Gaza, and Maputo province) (Table 3). Appendix 4 displays the main features of Mozambique’s agroecological regions and its farming systems. Mozambique’s agroclimatic zones range from arid and semi-arid (mostly in the south and southwest) to the sub-humid zones (mostly in the center and the north) to the humid highlands (mostly the central provinces). The arid regions of the south and southwestern part of Gaza province are suitable only for livestock. The principal regional variation of cropping practices is based on soil conditions and rainfall with changes in quantity and predictability from north to south.
6
Table 3. Agroecological Conditions and Regional Crop Production Patterns
Category North Center South
Annual rainfall (mm) 1,000 – 1,800 1,000 – 1,200 400 – 1,000
Main food crops Cassava, maize, rice, sorghum, sweet potatoes, beans
Cassava, sweet potatoes, maize, rice, beans, sorghum, millet
Cassava, maize
Main cash crops Tobacco, cotton, cashew, groundnuts
Tobacco, cotton, groundnuts, horticulture
Only limited agricultural production
Livestock Large pasture areas in Tete province
Pasture areas in Sofala Pasture areas with rural population raising cattle and goats
Source: Compiled from Appendices 3 and 4.
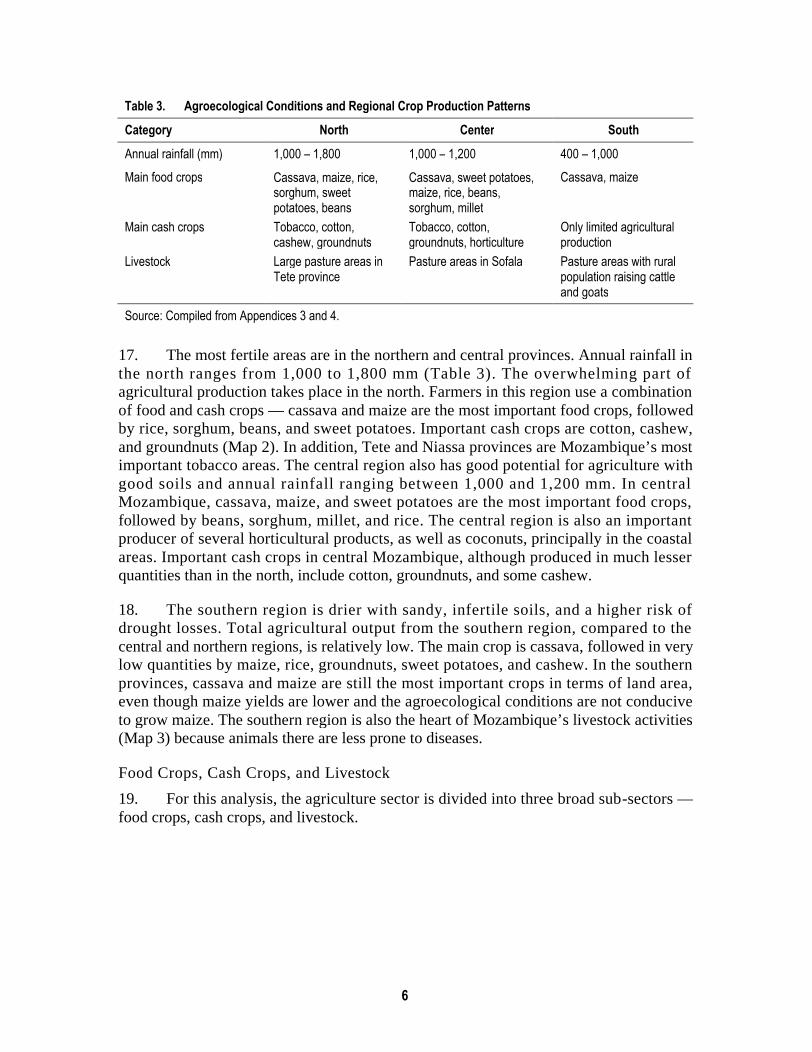
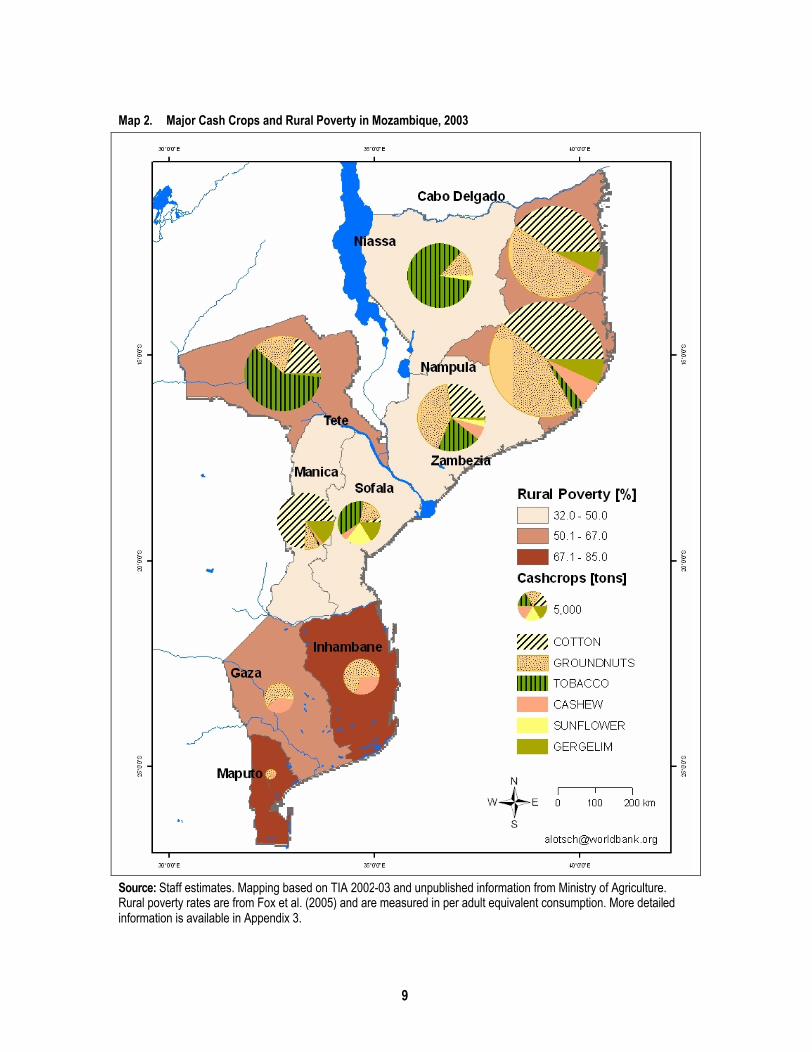
17. The most fertile areas are in the northern and central provinces. Annual rainfall in the north ranges from 1,000 to 1,800 mm (Table 3). The overwhelming part of agricultural production takes place in the north. Farmers in this region use a combination of food and cash crops — cassava and maize are the most important food crops, followed by rice, sorghum, beans, and sweet potatoes. Important cash crops are cotton, cashew, and groundnuts (Map 2). In addition, Tete and Niassa provinces are Mozambique’s mostimportant tobacco areas. The central region also has good potential for agriculture with good soils and annual rainfall ranging between 1,000 and 1,200 mm. In central Mozambique, cassava, maize, and sweet potatoes are the most important food crops, followed by beans, sorghum, millet, and rice. The central region is also an important producer of several horticultural products, as well as coconuts, principally in the coastal areas. Important cash crops in central Mozambique, although produced in much lesser quantities than in the north, include cotton, groundnuts, and some cashew.
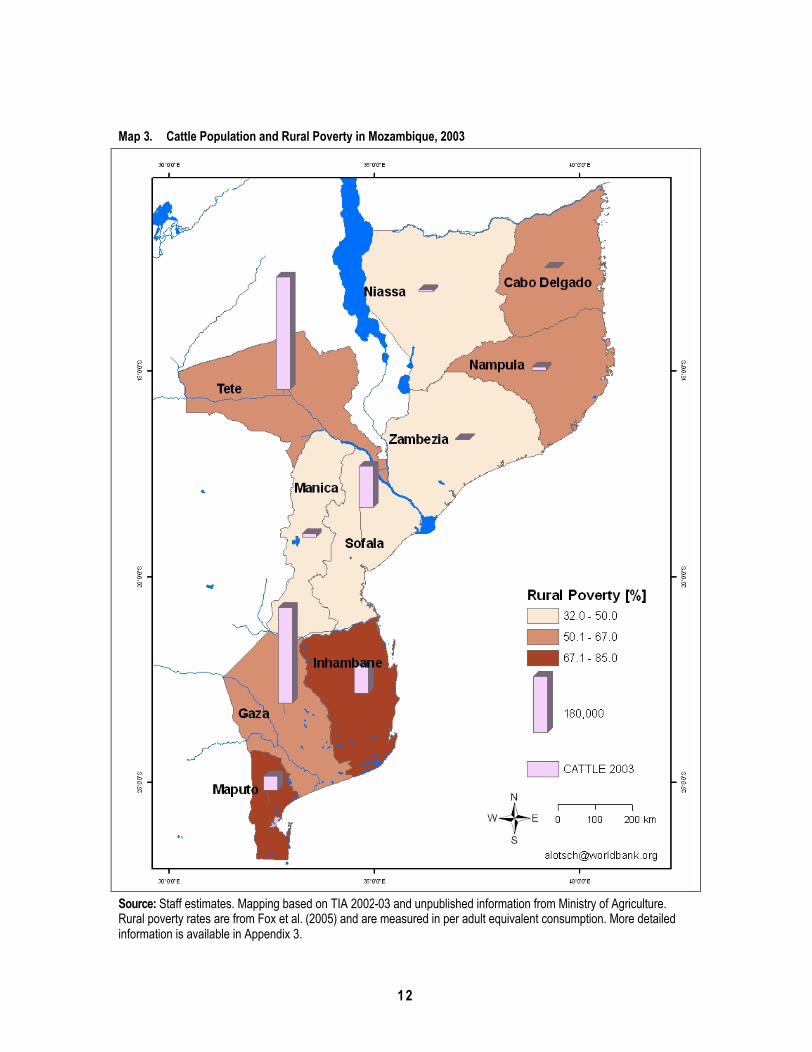
18. The southern region is drier with sandy, infertile soils, and a higher risk of drought losses. Total agricultural output from the southern region, compared to the central and northern regions, is relatively low. The main crop is cassava, followed in very low quantities by maize, rice, groundnuts, sweet potatoes, and cashew. In the southern provinces, cassava and maize are still the most important crops in terms of land area, even though maize yields are lower and the agroecological conditions are not conducive to grow maize. The southern region is also the heart of Mozambique’s livestock activities (Map 3) because animals there are less prone to diseases.
Food Crops, Cash Crops, and Livestock
19. For this analysis, the agriculture sector is divided into three broad sub-sectors —food crops, cash crops, and livestock.

7
Map 1. Major Food Crops and Rural Poverty in Mozambique, 2003
Source: Staff estimates. Mapping based on TIA 2002-03 and unpublished information from Ministry of Agriculture. Rural poverty rates are from Fox et al. (2005) and are measured in per adult equivalent consumption. More detailed information is available in Appendix 3.

8
FOOD CROPS
20. Subsistence agriculture has significant growth potential in Mozambique. To ensure household food security, most cultivated land is used to grow low-value maize and cassava (more than 50 percent of the total).12 With the remaining area, smallholders diversify with a wide variety of other food crops, and further diversify risk by planting in both low lying and higher elevation areas. Yields are low and show stagnant patterns, moreover, yields are estimated at only a small fraction of their potential (Table 1).
CASH CROPS
21. The cash crop sector has the potential for substantial yield increases. Today cash crops occupy roughly 5 percent of cultivated land and contribute to some 5 percent of agriculture GDP, which in turn is about 6 percent of the country’s exports. The traditional cash crop sector includes cotton, tobacco, cashew, sugar, and tea. Cotton and tobacco are grown under contract, cashew is a smallholder crop, and sugar and tea are plantation crops. As in the food crop sector, there is a major gap between potential and actual yields. Seed cotton is one example. Yields in Mozambique are significantly constrained by a lack of high-yielding, pest-resistant varieties adapted to local agroclimatic conditions. Yields average 0.6 tons per hectare compared to 0.9 in Zimbabwe and over 1.0 in francophone West Africa.13 Yields also vary within Mozambique — a high-input block may yield 1.4 tons per hectare while a low-input block may produce only 0.5-0.7.14
22. Another important example is cashew, which is of great importance to smallholders. Cashew trees are often old and diseased. The most recent plantings date from the 1950s and 1960s, and average yields are only 1.5-3.0 kilograms per tree, whereas the potential can be as high as 10-15. One-quarter of the national stock of about 25-26 million old trees is attacked by powdery mildew (Oidium) and other diseases, which reduces yields by as much as 70 percent.15 During the dry season trees are damaged by fire.16 These problems not only affect yield, but also reduce quality
23. With a potential irrigated area of about 3 million hectares, irrigation of more land will increase the yield and quality of cash crops. Mozambique’s irrigated areas lie mainly in the central and northern provinces, with the Zambézi basin accounting for nearly 60 percent of the total. There is less irrigated land in the south, about 300,000 hectares. Out of the 3 million hectares that are estimated to be irrigable, about 97,000 are equipped for irrigation but only 37,000 (or 40 percent) actually are irrigated.17 Of the three types of irrigation — large-scale public, donor-funded small-scale, and farmer-run micro irrigation — smallholdings are most likely to be expanded where the second and third types or irrigation are available. The first type is mainly used by large commercial farmers. For example, about 36,000 hectares are currently cultivated for sugar.18 Other than rice and sugar, a variety of high-value horticultural crops can be grown on irrigated areas.
9
Map 2. Major Cash Crops and Rural Poverty in Mozambique, 2003
Source: Staff estimates. Mapping based on TIA 2002-03 and unpublished information from Ministry of Agriculture. Rural poverty rates are from Fox et al. (2005) and are measured in per adult equivalent consumption. More detailed information is available in Appendix 3.

10
Table 4. Livestock in Mozambique, 1994-2003 (‘000)
Livestock 1994 1996 2000 2002 2003
Cattle 470 573 722 791 969Goats 1,655 3,101 5,047 4,938 4,748Sheep 129 211 174 196 136Pigs 1,694 1,382 2,347 1,601 1,354Chickens 10,844 17,459 23,587 22,616 17,647Ducks 1,858 2,838 4,132 2,126 1,537Source: Ministry of Agriculture.
24. Irrigated agriculture for smallholders has high growth potential. Developing smallholder irrigation would cost an estimated US$600-800 per hectare compared to US$3,000 per hectare for large farms. Most smallholder irrigation is now used for double cropping food crops — intercropping with vegetables and at times cash crops. Under existing cropping patterns, the average value-added is estimated at US$500-600 on the smallest farms and US$800-1,000 for farms of between 5 and 10 hectares. If a total of US$20 million were invested per year, that investment could generate about US$250 million of value added in agriculture (even assuming no major shifts in cropping patterns).19
LIVESTOCK
25. Livestock make significant contributions to the livelihood of smallholders and the rural poor. The number of livestock has grown significantly over the past decade (Table 4). They are owned by the rural poor to increase and diversify income, and to reduce risk. The very poor can afford only some chickens and pigs, while those at the next level can add goats and a few cattle, and the better off among the poor can afford larger numbers of chickens, pigs, and cattle.20 Cattle are used mainly for animal traction, as a status symbol, and are rarely sold. Nationwide, only 4 percent of the population possesses cattle.21
Livestock holdings include other animals such as rabbits, ducks, and guinea pigs. As with other agricultural activities, the roles of men and women differ. Women often raise chicken and pigs while men raise goats and cattle.
26. The contribution of livestock to family income varies by area but is generally significant. In Muchamba, Tete for example, livestock provided 45 percent of family income for the poorest to nearly 60 percent for the less poor. In Massalane, Inhambane, the range was 21 percent to 65 percent.22 Using stylized household income models in the four sets of provinces, northern, central western, central eastern, and southern, the estimated potential contributions of livestock to family income were 12 percent, 34 percent, 16 percent, and 27 percent, respectively.23 The contribution of livestock is more significant in the arid zones of Tete, Manica, Gaza, and Maputo. Currently, more than two-thirds of Mozambique’s cattle herd is located in Tete, Gaza, and Manica provinces.24
About two-thirds of total livestock production is in northern provinces and the central eastern provinces. Of the total production in these provinces, some 55 percent is pork and 40 percent goats and poultry. For the provinces supplying Maputo, pork was also

11
important at 25-30 percent, goats and poultry at 45 percent, with beef providing the remaining 25-30 percent.25
27. Several constraints undermine an increase in livestock numbers, but chief among them is a high prevalence of disease. For example, Newcastle disease is a major problem for poultry, in the northern provinces tsetse flies affect cattle, and African swine fever affects pigs. In addition, the inadequacy of animal husbandry services is a common problem because extension services do not cover all districts. The ability of communities to expand grazing for cattle is also determined by the availability and variability in pasture quality, and access to water and veterinary services. There are some conflicts between crop agriculture and livestock, especially under drought conditions and when the animals are large. Where there are crops nearby, animals need to be tethered to reduce the possibility of conflict. The lack of access to credit is problem in crop agriculture and also undermines the livestock sector. Poor families cannot raise credit to purchase animals, and women have difficulty accumulating livestock. If widowed, they are stripped of all family assets upon the death of their husbands, including family animals.
28. The commercial sector serves primarily a quality-conscious but price insensitive urban market of restaurants and hotels. The family sector serves domestic demand forcheap meat cuts. The commercial sector has better access to surplus grain and crop by-products than the family sector, which sells through a well-established network of local traders, butchers, and other farmers, and typically has no problem selling its products.
29. Family livestock shows substantial potential for growth. Financial analyses for households rearing chickens and pigs using stylized household enterprise models suggest that the contribution of these to household income can be substantial. For example, the contribution of chickens to household income can be 7 percent in the northern provinces, 15 percent in the central northern provinces, 8 percent in the central southern provinces, and up to 13 percent in southern provinces. For pigs, the contribution is much higher at 29, 38, 23, and 38 percent, respectively). The contribution of cattle in non-tsetse areas is even more important, ranging from around 40 percent in the northern and southern provinces, to 52 percent in the central western, to 32 percent in the central eastern provinces (Map 3).26
Effects of Three Decades of War on Commercial Farming
30. Despite considerable reconstruction efforts after three decades of war, much of the physical infrastructure remains deficient.27 There was massive destruction of housing, communications networks, and education and public health facilities. Livestock herds were decimated and fields were abandoned. The population of 19 million was severely affected, with more than 1 million dead, 1.5 million refugees, and 3.2 million people internally displaced. After the General Peace Agreement in 1992 and democratic elections in 1994, the agriculture sector moved away from centrally planned state intervention in agricultural management, pricing, and marketing toward market allocation of agricultural resources, liberalized pricing policies, and privatization of state assets. Economic reform, initial rehabilitation of rural infrastructure, and the rapid post-conflict expansion in production have also stimulated a small agribusiness sector.
12
Map 3. Cattle Population and Rural Poverty in Mozambique, 2003
Source: Staff estimates. Mapping based on TIA 2002-03 and unpublished information from Ministry of Agriculture. Rural poverty rates are from Fox et al. (2005) and are measured in per adult equivalent consumption. More detailed information is available in Appendix 3.

13
31. Large-scale commercial farming, however, has declined in importance since the 1970s. Until independence in 1975, cash crops (such as cashew, sisal, and cotton) were almost two-thirds of total exports. The decline started with the exodus of the Portuguese and other settlers after independence, which was a major loss of managerial and technical staff. It was hastened by nationalization, poor management, inappropriate investments in plants and machinery, overvalued exchange rates, low fixed prices, marketing controls, declining international prices, and sabotage during the civil war.
32. Today, most of the companies have been privatized but struggle with obsolete machinery, weak markets, and low competitiveness. As part of its strategy for agricultural development, the Government has attempted to revive both cash crop production and agroprocessing with some recent success (e.g., tobacco and horticulture). Some of the policy instruments, however, have proved politically contentious and created uncertainty in the relevant industries. Larger farms in Mozambique tend to be in the zones where animal or mechanical traction is possible and where market access is adequate. Cash crops are mainly grown for export and account for about one-third of total exports, but occupy only up to 5 percent of the total planted area.
Determinants of Agricultural Growth33. The rapid growth of Mozambican agriculture is primarily a result of increased area and household labor. Crop diversification has significantly increased, but adoption and use of technologies has seen only modest advances. Extension coverage is limited, but where available, significantly affects rural crop production, but smallholder yields are low.
Rapid Growth in Agriculture
34. Starting from a low base of per capita income, agricultural growth was high during the mid-1990s, in fact, Mozambique has one of the highest growth rates in the region. Since the Peace Accords the agriculture sector has grown rapidly because farmers were able to return to their land and markets opened up. Average annual GDP growth for the agriculture, livestock, and forestry sectors was 6.2 percent between 1992 and 2003.28
In favorable years growth has peaked at about 10 percent annual growth. Over the past decade the rural economy has suffered heavily from climatic shocks (droughts in 1994 and 1996, and floods in 2000) (Fig. 2). These events were, however, followed by an immediate recovery of the economy.
35. Mozambique’s high agricultural growth rates are consistent with household-level evidence.29 Considering rural population growth of about 1.9 percent annually, estimates from a background study of the 2005 Country Economic Memorandum reveal that total rural consumption grew annually at about 6 percent between 1996 and 2003.30 This compares favorably with the average annual growth rate of 6.6 percent for the agriculture, livestock, and forestry sectors over the same period. Part of the difference may be attributed to real income growth of the non-farm economy, as shown in the following sections. Growth of maize production, Mozambique’s predominant food crop as a proxy indicator, equally confirms the basic production trends (Fig. 3). Maize is
14
cultivated by about 79 percent of rural households and occupies about 35 percent of total planted area.31
Figure 2. Growth of Agricultural GDP, 1992-03 (percent)
-30%
-20%
-10%
0%
10%
20%
30%
1992 1993 1994 1995 1996 1997 1998 1999 2000 2001 2002 2003
Source: Loening and Perumalpillai-Essex (2005) based on National Accounts data, Instituto Nacional de Estatística (INE). Agriculture includes the livestock and fishery sectors.
Figure 3. Maize Production, 1993-03 (‘000 tons)
0
200
400
600
800
1,000
1,200
1,400
93-94 94-95 95-96 96-97 97-98 98-99 99-00 00-01 01-02 02-03
Maize AP Maize TIA
Source: Loening and Perumalpillai-Essex (2005) based on Aviso Previo (AP) and Trabalho de Inquérito Agrícola ao Sector Familiar (TIA), Ministry of Agriculture.
15
36. Over the past decade, sectoral shifts have been moderate, but the agriculture sector remains important. In 2003, agriculture was the largest sector and contributed 25percent of total GDP compared to 24 percent in 1992 and 31 percent in 1996.32 In context, however, agriculture makes a relatively modest contribution to total GDP considering that farmers are about 90 percent of the rural workforce and about 68 percent of Mozambique’s population of 19 million lives in rural areas.
37. Production of basic food crops is the key driver for increased agricultural production. Basic food crop production grew at an average rate of about 3-4 percent annually. Maize and millet production showed the highest increases, followed by sorghum, beans, rice, and cassava. Groundnut production may have declined by about 1 percent. Regionally, production increases were highest in the central regions, particularly in Tete province (Table 26).33
38. Empirical evidence, although scattered, suggests that the number of households as well as total cash crop production for exports increased.34 Particularly important are sugar cane (for larger enterprises), cashews, copra, and cotton (Table 5). The percentage of households that grow cashew increased from 5 to 7 percent, tobacco from 2 to 4 percent, and cotton from 5 to 7 percent. As a consequence, some provinces have demonstrated a growth dynamic with higher input use. This process is mainly due to excess demand from neighboring countries.35 Tobacco production, which reportedly has grown significantly, is almost entirely located in Tete and Niassa provinces. About one-third of Mozambique’s cotton production is located in Nampula, followed by Cabo Delgado and Sofala.
39. Tobacco production in Mozambique has grown very rapidly over the past seven years. From 1,500 tons in the 1996-97 agricultural season, national production of raw tobacco increased every year to reach over 50,000 tons in 2003-04. Over the same period, the estimated number of tobacco growing households increased from 6,000 to more than 120,000. There are currently five major firms operating in the country that promote smallholder contract farming schemes and larger scale commercial operations.36
Table 5. Estimated Export Crop Production, 2000-02 (‘000 tons)
Cash crops 2000 2001 2002Cane sugar 336.0 571.6 1,342.1Copra 43.6 63.4 45.4Cashew nuts 45.9 47.4 44.4Tea (leaf) 20.5 17.7 24.7Cotton 9.8 19.7 23.0Citrus 17.3 12.1 12.1
Source: IFAD (2005) compiled from secondary sources.

16
40. By contrast, cotton production in Mozambique has been cyclical over the years. The historic high of 144,061 tons was achieved over 20 years ago. Current production is an estimated 88,173 tons due to fluctuating prices and demand in the world market, as well as domestic issues related to contracts between exporting firms and smallholder farmers, under which virtually all production in generated.37
Extensive Cultivation Is the Main Source of Agricultural Growth
41. Agricultural output has grown over the past decades, but gains during the last decade are largely associated with a larger cultivated area and more household labor. This pattern is not considered sustainable because improvements to agricultural technologies have been limited. Several sources of agricultural growth are examined below.38
MORE CULTIVATED LAND
42. Area expansion was Mozambique’s main source of agricultural growth. Expansion of cultivated agricultural land was greatest in the central region, followed by the southern and northern provinces (Table 6). From 1992 to 2001, area expansion occurred at an annual rate of 3.3 percent.39 These estimates also compare favorably with recent household-level evidence. From 2000 to 2003, the total land area cultivated increased by 3.9 percent to 4.5 million hectares.
43. Land expansion was Mozambique’s main source for growth. First, econometric estimates undertaken for this strategy based on panel data for maize production during 1993-01 show that agricultural land has a short-run elasticity on output growth of about 0.8 and a long-run elasticity of about 0.4 (Table 20 in Appendix 2). Second, estimates of the determinants of crop income with 2002 agricultural survey data show that agricultural land has an elasticity on output growth of about 0.4 (Table 21 in Appendix 2).40
44. Mozambique has abundant land with extensive cultivation practices, thus the agricultural economy relies to a large extent on its natural resource base.41 In 2003, close to 85 percent of smallholders said that land expansion, if needed, would not constitute a major constraint for agricultural production.42 For small farms, land acquisition (informal occupation) is the main source of land expansion in rural areas (Fig. 4). There is evidence, however, that land is constrained in more productive areas.43 It should be noted that the ability to increase production through area expansion is currently limited by the availability of labor. If more labor is not available, the economy may stagnate.
GROWTH OF LABOR FORCE
45. Growth of the labor force also contributed to agricultural expansion. As measured by the number of households engaged in smallholder agriculture, labor has increased at an annual rate of 1.7 percent, which is consistent with an estimated rural population growth rate of 1.9 percent per year.44 Labor force growth was highest in the center of the country, followed by the northern and southern provinces (the relatively low increase in the south could be due to the better use and quality of agricultural inputs). These numbers, however, may underestimate the impact of labor force growth because after the 1992 Peace Agreement, many refugees and migrants returned to the countryside.

17
Table 6. Average Annual Growth Rates for Land, Labor, and Rainfall, 1993-03 (percent)
Region Area
Time Total Smallholder Commercial a Labor Rainfall
North 1993-2001 2.5 2.9 -8.2 1.5 6.2Center 1993-2001 6.8 7.2 -5.0 4.2 13.5South 1993-2001 2.7 2.7 7.0 0.5 11.6Total 1993-2001 3.3 3.6 -4.2 1.7 10.7Total 2000-2003 3.9 … … 1.2 …
a. Commercial farms are those with over 50 hectares of cultivated landSource: Loening and Perumalpillai-Essex (2005) based on CAP 1999-00, TIA 2003, and unpublished data from Aviso Previo, Ministry of Agriculture.
Figure 4. Main Source of Land Acquisition, 2000
9 %
4 %1 %
6 %
4 2 %
0 %3 %
3 3 %
3 %
1 5 %
2 3 %
2 %5 %
2 3 %
6 %
1 %
2 6 %
0 %
5 1 %
5 %
2 3 %
2 % 2 % 0 %
1 4 %
0 %2 %
0 %
1 0 %
2 0 %
3 0 %
4 0 %
5 0 %
6 0 %
Transferedby
tradit ionalauthori t ies
Transferedby formal
authori t ies
Rented Bor rowed Occup ied Bought wi thwritten tit le
Boughtwi thout
written tit le
Inher i ted Other
Smal l Med ium Large
Source: Loening and Perumalpillai-Essex (2005) based on unpublished data from CAP 1999-00.
WEATHER
46. Weather conditions were highly erratic over the past decade. Cumulative annual rainfall grew at a rate of 13.5 percent, with growth highest in the central provinces and the southern part of the country, and below the national average in the north. Rainfall was particularly low in 1995-96, and much above average in 2001-02.45 The country was affected by regional droughts in 1994, 1996, and 2001, which negatively affected crop production in some provinces. Highly variable rainfall puts agricultural production at risk.
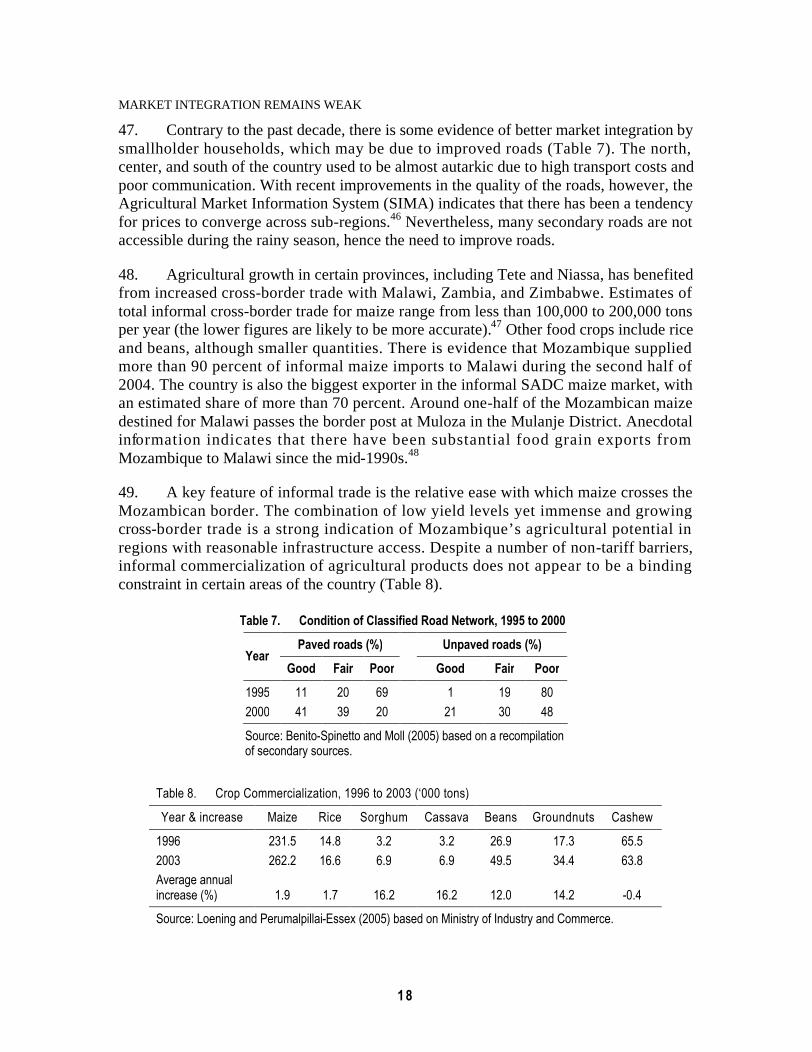
18
MARKET INTEGRATION REMAINS WEAK
47. Contrary to the past decade, there is some evidence of better market integration by smallholder households, which may be due to improved roads (Table 7). The north, center, and south of the country used to be almost autarkic due to high transport costs and poor communication. With recent improvements in the quality of the roads, however, the Agricultural Market Information System (SIMA) indicates that there has been a tendency for prices to converge across sub-regions.46 Nevertheless, many secondary roads are not accessible during the rainy season, hence the need to improve roads.
48. Agricultural growth in certain provinces, including Tete and Niassa, has benefited from increased cross-border trade with Malawi, Zambia, and Zimbabwe. Estimates of total informal cross-border trade for maize range from less than 100,000 to 200,000 tons per year (the lower figures are likely to be more accurate).47 Other food crops include rice and beans, although smaller quantities. There is evidence that Mozambique supplied more than 90 percent of informal maize imports to Malawi during the second half of 2004. The country is also the biggest exporter in the informal SADC maize market, with an estimated share of more than 70 percent. Around one-half of the Mozambican maize destined for Malawi passes the border post at Muloza in the Mulanje District. Anecdotal information indicates that there have been substantial food grain exports from Mozambique to Malawi since the mid-1990s.48
49. A key feature of informal trade is the relative ease with which maize crosses the Mozambican border. The combination of low yield levels yet immense and growing cross-border trade is a strong indication of Mozambique’s agricultural potential in regions with reasonable infrastructure access. Despite a number of non-tariff barriers, informal commercialization of agricultural products does not appear to be a binding constraint in certain areas of the country (Table 8).
Table 7. Condition of Classified Road Network, 1995 to 2000
Paved roads (%) Unpaved roads (%)Year
Good Fair Poor Good Fair Poor
1995 11 20 69 1 19 802000 41 39 20 21 30 48
Source: Benito-Spinetto and Moll (2005) based on a recompilation of secondary sources.
Table 8. Crop Commercialization, 1996 to 2003 (‘000 tons)
Year & increase Maize Rice Sorghum Cassava Beans Groundnuts Cashew
1996 231.5 14.8 3.2 3.2 26.9 17.3 65.52003 262.2 16.6 6.9 6.9 49.5 34.4 63.8Average annual increase (%) 1.9 1.7 16.2 16.2 12.0 14.2 -0.4
Source: Loening and Perumalpillai-Essex (2005) based on Ministry of Industry and Commerce.
19
50. Market integration measured by the dynamics of the rural labor market, however, reveals a more or less stagnant trend. Rural labor market activities in Mozambique showed no significant dynamism over the past decade. The percentage of agricultural households that hired non-family labor actually declined from 19 to 16 percent from 1995-06 to 2001-02.49 Households that hired agricultural labor declined for the first four income quintiles. The only exception is the highest income quintile, where demand for agricultural wage labor increased.50
51. The percentage of major food crops sold in local markets eventually stabilized. For example, maize commercialization rose from 11 percent to 22 percent from 1996 to 2000, but eventually declined to 17 percent in 2003. According to data from the Ministry of Industry and Commerce, the average annual increase for maize and rice commercialization was slower than the overall production increase. Important exceptions are sorghum, cassava, and beans. Cashew commercialization actually declined.
BROAD-BASED CROP DIVERSIFICATION
52. Smallholder households have significantly diversified their production patterns. From 1995-96 to 2002-03, the mean number of crops almost doubled from 4.6 to 8.5 crops per household. Crop diversification was more pronounced for food crops, in particular pulses, horticulture, and perennials. In addition, crop diversification occurred almost equally in all income quintiles, suggesting a pro-poor pattern of agricultural growth. Diversified crop production is primarily a coping strategy against weather-related production risks, but provides little additional income to the poor. Analysis undertaken for this strategy based on an agricultural crop production function, shows that the effects of crop diversification for additional farm income are rather negligible (Table 21 in Appendix 2).51 This may be due to the quality and quantity produced at each farm household.
MODEST TECHNOLOGICAL IMPROVEMENTS
53. Adoption and use of agricultural technology has seen some modest advances. Overall, use of chemical and manure fertilizers per household, rose from about 4 percent in 1995-06 to 10 percent in 2001-02 to 11 percent in 2003. Use of animal traction increased from 7 to 11 percent. This increase may partly be attributed to livestock repopulation programs. Households that use small-scale irrigation increased from 4 to 11 percent (Table 27 in Appendix 3). Moreover, there is evidence of an increase in the number of smallholders using drought-resistant varieties. In 2002, about 34 percent of maize farmers purchased seeds of varying quality.52 In general, the adoption of new agricultural technologies was broad-based, but there were somewhat higher increases in the lowest and highest income quintiles. Overall, the changes are too moderate and often very region-specific to have a significant impact on agricultural growth.
54. Despite limited access to improved crop production technologies in rural Mozambique, there is scope for optimism. Estimates of the determinants of smallholder crop income undertaken for this strategy show that the use and adoption of improved agricultural technologies would have significant effects. Of particular importance are use of fertilizers and pesticides and mechanization in the form of animal traction for poorer

20
households. On average, households that use fertilizer have 50 percent higher income than those that don’t fertilizer, and pesticide use could increase farm incomes by about 30 percent (with the caveat that higher use of agricultural inputs is often associated with cash cropping, which may bias the estimates). Moreover, households that use animal traction could increase farm income by about 14 percent. Social capital also plays a key role. Belonging to a farmer association has the potential to increase average income of poor dwellers by about 25 percent (Table 21 in Appendix 2).53
IMPORTANCE OF EXTENSION
55. Rural extension significantly affects rural crop production. Despite very limited coverage — only about 13 percent or rural households have access to extension services from fewer than 700 public extension workers — research for this strategy reveals a positive impact. Having access to private or public extension raises rural crop incomes by about 8.4 percent (Table 21 in Appendix 2). This extension parameter is statistically significant. Quintile regression techniques show that the impact of extension diminishes as crop income increases — the effect of extension is highest for the lower income quintiles (Fig. 5). Agricultural extension in Mozambique is primarily benefiting the rural poor.
56. Another interesting finding is that NGO extension has a slightly higher and more significant impact than public extension services (Table 24 in Appendix 2). Public extension, however, is better oriented toward poorer households (Table 9). A recent study shows a positive and significant impact of agricultural extension on rural livelihoods in Mozambique. The main impact of extension is introduction of new seed varieties, natural pesticides, and soil conservation and crop commercialization techniques.54
57. The magnitude of the extension variable is in line with similar analysis for Sub-Saharan Africa, however, it appears to be on the low side. For example, a Zimbabwe study finds that agricultural extension raises the value of crop production by about 15 percent.55 A meta-review of African case studies that quantify the effect of extension via econometric or other techniques, found that out of 27 studies, 21 showed rate of returns in excess of 12 percent.56 One reason for the comparatively low effect could be the low quality and coverage of agricultural extension in rural Mozambique.
MODEST INCREASE IN AVERAGE RURAL EDUCATION
58. Increased primary school enrollment has had little impact on average education of rural household heads. While Mozambique showed a strong increase in primary enrollment over the past decade, average education of rural household heads only rose from 1.9 years in 1995-06 to 2.2 years in 2001-02. The increase in farmer education was negligible in all income quintiles except the highest. About 43 percent of rural household heads remain illiterate, and only about one-third have more than three years of primary education.57
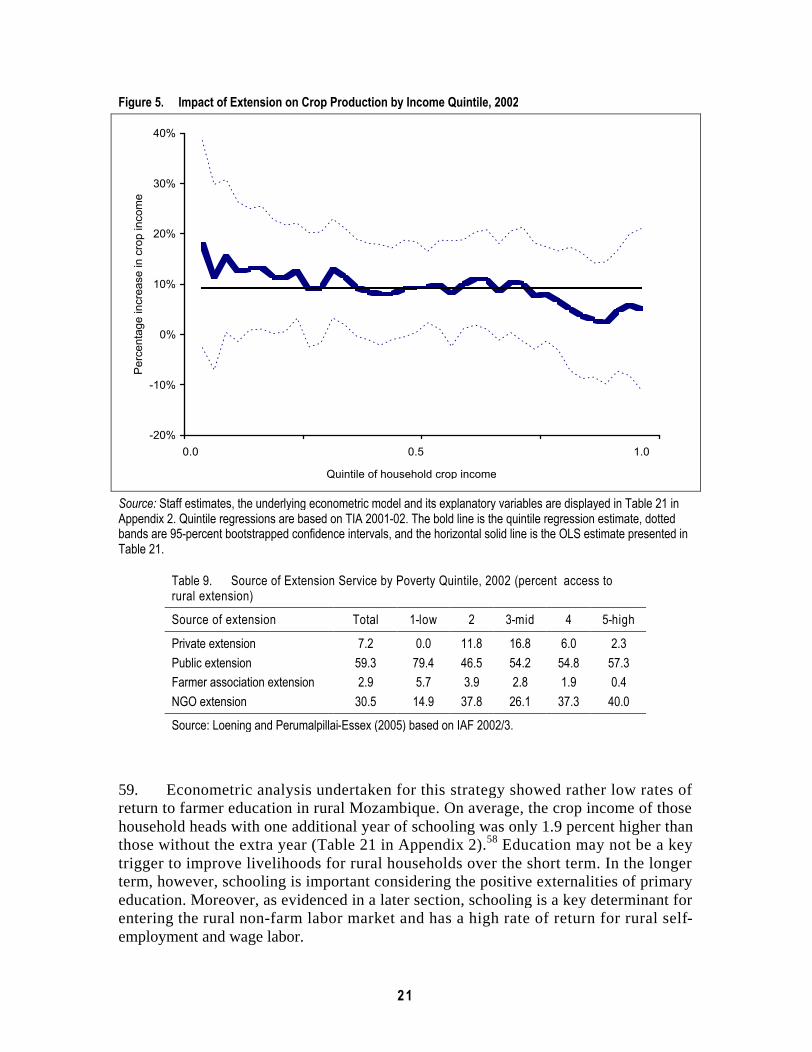
21
Figure 5. Impact of Extension on Crop Production by Income Quintile, 2002
-20%
-10%
0%
10%
20%
30%
40%
0.0 0.5 1.0
Quantile of household crop income
Per
cent
age
incr
ease
in c
rop
inco
me
Source: Staff estimates, the underlying econometric model and its explanatory variables are displayed in Table 21 in Appendix 2. Quintile regressions are based on TIA 2001-02. The bold line is the quintile regression estimate, dotted bands are 95-percent bootstrapped confidence intervals, and the horizontal solid line is the OLS estimate presented in Table 21.
Table 9. Source of Extension Service by Poverty Quintile, 2002 (percent access to rural extension)
Source of extension Total 1-low 2 3-mid 4 5-high
Private extension 7.2 0.0 11.8 16.8 6.0 2.3Public extension 59.3 79.4 46.5 54.2 54.8 57.3Farmer association extension 2.9 5.7 3.9 2.8 1.9 0.4NGO extension 30.5 14.9 37.8 26.1 37.3 40.0
Source: Loening and Perumalpillai-Essex (2005) based on IAF 2002/3.
59. Econometric analysis undertaken for this strategy showed rather low rates of return to farmer education in rural Mozambique. On average, the crop income of those household heads with one additional year of schooling was only 1.9 percent higher than those without the extra year (Table 21 in Appendix 2).58 Education may not be a key trigger to improve livelihoods for rural households over the short term. In the longer term, however, schooling is important considering the positive externalities of primary education. Moreover, as evidenced in a later section, schooling is a key determinant for entering the rural non-farm labor market and has a high rate of return for rural self-employment and wage labor.
Quintile of household crop income
22
Stagnant Land and Labor Productivity
60. Smallholder yields of basic food crops are extremely low and trends have been basically flat over the past decade, mainly due to limited adoption and use of agricultural technologies. For example, maize yields are, on average, only about 0.9 tons per hectare. Data from Aviso Previo as well as agricultural surveys indicate that yield levels increased marginally until the mid-1990s, and have declined since then (Figs. 11 and 12 in Appendix 3).
61. Moreover, recent evidence from a study suggests that agricultural labor productivity may have declined over the past decade.59 T h e observed decline in production per household is particularly pronounced for maize, but also for rice and other crops, including smallholder cashew production. Tobacco and cotton are the only two crops with improved production, mainly due to increased use of agricultural inputs for these highly profitable cash crops.
62. There are five potential explanations why estimates of decreased labor productivity appear plausible.60 First, diversification into new crops could lower the relative effort per household member for any specific crop if more crops are produced on a similar cultivated area. Second, extensive agricultural practices imply that newly formed households have access to lower quality land than already established households. Third, it is likely that even for established households, soil fertility is declining while weed growth increases given continuous land cultivation with limited or no fertilizer or manure applications. Fourth, diversification to non-farm activities could mean less effort per household member in crop production or reflect less successful extensive agricultural practices. Finally, was there was an a priori reason to expect labor productivity to show strong positive trends? Such trends could be driven by higher quality labor and better use of external inputs, including improved seeds and mechanization. Given the marginal improvements from household education and use of inputs at the household level, there is little reason to expect that labor productivity would improve substantially over time.
63. The observed decline in labor productivity, however, should be taken with caution. Given concerns with agricultural data and the possibility of underestimating crop production in the agricultural surveys, labor productivity estimates are suspect. This is particularly true because the agricultural surveys in 1995-06 and 2001-02 did not sample the same districts and hence the surveyed households are different. However, the analysis of labor productivity based on national household survey (IAF) consumption data (value added per unit of labor in the agricultural sector) showed an increase in labor productivity.61 This aspect needs further analysis.
Decl ine of Rural Poverty64. Although rural poverty remains widespread, it has declined and rural inequality has increased moderately. While agricultural growth is the major factor in reducing poverty, other factors are also in play, including transportation for inputs and farm produce. Female-headed households are significantly disadvantaged, rural inequality appears to have moderately increased over the past decade, and rural growth has benefited upper income quintiles.
23
Rural Poverty Declined but Remains Widespread
65. Rural poverty in Mozambique declined from 71 percent in 1996-97 to 55 percent in 2002-03. The decrease, as measured by adult equivalent consumption, was greatest in the central region, with the second largest decline in the north (Map 4). Rural poverty in the south increased slightly, especially in Maputo province. While overall evidence of a decline in rural poverty is strong, regional changes should be considered with caution. For example, changes in rural poverty in Sofala province may be overstated because household consumption was not accurately measured in 1996-97. The increase in Cabo Delgado may be due to poor sampling, particularly in 1996-97, that led to a low estimate. In Maputo province, changes in the food basket price that correct for price changes in imported food and non-food items, may produce a low estimate of changes in poverty.62
66. The evidence that rural poverty has decreased is robust and independent of assumptions about poverty lines or data. As rural households have met basic needs, they spend more on durable goods as demonstrated by a four-fold increase in bicycle and radio ownership. The share of household expenditures on food decreased nationally. This is a strong indicator for a decline in poverty because richer households generally spend relatively less on food and relatively more on non-food items. Finally, access to general health care improved and primary school enrollment increased significantly. Also the Demographic Health Surveys (DHS) show that infant mortality rates and under-five mortality decreased from 1997 to 2003.63
67. Despite the impressive reduction in rural poverty, 55 percent of the rural population in Mozambique remains poor. Moreover, rural poverty dominates the national figures on poverty because the majority of the population is located in the countryside. In 2003, rural poverty was located in the southern and northern provinces of Mozambique, in particular Inhambane, Maputo, and Cabo Delgado (Maps 1 and 3). The center of the country was relatively better-off.
Agricultural Growth Is the Main Determinant to Reducing Rural Poverty
68. Although technological improvements have been modest, agricultural growth has played a lead role in reducing rural poverty. Beyond its direct contribution to growth via increased farm income and employment, other aspects contribute to reducing poverty —a concentration of the rural poor in the agricultural sector, positive externalities by assuring food security, and forward and backward links to the non-farm sector. In Mozambique, the effect of agricultural growth on rural poverty is particularly powerful because the rural economy is almost entirely dominated by smallholder agriculture.
69. Empirical evidence suggests a key role for agriculture in the reduction of rural poverty. The decline from 1996-97 to 2002-03 can be associated with increased smallholder food crop production over the same period (Fig. 6). First, there appears to be a reasonable degree of correlation between changes in basic food crop production and rural poverty. Second, outliers and the likelihood of underreported food crop production in agricultural surveys show a decrease of rural poverty even with low or negative increases in agricultural production. Third, factors other than agricultural production may have played a role as well, for example, growth of the rural non-farm sector.
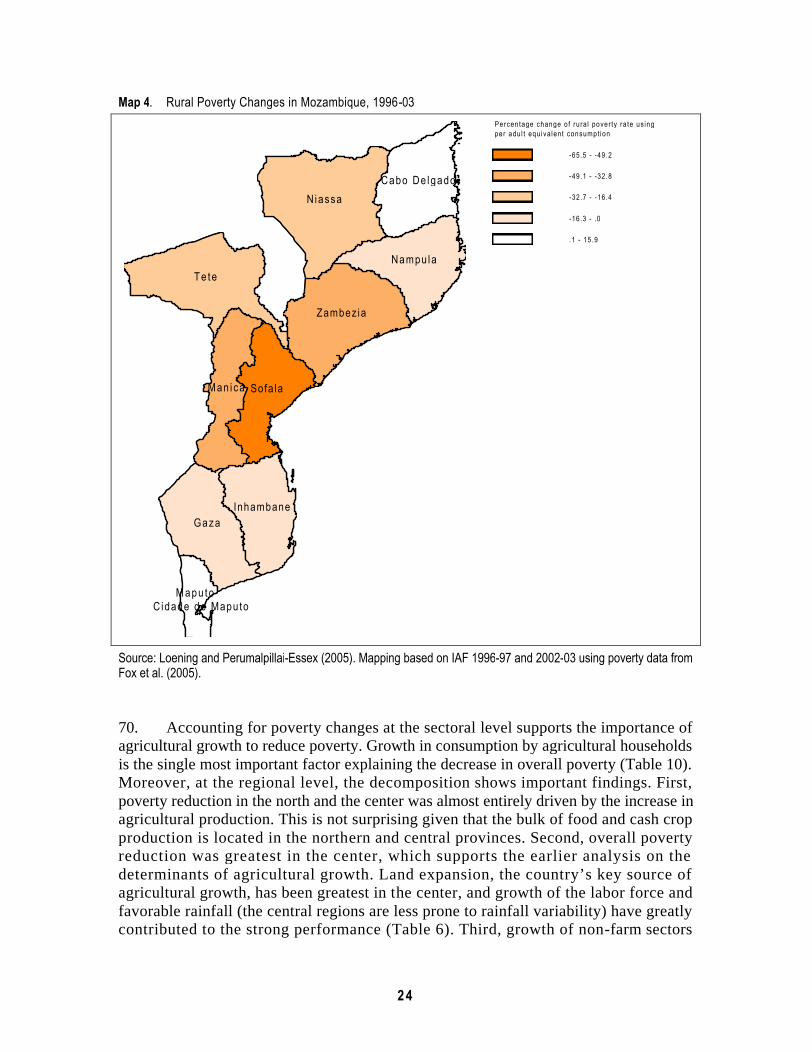
24
Map 4. Rural Poverty Changes in Mozambique, 1996-03
-65.5 - -49.2
-49.1 - -32.8
-32.7 - -16.4
-16.3 - .0
.1 - 15.9
Percentage change o f ru ra l pover ty ra te us ing per adu l t equ iva len t consumpt ion
M a p u t oC idade de Mapu to
GazaInhambane
Man ica Sofa la
T e t e
Zambez ia
Nampu la
N iassaCabo De lgado
Source: Loening and Perumalpillai-Essex (2005). Mapping based on IAF 1996-97 and 2002-03 using poverty data from Fox et al. (2005).
70. Accounting for poverty changes at the sectoral level supports the importance of agricultural growth to reduce poverty. Growth in consumption by agricultural households is the single most important factor explaining the decrease in overall poverty (Table 10). Moreover, at the regional level, the decomposition shows important findings. First, poverty reduction in the north and the center was almost entirely driven by the increase in agricultural production. This is not surprising given that the bulk of food and cash crop production is located in the northern and central provinces. Second, overall poverty reduction was greatest in the center, which supports the earlier analysis on the determinants of agricultural growth. Land expansion, the country’s key source of agricultural growth, has been greatest in the center, and growth of the labor force and favorable rainfall (the central regions are less prone to rainfall variability) have greatly contributed to the strong performance (Table 6). Third, growth of non-farm sectors

25
(industry and services) contributed reducing rural poverty, but their overall effect appears to be moderate. The effect of migration is very small at the national and regional levels.
Further Determinants of Rural Poverty
71. Analysis of the determinants of rural poverty undertaken for this strategy suggest that roads and transportation for agricultural products are among the single most important factors. Having access to transportation for agricultural production increases rural consumption by about 30 percent (Table 24 in Appendix 2). In addition, extension, use of fertilizers, and non-farm employment opportunities strongly improve rural livelihoods. Primary education has little significance, with low returns to schooling, but post-primary education becomes quite important. This confirms earlier evidence on the determinants of household crop production (Table 21 in Appendix 2).64
72. Female household heads are significantly disadvantaged, with rural households headed by females consuming about 23 percent less than those headed by males (Tables 21 and 24 in Appendix 2). This may be because women are confined to their farms and are seriously disadvantaged in terms of health care, education, and employment opportunities. Female-headed households, usually due to cultural reasons, also have limited access to non-farm income (Tables 22 and 23 in Appendix 2) and are more likely to be food insecure than male-headed households.65
Moderate Increase in Rural Inequality
73. Rural inequality appears to have increased over the past decade, but only moderately. The changes in inequality, as measured by household consumption per adult equivalent, are summarized by the Gini and Theil indices (Table 11). The movement in the Gini coefficients was smaller than the movement in the Theil coefficients, however the change in inequality played a small role in the overall poverty outcome because the dominant role was played by total increase in rural consumption.
74. Generally, rural growth benefited the upper consumption quintiles. The rural growth incidence curve for Mozambique sheds a closer light on the distributional patterns of rural consumption (Fig. 7). The curve displays the rate of consumption growth over 1996-97 and 2002-03 at each percentile of the distribution. On average there was substantial growth for all percentiles and rural poverty decreased, but growth was higher for wealthier households, particularly in the upper three quintiles, reflecting an increase in inequality. This may be due to better opportunities in the non-farm sector that were biased toward wealthier rural households.
75. Rural poverty in Mozambique is a widespread phenomenon and not particularly concentrated in regional spots. Inequality between provinces in rural Mozambique is only modest. A decomposition of national inequality to within-province and between-province shows that in 2002-03 about 94 percent of total inequality was found within provinces.66
At the district level within-group inequality remained high, but also inequality between groups became an important factor to explain overall inequality. One explanation might be that an unequal provision of public goods leads to the capture of benefits by local
26
elites, or inequality may be correlated with another — not easily observed — factor that leads to the capture by the elite.67
76. There is a need to further investigate pro-poor growth. While the overall patterns of rural growth appear to be broad-based, there is uncertainty on the actual dimension of pro-poor growth. On the one hand, most authors claim moderate increase in inequality at the national level as demonstrated by rising Gini coefficients.68 This slight increase in inequality at the national level, however, is not statistically significant, and its impact on poverty reduction efforts is thought to be negligible. Using an entropy class of inequality measures indicates that inequality in real consumption between provinces and regions has actually diminished over time.69 On the other hand, changes to household income based on agricultural surveys in 1995-96 and 2001-02 suggest that the increase of median incomes for the two lowest quintiles was higher than for the population as a whole.70
Figure 6. Correlation of Food Crop Production and Poverty (percent change, 1996-03)
y = -0.27x - 14.26R2 = 0.76
-40
-30
-20
-10
0
10
20
-100 -80 -60 -40 -20 0 20 40 60 80 100
Percent change in aggregate grain production, 1996-2003
Pe
rce
nt
ch
an
ge
in
ru
ral p
ove
rty,
19
96
-20
03
Source: Loening and Perumalpillai-Essex (2005) based on IAF 1996-97 and 2002-03 poverty data from Fox et al. (2005), and TIA 1995/6 and 2002/3 production data from Mather et al. (2005a). Sofala province was treated as an outlier and is excluded from the scatter plot.
Table 10. Decomposition of Poverty Change by Sector, 1996-03
Sector Total Mozambique North Center South
Total intra-sectoral component -13.7 -7.9 -26.9 2.1Agriculture -11.3 -6.1 -21.9 -0.4Industry -0.7 0.0 -1.8 1.1Services -1.7 -1.8 -3.2 1.4
Migration (sectoral shift) -1.6 -1.4 -1.0 -1.8Interaction component (residual) 0.2 -1.2 -0.3 0.4
Source: Fox et al. (2005).

27
N o n -f a r m E c o n o m y a n d R u r a l L a b o r M a r k e t s 77. The non-farm sector is gaining importance, particularly in the north and central areas. Non-farm income sources vary, as do its determinants, and particularly benefit upper income quintiles. Education, infrastructure, and market access increase the probability of generating rural wage income.
Rising Importance of the Non-farm Sector
78. In rural Mozambique, there is a moderate trend to work outside agriculture. In 2002-03, about 90 percent of the rural poor were engaged in agriculture or informal employment, compared to about 95 percent in 1996-97 (Table 12). The declining share of the rural population working in agriculture may also be associated with rural to urban migration or sectoral shifts to the non-farm sector. However, the sectoral shift has been moderate and the Mozambique rural labor market is still almost entirely based on agriculture. The structural changes by type of employer have been moderate (Table 13) The trade and services sectors grew from 1.9 percent in 1996-97 to 5.9 percent in 2002-03 (Table 12).
Table 11. Indices of Rural Inequality, 1996-97 and 2002-03Index 1996-97 2002-03
Gini 0.355 0.363Theil 0.238 0.256Source: Fox et al. (2005) based on IAF 1996-97 and 2002-03.
Figure 7. Rural Growth Incidence Curve, 1996-03
0.5
11.
52
2.5
33.
54
4.5
55.
56
Med
ian
splin
e/M
ean
of g
rowt
h ra
tes
0 2 0 4 0 6 0 8 0 100Percent i les
Median sp l ine Mean of growth rates
rural growth incidence curve
Source: Staff estimates based on IAF 1996-97 and 2002-03 using consumption data from Fox et al. (2005).
28
79. Women more often work in agriculture and men in the traditionally male-dominated sectors of manufacturing, construction, and transport. Both genders are found in trade, and public administration is still male dominated. Within sectors, men are more likely than women to be wage earners or self employed. Women are likely to helpin the family business in agriculture, transport, trade, and services (Table 12).
Strong Performance of the Rural Non-farm Sector in the North and Center
80. Households with a head working in a non-agriculture sector seem to be relatively better off than those with a head working in agriculture. This can be shown by differentiating the relative consumption position (using total consumption as numéraire) of households by agricultural and non-agricultural wage labor, and households in 1996-97 and 2002-03 (Table 14). However, the relative gap between both groups has widened. Also the relative gap between wage workers and those working for their own account has widened. The most preferable category to be working appears to be the non-agricultural and especially the non-agricultural wage sector.71
81. In 1996-97, non-agriculture wage jobs were associated with a relatively higher household consumption per capita in the north and the center (Table 15). In the south, however, they were not and it was the households with a self-employed head not working in agriculture or wage job in agriculture that had a relatively better consumption position. Nationally, living in the south and having a household head working for agricultural wages or self-employed outside of agriculture was the best position to be in.72
82. In 2002, however, these positions ranked much lower. Employment in the non-agriculture sector paid off if the household was living in the north or the center. No matter what the employment of a southern household head, all southern job categories decreased in relative consumption rank. For those household heads living in the south and center, the relatively better jobs were not in agriculture, preferably wage employment. In the north, both types of non-agriculture employment are equal in terms of household consumption. In 2002-03 it was better to be living in a household where the head was working in the non-agriculture sector.73
Sources of Rural Income Growth
83. Sources of rural income reveals interesting patterns. In 2002, some 99 percent of rural households received income from farm production, while 35 percent were self-employed in micro- and small-sized enterprises and 17 percent worked for wages. Only about 28 percent of rural households sold livestock. There are large differences among income quintiles — richer households have a significantly higher share of non-farm income sources, in particular rural wages and self-employment income (Fig. 8).
84. Sources of income growth in rural Mozambique by income quintiles show remarkable trends (Fig. 9). Between 1995-96 and 2001-02, the share of livestock sales increased for all quintiles, but still represents a small share of total income for most households. Second, crop income rose for the poorest three income quintiles but dropped for the richest quintile, which suggests that non-farm activities particularly benefited the upper quintiles. Third, increased wage income was the second largest source of rural income growth but was unequally distributed, particularly benefiting the upper quintiles.

29
Wage income for the poorest quintile actually declined. Finally, non-farm enterprise income sharply increased among the bottom two quintiles and the richest quintile.
Table 12. Rural Employment by Sector and Gender, 1996-97 and 2002-03
1996-97 (percent)a 2002-03 (percent)a
Sector All Men Woman All Men Women
Agriculture 94.7 80.7 95.9 89.7 68.7 90.1Mines 0.4 1.1 0.0 0.5 1.0 0.1Manufacturing 1.2 4.2 0.6 0.5 1.5 0.1Construction 0.5 2.0 0.1 1.3 4.5 0.1Transport 0.2 1.7 0.1 0.5 2.2 0.1Trade 1.1 4.1 1.9 4.0 9.6 5.1Services 0.8 3.1 0.6 1.9 7.4 3.1Education 0.5 1.1 0.3 1.2 2.6 0.7Health 0.2 0.5 0.4 0.3 0.5 0.4Public administration 0.3 1.6 0.2 0.4 2.1 0.3
a. The 1996-97 definition of “rural” was used in both years. Age group is 10-59 years.Source: Fox et al. (2005) using IAF 1996-97 and 2002-03.
Table 13. Rural Employment by Type of Labor, 1996-97 and 2002-03
Type of employment1996-97
(percent)a2002-03
(percent)a
Government/public enterprise 2.7 1.4Private sector 2.2 1.8Cooperative sector 0.1 0.0Self-employment 46.0 48.0Employer 0.2 1.4Family labor 49.0 47.0
a. The 1996-97 definition of “rural” was used in both years. Age group is 10-59 years.
Source: Fox et al. (2005) using IAF 1996-97 and 2002-03.
Table 14. Relative Consumption of Rural Household Head by Main Activity, 1996-97 and 2002-03
1996-97 2002-03
ActivitySelf-
employment Wage TotalSelf-
employment Wage Total
Agricultural 0.92 0.93 0.92 0.84 0.85 0.84Non-agriculture 1.33 1.36 1.35 1.35 1.55 1.48Total 0.95 1.29 1 0.89 1.47 1
Source: Brueck et al. (2005).
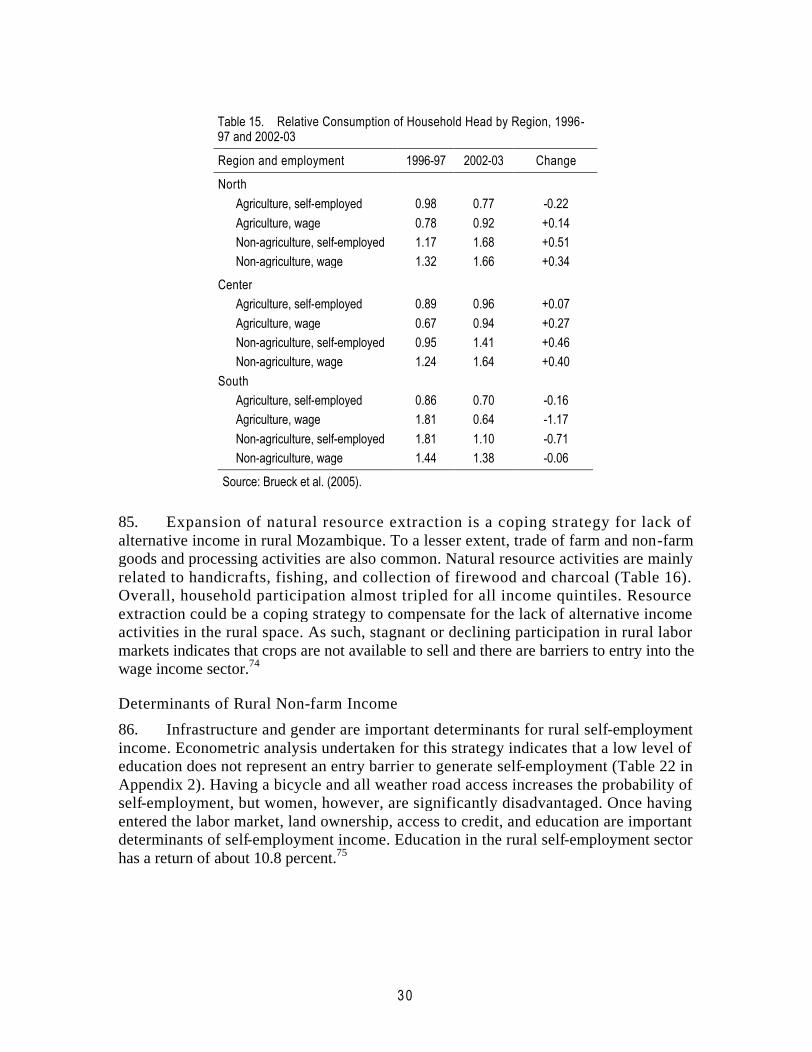
30
Table 15. Relative Consumption of Household Head by Region, 1996-97 and 2002-03
Region and employment 1996-97 2002-03 Change
NorthAgriculture, self-employed 0.98 0.77 -0.22Agriculture, wage 0.78 0.92 +0.14Non-agriculture, self-employed 1.17 1.68 +0.51Non-agriculture, wage 1.32 1.66 +0.34
CenterAgriculture, self-employed 0.89 0.96 +0.07Agriculture, wage 0.67 0.94 +0.27Non-agriculture, self-employed 0.95 1.41 +0.46Non-agriculture, wage 1.24 1.64 +0.40
SouthAgriculture, self-employed 0.86 0.70 -0.16Agriculture, wage 1.81 0.64 -1.17Non-agriculture, self-employed 1.81 1.10 -0.71Non-agriculture, wage 1.44 1.38 -0.06
Source: Brueck et al. (2005).
85. Expansion of natural resource extraction is a coping strategy for lack of alternative income in rural Mozambique. To a lesser extent, trade of farm and non-farm goods and processing activities are also common. Natural resource activities are mainly related to handicrafts, fishing, and collection of firewood and charcoal (Table 16). Overall, household participation almost tripled for all income quintiles. Resource extraction could be a coping strategy to compensate for the lack of alternative income activities in the rural space. As such, stagnant or declining participation in rural labor markets indicates that crops are not available to sell and there are barriers to entry into the wage income sector.74
Determinants of Rural Non-farm Income
86. Infrastructure and gender are important determinants for rural self-employment income. Econometric analysis undertaken for this strategy indicates that a low level of education does not represent an entry barrier to generate self-employment (Table 22 in Appendix 2). Having a bicycle and all weather road access increases the probability of self-employment, but women, however, are significantly disadvantaged. Once having entered the labor market, land ownership, access to credit, and education are important determinants of self-employment income. Education in the rural self-employment sector has a return of about 10.8 percent.75

31
Figure 8. Rural Household Income Sources, 2002 (mean share, percent)
73
3
9
15
86
31
8
85
3 2
10
81
25
12
70
3
11
16
45
2
2628
0
10
20
30
40
50
60
70
80
90
100
Crop income Livestock sales Wage income MSE income
Total 1-low 2 3-mid 4 5-high
Source: Staff estimates using TIA 1995-96 and 2001-02 income data from Mather et al. (2005a).
Figure 9. Rural Households Income Sources, 2002 (mean shares, percent)
73
3
9
15
86
31
8
85
3 2
10
81
25
12
70
3
11
16
45
2
2628
0
10
20
30
40
50
60
70
80
90
100
Crop income Livestock sales Wage i ncome MSE income
Total 1 - l ow 2 3-mid 4 5-h igh
Source: Staff estimates using TIA 1995-96 and 2001-02 income data from Mather et al. (2005a).
32
Figure 10. Growth of Rural Household Income, 1996-02 (percent mean income)
61
6 5
49
40
53
76
7
-4
28
35
73
75
14
30
78
7
16
0
3437
10
40
13
85
-11
4
57
50
-20
0
20
40
60
80
100
Tota l income Crop income Livestock sales Wage i ncome MSE income
Total 1 - l ow 2 3-mid 4 5-h igh
Source: Staff estimates using TIA 1995/6 and 2001/2 income data from Mather et al. (2005a).
Table 16. Natural Resource Extraction Activities of Rural Households, 2000
Activity Percentage of households practicing
Percentage of households selling
Handicrafts 27.7 13.2Fishing 27.1 10.6Firewood 97.9 4.0Charcoal 7.3 3.3Woody perennial grasses 37.7 6.0Hunting 15.6 3.6Wild animals and plants 44.2 2.5Wood 4.7 1.9
Source: Loening and Perumalpillai-Essex (2005) based on unpublished data from CAP 1999-00.
87. Education, infrastructure, and market access increase the probability of generating rural wage income. In rural Mozambique, entering the rural wage labor market is mainly determined by private agro-employment opportunities, infrastructure such as electricity and roads, and education (Table 23 in Appendix 2). Once having entered into the labor market, education and market access become key factors to explain rural earnings. Education has here a return of 14.8 percent.76
88. Summing up, rural non-farm employment appears to offer a route out of poverty, however, there is evidence that higher income non-farm jobs go to those with higher

33
levels of education and that women are discriminated against in the non-farm labor market. An important component to develop rural areas and reduce rural poverty is the relationship with non-agricultural activities within rural areas. Currently, there is only limited evidence of mutually reinforcing growth in the agricultural and non-farm sectors. The available evidence also suggests that the development of the non-farm economy is biased toward wealthier households, however, non-farm employment income can expand if regional economies are better diversified into year-round activities, including agroprocessing, services, and manufacturing. As the following chapter shows, a major limitation on such diversification includes the lack of adequate infrastructure, marketing links, and an enabling business environment.

34
35
2. Enabl ing the Rural Environment
89. The previous chapter characterized the agriculture and rural sectors and the effects of agricultural growth on rural poverty. Building on this background, this chapter focuses on the major elements of incentives that can affect the prospects for broad-based growth in agriculture and the rural non-farm sector. The key question is how incentives promote or undermine prospects for growth in agriculture, rural employment, and income.
90. These factors are discussed more fully in this chapter — Mozambique’s rich endowment of natural resources, the macroeconomic environment, structural factors, the institutional environment, and finally, vulnerability and risk issues. Table 17 summarizes the key arguments and presents a score card based on a subjective ratings scheme of the enabling environment (based on internal discussions and World Bank documents, including the 2005 CEM).
91. The main message of this chapter is that Mozambique’s rich endowment of natural resources offers tremendous potential for agricultural growth, however, rural infrastructure, in particular roads and small-scale irrigation schemes, are critical for future growth. Mozambique’s road density of 32 kilometers per square kilometer is the lowest in the region. The low density and quality of the road network severely undermines domestic and regional trade. Mozambique also needs to expand smallholder subsistence irrigation, which has an important role to play in reducing its vulnerability to drought.
92. Second, a multitude of structural factors are a bottleneck to further agricultural growth. These include the need for better use and adoption of agricultural technologies, in particular extension services, input supplies, and rural financial services. On the institutional side, the decentralization agenda and rural producer organizations require further attention.
93. Third, good governance is critical for continued progress in rural poverty reduction. The Government needs to give top priority to implementing an accountable and transparent way to institute reforms. Currently problems of governance and other manifestations of institutional weakness severely undermine the business environment. These weaknesses also undermine cost-effectiveness and financial sustainability of public expenditures.
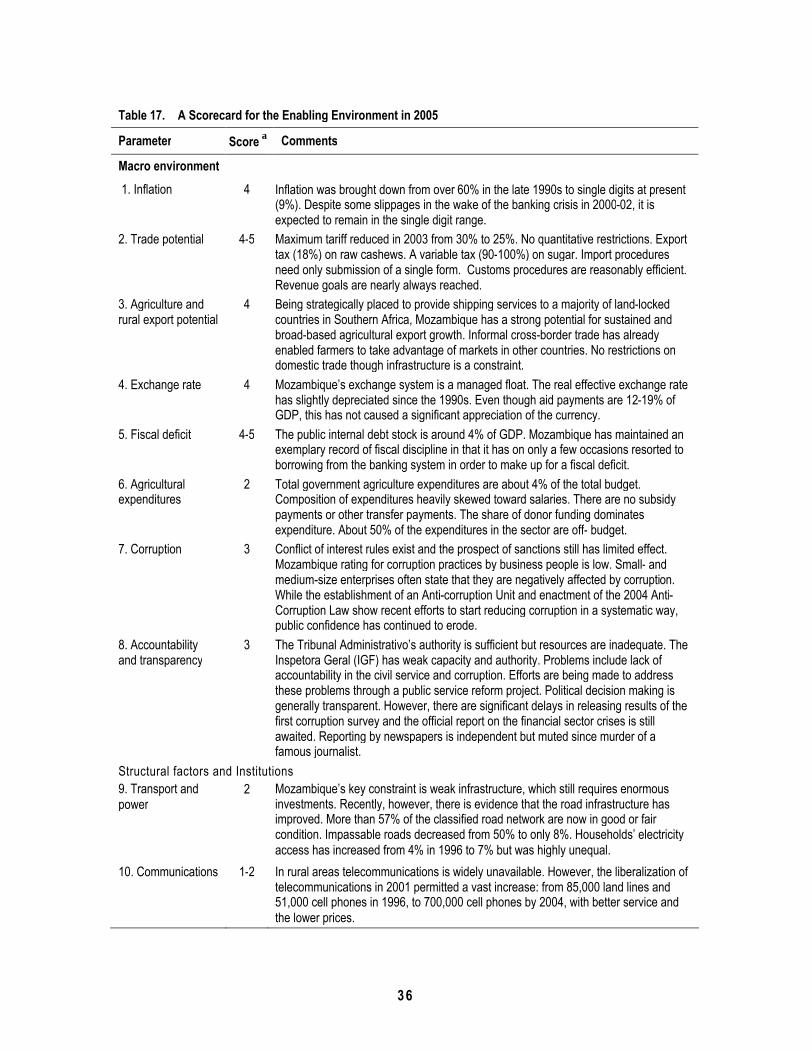
36
Table 17. A Scorecard for the Enabling Environment in 2005
Parameter Score a Comments
Macro environment 1. Inflation 4 Inflation was brought down from over 60% in the late 1990s to single digits at present
(9%). Despite some slippages in the wake of the banking crisis in 2000-02, it is expected to remain in the single digit range.
2. Trade potential 4-5 Maximum tariff reduced in 2003 from 30% to 25%. No quantitative restrictions. Export tax (18%) on raw cashews. A variable tax (90-100%) on sugar. Import procedures need only submission of a single form. Customs procedures are reasonably efficient. Revenue goals are nearly always reached.
3. Agriculture and rural export potential
4 Being strategically placed to provide shipping services to a majority of land-locked countries in Southern Africa, Mozambique has a strong potential for sustained and broad-based agricultural export growth. Informal cross-border trade has already enabled farmers to take advantage of markets in other countries. No restrictions on domestic trade though infrastructure is a constraint.
4. Exchange rate 4 Mozambique’s exchange system is a managed float. The real effective exchange rate has slightly depreciated since the 1990s. Even though aid payments are 12-19% of GDP, this has not caused a significant appreciation of the currency.
5. Fiscal deficit 4-5 The public internal debt stock is around 4% of GDP. Mozambique has maintained an exemplary record of fiscal discipline in that it has on only a few occasions resorted to borrowing from the banking system in order to make up for a fiscal deficit.
6. Agricultural expenditures
2 Total government agriculture expenditures are about 4% of the total budget. Composition of expenditures heavily skewed toward salaries. There are no subsidy payments or other transfer payments. The share of donor funding dominates expenditure. About 50% of the expenditures in the sector are off- budget.
7. Corruption 3 Conflict of interest rules exist and the prospect of sanctions still has limited effect. Mozambique rating for corruption practices by business people is low. Small- and medium-size enterprises often state that they are negatively affected by corruption. While the establishment of an Anti-corruption Unit and enactment of the 2004 Anti-Corruption Law show recent efforts to start reducing corruption in a systematic way, public confidence has continued to erode.
8. Accountability and transparency
3 The Tribunal Administrativo’s authority is sufficient but resources are inadequate. The Inspetora Geral (IGF) has weak capacity and authority. Problems include lack of accountability in the civil service and corruption. Efforts are being made to address these problems through a public service reform project. Political decision making is generally transparent. However, there are significant delays in releasing results of the first corruption survey and the official report on the financial sector crises is still awaited. Reporting by newspapers is independent but muted since murder of a famous journalist.
Structural factors and Institutions9. Transport and power
2 Mozambique’s key constraint is weak infrastructure, which still requires enormous investments. Recently, however, there is evidence that the road infrastructure has improved. More than 57% of the classified road network are now in good or fair condition. Impassable roads decreased from 50% to only 8%. Households’ electricity access has increased from 4% in 1996 to 7% but was highly unequal.
10. Communications 1-2 In rural areas telecommunications is widely unavailable. However, the liberalization of telecommunications in 2001 permitted a vast increase: from 85,000 land lines and 51,000 cell phones in 1996, to 700,000 cell phones by 2004, with better service and the lower prices.

37
Table 17. A Scorecard of the Enabling Environment in 2005a (continued)
Parameter Score a Comments
11. Research and extension
2 The main problem with the agricultural research and extension services is limited coverage and low quality. Only about 13% of rural households have access to extension. The research system is barely functional. Since its inception, agricultural research has gone through many reorganizations and refocus of its mandate. In 2004, the Ministry of Agriculture merged the four research institutes into the new Institute.
12.Inputs supply 1 Inputs supply for agriculture is very weak and is left almost entirely to the private or NGO sector. Currently, only about 4% of rural households use fertilizers and only 5% use pesticides. The use of those chemical inputs is generally concentrated among cash crop growers. About 82% of rural farm households report agricultural seed supply as their main agricultural problem. Animal traction is used by 10%.
13. Rural finance 1 The lack of rural finance is pervasive even by African standards. There has been very little supply of and demand for financial rural services, including the supply of savings and demand for production credit. There is virtually no commercial bank presence in rural areas.
14. Private sector environment
2 The private sector is limited in rural areas. Delays in starting businesses are common. Operational licensing, inspections (labor, health, environment, etc), customs clearance time, and tax requirements/reimbursement present varying level of constraints in doing business. Currently, the high number of uncoordinated inspections, as well as the slow VAT refunds process is more cumbersome than customs clearance. The quality and cost of services in some infrastructure services, including electricity, is inadequate and hampers both investment and productivity.
15. Local government
2 The de-concentration of functions and funds is taking place gradually. In FY05 the Government is providing direct budget support to some districts. The Ministry of Agriculture is one of the few ministries to have devolved functions and funds to the Provincial governments.
16. Community organizations
2 Local community organizations are often weak and only about 5% or rural households belong to a farmer association. However, there has been a growing interest by the donor community and NGOs to promote better coverage and quality of local organizations, with some scattered success.
Vulnerability and risk17. Management of flood and weather-related shocks potential
4 Unlike its neighbors, Mozambique has a relatively well developed system of disaster-preparedness plans that are operational at the district level. This system was able to identify needs during the floods and droughts during the period from 2000 to 2003 and direct humanitarian efforts accordingly.
a. Rating scale: 1 = Unsatisfactory, 2 = Moderately unsatisfactory, 3 = Moderately satisfactory, 4 = Good, 5 = Excellent.Source: Rating schemes are subjective staff estimates based on internal discussions and unpublished background materials.
N a t u r a l R e s o u r c e E n d o w m e n t94. Strong environmental regulatory institutions are required to maximize effective use of Mozambique’s vast land resources and manage water, irrigation, and forests. Farm households occupy only a small portion of a large arable area, but there are still disputes over access to favorable land, and there are no clear policies to manage rural water.

38
Land Abundance and Major Conflicts
95. Mozambique’s agricultural economy is land-abundant and labor scarce. With a rural population density of 16 per square kilometer, farm households could be a theoretical 12 or 13 hectares.77 Shifting rain-fed agriculture of some 3.2 million farm households now occupies about 4.5 million hectares out of an arable area of 36-40 million hectares. Only about 11 percent (or 4.5 million hectares) is cultivated. Nationwide, the ratio of cultivated land to cultivable land is only 0.12 with major variations among provinces.78 These ratios make Mozambique one of the most land-abundant countries in Africa. The combination of abundant land and poorly functioning input markets means that cultivation is likely to continue to be extensive and of low productivity. The HIV/AIDS epidemic threatens to further accentuate the land/labor ratio.
96. Mozambique has relatively low pressure on the cultivable portion of its abundant land resources, but has a troubled heritage of conflict over land use. Disputes over land use are mainly about access to fertile land located in favored climates and competing forms of land use. Until independence, smallholders relied on customary forms of land tenure with conflicts adjudicated by traditional community or tribal elders, and commercial farmers and plantation owners held long leases. Traditional systems of land management are far from egalitarian, and members of the local elite are able to gain access to more and better quality land. The rights of women to inherit rights to use land are insecure and depend on family and other local ties. After independence and under the socialist model, large commercial farms were expropriated and turned into state farms while smallholders were organized into cooperatives. The constitutional principle was that all land belonged to the state. After the end of the civil war in 1992, land conflicts intensified as large numbers of returnees claimed use of their land and investors wanted control over unoccupied areas, but smallholders wanted to reassert their traditional land use rights. A prime objective of the 1997 Land Law (Box 1) was to settle conflicts between smallholders and commercial farmers. An overriding concern of the law was to protect the interests of smallholders practicing shifting cultivation.
Box 1. Basic Provisions of the 1997 Land Law
All land remains property of the state, but land leases can be granted for up to 50 years. These leases are renewable, inheritable, and transferable subject to administrative authorization. One condition for the award of land leases is the presentation of a development plan. If the farmer fails to comply with stipulations of the approved plan, the lease can be cancelled. Investments in land, including infrastructure, can be bought and sold. However, administrative authorization is still required for the transaction to be effective.
Traditional land use rights are recognized and formalized in a system of community land management, implemented through co-titling of community lands. Existing users of the land are protected provided they can demonstrate “good faith” occupation of the land. This demonstration need not be documentary evidence. Verbal evidence from members of the community can be recognized as valid. There is a right to local participation and consultation in the management of natural resources and in procedures leading to the award of land leases in order to protect both traditional community rights and to take account of future needs of communities.
39
97. Implementation of the Land Law provided a measure of stability to smallholders although its implementation is problematic. One basic problem is how to strike a balance between conflicting demands of extensive, low-productivity subsistence agriculture and those of capital-intensive commercial agriculture to promote broad-based higher productivity. The law did not help strike this balance with clear criteria that could be applied in a transparent, unambiguous, and accountable fashion.
98. There are five key problems with the Land Law:
The law has not resolved recurring conflicts between smallholders who practice extensive, shifting cultivation and commercial farmers who practice capital-intensive cultivation.
It has not encouraged partnerships between smallholders and large commercial farmers. Few partnerships have materialized. NGOs argue that the mechanisms for consultation are a charade because smallholders have been displaced without consultation and due compensation.
Commercial farmers (farms over 50 hectares) wishing to invest complain that the procedure for securing leases is cumbersome and costly because of administrative decisions on the viability of the development plan.
The process by which leases are granted is not transparent and is thus prone to corruption. It is a system that encourages the well-connected to obtain access to large holdings at virtually no cost. There is anecdotal evidence that local elites, sometimes in partnership with foreign investors, acquire large tracts of land that remain barely developed or are used only for extensive cattle ranching.
Finally, for smallholders and large commercial farmers alike, land still does not serve as collateral for loans despite the 1997 Land Law. Although there are other factors, smallholders are not credit worthy to commercial banks. Even for commercial farmers, land does not serve as collateral because it is socially very unpopular to actually seize the land.
99. In sum, the Land Law has not promoted long-term investments in agricultural land and there is no evidence that it has improved equitable distribution. Land access for smallholders is reasonably secure but not for large-scale endeavors. In implementation of the Land Law, the right of access that it confers is not secure, enforceable, and transferable without excessive bureaucratic interference and discretion.
Managing Water, Irrigation Investments, and Forest Resources
100. Despite overall water abundance, distribution and investments are problematic. Mozambique should emphasize the management and use of its water resources. The overall institutional and legal framework for the water sector in Mozambique is coherent and largely consistent with good practices in many middle- and high-income countries, but there are no clear policies for rural water management that encompass drought mitigation, irrigation development, and rural water supplies. Rehabilitation of non-operational irrigation schemes and expansion of rural drinking water supplies are
40
targeted, but there is no coherent strategy for issues that are critical to a large part of the population, including most of the poor.
101. Mozambique needs to expand provision of water for smallholder subsistence irrigation that is important to reduce the country’s vulnerability to droughts. The Government could make significant progress by addressing issues related to rural water supplies, irrigation water for smallholder farming, and the operation and maintenance of existing systems. In the context of limited water storage capacity and lack of financial resources, it would be better to improve conditions for smallholder farming rather than commercial irrigation. The best focus would be small-scale, low-cost schemes rather than large projects. Encouraging smallholder irrigation would increase high-value crops and income for some of the nation’s poorest households. Small dams and reservoirs should be built throughout the country in the most drought-prone areas.
102. The country is highly dependent on, and therefore highly vulnerable to, upstream water extraction. Growing use by these riparian neighbors is expected to lower the combined average annual flow in the four large river basins and render it more variable. The current infrastructure to store and manage water is degraded and underdeveloped, with current storage at only 5 percent of the annual run-off, whereas the suggested minimum is 50 percent to provide 80-90 percent assurance.79 Selected reforms could increase irrigation access and reduce the risk to agricultural households from floods and droughts.
103. Transparent allocation of forestry resources remains a challenge. Some 20 percent of the country — about 20 million hectares — is forested. Commercial production is well below sustainable potential and revenue could be much higher. Mozambique has the potential to produce some 500,000 cubic meters per year of sustainable timber but currently produces only about 120,000 cubic meters. Forest license fees account for only 0.4 percent of total government revenue,80 and forestry contributes an estimated 2.5 percent of GDP.81 In an effort to increase domestic value-added, the Government banned wood exports, which now account for less than 1 percent of total wood output. Forest fees were also reduced to encourage domestic value-added, but the current pricing method encourages a high degree of technical inefficiency throughout the production chain. The best approach to pricing advocated by researchers is auction bidding, but effective use of such a mechanism presupposes certain conditions that currently do not exist in Mozambique. A change from the current pricing system to the ideal should be undertaken gradually as basic conditions are established.
Strong Environmental Regulatory Institutions Are Necessary
104. Adequately addressing environmental challenges requires strong institutions and strategic planning. Sustainable and cost-effective exploitation of Mozambican land, water, and forestry resources requires institutions that are designed well, function according known rules, and operate in a transparent and accountable manner. Ideally, such operation would preclude corruption and rent-seeking.

41
Macroeconomic Envi ronment105. The macroeconomic environment includes the record of inflation, trade, and exchange rates; public expenditures in agriculture and the rural sectors; and a look at corruption, accountability, and transparency.
Positive Record of Inflation, Trade, and Exchange Rates
106. Future inflation is expected to remain in the single-digit range. Inflation was at about 70 percent annually in 1994 and through tight monetary policies had been reduced to about 9 percent at the end 2004. The Government did not resort to significant bank borrowing and the stock of internal debt remained at around 4 percent of GDP. In addition, the reduction in inflation is at the cost of instituting high interest rates (e.g., a prime rate of over 35 percent at the end of 2002).82 In mid-2003, the metical lending rate was 34 percent and the deposit rate at 15 percent, with a high spread of 19 percent.83
High and volatile interest rates coupled with an underdeveloped banking sector contribute to the high cost of capital, an issue undermining private investment, particularly for small and medium enterprises. Large firms, however, are less affected by domestic Mozambican interest rates. Some have chosen to operate in dollars instead of the metical.
107. The trade framework has been substantially liberalized since the early 1990s, however, non-tariff barriers still hamper the free movement of products. Mozambique is working toward a Free Trade Agreement with the Southern African Development Community (SADC) countries, which will further reduce tariff, non-tariff, and other barriers to trade. Tariffs have been lowered (for example, the maximum tariff was lowered from 30 percent in the 1990s to 25 percent by 2003) except for the high variable tariff of 50-60 percent on sugar and 18 percent tax on raw cashew exports.84 The trade-weighted average tariff is 9 percent, one of the lowest in Africa.85 The medium-term free trade reform agenda includes a further lowering of tariffs to about 20 percent, and defining technical standards and norms.86 There are no tariffs on imported agricultural inputs such as fertilizers and pesticides, but some items such as plastic bags are still subject to tariffs. These tariffs, established to protect domestic industry, inevitably raise exporters’ costs, such as cashew traders. Most imports of agrochemicals are financed under the Japanese-funded KRII program.87
108. Supply constraints limit expanded international trade. Mozambique has duty- and quota-free access to the EU market under the Cotonou Agreement and the Everything-but-Arms Initiative. Under the Africa Growth and Opportunity Act (AGOA) it has free access to the United States market. Under the SADC Trade Protocol, Mozambique has relatively free access to the South African market. It also has free access to Nordic markets (Denmark, Finland, Norway, and Sweden) through the Nordic/SADC Accord. Unfortunately, supply constraints in Mozambique have undermined its ability to make full use of such market access.
109. With a long coastline and three major ports, Mozambique has a strong agriculture and rural export potential, and in addition, the country is strategically placed to provide shipping services to a majority of regional land-locked countries. In combination with its rich natural resource base in agriculture and mining, it has significant potential to develop
42
a broad export base. Informal cross-border trade has already enabled farmers to take advantage of markets in other countries (Box 2 and Appendix 6). Despite some evidence of non-tariff trade barriers, there are no major restrictions on domestic trade, but poor infrastructure remains a problem.
110. The exchange rate is determined via a managed float with no evidence of overvalue. The real effective exchange rate has slightly depreciated since the 1990s. Even though aid payments have amounted to 12-19 percent of GDP, this has not caused a significant appreciation of the currency. In fact, the real effective exchange rate relative to the 1980 level has depreciated. Furthermore, despite substantial aid flows, Mozambique does not suffer from Dutch Disease phenomena.88 The exchange rate is thus not anti-export.
Significant Weaknesses in Public Expenditures
111. Mozambique has maintained fiscal discipline. The public internal debt is around 4 percent of GDP. The Government has maintained an exemplary record of fiscal discipline in that it has on only a few occasions resorted to borrowing from the banking system in order to make up for a fiscal deficit.
112. The country’s agricultural and rural expenditures are moderate. In 2004, agricultural expenditures were 0.6 percent of GDP and 3.3 percent of total government expenditures. Donor funding dominates investment in agriculture (Fig. 11).89 The Government’s Program for the Eradication of Absolute Poverty 2001-2005 (PARPA) identified six priority sectors for poverty reduction — education, health, infrastructure, governance, agriculture, and macroeconomic management. The priority given to these sectors is apparent when comparing selected budgeted allocations for 2004 (Table 18).The total budget allocated was substantial, at US$3,615.7 million for the whole period.90
As such, Mozambique does not constitute the 10 percent of total government expenditure which was pledged at NEPAD.
Box 2. Non -tariff Trade Barriers with Neighboring Countr ies
Agricultural growth in Mozambique depends on the policies of its neighboring countries. Annual cross-border trade between Mozambique and its neighbors may range from below 100,000 to 200,000 tons for maize, the most important basic food crop. Despite the relative ease with which maize generally crosses the border —most informal trade is carried out by cyclists — one key finding of the study is that the free movement of products across the border is hampered by a number of non-tariff barriers. These include requirements for entry documents, invoices, and certificates, which in most cases cannot be met by traders. The grading, safety, and phytosanitary standards and requirements for import of agriculture produce still vary across the region, although the countries have signed the SADC trade protocol that aims to promote, coordinate, and harmonize regional trade in order to improve food security. Regulatory requirements for transportation across the frontier contribute to the barriers. Although the SADC transport protocol has been signed, harmonization is still required for insurance, road user charges, weight restrictions, and license requirements. Border problems with duties, charges, and restrictions at the discretion of local officials and lack of inspection facilities when quality problems arise are other constraints that hamper the cross border trade.
Source: ECON Analysis (2005). Impact of Policies of Neighboring Countries on Agricultural Growth –Mozambique. Processed. Appendix 6 summarizes the study in more detail.
43
Figure 11. Total and Foreign Investments in Agriculture, 1998-04 (1998 billion meticais)
84 73
29
80
148174
266
248 3 8
108129
219
0
50
100
150
200
250
300
1998 1999 2000 2001 2002 2003 2004
Total budgetary Investment (Agriculture) Foreign Financed
Source: Staff estimates based on Conta Geral do Estado (1998-99) and Relatórios de Execução (2000-04).
113. Agriculture and rural development investments by the Government have increased but allocations and transparency remain an issue. After 2001 there was a marked shift in public expenditures to favor education, health, agriculture, and in particular, roads (Table 18). Their combined share rose from 36 percent of the total 1998 budget to 43 percent in 2004.91 From 1995 to 2004 the main increases in the recurrent budget went primarily to staff salaries, with few increases from the Government. The MINAG budget has been significantly decentralized to the provinces (60 percent), however, the formula for inter-provincial allocations is still not considered economically and socially sound. The major allocation in the MINAG investment budget of 2003 (over 90 percent funded by donors) was for crop agriculture.92
114. Roads have benefited substantially from both internally funded investments and donors. For example, in the 2002 budget the road sub-sector received 23 percent of the internal investment account and 19 percent of the donor-funded account. After education and health, roads are the third highest planned spending sector (as in the other sub-sectors, there is a major difference between allocated and actual expenditures). An increased percentage of roads have been rehabilitated since 1992 (from 10 percent to 57 percent in 2000). Impassable roads decreased from 50 percent to only 8 percent during this period. The Roads and Coastal Shipping Programs I and II (ROCS 1994-02) have made a substantial difference.93
115. Systemic weaknesses undermine the management of public expenditures in Mozambique. These include:
The high share of donor funding. It is not clear how will Mozambique be able to maintain these allocations and achieve fiscal sustainability as donor aid decreases.
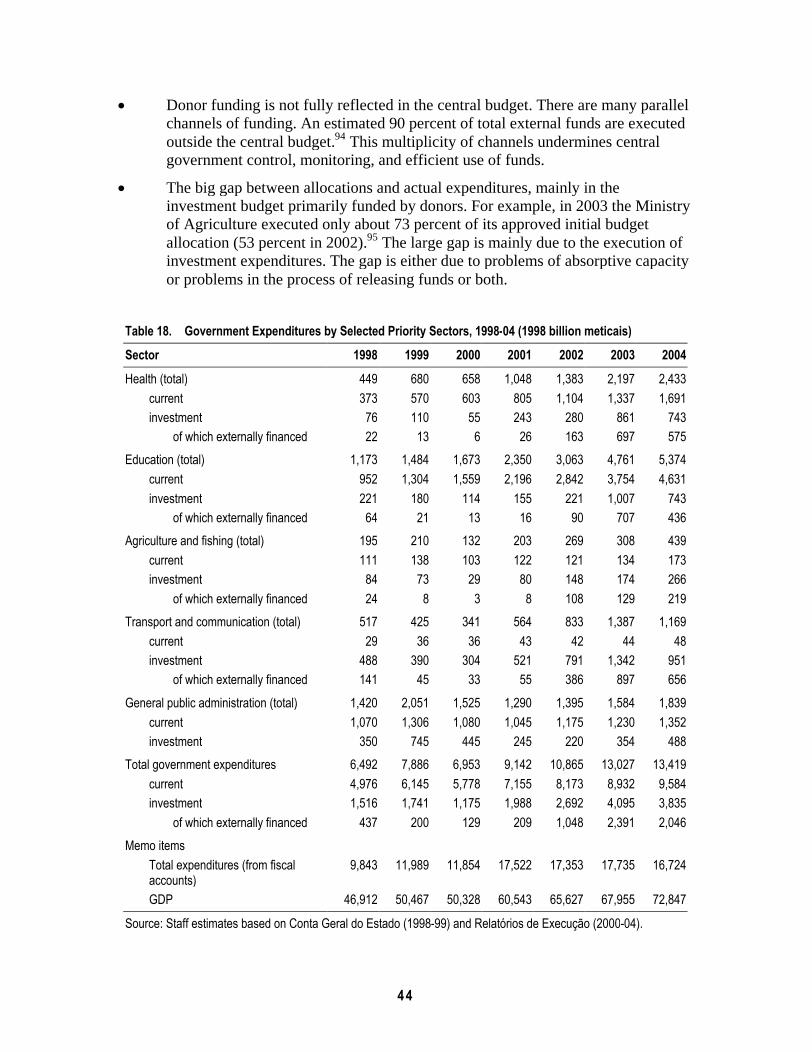
44
Donor funding is not fully reflected in the central budget. There are many parallel channels of funding. An estimated 90 percent of total external funds are executed outside the central budget.94 This multiplicity of channels undermines central government control, monitoring, and efficient use of funds.
The big gap between allocations and actual expenditures, mainly in the investment budget primarily funded by donors. For example, in 2003 the Ministry of Agriculture executed only about 73 percent of its approved initial budget allocation (53 percent in 2002).95 The large gap is mainly due to the execution of investment expenditures. The gap is either due to problems of absorptive capacity or problems in the process of releasing funds or both.
Table 18. Government Expenditures by Selected Priority Sectors, 1998-04 (1998 billion meticais)
Sector 1998 1999 2000 2001 2002 2003 2004
Health (total) 449 680 658 1,048 1,383 2,197 2,433current 373 570 603 805 1,104 1,337 1,691investment 76 110 55 243 280 861 743
of which externally financed 22 13 6 26 163 697 575Education (total) 1,173 1,484 1,673 2,350 3,063 4,761 5,374
current 952 1,304 1,559 2,196 2,842 3,754 4,631investment 221 180 114 155 221 1,007 743
of which externally financed 64 21 13 16 90 707 436Agriculture and fishing (total) 195 210 132 203 269 308 439
current 111 138 103 122 121 134 173investment 84 73 29 80 148 174 266
of which externally financed 24 8 3 8 108 129 219Transport and communication (total) 517 425 341 564 833 1,387 1,169
current 29 36 36 43 42 44 48investment 488 390 304 521 791 1,342 951
of which externally financed 141 45 33 55 386 897 656
General public administration (total) 1,420 2,051 1,525 1,290 1,395 1,584 1,839current 1,070 1,306 1,080 1,045 1,175 1,230 1,352investment 350 745 445 245 220 354 488
Total government expenditures 6,492 7,886 6,953 9,142 10,865 13,027 13,419current 4,976 6,145 5,778 7,155 8,173 8,932 9,584investment 1,516 1,741 1,175 1,988 2,692 4,095 3,835
of which externally financed 437 200 129 209 1,048 2,391 2,046Memo items
Total expenditures (from fiscal accounts)
9,843 11,989 11,854 17,522 17,353 17,735 16,724
GDP 46,912 50,467 50,328 60,543 65,627 67,955 72,847
Source: Staff estimates based on Conta Geral do Estado (1998-99) and Relatórios de Execução (2000-04).

45
Weak accountability and inconsistencies of public expenditure data, in particular for the MINAG budget. The information presented here should be interpreted as best estimates, moreover, the Bank’s review of the overall public expenditure system found numerous weaknesses including budget formulation, coverage, transparency, the system of public accounting and case management, internal controls, and auditing. These weaknesses undermine the efficiency of the allocations (Box 3).
Box 3. Agricultural and Rural Expenditures in Mozambique: Posit ive but Limited Impacts
Agriculture – better coordination of donor aid. The institutional strengthening of the Ministry of Agriculture is showing results in terms of better donor coordination. There is also increased staff training and capacity. Overall staff numbers have increased by about 38 percent (1997 to 2002), however, these are mainly contracted or temporary staff. Agricultural research staff may have actually declined. The quality of the recruited staff is a concern as low salary levels do not attract and retain highly qualified professionals.96 Only 10 percent of the staff are University graduates or with diplomas.
Educat ion – increase of enrol lment but low eff iciency.97 Between 1992 and 2002, there have been dramatic increases in the gross enrollment rate for the first five years of primary education from 56 percent. However, some 37 percent of the children in the 6-11 years old age bracket still do not goto school. For the two years of upper primary education, the increase is from 13 percent to 28 percent, respectively. The gross enrollment rate for secondary education is only 8 percent. Student achievements scores are generally poor.98 Other concerns are: (a) high drop out and repeater rates, (b) high costs of school construction, (c) supply side factors such as the long distance to school, gender inequality bias and language of instruction, (d) sharp regional disparities. For example, the highest levels of illiteracy are in the northern provinces, followed by the central and southern provinces.
Health – outcomes are less than anticipated.99 Selected health indicators show that the health status of Mozambicans is poor, despite expenditure increase and subsequent improvements in infant and child mortality. However, infant and child mortality are still high (129 per 1000 and 200 per 1000 in 2001 respectively). There is also high maternal mortality (160 per 100,000 live births in 2002), and low life expectancy at birth (42 years in 2001). Malaria remains the leading reported cause of death. Various factors undermine the quality of health care delivery, including long distances from health facilities and poor quality of health services. The health system is doing little to curb the current high prevalence of HIV/AIDS which is expected to increase further to around 16 percent by 2010. Mozambique’s prevalence rate of 13.8 percent is twice the Sub-Saharan average of 7.4 percent.
Water – posit ive impact. 100 Rural households are better off as there has been an increase in access to safe water from 12 percent in 1997 to 35 percent in 2001/2. A major issue is the sustainability of the water delivery system as boreholes and hand pumps are poorly maintained. Some 35 percent are broken due to lack of maintenance, non-availability of spare parts, inadequate technical capacity or lack of community commitment to maintain them. Sanitation has received much less emphasis than water supply. In rural areas, government has still to promote hygiene education, sanitation and facilitate small contractors in the building of latrines.
Road infrastructure – posit ive impact. 101 From 1992 to 2002, rural roads have benefited from rehabilitation efforts. The Feeder Roads Program funded by many donors has benefited all provinces but in particular Zambézia and Nampula. Expenditure allocation to district and rural roads has amounted to 24 percent of total spending but at the district level, there is still a negative correlation between road density and poverty. Routine maintenance has improved but periodic maintenance has fallen well below expectation, largely due to funding shortfalls and poor organization. Despite these substantial improvements most rural areas are still isolated. Because of the low population density, unit costs of road construction are high. One of the main problems for rural areas remains the access between these trunk roads and small villages and towns in the interior. Another serious problem is a close correlation between transport routes and the prevalence of HIV/AIDS.

46
116. Small informal businesses often do not have the incentives to enter the formal sector. Small- and medium-size enterprises often complain that they are negatively affected by corruption, which allows dishonest entrepreneurs to avoid compliance with existing laws and regulations while corrupt inspectors receive bribes. While the establishment of an Anti-corruption Unit and enactment of the 2004 Anti-Corruption Law are recent efforts to start reducing corruption in a systematic way, public confidence has continued to erode due to a number of high profile scandals. Significant parts of the media operate outside the influence of government. Reporting by newspapers is independent but muted since the murder of a famous journalist who reported on alleged financial crime. Media publicity provides some deterrent against unethical behavior.
117. Tribunal administrative accountability exists, but while its authority is sufficient, resources are inadequate. The Inspeçcão-Geral Finanças has weak capacity and authority, and accountability in the civil service and corruption are reported. Efforts are being made to address these problems through a public service reform project supported strongly by the President and Cabinet. Decision making is generally transparent. The Government actively attempts to distribute relevant information on progress in implementation of its program on poverty reduction to the general public, although capacity is a constraint. There are, however, significant delays in releasing results of the first corruption survey and the official report on the financial sector crises is still awaited.
Structural Factors and Institut ions118. Infrastructure and institutions are major players in the Mozambican economy, including such factors rural labor, insufficient use and adoption of agricultural technologies, lack of rural finance, unfriendly business environment, pricing policies, and decentralization.
Weak Rural Infrastructure
119. Despite recent progress, rural roads are still underdeveloped and require enormous investments. Mozambique has one of the least dense road networks in southern Africa: 32 kilometers of road per square kilometer compared to the median of 90 kilometer per square kilometer.102 The road infrastructure has improved, with more than 57 percent of the sparse network now in good or fair condition,103 and impassable roads decreased from 50 percent to only 8 percent. The road network is worse in the north and in Zambézia.104 Feeder roads are generally in poor condition and many are impassable, especially during the rainy season. Rural areas are even less densely populated than the average nationwide level at 20 kilometers of road per square kilometer,105 which makes the unit cost of serving rural areas very high. The substantial shortfall in periodic maintenance is another major concern.
120. Development of power and telecommunications in rural areas is in its infancy. Overall, household access to electricity has increased from 4 to 7 percent but is highly unequal, but in rural areas only about 1 percent of households have access to power106
and fewer than 10 percent have access to telecommunications.107 The recent liberalization of telecommunications has had a major positive impact, e.g., extending cell phone service, better services, and lower prices.

47
121. Although irrigated land is estimated at 0.11 million hectares, nearly two-thirds is not currently used.108 Preliminary estimates of total irrigable potential are on the order of some 3 million hectares.109 Households that use irrigation increased from 4 to 11 percent from 1995-96 to 2001-02. The largest part of irrigable land is concentrated in the central and northern parts of Mozambique, with 60 percent in the Zambézi basin. Given the low and erratic rainfall, the southern area (Maputo, Gaza, and Inhambane provinces) needs more irrigation.
122. Currently, there are three types of irrigation schemes:
Large-scale public irrigation schemes such as the Chokwe scheme (22,000 hectares) and the Xai-Xai scheme with about 9,300 hectares in the Limpono Valley. Both are being rehabilitated.
Small-scale irrigation that has been funded by the African Development Bank since 2002. Some 2,200 hectares are being developed in Maputo, Sofala, and Zambézia.
Farmer-run micro-irrigation that is mainly used for dry-season vegetable production.
123. Treadle pumps, now imported from Tanzania and promoted by CARE, are very popular in Nampula province.110 Successful low-cost irrigation schemes are operated by smallholders, for example, in the green zones around the cities of Maputo, Beira, and Quelimane.111
Rural Labor and HIV/AIDS
124. Experts believe that Mozambique is still at an early stage in the evolution of the HIV/AIDS epidemic. The toll in lives and productivity is likely to increase if the current rate is left unchecked. Information from the 2002 agricultural survey provides a snapshot of the impact of HIV/AIDS on agricultural households:
Affected households did not cultivate less land than households that were not affected. This may be because these households are able to attract new adults of prime age or because they had more adults before death.
Contrary to the common belief that AIDS mortality is predominantly among household heads, only one-third of the infected adults who died from the disease were heads of households. The infection rate among household heads, however, is nevertheless devastating because they are roughly 25 percent of the population and play a critical role in supporting their families.
Of those with HIV/AIDS, 62 percent are female. Moreover, 60 percent of caregivers are women. Babies from infected parents have a 25-30 percent chance of being infected. Because women are primarily responsible for household chores and are more likely to work on the farm rather than off the farm, if the disease rate remains unchecked, over time there will be labor shortages at home and on the farm.

48
Households with a female death are three times more likely than non-affected households to bring in a new prime age female, whereas households with a male death are no more likely than non-affected households to bring in a new prime age male. This finding corroborates anecdotal evidence that widowers remarry very quickly whereas widows are left to fend for themselves or are absorbed into their husband’s brother’s households.
Knowledge about seeds is being lost. According to an ICRISAT survey in Chokwe District, knowledge of seeds and transfer of that knowledge varied between men and women by age and by social class. Women are the main carriers of knowledge about seed selection and the conservation process. The high proportion of females among HIV/AIDS victims has implications for the quality of agricultural labor.
125. These findings are cause for grave concern, especially given that the prevalence rate has risen from 3.3 percent in 1992 to 13.6 percent in 2002 and was projected to rise to 14.9 percent in 2004. The prevalence varies by region with the central region with the highest rate at 16.7 percent, the southern region at 16.4 percent, and the northern region at 11.5 percent.112 The prevalence rates are higher when road density is higher. Analysis to date of household responses shows that there is substantial heterogeneity in responses depending on different characteristics of the deceased and of the region (in the north the impact on area cultivated and extent of weeding is substantial and more than in the south). At the national level, the median income of affected households is lower than for non-affected households, but there are regional variations. There is little to no difference in the south, but in the center (with a male death) and in the north (with a female death) the differences are substantial.113 What household responses will be and how well the epidemic is contained will have a fundamental impact on the quality of economic growth and the well being of several generations (see Appendix 7 for a discussion).
Insufficient Use and Adoption of Agricultural Technologies
126. Extension is the responsibility of the National Directorate of Rural Development (DNDR) in the Ministry of Agriculture. The main problem with the agricultural research and extension services is limited coverage and low quality. Currently only about 13 percent of rural households have access to extension. Until 1997, the official extension model adopted by the Government and funded by donors, was the Training and Visit system. PROAGRI I (1999) funded an Extension Master Plan that ended in 2003. The three main pillars of this new approach are: (a) institutional pluralism in the delivery of extension services, (b) an integrated national system of extension, and (c) multiple financing and delivery mechanisms. In addition to DNDR, many NGOs are active in the field of extension.
127. The delivery of extension services faces major challenges. There is disagreement as to whether the fundamental problem is weakness in technical messages (according to the PROAGRI Extension Master Plan) or a disconnect between research and extension. One assertion is that a number of profitable technologies have been developed but extension has failed to disseminate them.114 There is also an ongoing debate about the effectiveness of research in the field — with recent evidence supporting a positive impact
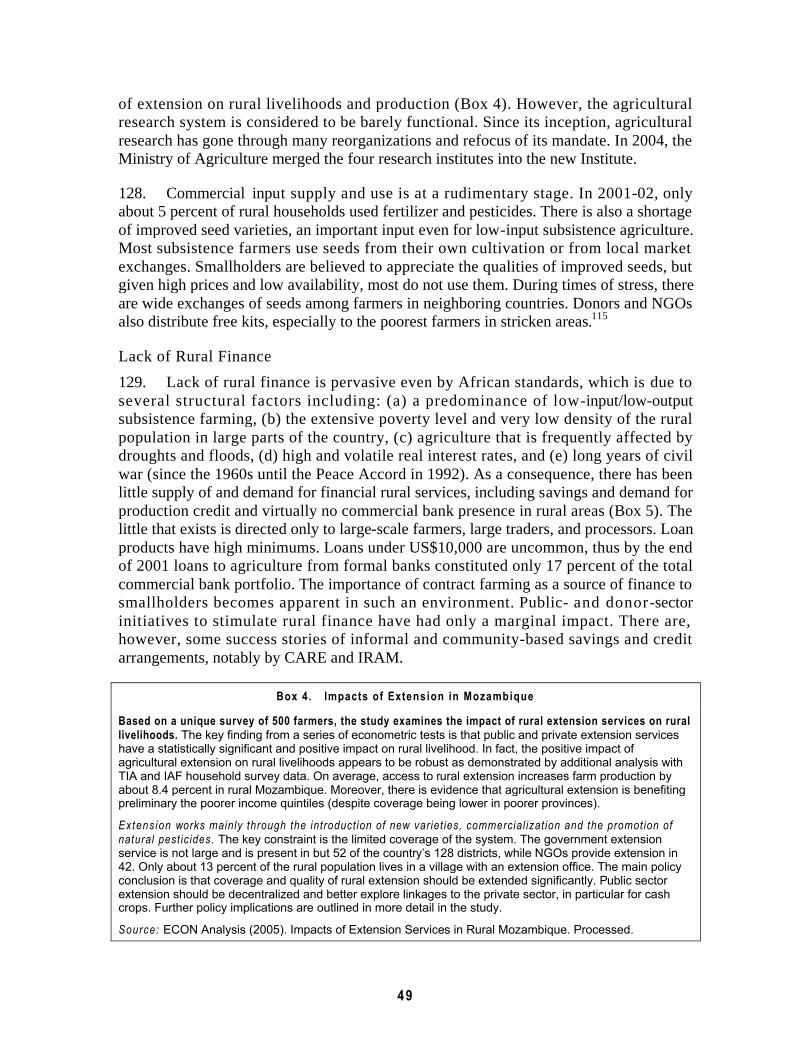
49
of extension on rural livelihoods and production (Box 4). However, the agricultural research system is considered to be barely functional. Since its inception, agricultural research has gone through many reorganizations and refocus of its mandate. In 2004, the Ministry of Agriculture merged the four research institutes into the new Institute.
128. Commercial input supply and use is at a rudimentary stage. In 2001-02, only about 5 percent of rural households used fertilizer and pesticides. There is also a shortage of improved seed varieties, an important input even for low-input subsistence agriculture. Most subsistence farmers use seeds from their own cultivation or from local market exchanges. Smallholders are believed to appreciate the qualities of improved seeds, but given high prices and low availability, most do not use them. During times of stress, there are wide exchanges of seeds among farmers in neighboring countries. Donors and NGOs also distribute free kits, especially to the poorest farmers in stricken areas.115
Lack of Rural Finance
129. Lack of rural finance is pervasive even by African standards, which is due to several structural factors including: (a) a predominance of low-input/low-output subsistence farming, (b) the extensive poverty level and very low density of the rural population in large parts of the country, (c) agriculture that is frequently affected by droughts and floods, (d) high and volatile real interest rates, and (e) long years of civil war (since the 1960s until the Peace Accord in 1992). As a consequence, there has been little supply of and demand for financial rural services, including savings and demand for production credit and virtually no commercial bank presence in rural areas (Box 5). The little that exists is directed only to large-scale farmers, large traders, and processors. Loan products have high minimums. Loans under US$10,000 are uncommon, thus by the end of 2001 loans to agriculture from formal banks constituted only 17 percent of the total commercial bank portfolio. The importance of contract farming as a source of finance to smallholders becomes apparent in such an environment. Public- and donor-sector initiatives to stimulate rural finance have had only a marginal impact. There are, however, some success stories of informal and community-based savings and credit arrangements, notably by CARE and IRAM.
Box 4. Impacts of Extension in Mozambique
Based on a unique survey of 500 farmers, the study examines the impact of rural extension services on rural livelihoods. The key finding from a series of econometric tests is that public and private extension services have a statistically significant and positive impact on rural livelihood. In fact, the positive impact of agricultural extension on rural livelihoods appears to be robust as demonstrated by additional analysis with TIA and IAF household survey data. On average, access to rural extension increases farm production by about 8.4 percent in rural Mozambique. Moreover, there is evidence that agricultural extension is benefiting preliminary the poorer income quintiles (despite coverage being lower in poorer provinces).
Extens ion works mainly through the introduction of new variet ies, commercial izat ion and the promotion of natural pesticides. The key constraint is the limited coverage of the system. The government extension service is not large and is present in but 52 of the country’s 128 districts, while NGOs provide extension in 42. Only about 13 percent of the rural population lives in a village with an extension office. The main policy conclusion is that coverage and quality of rural extension should be extended significantly. Public sector extension should be decentralized and better explore linkages to the private sector, in particular for cash crops. Further policy implications are outlined in more detail in the study.
Source: ECON Analysis (2005). Impacts of Extension Services in Rural Mozambique. Processed.

50
Box 5. Why Credit Markets Function Poorly in Mozambique
Lack of information, inadequate communication, and imperfect contract enforcement are at the heart problems with markets for credit Mozambique.
While credit problems are common in developing countries, they are particularly severe in Mozambique for three main reasons. First, many firms in Mozambique are owned by new entrants who have not yet established a good track record or strong reputation in business. Second, institutions that are designed to reduce information costs and opportunistic behavior are not yet well developed in Mozambique. For example, accounting standards and the practice of the accounting profession are weak. In addition, contract enforcement through the legal system is costly, lengthy, and uncertain. Third, state ownership and uncertain title to land use reduce the assets that firms can use as collateral. Because lenders are unable to accurately assess risk and control a firm’s behavior with detailed contracts, banks are forced to depend on collateral to secure loans. Collateral requirements of 125-300 percent of the loan value are one of the primary reasons why credit becomes unaffordable for many firms.116
Unfriendly Business Environment
130. The domestic business environment is not business-friendly. The quality of Mozambique’s business environment still lags far behind most of its direct competitors in the region, despite moderate improvements. Recurrent complaints include:
Uncertainty in the policy and regulatory environment due to the need for informal payments to officials “to get things done.” For a typical firm, the annual median amounted to 5 percent of annual sales.
Firms cannot rely on the system to settle a dispute fairly and speedily. The accountability and transparency of the legal and judicial system compares unfavorably with the situation in neighboring countries.
Weak tax administration, for example, tax refunds are often delayed.
The long process to register a business. The median time was 138 days and consultants had to be paid US$1,000-1,500 for their services.117 Equally, obtaining a license in the provinces can take on average 135 days, and never less than 25 days, involving significant costs.
Difficulty of access to land because land is state-owned. Firms seek only to gain secure access to the use of land, however, this process is extremely costly because it can take up to an entire year. The process of provisional registration can take up to two years. Some companies surveyed indicated that they had to make illicit payments.
Price Policy and Marketing Environment in Agriculture
131. During the colonial period, Portuguese and Asian traders controlled marketing, but with independence, this system collapsed and price controls then became pervasive in socialist Mozambique. In the late 1980s, the state-controlled system of fixed prices implemented by AGRICOM was dismantled and replaced by the ICM. The administered prices of the socialist era have been replaced by indicative or reference prices. Despite liberalization, farmers still face adverse agricultural terms of trade in major crops. The destruction of markets during the years of turmoil continues to be a major factor undermining incentives for higher productivity growth. The underdevelopment of
51
liberalized market institutions has a major negative effect on smallholders, contract farmers, and larger enterprises as they face a price system that is partly official and partly market determined. The cash and food crop prices that primarily affect smallholders are cotton, tobacco, cashew, and maize. One problem common to all these prices is that there is no premium for quality.
132. Cotton prices are set at 45 percent of world lint price. In comparison to six other Sub-Saharan African countries, Mozambique paid the lowest average producer price during the 1995 to 2002 period.118 Low international prices and the low profitability of cotton farming persistently contribute to the substantial decline of production levels from the peak of 116,000 tons in the 1998-89 season to around 54,000 tons in 2002-03.119 The price is set by the National Commission on Salaries and Prices with input from the Mozambique Cotton Institute (IAM). Mozambique had a system of Joint Venture Companies (JVC) with closed concessions until 1989. These pan-territorial minimum prices are not mandatory, but actual prices rarely rise above these. These JVCs had geographical monopolies in the interlinked cotton input and output markets.
133. In 2000, the Government announced the “open concession” system, however, the system was closed again in 2001 because of outcries of widespread credit default from concession holders. Official prices are announced at the beginning of the marketing season whereas farmers want the announcement to be eight months earlier, at planting time. These pan-territorial prices do not take into account differences in regional transport costs and in quality grades. In addition to the issues of timing and quality differentials, the Mozambican system, characterized as a “concentrated local monopoly” is also subject to abuse by the companies unless the state plays a strong role in periodically evaluating concessionaires and re-tendering concessions. This oversight function by the state does not exist in Mozambique.120
134. Zimbabwe’s problems have greatly boosted incentives for tobacco production in Mozambique. The collapse of tobacco production in Zimbabwe followed the turmoil unleashed by “land reform”. This turmoil led to the migration of some 3.5 million people, along with tobacco companies, to Mozambique.121 Tobacco is still primarily a smallholder crop in Mozambique, although there are commercial and semi-commercial farmers working on contract with big companies. This industry is dominated by three major buyers, all multinationals, although there are eight registered companies. They are entirely free to set prices although MINAG regulates the industry and the National Directorate of Agriculture (DINA) exerts some pressure on grading and pricing. DINA is responsible for monitoring the performance of this contracting system. The number of tobacco farming households increased from 30,000 in 1997-78 to 119,000 in 2002-03. Over the same period, production increased from about 3,000 to 37,000 tons. The companies offer technical assistance and inputs such as seeds and fertilizer. As with cotton concessions, side selling to avoid repayment of credit is a major issue. Experience to date suggests that this problem is reduced when companies work with producer associations.122
135. The liberalization of domestic cashew marketing in 1991-92 removed the export ban on raw cashews and was expected to significantly benefit smallholders by raising

52
producer prices. It was replaced by an export quota and an export tax on raw cashews. The system of fixed prices imposed by the Government was replaced by a system of minimum prices set by the Cashew Committee. In 1991, the National Cashew Institute (Instituto Nacional do Caju, or INCAJU) was privatized and so were all the state-owned factories in 1994. In 1991, Government control over prices offered by the processing industries to producers was also eliminated. There is no tax on processed kernel exports but an export license is still required. The quota was removed and the tax reduced from 60 percent in 1991-92 to 14 percent in 1998-99, and then following protests by industry, again to 18-22 percent, giving processors first right to purchase raw nuts.123
Agroprocessors, however, were hurt because they had to pay that higher price. The liberalization debate was acrimonious before and after the liberalization and over time became a cause célèbre of the anti-globalization movement.124
136. The Bank argued that liberalization would significantly benefit smallholders and that the processing industry would still be competitive without protection.125 Researchers have, however, pointed out that although liberalization raised the prices received by producers, their short-term, static gains have been quite modest.126 The long-term efficiency gains are still being played out. The average income gain per smallholder was around US$5.30 per year. Structural reasons for the small gains to smallholders are market imperfections and high transport costs in the domestic marketing system, and the monopsony buying power of India in international marketing. Moreover, by moving its exports more heavily toward raw as opposed to processed products, liberalization has also hurt Mozambique’s bargaining position vis-à-vis India (which imports more than 84 percent of world’s raw cashews). In comparison to the raw cashew market, the international market for processed cashews, although concentrated, is more competitive.127
137. The processing industry suffered from liberalization in terms of a substantial loss of jobs: an estimated 90 percent of the sector’s labor force of 11,000 workers (2001). Over the last decade, the cashew industry has undergone a major downsizing. The large-scale, capital-intensive plants are not viable. “New generation” factories employ manual processing technologies similar to those found in India. They tend to be located within high volume cashew production areas (Nampula province). At present, 16 such units are operational, with a combined processing capacity of about 13,750 tons and employing nearly 3,000 workers, many on a seasonal basis. Five of these units will process cashew nuts for the first time this season, and at least four new units are expected to come on stream in 2005.128 The high short-term costs were partly due to GOM failure to effectively communicate with stakeholders to be impacted. Th i s f a i lu re o f communication meant that needed adjustments were delayed. The need for effective communication of reform is an oft forgotten lesson.
Major Institutional Challenges: Decentralization
138. A major thrust of PROAGRI I (1999-03) was decentralization of MINAG resources — material, financial, and human. This was accomplished by building up the staff competencies at provincial (DPADRs) and district (DDADRs) levels rather than reducing staff at central levels. These administrative levels benefited by being better
53
equipped and trained. Financial resources were also decentralized. PROAGRI I has developed a planning and budgeting tool that produces annual activity plans and budgets (PAAOs, or Plano Anual de Actividades e Orçamento). This tool facilitates fiscal decentralization, and Extension staff are said to have benefited from this decentralization, however, the pervasive problem of providing incentive levels of remuneration to attract and retain highly qualified staff (especially in rural areas) remains to be solved. Furthermore, PROAGRI I did not develop a sound formula for resource allocation among provinces.129 Future studies to evaluate MINAG’s decentralization efforts are needed.
139. Other ministries operating in rural areas are beginning to decentralize.Mozambique is still highly centralized. Currently, there is a two-track system of decentralization in Mozambique — de-concentration of central government powers and offices to provinces and districts, and devolution of responsibilities and resources to autonomous municipalities. With the passage of the Lei dos Órgãos do Estado (LOLE) in May 2003, the trend toward decentralization was reinforced as LOLE gives power to the Provincial Governor and the District Administrator to merge sectoral directorates intomultisectoral teams. Furthermore, Decree 15/2000 recognizes local authorities as interlocutors between rural communities and the district administration. As part of its recent push toward decentralization, the DNA begun in 2002 to transfer responsibility for local procurement and the payment of contractors to provincial levels. Also, public works capability at district level is gradually being built-up. Districts nominally have responsibility for non-classified roads. For rural water, district responsibility varies from place but place, but many administrations are responsible for the operation and maintenance of piped systems. However, so far there has been no decentralization of funds to district levels. A major constraint to further decentralization is the low population density: an average district has a population of only 125,000.130
140. Participation in local producer organizations is weak. In 2002-03, about 5 percent of rural households belonged to such an organization, thus the vast majority of smallholders do not belong. They operate as individual producers in input and output markets with substantial market failures. Box 6 describes main types of rural producer organizations in Mozambique.
Vulnerabil i ty and Risk 141. Mozambican agriculture suffers a high vulnerability to weather- and market-induced risks. The country is highly vulnerable to floods and droughts, and structural weaknesses further compound these risks. The agricultural economy is still heavily subsistence-oriented — fewer than 10 percent of households sell their surpluses of maize, cassava, or cotton.131 By being largely subsistence oriented, the majority of smallholders reduce their exposure to market-induced risks. The poor are of course particularly vulnerable to weather-induced risks simply by virtue of their deep poverty. The recent floods and droughts amply illustrate their vulnerability. In times of stress, the main coping strategy of the poor is to sell their labor for in-kind remuneration, hunting, fishing, selling charcoal and firewood, and selling livestock. Unfortunately, the in-kind payments of this strategy called ganho-ganho are also lower during times of stress.
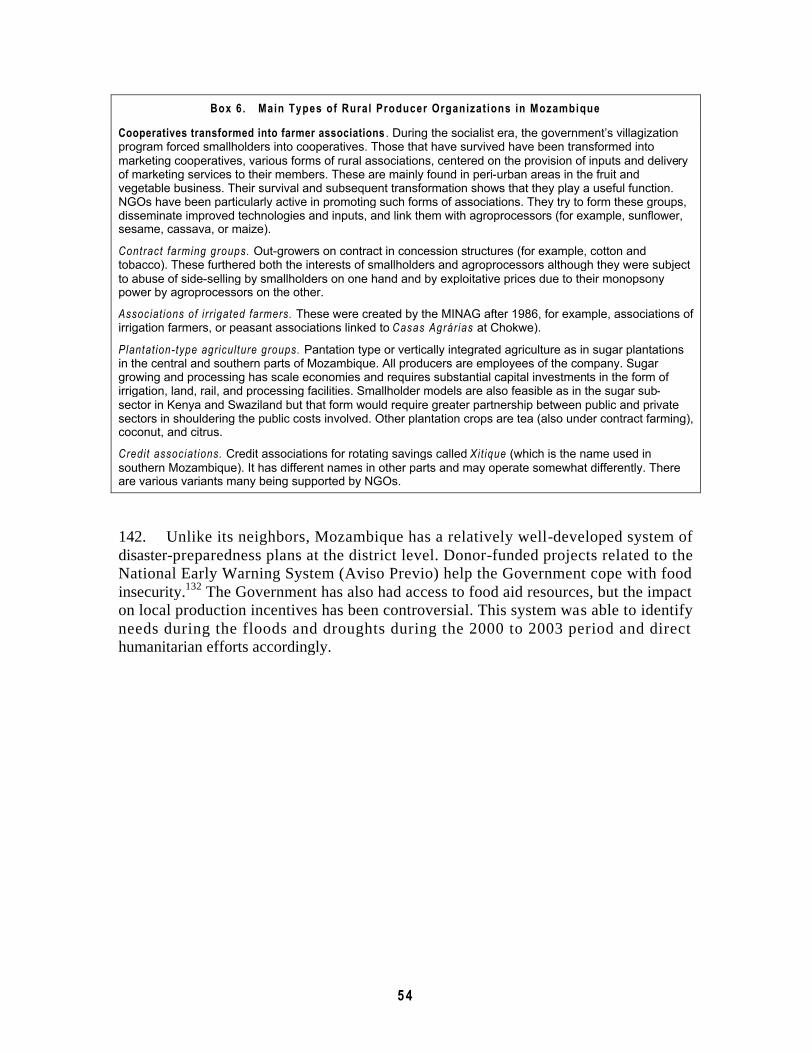
54
Box 6. Main Types of Rural Producer Organizat ions in Mozambique
Cooperatives transformed into farmer associations . During the socialist era, the government’s villagization program forced smallholders into cooperatives. Those that have survived have been transformed into marketing cooperatives, various forms of rural associations, centered on the provision of inputs and delivery of marketing services to their members. These are mainly found in peri-urban areas in the fruit and vegetable business. Their survival and subsequent transformation shows that they play a useful function. NGOs have been particularly active in promoting such forms of associations. They try to form these groups, disseminate improved technologies and inputs, and link them with agroprocessors (for example, sunflower, sesame, cassava, or maize).
Contract farming groups. Out-growers on contract in concession structures (for example, cotton and tobacco). These furthered both the interests of smallholders and agroprocessors although they were subject to abuse of side-selling by smallholders on one hand and by exploitative prices due to their monopsony power by agroprocessors on the other.
Associat ions of irr igated farmers. These were created by the MINAG after 1986, for example, associations of irrigation farmers, or peasant associations linked to Casas Agrár ias at Chokwe).
Plantat ion-type agriculture groups. Pantation type or vertically integrated agriculture as in sugar plantations in the central and southern parts of Mozambique. All producers are employees of the company. Sugar growing and processing has scale economies and requires substantial capital investments in the form of irrigation, land, rail, and processing facilities. Smallholder models are also feasible as in the sugar sub-sector in Kenya and Swaziland but that form would require greater partnership between public and private sectors in shouldering the public costs involved. Other plantation crops are tea (also under contract farming), coconut, and citrus.
Credit associat ions. Credit associations for rotating savings called Xit ique (which is the name used in southern Mozambique). It has different names in other parts and may operate somewhat differently. There are various variants many being supported by NGOs.
142. Unlike its neighbors, Mozambique has a relatively well-developed system of disaster-preparedness plans at the district level. Donor-funded projects related to the National Early Warning System (Aviso Previo) help the Government cope with food insecurity.132 The Government has also had access to food aid resources, but the impact on local production incentives has been controversial. This system was able to identify needs during the floods and droughts during the 2000 to 2003 period and direct humanitarian efforts accordingly.
55
3. Strategy to Promote Growth of Smal lholder Agricul ture
143. Reducing rural poverty in Mozambique requires improving the livelihood of smallholders. Our previous chapters have shown that improving agricultural productivity and production are the key ingredients to reducing poverty,133 an approach that requires transforming subsistence farming into market-oriented farming. In Mozambique subsistence agriculture is land abundant but labor scarce, thus labor productivity must increase. The country has a “dual” economy — a subsistence sector grows food crops that are the main livelihood of over 95 percent of smallholder farmers, but there are also farmers who grow cash crops and subsistence crops. Figure 11 proposes a growth strategy.
144. The strategy is largely based on the vast literature in the country. Additionally, the recommendations are in line with the PROAGRI II strategy paper prepared by MINAG. Hence, this report complements the activities and suggestions of PROAGRI II .
Necessary Condit ions 145. The necessary conditions for this strategy to work are (a) stable macroeconomic conditions, (b) good governance, and (c) control of HIV/Aids. These are core conditions — even if others are in place, without these agricultural development will be limited.
Maintaining a Stable and Supportive Macro and Sector Framework
146. At the macro level, the Government needs to ensure both price stability and fiscal control. It has maintained macroeconomic stability and inflation is under control. Mozambique’s exchange system does not have a negative effect on the agriculture sector. The exchange system is a managed float. The real effective exchange rate has depreciated only slightly since the 1990s. Although donor aid is about 12-19 percent of GDP, the currency has not appreciated or adversely affected the agriculture sector. The Government should ensure that the exchange rate is responsive to market trends.
147. Mozambique has open and competitive input and output markets for agricultural commodities. Unlike its neighbors, the Government does not substantially interfere in the input and output markets for agricultural produce. The only exception is in the case of maize processing where there may be an ad hoc value-added tax. An uncertain policy framework can have a negative impact on the sector.
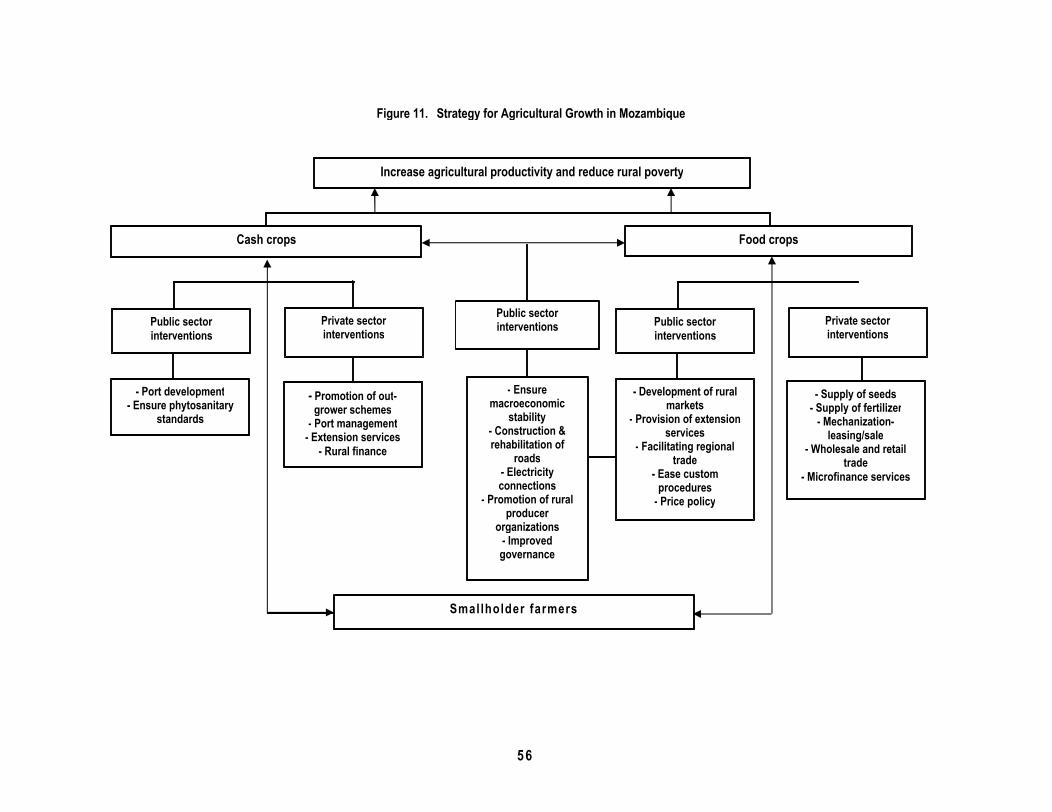
56
Increase agricultural productivity and reduce rural poverty
Cash crops Food crops
Figure 11. Strategy for Agricultural Growth in Mozambique
- Port development- Ensure phytosanitary
standards
- Promotion of out-grower schemes
- Port management- Extension services
- Rural finance
- Development of rural markets
- Provision of extension services
- Facilitating regional trade
- Ease custom procedures
- Price policy
- Supply of seeds- Supply of fertilizer
- Mechanization-leasing/sale
- Wholesale and retail trade
- Microfinance services
- Ensure macroeconomic
stability- Construction & rehabilitation of
roads- Electricity connections
- Promotion of rural producer
organizations- Improved governance
Public sector interventionsPublic sector
interventions Private sector interventions
Public sector interventions
Private sector interventions
Smallholder farmers
57
148. Mozambique needs to strengthen its fiduciary accountability to ensure that there is cost effective infrastructure development. Unit costs for infrastructure are high compared to other countries in the region, and hence expenditures need to expand with careful financial management to ensure donor funding. Improvements are underway with the introduction of SISTAFE — an integrated electronic financial management system. Regulations and institutions governing procurement are being revised.
149. Current planning and budgeting systems also need to be augmented. A major issue is the delay in timely release of funds to the Ministry of Agriculture, which has affected activities on the ground, especially extension and research services. Additionally, nearly 60 percent of expenditures in the sector are off-budget, which creates adverse conditions for the Government’s medium-term planning. The onset of SISTAFE will help ensure that all budgets and expenditures are captured and Ministries can plan for a medium-term expenditures.
Good Governance
150. Improving governance is critical, including accountability and transparency of government administration. This includes negotiations with neighboring countries to formalize trade and strengthen institutions and systems for rational allocation of land-use rights, as well as land tenure security to facilitate investment, diversification, and ensure that natural resources are used in a sustainable and equitable manner.
Control of HIV/AIDS
151. Containing high costs and decreasing vulnerability to HIV/AIDS in the agriculture and rural sectors are critical. This epidemic is nationwide and should be approached using a multisector or holistic view. Because women are mainly responsible for food crops and the HIV/AIDS prevalence rate is higher among younger women, the loss of female labor should be of major concern to MINAG in structuring its extension efforts. The Government’s draft PROAGRI II (2004) document has an HIV/AIDS strategy that includes responses to these effects:134
LOSS OF AGRICULTURAL LABOR. Improve distribution of seed varieties that are labor saving, develop tools that are labor saving, in particular for food processing, orient training and extension programs for new types of agricultural labor, youth, and the elderly.
LOSS OF ONE PARTICULAR LABOR SOURCE. Diversify household income by helping households develop different income sources.
PROTECT WIDOWS. Develop programs so that widows are protected and have security in terms of their access to land.
FOOD INSECURITY AND MALNUTRITION. Use extension services to promote crops rich in vitamins and protein, increase training to balance diets, coordinate with food-for-work programs, school lunches, and other funded programs.
INCREASED VULNERABILITY. Pilot insurance schemes to assist farmers in developing activities to reduce risks.

58
152. An holistic approach is necessary to halt the AIDS epidemic. MINAG, through DNER, (nominated as the coordinator) has also conducted special activities to raise awareness and combat spread of the epidemic. These include radio programs and distribution of free condoms to staff. The loss of MINAG staff is itself alarming. An estimated 17 percent (1,800-2,400 staff) are already infected. If nothing is done between 2004 and 2010, the projected loss could be US$13 million. Despite these sobering estimates, there is still no evidence of widespread adoption of prevention practices and behavior changes. This latter finding suggests that the root of the epidemic goes well beyond lack of knowledge or access to means of prevention. Several other organizations have plans to combat HIV/AIDS, e.g., MISAU (health), MEC (education and culture), NGOs, faith-based organizations, and civil society. Given these many actors and their plans, it is time to review an holistic strategy.
T w o -pronged Strategy153. Promoting growth in the agriculture sector requires a two-pronged strategy — for food crops and cash crops. Livestock activities would augment household income for all smallholders. The food crop sector includes basic foods that are the mainstay of subsistence farmers, while cash crops include primarily tobacco, cashew, cotton, sugar, and tea (the last two are marginal). Table 19 provides key issues and actions in the short, medium, and long term to provide the necessary impetus to growth. Some actions required by the public sector will affect both food and cash crops. What is important to keep in mind is that smallholders make up 97 percent of the farming community and that 16 percent of cash crop farmers grow both commercial and food crops.
Priorities for the Food and Cash Crop Sectors: Basic Infrastructure
154. Transaction costs can be greatly reduced by investments to develop transport and utilities (power, telecom) infrastructure. Rural feeder roads from farms to markets are key to unlocking the potential for agricultural growth. This is an essential role for the Government, and requires substantial investments. Given the enormity of this task, these long-term investments should be undertaken in stages. In the short- to medium-term the Government should identify key areas that have high growth and poverty reduction potential, i.e., agronomic potential, extensive poverty, relatively high population density, potentially lucrative markets nearby, a nucleus of market infrastructure to build on, and the presence of functioning local government and non-government agencies. A set of transparent criteria must be selected to choose economic corridors before developing any specific regional infrastructure development plan. Improving rural access will expand cultivable farmland and promote rural non-farm activities that are at an early stage of agricultural transformation — processing, petty trade, tree felling and charcoal making, and construction.
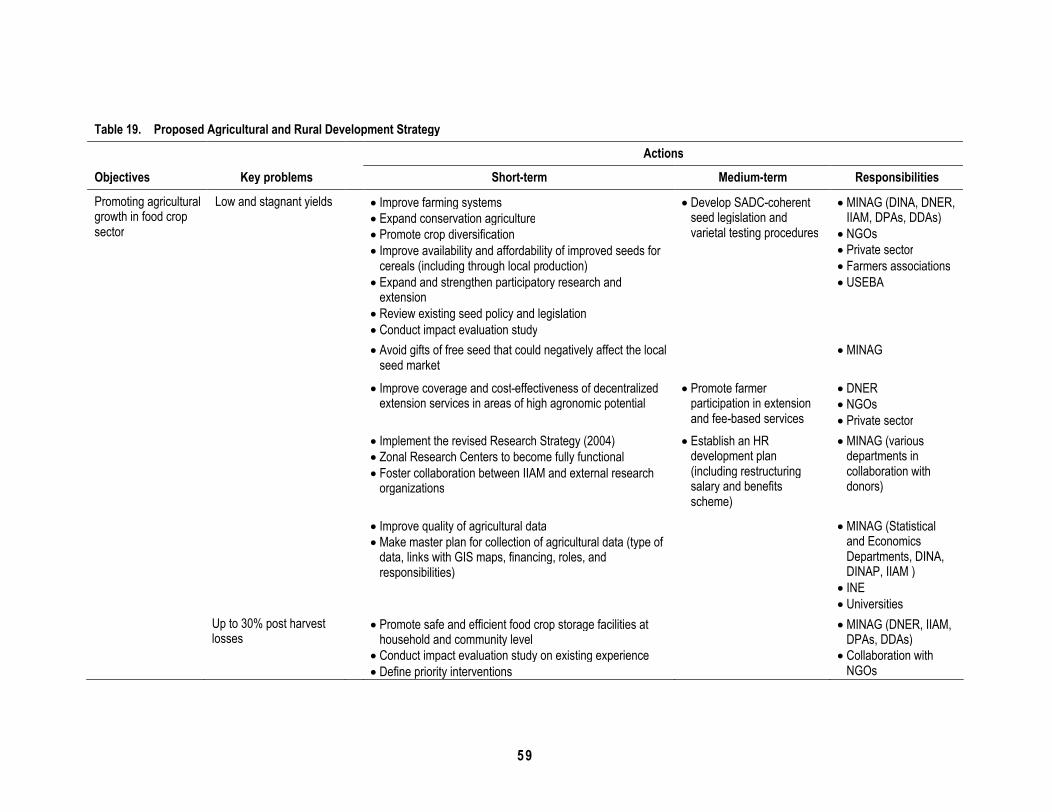
59
Table 19. Proposed Agricultural and Rural Development Strategy
Actions
Objectives Key problems Short-term Medium-term Responsibilities
Promoting agricultural growth in food crop sector
Low and stagnant yields Improve farming systems Expand conservation agriculture Promote crop diversification Improve availability and affordability of improved seeds for
cereals (including through local production) Expand and strengthen participatory research and
extension Review existing seed policy and legislation Conduct impact evaluation study
Develop SADC-coherent seed legislation and varietal testing procedures
MINAG (DINA, DNER, IIAM, DPAs, DDAs) NGOs Private sector Farmers associations USEBA
Avoid gifts of free seed that could negatively affect the local seed market
MINAG
Improve coverage and cost-effectiveness of decentralized extension services in areas of high agronomic potential
Promote farmer participation in extension and fee-based services
DNER NGOs Private sector
Implement the revised Research Strategy (2004) Zonal Research Centers to become fully functional Foster collaboration between IIAM and external research
organizations
Establish an HR development plan (including restructuring salary and benefits scheme)
MINAG (various departments in collaboration with donors)
Improve quality of agricultural data Make master plan for collection of agricultural data (type of
data, links with GIS maps, financing, roles, and responsibilities)
MINAG (Statistical and Economics Departments, DINA, DINAP, IIAM ) INE Universities
Up to 30% post harvest losses
Promote safe and efficient food crop storage facilities at household and community level Conduct impact evaluation study on existing experience Define priority interventions
MINAG (DNER, IIAM, DPAs, DDAs) Collaboration with
NGOs

60
Table 19. Proposed Agricultural and Rural Development Strategy (continued)
Actions
Objectives Key problems Short-term Medium-term Responsibilities
Promoting agricultural growth in food crop sector
Limited access to well-functioning input and output markets
Develop nationwide criteria on priority areas for investments in marketing development Develop rural feeder roads to link villages to major
transport routes Increase HIV/AIDS prevention education programs in areas
of higher road density Promote dissemination of price and other market
information
Promote regional integration of markets (e.g., policy, rules of market functioning, infrastructure) Develop rural marketing
infrastructure Build roads,
communication, including ICT Develop and standardize
basic weights and measures
MIC in coordination with NGOs Local governments in
coordination with NGOs SIMA, SIMAP, radio
and television Farmer associations in
coordination with DDAs and extension services
Widespread land tenure insecurity despite land abundance due to corruption
Implement the Land Law to promote security of land tenure Develop accountable and transparent modalities of allocating leasehold rights
DPA and local/traditional authorities
Develop clear criteria for allocation of leasehold rights to balance demands of smallholder and large commercial users
MPD MINAG
Promoting agricultural growth in cash crop sector (tobacco, cotton)
Monopsony concessions subject to improvements Low long-term
incentives to both industries and farmers High level of side-selling
by out-growers
Instituto do Algodão de Moçambique to screen quality and track record of companies before granting concessions
GOM to promote policies to ensure quality of cash crop production through the use of improved seed and pricing
IAM (cotton) DINA (lack of
institutional coverage)

61
Table 19. Proposed Agricultural and Rural Development Strategy (continued)
Actions
Objectives Key problems Short-term Medium-term Responsibilities
Promoting agricultural growth in cash crop sector (tobacco, cotton)
Monopsony concessions subject to improvements Low long-term
incentives to both industries and farmers High level of side-
selling by out-growers
GOM to develop performance contracts and monitor company performance
MINAG
GOM to increase bargaining power of out-growers by transferring government share to out-grower associations and promoting out-grower or farmer associations
GOM to develop a strategy to promote rural financial intermediation
FARE
GOM to promote contract farming by developing a cash crop sector Policy on basic rights and
responsibilities of out-growers, companies, and government Accountable and
transparent modalities of enforcement of these rights and responsibilities
IAM (cotton) DINA (partially for
tobacco)
GOM to promote out-grower association/representation in management decisions on price setting that could include a revision of the pricing model
IAM NGOs

62
Table 19. Proposed Agricultural and Rural Development Strategy (continued)
Actions
Objectives Key problems Short-term Medium-term Responsibilities
Promoting agricultural growth in cash cropsector (tobacco, cotton)
Monopsony concessions subject to improvements Low long-term
incentives to both industries and farmers High level of side-
selling by out-growers
Efforts to reduce side-selling by out-growers: Technical support in
development of monitoring systems used by the associative movement, focusing on key criteria related to long-term sustainability Development of a
voluntary system of quality certification and control for farmer associations involving the creation of a small civil society body with this mandate, aiming at accountability Maintain an up-to-date
statistical database on the performance of associations, focusing on key performance indicators including market penetration and default Increasing professionalism
of farmer associations, simplification of the legislation of farmer associations
Specialized agencies would need to be created
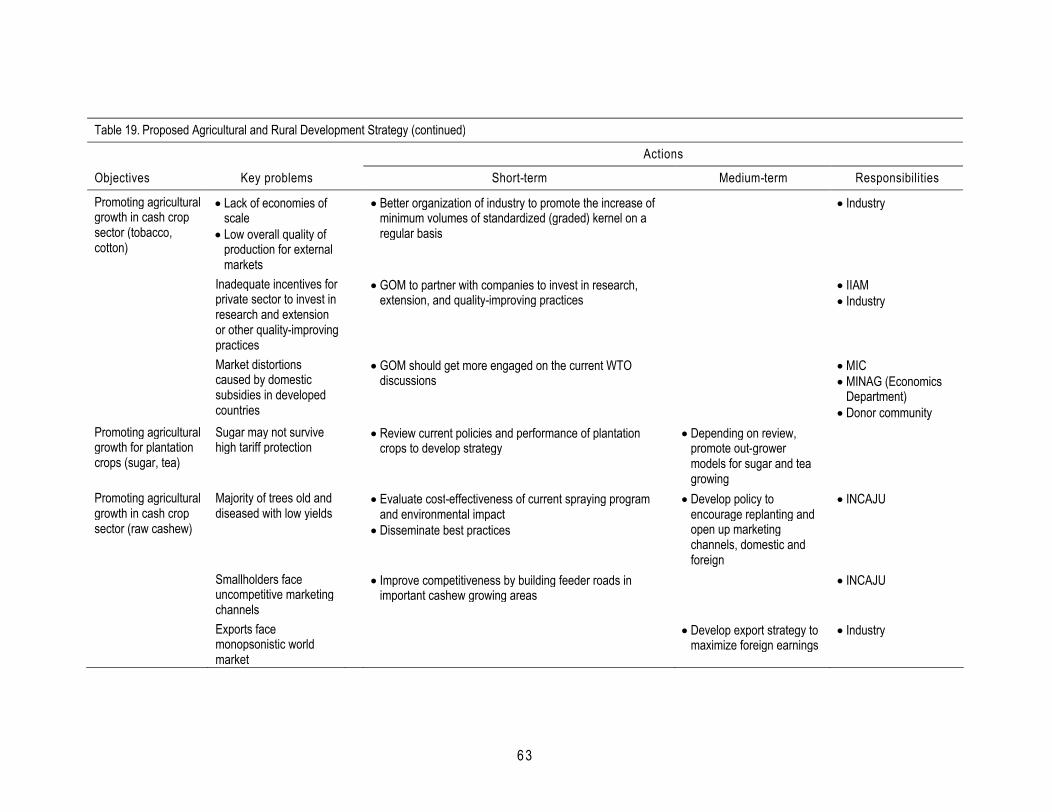
63
Table 19. Proposed Agricultural and Rural Development Strategy (continued)
Actions
Objectives Key problems Short-term Medium-term Responsibilities
Promoting agricultural growth in cash crop sector (tobacco, cotton)
Lack of economies of scale Low overall quality of
production for external markets
Better organization of industry to promote the increase of minimum volumes of standardized (graded) kernel on a regular basis
Industry
Inadequate incentives for private sector to invest in research and extension or other quality-improving practices
GOM to partner with companies to invest in research, extension, and quality-improving practices
IIAM Industry
Market distortions caused by domestic subsidies in developed countries
GOM should get more engaged on the current WTO discussions
MIC MINAG (Economics
Department) Donor community
Promoting agricultural growth for plantation crops (sugar, tea)
Sugar may not survive high tariff protection
Review current policies and performance of plantation crops to develop strategy
Depending on review, promote out-grower models for sugar and tea growing
Promoting agricultural growth in cash crop sector (raw cashew)
Majority of trees old and diseased with low yields
Evaluate cost-effectiveness of current spraying program and environmental impact Disseminate best practices
Develop policy to encourage replanting and open up marketing channels, domestic andforeign
INCAJU
Smallholders face uncompetitive marketing channels
Improve competitiveness by building feeder roads in important cashew growing areas
INCAJU
Exports face monopsonistic world market
Develop export strategy to maximize foreign earnings
Industry
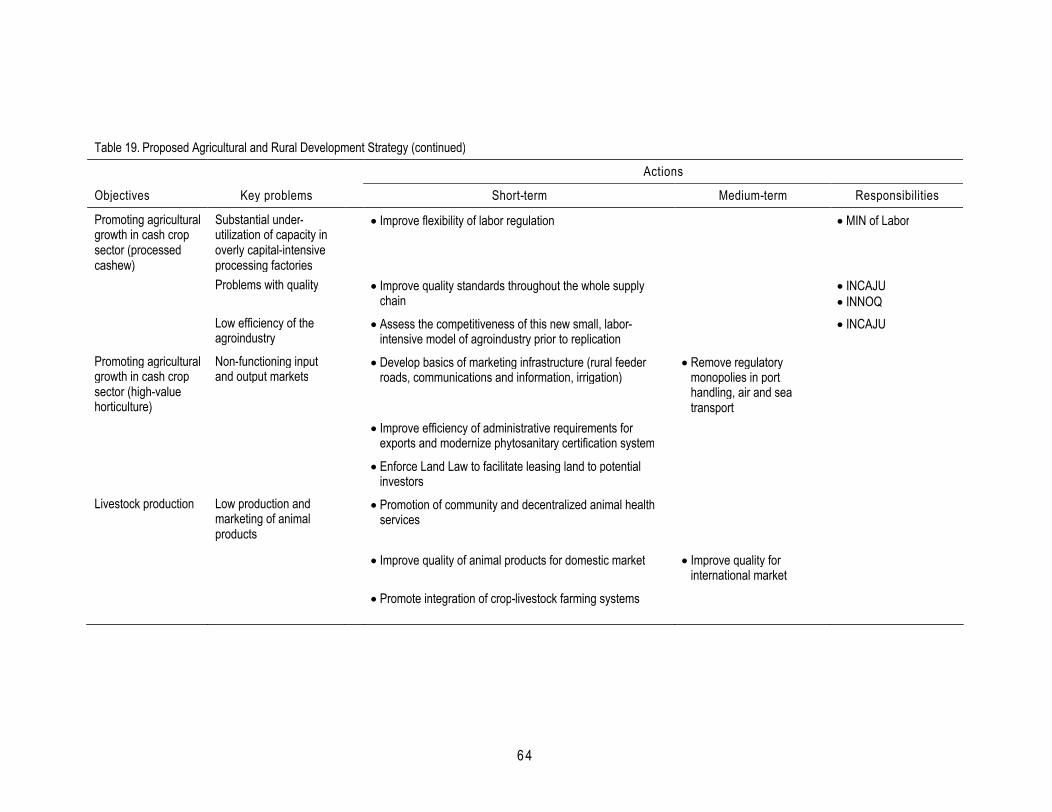
64
Table 19. Proposed Agricultural and Rural Development Strategy (continued)
Actions
Objectives Key problems Short-term Medium-term Responsibilities
Promoting agricultural growth in cash crop sector (processed cashew)
Substantial under-utilization of capacity in overly capital-intensive processing factories
Improve flexibility of labor regulation MIN of Labor
Problems with quality Improve quality standards throughout the whole supply chain
INCAJU INNOQ
Low efficiency of the agroindustry
Assess the competitiveness of this new small, labor-intensive model of agroindustry prior to replication
INCAJU
Promoting agricultural growth in cash crop sector (high-value horticulture)
Non-functioning input and output markets
Develop basics of marketing infrastructure (rural feeder roads, communications and information, irrigation)
Remove regulatory monopolies in port handling, air and sea transport
Improve efficiency of administrative requirements for exports and modernize phytosanitary certification system
Enforce Land Law to facilitate leasing land to potential investors
Livestock production Low production and marketing of animal products
Promotion of community and decentralized animal health services
Improve quality of animal products for domestic market Improve quality for international market
Promote integration of crop-livestock farming systems
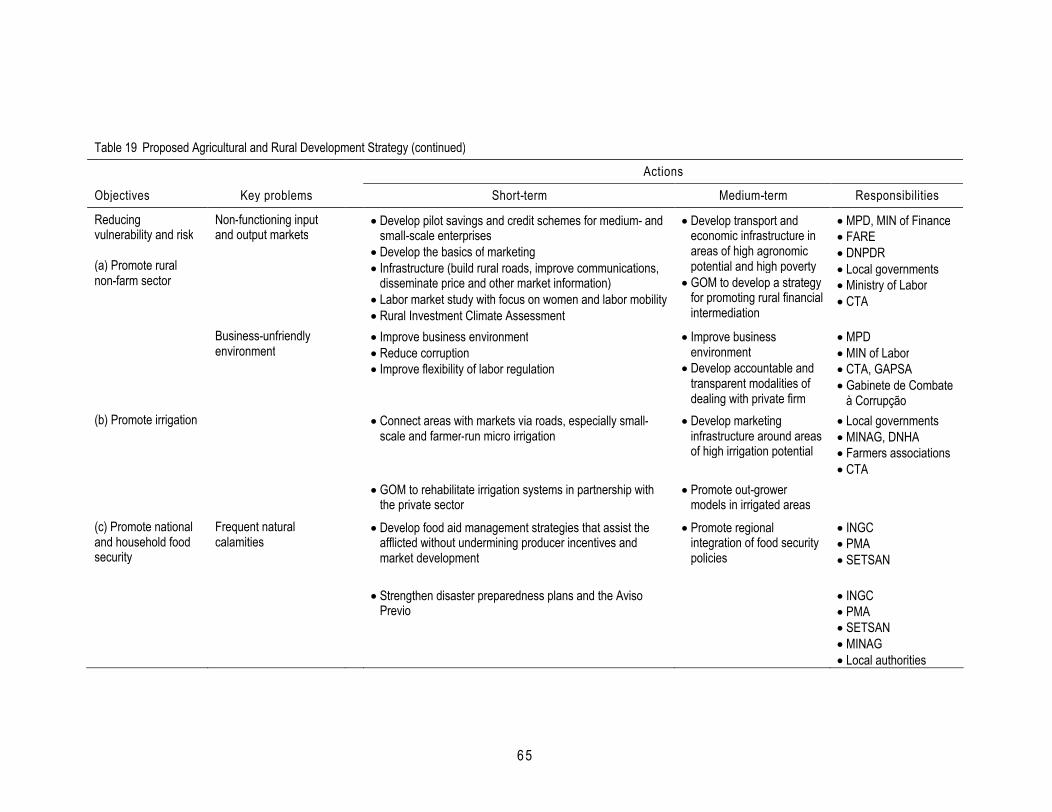
65
Table 19 Proposed Agricultural and Rural Development Strategy (continued)
Actions
Objectives Key problems Short-term Medium-term Responsibilities
Reducing vulnerability and risk
(a) Promote rural non-farm sector
Non-functioning input and output markets
Develop pilot savings and credit schemes for medium- and small-scale enterprises Develop the basics of marketing Infrastructure (build rural roads, improve communications,
disseminate price and other market information) Labor market study with focus on women and labor mobility Rural Investment Climate Assessment
Develop transport and economic infrastructure in areas of high agronomic potential and high poverty GOM to develop a strategy
for promoting rural financial intermediation
MPD, MIN of Finance FARE DNPDR Local governments Ministry of Labor CTA
Business-unfriendly environment
Improve business environment Reduce corruption Improve flexibility of labor regulation
Improve business environment Develop accountable and
transparent modalities of dealing with private firm
MPD MIN of Labor CTA, GAPSA Gabinete de Combate
à Corrupção(b) Promote irrigation Connect areas with markets via roads, especially small-
scale and farmer-run micro irrigation Develop marketing
infrastructure around areas of high irrigation potential
Local governments MINAG, DNHA Farmers associations CTA
GOM to rehabilitate irrigation systems in partnership with the private sector
Promote out-grower models in irrigated areas
(c) Promote national and household food security
Frequent natural calamities
Develop food aid management strategies that assist the afflicted without undermining producer incentives and market development
Promote regional integration of food security policies
INGC PMA SETSAN
Strengthen disaster preparedness plans and the Aviso Previo
INGC PMA SETSAN MINAG Local authorities

66
Table 19. Proposed Agricultural and Rural Development Strategy (continued)
Actions
Objectives Key problems Short-term Medium-term Responsibilities(c) Promote national and household food security
HIV/AIDS epidemic Promote labor-saving inputs and tools, e.g. seeds, techniques of food processing, extension advice targeted to women
Develop a multisectoral strategy to combat spread of HIV/AIDS
Promote diversification of smallholder household incomes Promote HIV/AIDS prevention education and information
Protect widows in terms of access to land and tenure security
MINAG Direção Nacional de
TerrasWidespread malnutrition Strengthen extension services to promote crops rich in
vitamins and protein Provide training to combine foods so households have
balanced diet
Promote adult literacy and basic education to improve knowledge of nutrition, health, public hygiene and sanitation, and prevention of HIV/AIDS transmission
Coordinate with food-for-work programs, school lunches, and other funded programs

67
155. Smallholders depend on rainfall and hence are extremely vulnerable to the vagaries of nature. Total irrigated area is less than 3 percent of total arable land. Due to climate changes, rainfall has decreased in the high-potential north and central regions and rivers run low due to water use by the upstream population. The potential to develop irrigation systems and use groundwater must be exploited. There is tremendous potential to conserve water in small dams for irrigation purposes; additionally, the potential to use the Zambezi River and other major waterways for irrigation needs to be explored, but would require detailed studies and agreements with upstream users.
Strategy for Growth of Food Crops: Develop Rural Markets
156. Building roads will help to develop markets for both inputs and outputs. The large margins from producer prices to export prices or in the case of imported goods, from import price to consumer price, is a reflection of the existing weak internal trade system. High transaction costs keep smallholders out of the market. Rural market development in a country that is sparsely populated requires planning and development — it is important to increase food security and the income of smallholders. The role of Government is to create an appropriate institutional framework and create the infrastructure. Institutional changes are required to make sure that markets are competitive and efficient, which includes providing incentives for the private sector to participate in market development and for local governments to be involved. Managing markets can be lucrative for many local governments. Similarly, market information systems are key for a competitive system to evolve. The private sector can play an important role in setting up the necessary infrastructure via information technology. Small traders and processors can play an active role in promoting market activities.
157. As with rural road construction, infrastructure for market development must also be geographically targeted. New and rehabilitated roads should ensure that traditional markets are also upgraded, including water supplies, electricity, and storage facilities. A market with all the necessary amenities from storage facilities to information on inputs and outputs could help reduce transaction costs and ensure that smallholders obtain competitive prices.
Other Recommendations
158. Because output prices are determined by prevailing market conditions, the Government can affect their structure primarily through interventions that facilitate domestic, border, and external trade. Ad hoc taxation of the local maize trade in the name of food security can be particularly harmful to markets just at a time when the Government is trying to promote them. Although the use of commercial inputs such as fertilizers is low today, it is nevertheless important for the Government not to undermine private sector involvement when the demand grows, for example, by giving away inputs the way many NGOs distribute free seeds. Mozambique has a long history of free seeds given as humanitarian relief following droughts and floods. Largely as a result, 37 percent of its 128 administrative districts had no retail seed store in the early 2000s. Because improved seeds are a major carrier of improved technology, their supply is important. In addition to improving supply, the pricing of seeds also needs to be reviewed

68
to satisfy commercial viability for farmers and suppliers alike. More broadly, the Government needs to review existing seed policy and legislation.
159. Seed policy is not straightforward because improved seeds have both public and private good components. Because of low margins in a primarily subsistence agriculture, the private sector has no interest in supplying subsistence farmers with seed. In principle, the National Agricultural Research Institute (IIAM) is to supply foundation seed for multiplication by private growers, including companies and farmer associations. Demand for seed would be enhanced with more and better roads and links to markets.
160. While essential to raising productivity, improving yield alone is not sufficient if not accompanied by efforts to reduce post-harvest losses. Investments in appropriate low-cost storage systems should be made with farmer participation. There are models in the country that can be replicated.
161. Agricultural research and extension services in areas of high agronomic potential should be strengthened. Building research and extension capacity is a long-term endeavor. Although this strategy is for the short-term, strengthening these services at decentralized levels is included because in the short term the foundations of a responsive research and extension system need to be established. Rates of return to research and its associated extension for maize and cassava are high, estimated at 25 to 35 percent.135 InMozambique substantial institutionally-oriented work has already started (e.g., the master plan for extension). The revised Research Strategy (2004) should be implemented.
162. Concerns of an institutional nature include wrestling with several issues —increasing staff strength, especially at decentralized levels, improving morale, raising low salaries, high turnover, job insecurity, and equipping staff. There are also the recurrent issues of inadequate and unpredictable funding, which has improved somewhat under PROAGRI I, and the link between research and extension. A fundamental strategic issue for Mozambique is not whether to invest in such basic services but what should be the priority areas given resource constraints, especially qualified staff. The answer in principle is straightforward — crops in which private sector companies are not interested but that can make a major difference to the majority of smallholders. Self-pollinating crops fall in this category. The research priorities of PARPA are in basic crops — maize, cassava, beans, rice, cashews, and cotton, thus researchers should identify and focus on the most pressing short-term constraints.
163. The determination of an adequate research and extension policy to serve subsistence farmers and help them transition to higher productivity agriculture must deal with issues of the internal organization, funding of these services, and the role of NGOs and biotechnology, as well as issues of how to combine service delivery with other infrastructure and institutional improvements of markets. Resolution of these issues must be based in part on disaggregated information on specific regions. To help IIAM better address these difficult issues, the collaboration of IIAM and other research institutes (e.g., EMBRAPA and CGIAR) should also be promoted.

69
164. In labor-scarce agriculture, sustaining higher yields is likely to require increased mechanization, especially with labor shortages as a result of HIV/AIDS. Moreover, mechanization is an integral part of a broader technology package. The role of the private sector is crucial. Leasing arrangements with rural producer organizations can be promoted. Alternatively, low-cost mechanization may be imported from other countries to increase labor productivity.
165. Securing land-use rights in a transparent and equitable manner is crucial. Rural land administration has been reformed by a new Land Law (1997) and regulations (1999). Customary tenure arrangements gained official sanction, and consultation was mandated prior to issuance of new concessions. The law succeeded in its main aim of protecting the traditional land-use rights of smallholders, but these reforms are still inadequate. Because land cannot be owned, the only barrier to acquiring rights to its use is bureaucratic, and not surprisingly, concessions to large tracts of land are still being awarded virtually gratis. The lack of an official land market creates opportunities for rent seeking and is inefficient because land rights will not naturally gravitate to their most productive uses. When improvements in rural areas are sold, the land concession on which they stand does not automatically accompany the sale. Further permission has to be secured before the concession may be transferred, creating further opportunity for rent seeking. A further difficulty is that concessions are subject to bureaucratic interference due to the requirement for a land-use plan. Such interference creates a justified perception on the part of potential large-scale farmers that tenure is too insecure to merit large investments.
166. Substantial efficiency improvements could be obtained by:
Changing regulations to allow land-use rights to automatically accompany sales of buildings and improvements without bureaucratic interference.
Substantially increasing the land tax for medium- and large-scale concessionaires, thereby obliging landholders who are not making productive use of their land to transfer it to others who would cultivate it. Because land is owned by the state, the land tax is in effect a rent for use. There is no reason why the state should not charge a fair rent because the land is obtained at no cost in the first place. The concessionaires could be compensated by being relieved of the requirement for use plans altogether. This would increase the perception of land tenure security and encourage further investment.
167. Where farmers have found a way to make money, they have also found ways to obtain the necessary financing. What was critical to their success was access to lucrative markets. Worldwide experience strongly suggests that even without institutional credit, significant advances can occur (e.g., investments in Green Revolution technology).136
Moreover, there is no evidence that micro finance has succeeded in promoting growth. According to Timmer, “Unfortunately, there is no significant evidence that these operations actually contribute to economic growth. Somewhat more surprising, the evidence is thin that such schemes actually reduce poverty in a sustainable fashion.”137

70
168. In the short run, institutional credit can be helpful but its importance is overrated. International experience is grounds for optimism in Mozambique, but what matters most are positive incentives, access to improved technology, and for sustainable production, credit. Many micro finance activities have been successful in Mozambique and these needs to be scaled up. In addition, input suppliers may be able to function as financial intermediaries.
Strategy for Growth in Cash Crops: Development of Out-grower/Contract Farming Schemes
169. Cash crops are essential for overall growth of the agriculture sector. The sector has immense agronomic potential, and exploitation is also important for overall GDP growth. Additionally, the lack of rural finance means that the system of out-grower or contract farming schemes that already exists, with 300,000 farmers in cotton and 100,000 farmers in tobacco, needs to be further exploited. In contract farming, farmers enter into either formal or informal contracts with processors to sell their production to that in return for some level of input or service provision and a purchase guarantee. These firms supply, on credit, seed and other inputs such as agrochemicals, fertilizers, and technical assistance, usually for cash crops, on a specific piece of land. Farmers agree to use the inputs as instructed and to sell all production to the firm at harvest time. The cost of inputs is deducted upon delivery of the product.
170. Contract farming schemes in Mozambique still face many market failures, especially the risk of side-selling and the lack of long-term commitment from both sides. The industry tends to avoid risk as much as possible — firms typically do not provide fertilizer to minimize risks, technical assistance is normally poor, barter ratio (inputs/output) is not clear for the producers, and the prices paid to cotton producers, for instance, are the lowest in the region as firms try to capture monopsony rents as much as possible. Producers, in turn, break contracts and sell their production to other buyers if prices are more attractive at harvest time, usually use the fertilizer for their own food crops, and not infrequently the management of some farmer organizations is associated with misuse of resources.
171. The regulatory system for these the cotton and tobacco supply chains, especially Government-allocated monopsony concessions, has been controversial. The regulatory system has proved inadequate in some areas, notably in screening the quality of concession companies and monitoring their performance, although the recent entrance of some international firms with long experience in cotton is an encouraging sign. Regulatory shortcomings are attributed to both technical weaknesses, lack of effective institutional autonomy, and variability in the policy environment.
172. Given the current situation, especially in some more susceptible regions, it seems advisable to retain the concession system over the next few years. The companies need to feel the confidence to invest, and it is important that competitors with very short-term agendas do not undermine their efforts. Farmers still largely depend on the support of the industry. Additionally, the current market scenario is quite fragile, with weak international prices and the low profitability of cotton farming. It is suggested that the Government should assess two different alternatives:
71
Consider establishing a genuinely autonomous regulatory regime. If consensus can be achieved, it should consider co-funding a regulatory and industry strengthening program for up to 10 years.
Consider a two-speed liberalization process for different parts of the country coupled with a rigorous system of screening potential entrants into the seed cotton trade. Such an approach is likely to be less demanding in terms of regulatory capabilities. Moreover, cotton companies would be given time to strengthen their financial situation, thereby gaining strength to face the challenges posed by liberalization. In the mean time, a plan to strengthen public and private arrangements should be established.
173. The following measures are to be assessed by the government:
Establish clear commitments by concessionaire companies and strengthen control of their performance.
Introduce clear and binding performance targets for concession companies and impose sanctions for non-fulfillment of agreed targets for the next five years.
Assess existing concessions that the Government should use to determine — on the basis of track records and plans — whether they should continue or be terminated.
Reduce the scale of some concessions to a core area in line with the company’s ability to service producers in the concerned area.
Accredit consultants to review the performance of concessionaries.
Publish key data on performance of companies and trends in that data, placing pressure on companies to perform better.
Revise the role and composition of IAM (The Mozambique Cotton Institute, which is the body in charge of supervising and monitoring the cotton sector)
Divest the Government of its joint-venture holdings in companies with a view to eliminating potential conflicts of interest affecting its regulatory role.
Revise the price fixing mechanisms, clearly establishing risk, cost and profit allocation, as well as frequent adaptation rules.
Other recommendations
174. Incentives for smallholders are necessary to strengthen links between farmers and industry. Contracts between commercial farmers and smallholders must be attractive to the smallholder; if a contract is only marginally financially attractive, then the risk of default is higher. In addition, standard contracts should be tailored to each crop according to that crop’s productive and market characteristics.
175. For coordination between industry and farmers, the latter should be organized. Companies can benefit when they provide inputs and services through groups of smallholders. Peer pressure within the group and intra-group monitoring can reduce the risk of default. Farmers know the creditworthiness of community members that the

72
contractor probably would not, and thus they could help screen out those who have a high potential for default. Farmer groups may also have a stronger hand than individuals in negotiations with companies.
176. Measures to strengthen farmer organizations include:
Provide technical support to develop monitoring systems for the association that focus on key criteria related to long-term sustainability.
Develop a voluntary system of quality certification and control for farmer associations involving creation of a small civil society body with this mandate that would provide accountability.
Increase professionalism of farmer associations through a program of capacity building in selected regions of central and northern Mozambique. This capacity should include improved skills to manage the associations, trade, and production techniques.
Revise legislation that enables farmer associations. A proposal to recognize and simplify the registration of farmer associations was approved by the Council of Ministers and is waiting for approval by the Parliament.
177. NGO assistance is important. They should focus on developing long-term contractual relationships between farmers and companies, maintaining an up-to-date statistical database on the performance of associations, focusing on key performance indicators including market penetration and default, increasing efforts to resolve contractual issues that arise between farmers and companies, and training staff to work with companies.
178. Industry coordination is equally important. Coordination and collaboration between companies in research, seed production and distribution, seed procurement, quality control, and international marketing are critical to the future growth and competitiveness of supply chains. Collective action by companies is also important for effective dialogue with the Government.
179. Industry associations need to strengthen their activities, especially those to improve economies of scale and overall production quality. Such measures are fundamental to the competitiveness of Mozambican agroindustry given the importance of supplying minimum volumes of standardized (graded) kernel on a regular basis. These organizations can also play a major role in overcoming financing constraints that affect the industry.
180. Although credit is not a binding constraint for a substantial part of Mozambique’s contract farming because of their international links, some sectors — notably export horticulture and cashew — face quite acute constraints. Banks are not interested in this type of lending because the market in Government debt is attractive, it is difficult to seize defaulters’ collateral, they distrust the agriculture sector based on earlier experience, and their general lack of familiarity with modern export-oriented agribusiness. Most contract farming activities are export-oriented and with the appropriate incentives it should be

73
possible to leverage international loan funds in US dollars. These incentives should be more deeply assessed and might include venture capital funding to increase borrower equity and collateral management of stocks. Further analysis should also investigate the scope for working on policy and institutional reforms.
181. Cultivating tobacco involves a trade-off with sustainable environmental management (e.g., reversing soil erosion, fertility depletion, and deforestation). The Government should establish mechanisms to require sustainable environmental management practices from tobacco companies.
Recommendat ions for Cash CropsSugar and Tea
182. Sugar occupies fertile irrigated land and is highly protected. It has expanded rapidly at highly protected prices, far surpassing the absorptive capacity of the domestic market. The profitability of sugar and its sustainability will depend on EU and domestic protection policies. Under the EBA negotiated with Mozambique in 2000, the country is to have free access to the EU market as of 2009, but by 2008, the EU policy reform on sugar is expected to significantly reduce protection. As such, the Government needs to develop its protection strategy in view of such expected EU reform. The cases of sugar (protected sugar beet and some quota of tropical sugar treated preferentially) and subsidized cotton highlight a major distortion in world agricultural trade. The contentious issue of subsidies from OECD countries is undermining market access and prices for developing country agricultural exports. The Government should undertake its own policy research and pursue a more active role in WTO deliberations.
Cashew Nuts
183. Many cashew trees are old and diseased, but farmers are reluctant to invest in new trees despite market liberalization. In the long term, replanting is necessary. The Government can help improve marketing competitiveness by building feeder roads to important smallholder cashew growing areas. Without massive replanting, it is difficult to see how the cashew sector can again become an important source of income for smallholders.
184. Expansion of cashew nut processing would improve competitiveness. One NGO, TECHNOSERVE, has been collaborating with INCAJU to find new investors and has been providing technical support. Other than revitalizing the raw nut sector, the most important measures the Government can take are to improve the business environment —labor policies and quality standards throughout the supply chain. In this context, introduction of a price system that reflects quality is a welcome change. The Government should also assess the competitiveness of smaller, labor-intensive processing plants.
Horticulture Crops
185. High-value horticultural crops in peri-urban and irrigated areas have great potential. One of the big challenges for smallholder agriculture throughout the developing world is its profitable integration in the vertically integrated supply chain driven by

74
supermarkets, a dynamic phenomenon often referred to as the supermarket revolution.138
Mozambique is no different. The horticulture sector is still at a rudimentary stage of development, but Mozambique has substantial agroecological potential — paprika, litchis, mangoes, and pineapples, and good market prospects in the Republic of South Africa, the Middle East, Japan, and South and Southeast Asia. Developing this potential requires many of the measures already proposed above. Of fundamental importance are the creation of a facilitating business environment and market development. These export markets, especially the EU, are highly demanding, thus smallholders need to transition from undifferentiated commodities of variable quality to consistent high quality delivered on time. This transition typically takes the form of out-grower schemes that facilitate links to markets in both urban areas and export markets.
186. The Middle East and Asia are potential new markets for “less demanding” crops. The markets of the EU and the Republic of South Africa are very demanding and very competitive. Expanding markets in the Middle East and Asia are less demanding but require much more research. Mozambique should develop expertise to supply these northern hemisphere markets with counter-season products. Instead of investing in highly demanding products like cut roses, the country should consider products that are less perishable, more labor intensive, and have less stringent quality and food safety standards such as paprika and baby corn. Paprika has an added advantage because it does not require high levels of management. Furthermore, with the political turmoil in Zimbabwe and high labor costs in the Republic of South Africa, their production has decreased. This decrease is a window of opportunity for Mozambique.139
Livestock
187. Smallholder livestock has growth potential but is constrained by diseases, insufficient feed, and lack of access to extension services. Increased productivity by smallholder households should help improve the feed situation. Access to extension services is critical to develop the growth potential of small animals, both quantity and quality. Government livestock services, the National Livestock Directorate (DINAP), now serves predominately cattle, thus leaving out small species tended by women. DINAP ensures mandatory cattle vaccinations and monitors animal epidemiology. Access to extension services will be critical to reducing the incidence of diseases afflicting chickens, goats, and pigs (in non-Muslim regions).
188. More female extension agents will be required to reach women who, due to cultural constraints, cannot fully benefit from the services of male extension agents. The ex-National Veterinary Research Institute (INIVE) developed a relatively low-cost Newcastle disease vaccine (NDV). A control program already operates in pilot villages, but this program needs to expand. In addition, households must increase crop production and therefore their feed base to promote the growth and health of their livestock. They must also balance the demands of crops and cattle — while cattle for traction and cultivation are complementary up to a point, they also compete for land and labor. Extension services should help households integrate both crop and livestock farming systems. Furthermore, the Government Livestock Sector Policy and Strategy Review should reconsider its target group, which is mainly cattle owners. The long neglected
75
extension needs of women farmers should be addressed. Other than the issue of target groups, extension coverage also needs to expand, as well as the balance between disease control and animal husbandry.
Reducing Vulnerabi l i ty and Risks189. Further work on rural non-farm employment opportunities is needed. A key component of a more business friendly environment is the flexibility of labor markets to generate jobs and smallholder income to help them diversify and thus reduce vulnerability and risk. Many of the poorest are women and wage-earning landless labor migrants. About 23 percent of all households are headed by women and 45 percent of these female-headed households are widows. According to the TIA 2001-02, they are significantly more disadvantaged compared to male-headed households. Their income is 30 percent less than that of male-headed households.140 While they can benefit from the above proposed interventions for smallholders, it is likely that those benefits will be indirect. Increased flexibility of labor regulations is important not only for these landless wage earners but for other rural labor as well.
190. To complement more employment opportunities, pilot savings and credit schemes for medium- and small-scale enterprises should be made available. Programs such as “village savings and loans schemes”, successful in other parts of Sub-Saharan Africa, should be encouraged. Over the medium and long term, the Government should develop a strategy to promote sustainable financial intermediation. Further work should be carried out on non-farm opportunities, especially for women.
191. Smallholders need to diversify their income sources. An important part of diversification can arise from micro- and small-sized enterprises, with complementarity between cash cropping and medium and small enterprise (MSE) development. Income earned from the former finance the latter.141 The growth of MSE offers increased rural employment opportunities. Moreover, over the course of agricultural transformation, agriculture sheds labor and the increasing availability of non-farm rural and urban employment is essential to increase the income of rural families.
192. Small livestock are important to diversify household income, especially where potential for crop production is limited. Raising small livestock is an important activity for families and offers protein, the opportunity to generate income or trading potential, and an important input into social and traditional life. Raising cattle, on the other hand, is principally for animal traction. In general, the poorest families derive less than 10 percent of their income from livestock sales, moderate families between 5 and 15 percent, and less poor families between 5 and 20 percent. Based on recent surveys, there is an inverse relationship between the contribution of income from the sale of animals and the potential for income from sale of surplus crops. As such, the importance of raising livestock in areas where there are constraints to agricultural production is higher.
193. The major constraints to alleviating poverty through livestock production must be overcome to ensure that communities can benefit from diversifying household income. One strategy would include extension support services in the family sector, particularly
76
related to animal husbandry. Currently the focus is to vaccinate cattle and possibly some treatment of goats, which necessarily excludes the poorest socioeconomic groups that traditionally do not own cattle. Additionally, women are often excluded from receiving messages from male extension workers due to cultural constraints, and as such the number of female extension workers needs to be increased.
Food Secur i ty194. Strengthening food security at the national and household levels is a priority in a highly risky environment. Mozambique is largely self-sufficient in food and an exporter of maize except when natural disasters strike. The frequency and severity of these natural calamities highlights the central importance of food security. Subsistence farmers are already primarily concerned with satisfying their basic needs in good times and in bad. Mozambique should not follow its neighbors — Zimbabwe, Malawi, Zambia — which in the name of food security undermine private sector development and agricultural growth. Instead, to help smallholders satisfy their basic needs and yet release resources to enable them go beyond subsistence agriculture, the Government should ensure that its food aid policy, through timing and food aid:
Minimizes the disincentive that food aid can have on local production incentives.
Ensures that funds it collects through monetized food aid are largely spent in rural areas (e.g., rural road building and maintenance).
Promotes a regional food security policy. Now is a particularly important period to do so as the Government is giving priority to strengthening the functioning of markets.142
195. The amount of commercial food aid has already decreased substantially and much of it is monetized. To help better manage commercial food aid, the Government should develop a monitoring and evaluation system and use its results in discussions with major food donors, in particular USAID and WFP. It should insist that better donor coordination will remain essential. Non-monetized food aid should be accepted and injected only during times of crisis (e.g., floods and droughts). The functioning of the Sistema de Aviso Previo should be regularly reviewed and further strengthened if deemed necessary. These actions should be implemented soon because their impact would be immediate. In addition to food availability and income, food security has an important nutrition component. It is notable that although the incidence of poverty has been reduced, this has not significantly improved nutrition. There is a close interaction between the nutritional value of food and prior HIV infection.
77
4. Implementat ion of the Strategy
196. The agricultural development strategy can only be appropriately executed if all stakeholders work together. The implementation of the strategy outlined in the previous chapter and details provided in Table 19 reflect the need for multiple stakeholders at the country level — farmers, communities, private business, local governments, and central Government. Additionally, given that many activities in the agriculture and rural sectors are financed by donors, their active participation is required to implement the strategy. This section highlights only key areas on which the Government should focus to ensure that the strategy is effectively executed.
Enabl ing Environment 197. The enabling environment for this agricultural development strategy includes the macroeconomic framework, rural infrastructure, other rural services, policies, agricultural statistics, public expenditures, and research and extension.
Macroeconomic Framework
198. The Government needs to ensure macroeconomic stability and transparency. As outlined in the previous chapters, implementation of the program cannot succeed without a stable macro framework so that the agriculture sector is not in any way disadvantaged. Inflation must be kept under control and the exchange rate should be competitive for Mozambican exports. Transparency is a another area where the country is not scoring well. Judicial reforms must continue to be carried out systematically. These areas are being closely followed by donors involved in budget support.
Rural Infrastructure
199. Infrastructure is a key ingredient and priority for growth of the rural and agriculture sectors. The current road network in inadequate, with 16 percent primary, 30 percent secondary, and 53 percent rural. Currently an estimated 25 percent of the network is in good condition and about 39 percent is in fair condition. Only about 60 percent of the classified network is maintained. The PARPA targets for 2005 are to reduce impassable roads to 5 percent, poor quality roads to fewer than 25 percent, distance of districts to capitals to less than 250 kilometers, and the distance of localities to districts to 550 kilometers. The institution responsible for the roads sector is the National Roads Administration (ANE), with funding provided by donors, including the Bank. Additionally, a road fund using revenue generated from road and petroleum taxes has been created for maintenance. Development of the road sector, especially primary and secondary roads, will be the responsibility of the public sector in the medium term. Investment costs are high and with the sparse population and low traffic volume, even toll roads would not be effective and there would be very little interest from the private

78
sector to participate. The Ministry of Agriculture needs to work closely with the National Roads Administration to ensure that priority is given to roads in areas with a high potential for agricultural growth to provide links to markets.
200. Road construction should be complemented by upgrading markets. Most rural markets are adjacent to main roads, thus one way to ensure that benefits generated from the road network are maximized is to ensure that the markets are upgraded. One suggestion is to include a small component for market upgrades in the ANE bidding documents and contracts. Upgrading these markets would include a cover, sanitation facilities, and storage. Market vendors could be organized into groups to manage and maintain the markets or they could be managed by the local government with a market fee for each stall.
201. Local governments are important partners in infrastructure development. The Roads and Bridges Department in the Provincial Directorate of Public Works and Housing is responsible for the planning and supervision of regional roads, both tertiary and non-classified.
Other Rural Services
202. Rural water supply services (RWSS) are funded by donors, with community involvement and financing by local governments and the national directorate of water supply. The PARPA targets for RWSS are to reach 40 percent of the population (under the assumption of 500 people per source). Currently only about an estimated 27 percent have been reached. Concerted efforts need to be made to ensure full coverage.
203. Use of internet, radio, and telecommunication is in its infancy in Mozambique. Implementation would require the Government to provide a competitive environment in order for the private sector to be involved. Wireless systems are gaining popularity and becoming critical for farmers to obtain market prices. Radio and TV are popular and can transmit market price information and provide extension advice. The government would have to ensure that a regulatory framework encourages private and community level initiatives.
Policies
204. Mozambique has a liberal pricing policy with little or no interference from the Government, but there are cases when the government has imposed ad-hoc tariffs. Smallholders in the north and center depend more on trade with neighboring countries. Due to infrastructure constraints — north to south — markets are in the neighboring countries. The free movement of produce across borders is hampered by a number of non-tariff barriers such as entry documents, invoices, and certificates, which in most cases cannot be met by traders. Grading, safety, and phytosanitary standards and requirements for import of agricultural produce still vary across the region, although the countries have signed the SADC trade protocol to promote, coordinate, and harmonize regional trade to improve food security. Regulatory requirements for transportation across the frontier contribute to the barriers. Although the SADC transport protocol has been signed, insurance, road user charges, weight restrictions, and license requirements
79
still need to be harmonized. Duties, other charges, and restrictions imposed at the discretion of local officials and lack of inspection facilities when quality problems arise are other constraints that hamper cross-border trade. The Ministry of Agriculture and the Ministry of Commerce and Customs need to evaluate the situation and facilitate market access for smallholders.
Agricultural Statistics
205. MINAG needs to ensure that agricultural data are reliable. As highlighted in Chapter 1, there are issues with the reliability of agricultural statistics. A major effort should be made on the part of MINAG and INE to ensure that statistical data are reliable. Assistance should be sought from international organizations, including FAO, to produce quality and timely data. In addition to collection of quality data, MINAG should set up a GIS system and along with the existing PROAGRI monitoring system (SIG) keep the information updated.
Public Expenditures
206. The Ministry of Finance needs to ensure that funding is adequate and released on time. As an immediate step, adequate and timely budget releases to both the Ministry and local governments are required. The budget execution rate has been poor primarily due to delayed releases and differences between proposed and actual budgets. Over 50 percent of expenditures in rural areas are off-budget. Donors need to ensure that all their funding is within the budget so that Government has a better understanding of investments and expenditures in rural areas.
207. MINAG requires a Medium Term Expenditure Framework (MTEF). As PARPA II is being finalized it is essential that the Ministry develop a MTEF. This will enable the Ministry to monitor progress and at the same time ensure adequate resources to plan more efficiently. There is a demand for MTEF because a number of donors are opting to provide budget support.
Research and Extension
208. The research system has been recently reorganized under the umbrella of the Mozambican Research Institute. MINAG should obtain assistance from EMBRAPA (Brazilian research system) to provide the necessary technical assistance that has been agreed upon under PROAGRI. Additionally, funding needs to be assured and consistent so that programs such as seed multiplication do not in any way suffer. The research system needs to interact more closely with the CGIAR centers.
209. The extension system is currently being revamped, however, expansion of the public system is limited by the number of qualified staff. As indicated in recent studies, where extension staff have been available, effects were positive. Currently only one-third of districts are being served by extension services. NGOs have been providing excellent extension services, but their services are not sustainable because they depend on donor funding. Roles and responsibilities of extension staff vis-à-vis local governments and the Ministry need to be well articulated, and new methods of providing extension services

80
need to be explored. Perhaps the public sector could train private sector workers who could in turn provide extension advice while retailing their inputs.
Institutions210. Two of the institutions will play key roles in reducing poverty through increased agricultural production are rural producer organizations and local governments.
Rural Producer Organizations
211. Demand-driven activities require empowering communities. Rural producer organizations (RPOs) in Mozambique have proved to be successful for farmers of both cash crops and food grains. More of these organizations are needed. Key lessons include:
Promoting farmer groups requires commitment (both in resources and technical advise) over a long period, perhaps 8-10 years.
Government-founded cooperatives and forced “villagization” are not appropriate to promote farmer groups.
Promoting farmer groups works best when it is part of an economic activity that will procure direct benefits.
There can be good cooperation with government services when extension agents work with NGO animators on technical aspects.
For sustainability and ownership, farmer groups could propose one or two of their members to be trained as animators to gradually replace NGO animators.
RPOs should evolve as self-help groups, i.e., savings and credit groups so that they build a strong financial base.that will help ensure their sustainability.
212. Community empowerment can lead to accountability by local officials. Empowerment of RPOs and communities will ensure that local officials are responsive and that communities are aware of the services they can demand. It can also make local government officials more accountable and ensure transparent transactions at the community level. NGOs would be required to facilitate empowerment of communities and NGOs by mobilizing communities. Donor support for these activities would be essential.
213. RPOs could also help to promote out-grower schemes. Currently the industry manages a large number of smallholders, but organization would reduce transaction costs for industry and also reduce side-selling by individual farmers. Additionally, empowered RPOs can also ensure that they obtain better prices for their products when they are consulted by Government and industry.
Local Government
214. Decentralization needs to be accelerated, and the Government is currently in the process of drafting a decentralization strategy. In a large country with a scattered population, decentralization would bring government closer to the people. However, the

81
“rules of the game” should be clear so that there are clear roles and responsibilities for local government vis-à-vis the central Government. The functions of local development staff also need to be clear. Will the local governments be able to generate their own funds, and will they be able to keep the resources? How will central Government funds be disbursed? How will community groups and rural producer organizations interact at the district and provincial levels? These are some of the key questions that the strategy needs to address to help local governments support the rural strategy.
Role of Private Sector215. The private sector is an important partner to implement the program and ensure that inputs are provided and outputs procured. Major constraints for the private sector have been the lack of infrastructure and transport costs to deliver inputs and market output, thus building roads is key.
Role of Donors 216. Donors are important financiers of agriculture sector development in the medium term. In this context it will be important for donors to ensure that their programs supportthe Government strategy. The donors have been effective at coordinating, especially as part of the sector-wide approach. An MOU was signed by the contributing donors. Support to the sector is provided by different financial arrangements that include budget support, common funds, and investment lending, both off- and on-budget. To enable the Government to develop an appropriate MTEF it is essential that donors ensure that all their investments are part of the overall Ministry budget. This will ensure transparency and accountability by all stakeholders.

82
83
Appendices
1. Chal lenges to Measuring Agricul tural Product ion in Mozambique
Originally developed for forecasting, Mozambique’s main monitoring tool for agricultural production is the Aviso Previo (or National Early Warning System). Estimates for seven major food crops are based on a mathematical simulation model that was developed in the early 1990s with FAO assistance. Beginning in 1993, detailed panel data for seven major crops at the province level became available, for both the smallholder and commercial sectors. The crop estimates involve two steps.
The first step is collection of quantitative information. Aviso Previo data originates from three sources:
A small annual sample survey of about 2,300 households, featuring a random selection of villages and holdings.
Agroecological crop monitoring using rainfall data and other parameters, analyzed in a crop water balance model.
Careful interpretation of GIS imagery.
Farm plot size and yields in the sample survey are based on actual measurements. The sides and angles of the field are keyed into a programmable pocket calculator to obtain the area of the field, and randomly selected crop cuts are made for yield estimates. In practice, however, these estimates could be flawed due to missing technical equipment.
In a second stage, based on qualitative information from the district level and other sources, the data entered into the model are checked for plausibility and then aggregated to the provincial and national levels. The model and data collection procedures have been modified several times. The exact procedures behind the aggregate estimates are poorly documented. The main shortcomings of the model are the small size of the annual sample and the unknown error margin for crop estimates at the provincial level. In addition, in the early 1990s lack of accurate population and agricultural statistics may have limited precision of the monitoring system. A particular strength of Aviso Previo, however, is its reliance on remote sensing of agroecological data. Overall, it is acknowledged that the monitoring element of Aviso Previo is an operational and consistent system for a rough estimate of crop production at the national level, combining farm size, crop yields, rainfall records, and cultivated land area from satellite imagery.143
A comparison of the Aviso Previo estimates with agricultural survey data from 1994 to 2003 shows that crop estimates of both sources are largely incompatible. At the aggregate level, Aviso Previo produced larger increases for basic food crops than the agricultural

84
surveys. For example, total grain and bean production from 1995-96 to 2001-02 would have declined by about 7 percent according to the TIAs (Trabalho de Inquérito Agrícola), compared to an increase of about one-third according to data from Aviso Previo.144 A comparison of production data for basic crops shows that according to the agricultural surveys, there was actually no increase in production since 2000. At the regional level data generated from the agricultural surveys become entirely chaotic — not only production levels but also trends for major crops do not seem to have much in common with Aviso Previo. The exception, however, is the level of maize production, for which both estimates are similar (Fig. 3).
Problems deriving reliable agricultural production statistics from the agricultural surveys involve four elements:
A narrower change of the “rural” definition since 2002, resulting in exclusion of parts of the semi-urban population.
Sampling errors of both surveys.
A rather lengthy household questionnaire.
Bias of agricultural production due to very low rainfall in 1995-96.
As a consequence, the Aviso Previo statistics for crop production are preferred by INE for an estimate of rural production for the National Accounts, suggesting an urgent need to improve and harmonize the monitoring system for better measurement of agricultural production in Mozambique.
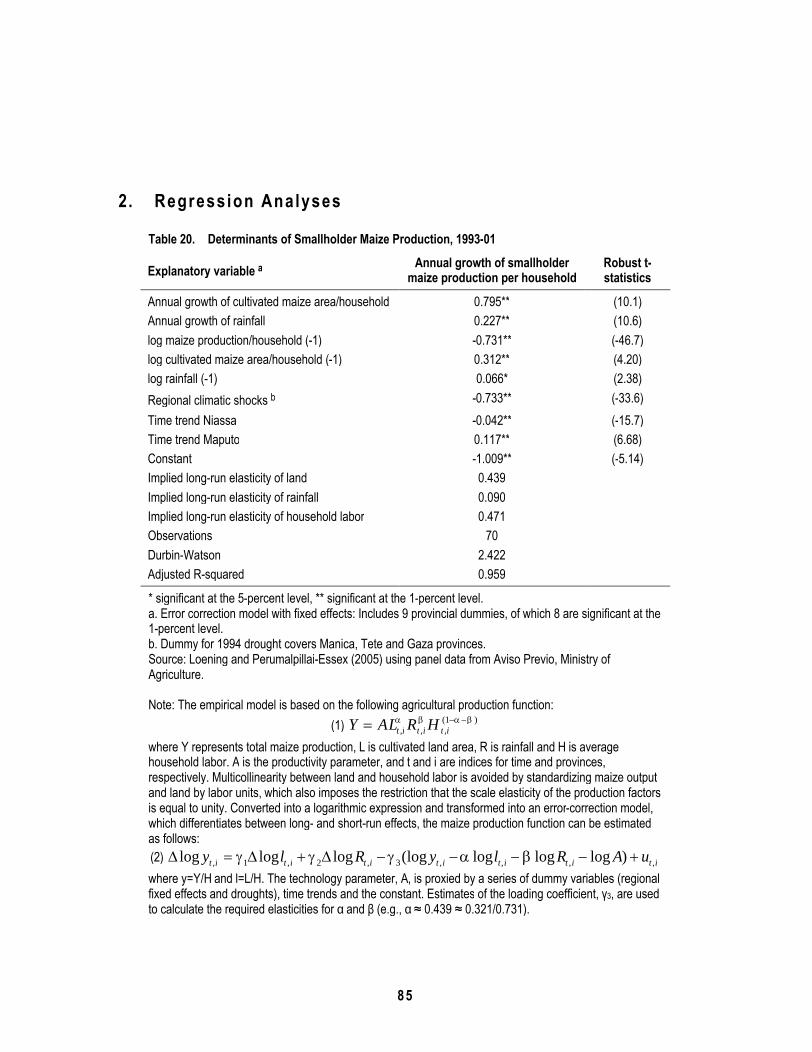
85
2. Regression Analyses
Table 20. Determinants of Smallholder Maize Production, 1993-01
Explanatory variable a Annual growth of smallholder maize production per household
Robust t-statistics
Annual growth of cultivated maize area/household 0.795** (10.1)Annual growth of rainfall 0.227** (10.6)log maize production/household (-1) -0.731** (-46.7)log cultivated maize area/household (-1) 0.312** (4.20)log rainfall (-1) 0.066* (2.38)Regional climatic shocks b -0.733** (-33.6)Time trend Niassa -0.042** (-15.7)Time trend Maputo 0.117** (6.68)Constant -1.009** (-5.14)Implied long-run elasticity of land 0.439Implied long-run elasticity of rainfall 0.090Implied long-run elasticity of household labor 0.471Observations 70Durbin-Watson 2.422Adjusted R-squared 0.959
* significant at the 5-percent level, ** significant at the 1-percent level.a. Error correction model with fixed effects: Includes 9 provincial dummies, of which 8 are significant at the 1-percent level. b. Dummy for 1994 drought covers Manica, Tete and Gaza provinces.Source: Loening and Perumalpillai-Essex (2005) using panel data from Aviso Previo, Ministry of Agriculture.
Note: The empirical model is based on the following agricultural production function:(1) )1(
,,, ititit HRALY
where Y represents total maize production, L is cultivated land area, R is rainfall and H is average household labor. A is the productivity parameter, and t and i are indices for time and provinces, respectively. Multicollinearity between land and household labor is avoided by standardizing maize output and land by labor units, which also imposes the restriction that the scale elasticity of the production factors is equal to unity. Converted into a logarithmic expression and transformed into an error-correction model, which differentiates between long- and short-run effects, the maize production function can be estimated as follows:(2) ititititititit uARlyRly ,,,,3,2,1, )logloglog(loglogloglog where y=Y/H and l=L/H. The technology parameter, A, is proxied by a series of dummy variables (regional fixed effects and droughts), time trends and the constant. Estimates of the loading coefficient, γ3, are used to calculate the required elasticities for α and β (e.g., α ≈ 0.439 ≈ 0.321/0.731).
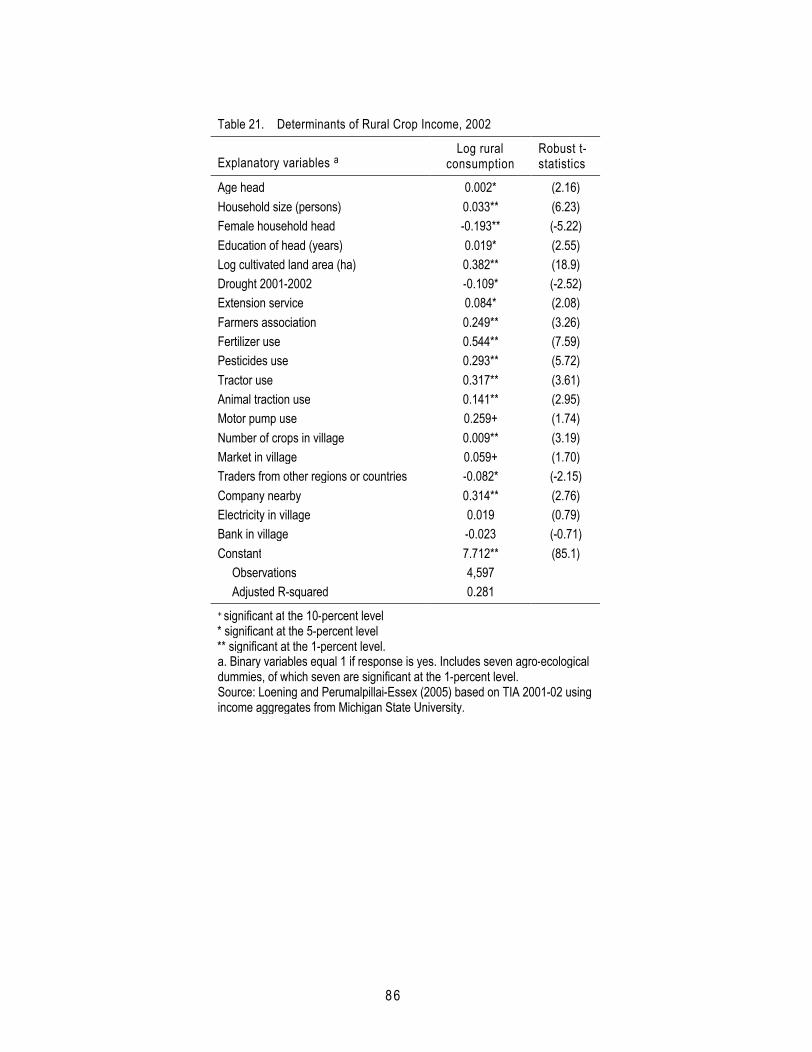
86
Table 21. Determinants of Rural Crop Income, 2002
Explanatory variables aLog rural
consumptionRobust t-statistics
Age head 0.002* (2.16)Household size (persons) 0.033** (6.23)Female household head -0.193** (-5.22)Education of head (years) 0.019* (2.55)Log cultivated land area (ha) 0.382** (18.9)Drought 2001-2002 -0.109* (-2.52)Extension service 0.084* (2.08)Farmers association 0.249** (3.26)Fertilizer use 0.544** (7.59)Pesticides use 0.293** (5.72)Tractor use 0.317** (3.61)Animal traction use 0.141** (2.95)Motor pump use 0.259+ (1.74)Number of crops in village 0.009** (3.19)Market in village 0.059+ (1.70)Traders from other regions or countries -0.082* (-2.15)Company nearby 0.314** (2.76)Electricity in village 0.019 (0.79)Bank in village -0.023 (-0.71)Constant 7.712** (85.1)
Observations 4,597Adjusted R-squared 0.281
+ significant at the 10-percent level * significant at the 5-percent level ** significant at the 1-percent level.a. Binary variables equal 1 if response is yes. Includes seven agro-ecological dummies, of which seven are significant at the 1-percent level.Source: Loening and Perumalpillai-Essex (2005) based on TIA 2001-02 using income aggregates from Michigan State University.
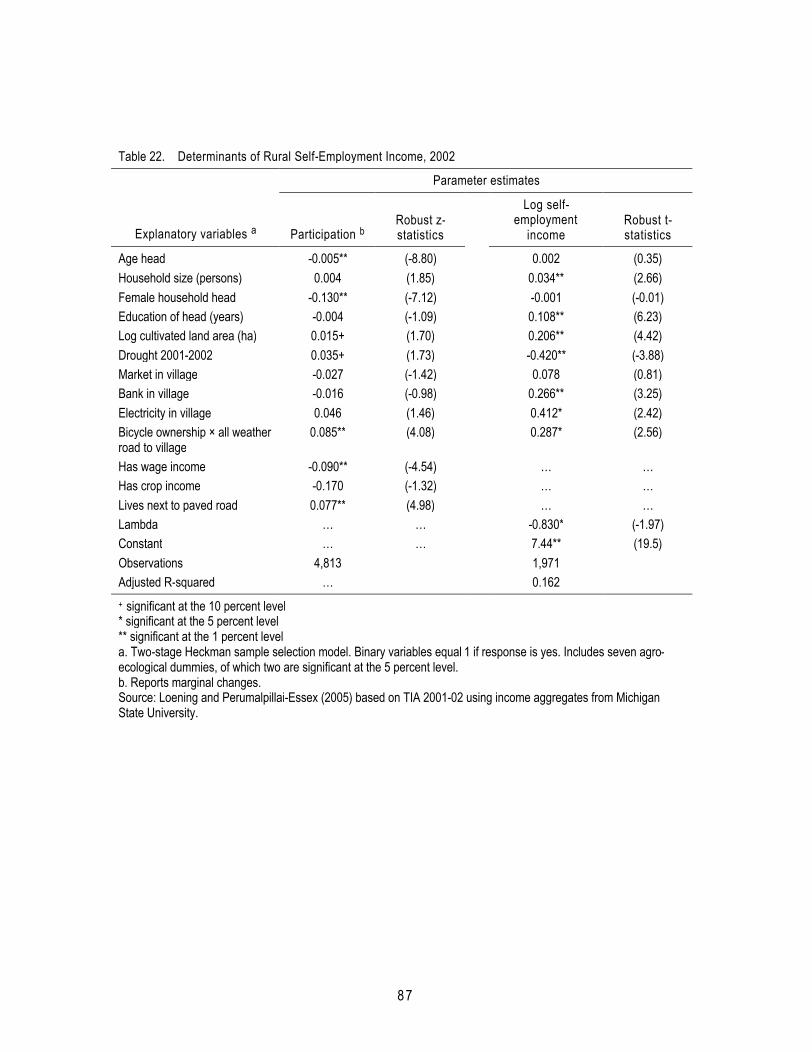
87
Table 22. Determinants of Rural Self-Employment Income, 2002
Parameter estimates
Explanatory variables a Participation bRobust z-statistics
Log self-employment
incomeRobust t-statistics
Age head -0.005** (-8.80) 0.002 (0.35)Household size (persons) 0.004 (1.85) 0.034** (2.66)Female household head -0.130** (-7.12) -0.001 (-0.01)Education of head (years) -0.004 (-1.09) 0.108** (6.23)Log cultivated land area (ha) 0.015+ (1.70) 0.206** (4.42)Drought 2001-2002 0.035+ (1.73) -0.420** (-3.88)Market in village -0.027 (-1.42) 0.078 (0.81)Bank in village -0.016 (-0.98) 0.266** (3.25)Electricity in village 0.046 (1.46) 0.412* (2.42)Bicycle ownership × all weather road to village
0.085** (4.08) 0.287* (2.56)
Has wage income -0.090** (-4.54) … …Has crop income -0.170 (-1.32) … …Lives next to paved road 0.077** (4.98) … …Lambda … … -0.830* (-1.97)Constant … … 7.44** (19.5)Observations 4,813 1,971Adjusted R-squared … 0.162+ significant at the 10 percent level* significant at the 5 percent level** significant at the 1 percent levela. Two-stage Heckman sample selection model. Binary variables equal 1 if response is yes. Includes seven agro-ecological dummies, of which two are significant at the 5 percent level. b. Reports marginal changes.Source: Loening and Perumalpillai-Essex (2005) based on TIA 2001-02 using income aggregates from Michigan State University.

88
Table 23. Determinants of Rural Wage Income, 2002
Parameter estimates
Explanatory variables a Participation bRobust z-statistics
Log wage income
Robust t-statistics
Age head -0.001** (-2.89) 0.016** (3.97)Household size (persons) 0.007** (4.73) 0.029+ (1.83)Female household head -0.038** (-2.81) -0.053 (-0.41)Education of head (years) 0.021** (9.17) 0.146** (5.25)Log cultivated land area (ha) -0.026** (-4.22) 0.144* (2.32)Market in village -0.006 (-0.43) 0.329** (2.52)Electricity in village 0.106** (4.41) … …Traders from other villages or
countries0.028* (2.81) … …
Company nearby 0.133** (3.81) … …Communal transport 0.028* (2.03) … …Has self-employment income -0.048** (-4.44) … …Has crop income -0.109 (-0.97) … …Extension service 0.025 (1.54) … …Village founded before
independence-0.020+ (-1.75) … …
Lambda … … -1.077** (-3.41)Constant … … 8.394** (13.2)Observations 4,813 828Adjusted R-squared … 0.391+ significant at the 10 percent level* significant at the 5 percent level** significant at the 1 percent levela. Two-stage Heckman sample selection model. Binary variables equal 1 if response is yes. Includes 7 agroecological dummies, of which 5 are significant at the 5-percent level. b. Reports marginal changes.Source: Loening and Perumalpillai-Essex (2005) based on TIA 2001-02 using income aggregates from Michigan State University.
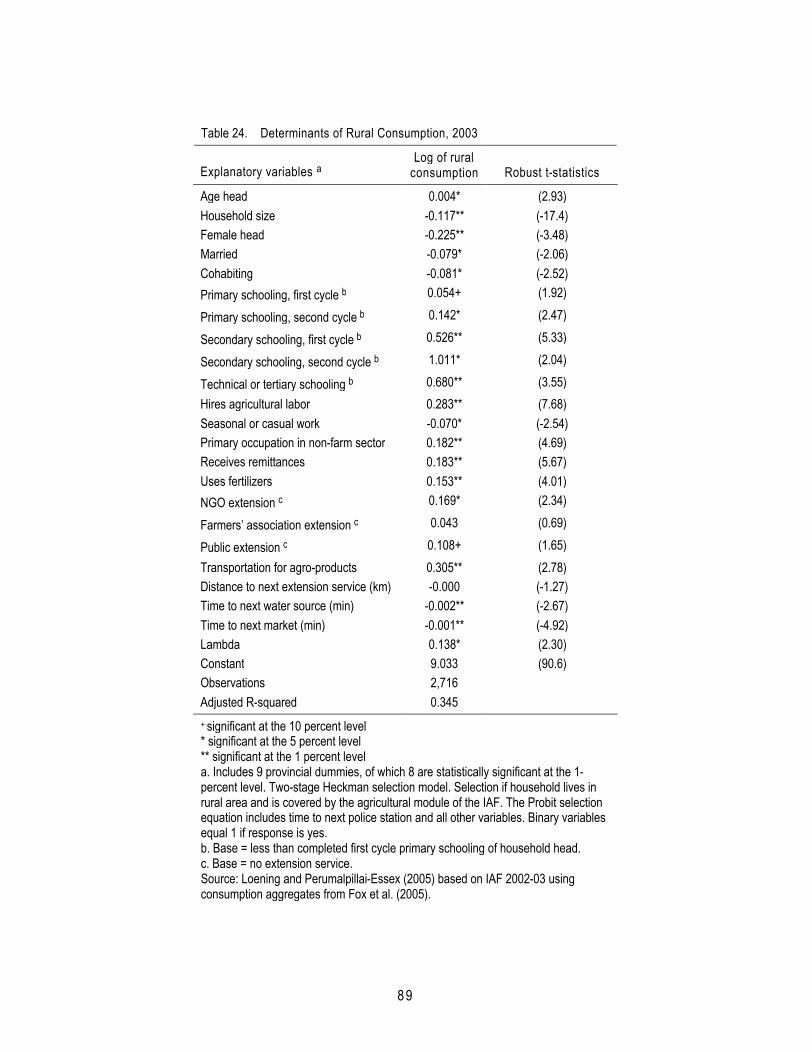
89
Table 24. Determinants of Rural Consumption, 2003
Explanatory variables aLog of rural
consumption Robust t-statistics
Age head 0.004* (2.93)Household size -0.117** (-17.4)Female head -0.225** (-3.48)Married -0.079* (-2.06)Cohabiting -0.081* (-2.52)Primary schooling, first cycle b 0.054+ (1.92)
Primary schooling, second cycle b 0.142* (2.47)
Secondary schooling, first cycle b 0.526** (5.33)
Secondary schooling, second cycle b 1.011* (2.04)
Technical or tertiary schooling b 0.680** (3.55)Hires agricultural labor 0.283** (7.68)Seasonal or casual work -0.070* (-2.54)Primary occupation in non-farm sector 0.182** (4.69)Receives remittances 0.183** (5.67)Uses fertilizers 0.153** (4.01)NGO extension c 0.169* (2.34)
Farmers’ association extension c 0.043 (0.69)
Public extension c 0.108+ (1.65)Transportation for agro-products 0.305** (2.78)Distance to next extension service (km) -0.000 (-1.27)Time to next water source (min) -0.002** (-2.67)Time to next market (min) -0.001** (-4.92)Lambda 0.138* (2.30)Constant 9.033 (90.6)Observations 2,716Adjusted R-squared 0.345+ significant at the 10 percent level* significant at the 5 percent level** significant at the 1 percent levela. Includes 9 provincial dummies, of which 8 are statistically significant at the 1-percent level. Two-stage Heckman selection model. Selection if household lives in rural area and is covered by the agricultural module of the IAF. The Probit selection equation includes time to next police station and all other variables. Binary variables equal 1 if response is yes.b. Base = less than completed first cycle primary schooling of household head. c. Base = no extension service.Source: Loening and Perumalpillai-Essex (2005) based on IAF 2002-03 using consumption aggregates from Fox et al. (2005).

90
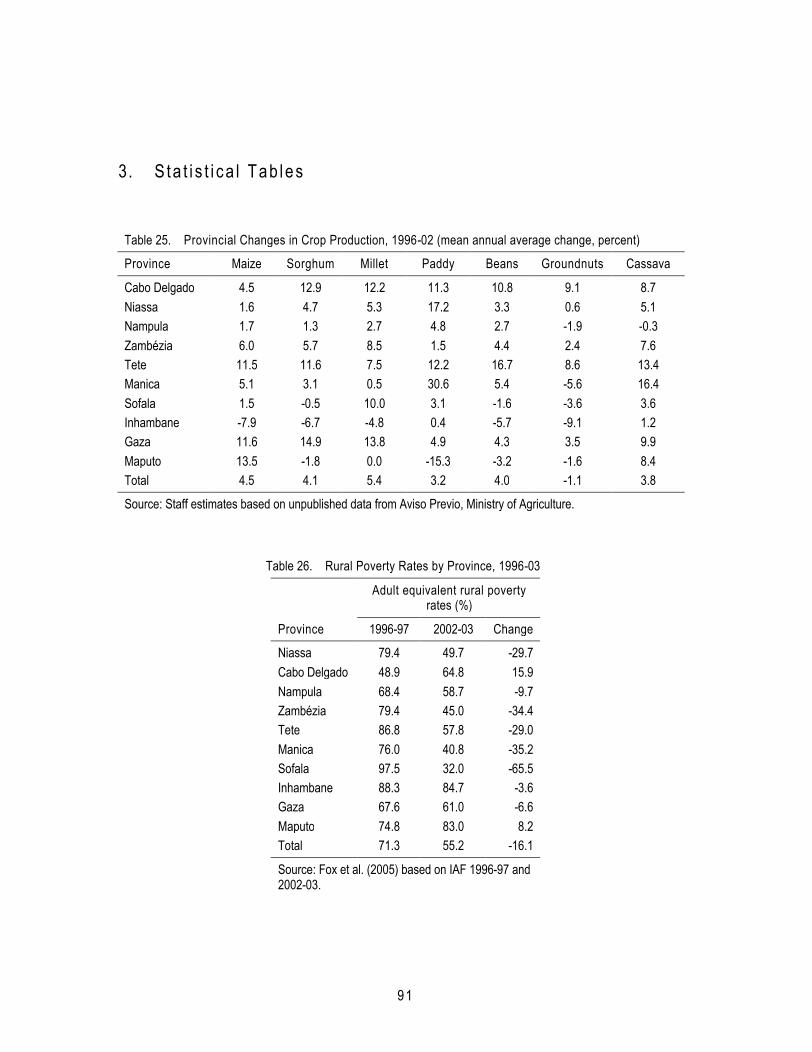
91
3. S ta t i s t i ca l Tab les
Table 25. Provincial Changes in Crop Production, 1996-02 (mean annual average change, percent)
Province Maize Sorghum Millet Paddy Beans Groundnuts Cassava
Cabo Delgado 4.5 12.9 12.2 11.3 10.8 9.1 8.7Niassa 1.6 4.7 5.3 17.2 3.3 0.6 5.1Nampula 1.7 1.3 2.7 4.8 2.7 -1.9 -0.3Zambézia 6.0 5.7 8.5 1.5 4.4 2.4 7.6Tete 11.5 11.6 7.5 12.2 16.7 8.6 13.4Manica 5.1 3.1 0.5 30.6 5.4 -5.6 16.4Sofala 1.5 -0.5 10.0 3.1 -1.6 -3.6 3.6Inhambane -7.9 -6.7 -4.8 0.4 -5.7 -9.1 1.2Gaza 11.6 14.9 13.8 4.9 4.3 3.5 9.9Maputo 13.5 -1.8 0.0 -15.3 -3.2 -1.6 8.4Total 4.5 4.1 5.4 3.2 4.0 -1.1 3.8
Source: Staff estimates based on unpublished data from Aviso Previo, Ministry of Agriculture.
Table 26. Rural Poverty Rates by Province, 1996-03
Adult equivalent rural poverty rates (%)
Province 1996-97 2002-03 Change
Niassa 79.4 49.7 -29.7Cabo Delgado 48.9 64.8 15.9Nampula 68.4 58.7 -9.7Zambézia 79.4 45.0 -34.4Tete 86.8 57.8 -29.0Manica 76.0 40.8 -35.2Sofala 97.5 32.0 -65.5Inhambane 88.3 84.7 -3.6Gaza 67.6 61.0 -6.6Maputo 74.8 83.0 8.2Total 71.3 55.2 -16.1
Source: Fox et al. (2005) based on IAF 1996-97 and 2002-03.
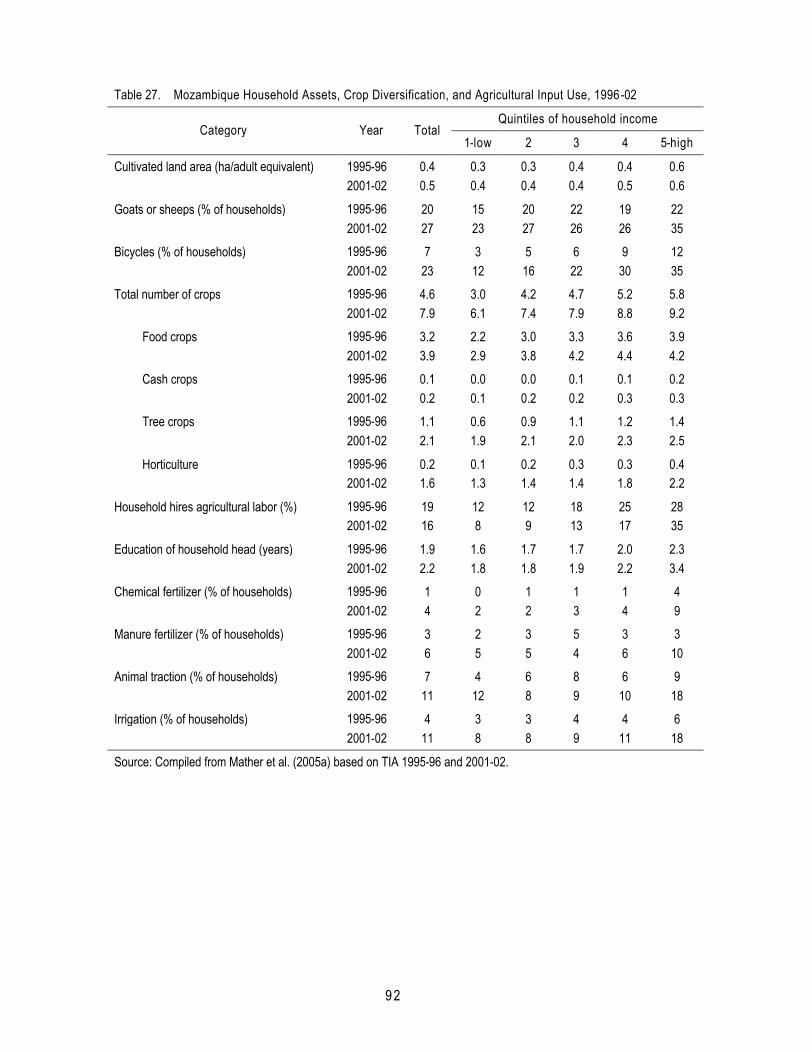
92
Table 27. Mozambique Household Assets, Crop Diversification, and Agricultural Input Use, 1996-02
Quintiles of household incomeCategory Year Total
1-low 2 3 4 5-high
Cultivated land area (ha/adult equivalent) 1995-96 0.4 0.3 0.3 0.4 0.4 0.62001-02 0.5 0.4 0.4 0.4 0.5 0.6
Goats or sheeps (% of households) 1995-96 20 15 20 22 19 222001-02 27 23 27 26 26 35
Bicycles (% of households) 1995-96 7 3 5 6 9 122001-02 23 12 16 22 30 35
Total number of crops 1995-96 4.6 3.0 4.2 4.7 5.2 5.82001-02 7.9 6.1 7.4 7.9 8.8 9.2
Food crops 1995-96 3.2 2.2 3.0 3.3 3.6 3.92001-02 3.9 2.9 3.8 4.2 4.4 4.2
Cash crops 1995-96 0.1 0.0 0.0 0.1 0.1 0.22001-02 0.2 0.1 0.2 0.2 0.3 0.3
Tree crops 1995-96 1.1 0.6 0.9 1.1 1.2 1.42001-02 2.1 1.9 2.1 2.0 2.3 2.5
Horticulture 1995-96 0.2 0.1 0.2 0.3 0.3 0.42001-02 1.6 1.3 1.4 1.4 1.8 2.2
Household hires agricultural labor (%) 1995-96 19 12 12 18 25 282001-02 16 8 9 13 17 35
Education of household head (years) 1995-96 1.9 1.6 1.7 1.7 2.0 2.32001-02 2.2 1.8 1.8 1.9 2.2 3.4
Chemical fertilizer (% of households) 1995-96 1 0 1 1 1 42001-02 4 2 2 3 4 9
Manure fertilizer (% of households) 1995-96 3 2 3 5 3 32001-02 6 5 5 4 6 10
Animal traction (% of households) 1995-96 7 4 6 8 6 92001-02 11 12 8 9 10 18
Irrigation (% of households) 1995-96 4 3 3 4 4 62001-02 11 8 8 9 11 18
Source: Compiled from Mather et al. (2005a) based on TIA 1995-96 and 2001-02.

93
Figure 12. Evolution of Crop Yields (from surveys), 1994-03 (kg/household)
0
100
200
300
400
500
600
TIA 1994 TIA 1996 CAP 1999-2000 TIA 2002 TIA 2003
Maize Rice SorghumMil let Peanuts Beans ( fe i jão nhemba) Beans ( fe i jão manteiga)
Source: Loening and Perumalpillai-Essex (2005) using agricultural census and survey data 1993/4 to 2002-3, Ministry of Agriculture.
Figure 13. Evolution of Mozambique Crop Yields (from Aviso Previo), 1993-01 (t/ha)
0.00
0.20
0.40
0.60
0.80
1.00
1.20
93-94 94-95 95-96 96-97 97-98 98-99 99-00 00-01
Maize Rice Beans Mil let So rghum Peanuts
Source: Loening and Perumalpillai-Essex (2005) based on Aviso Previo, Ministry of Agriculture.

94
Table 28. Key Characteristics of the Mozambique Agricultural Sector, 2000-03
Size and year for farm enterprise a Total
CharacteristicsSmall, 2000
Medium, 2000
Large, 2000
All farms, 2000
All farms, 2003 b
Number of farm households (‘000) 3,054.1 10.2 0.4 3,064.7 3,172.6Agriculture as main activity (% of
total population)… … … 65.5 …
Females: agriculture as main activity (% of females)
… … … 74.6 …
Agriculture as secondary activity (% of total pop.)
… … … 24.0 …
Females: agriculture as sec. activity (% of females)
… … … 17.2 …
Female household head (% of total)
… … … 23.1 25.7
Total cultivated land area (‘000 ha) 3,736.6 67.7 121.0 3,925.3 4,534.6Average cultivated land area
(ha/household)1.22 6.65 282 1.26 1.41
Area cultivated in food crops (%) 84.4 74.2 7.6 84.7 …Area cultivated in horticultural and
other crops (%)4.8 8.3 1.2 5.2 …
Area cultivated in cash crops (%) 4.7 5.1 30.2 5.6 …Land title (% of households with at
least one title)3.9 16.3 100.0 3.9 …
Assets (% of households)Cashew trees 41.6 26.6 20.7 41.6 34.9Mango trees 49.2 50.0 9.1 49.2 53.2Papaya trees 36.3 36.6 3.7 36.2 37.2Banana trees 30.2 33.4 13.5 30.2 …Orange trees 19.7 14.6 12.8 19.6 17.7Chickens 69.8 84.6 50.1 69.8 61.0Goats 27.6 81.3 69.5 27.8 26.4Pigs 19.6 31.8 26.1 19.7 14.0Cattle or oxen 4.1 83.2 79.0 4.4 4.1
Technology (% of households)Fertilizers 2.7 11.0 32.9 2.7 4.3Pesticides 4.5 10.3 36.1 4.5 5.2Animal traction 10.8 71.8 64.1 11.0 11.2Irrigation 3.9 16.9 35.4 3.7 11.0Extension services … … … … 13.3Farmer’s association … … … … 4.5Access to credit … … … … 2.9Basic agro-processing … … … … 46.4Seed supply as main agricultural
problem … … … … 82.0

95
Table 28.Key Characteristics of the Agricultural Sector in Mozambique, 2000-03 (continued)
Size and year for farm enterprise a Total
CharacteristicsSmall, 2000
Medium, 2000
Large, 2000
All farms, 2000
All farms, 2003 b
Education (% of household heads)Illiterate … … … 43.9 42.63 yrs of primary schooling or more … … … 38.2 38.9
Commercialization (% of production sold)
Maize … … … 22.0 17.1Rice … … … 18.0 21.5Sorghum … … … 6.0 4.7Millet … … … 4.0 1.8Groundnuts … … … 30.0 26.4Beans … … … 28.5 25.3
Household with price information (% of total)
… … … … 47.2
a. As defined in the 1999/2000 agricultural census, small-scale farms are those with less than 10 hectares of cultivated area, medium scale are those with 10-50 hectares, and large are those with over 50 hectares. However, in some cases, the census employs different criteria for farms having a significant amount of livestock or irrigated land. b. The TIA 2002-03 includes small and medium farm enterprises only.Source: Loening and Perumalpillai-Essex (2005) based on CAP 1999-00, TIA 2002-03, IAF 2002-03, and Bias and Donavan (2003).

96
Table 29. Food Crop Production for Small- and Medium-size Farms by Province, 2003 (tons)
Crop Niassa Cabo Delgado Nampula Zambézia Tete Manica Sofala Inhambane Gaza Maputo Total
Maize 159,636 92,654 89,047 298,821 182,891 171,196 103,789 16,686 56,450 7,622 1,178,792Rice 3,811 22,327 12,969 59,014 581 533 12,206 1,212 4,714 116 117,483Sorghum 10,369 46,031 25,575 23,710 11,902 32,189 38,965 448 1,631 1 190,820Millet 622 374 549 2,837 9,667 2,138 4,884 31 507 0 21,609Beans (feijão manteiga) 17,847 90 80 9,852 9,402 2,164 304 18 924 172 40,854Beans (feijão nhemba) 3,205 8,800 13,211 13,820 5,449 6,546 4,895 3,711 3,773 444 63,853Beans (feijão jugo) 1,155 634 6,241 5,640 240 1,517 760 788 1,478 38 18,491Beans (feijão boer) 758 4,165 2,054 40,286 1,607 859 1,421 12 195 1 51,358Cassava 284,260 315,911 2,696,409 1,826,334 132,458 167,099 331,617 571,727 183,665 37,818 6,547,298Sweet potatoes 93,784 7,746 17,619 124,592 259,686 101,402 174,302 10,469 71,653 15,905 877,156Source: TIA 2002-03.
Table 30. Cash Crop Production for Small- and Medium-size Farms by Province, 2003 (tons)
Crop Niassa Cabo Delgado Nampula Zambézia Tete Manica Sofala Inhambane Gaza Maputo Total
Cotton … 19,281 28,850 6,980 6,257 414 13,282 31 3 … 75,098Groundnuts 3,144 23,781 32,179 10,604 5,921 1,861 1,439 5,035 3,050 449 87,463Cashew 12 1,092 5,292 1,608 3 268 554 2,241 1,915 134 13,119Tobacco 19,626 … 2,515 5,419 19,418 3,828 221 37 1 11 51,077Sunflower 556 21 115 766 201 2,038 158 … 74 … 3,927Gergelim 113 3,459 4,951 340 476 1,618 2,630 … … … 13,587Source: TIA 2002-03.
Table 31. Number of Livestock by Province, 2003
Livestock type Niassa Cabo Delgado Nampula Zambézia Tete Manica Sofala Inhambane Gaza Maputo Total
Cattle 6537 2918 10419 3253 362,098 132,052 10,650 87,052 308,482 45,856 969,317Pigs 220 67,133 88,052 282,286 186,672 139,235 86,864 287,867 191,474 24,266 1,354,070Chickens 686,136 919,857 1,769,852 3,317,487 1,414,284 2,465,596 1,323,123 1,503,914 3,802,012 444,417 17,646,679Source: TIA 2002-03 and Ministry of Agriculture.

97
Table 32. Sole Crops of Basic Foods, 2000
Planted area (ha)
Food cropNumber of holdings Percent Crop area Percent Average area
Maize 2,433,019 79.4 1,345,656 34.8 0.6Rice 638,669 20.8 193,109 5.0 0.3Sorghum 828,001 27.0 236,043 6.1 0.3Millet 142,912 4.7 40,125 1.0 0.3Cassava 1,956,265 63.8 646,479 16.7 0.3Sweet potato 376,690 12.3 47,994 1.2 0.1Peanut 1,261,906 41.2 332,073 8.6 0.3Cowpea 1,332,721 43.5 213,149 5.5 0.2Common bean 243,176 7.9 61,671 1.6 0.3Pigeon bean 533,286 17.4 72,762 1.9 0.1Mung bean 649,310 21.2 85,610 2.2 0.1
Source: CAP 1999-00.
Table 33. Unmixed Area by Main Cash Crops, 2000
Planted area (ha)
Food cropNumber of holdngs Percent Crop area Percent Average area
Cotton 186,853 6.1 131,974 3.4 0.7
Tea 8 0.0 14,880 0.4 1,860.0
Sugar cane 71,921 2.3 35,345 0.9 0.5Ginger 1,861 0.1 223 0.0 0.1
Sunflower 22,969 0.7 7,599 0.2 0.3
Sisal 1 0.0 20 0.0 20.0
Soya bean 8,303 0.3 1,299 0.0 0.2
Tobacco 57,953 1.9 26,634 0.7 0.5
Source: CAP 1999-00.

98
Table 34. Number of Holdings and Unmixed Areas, Selected Horticultural Crops, 2000
Planted area (ha)Horticultural crop Number Percent Crop area Percent Average area
Pumpkin 622,591 20.3 87,721 2.3 0.1Lettuce 29,228 1.0 2,662 0.1 0.1Garlic 15,076 0.5 1,183 0.0 0.1Potatoes 29,286 1.0 6,476 0.2 0.2Egg Plant 1,186 0.0 106 0.0 0.1Onion 51,504 1.7 5,139 0.1 0.1
Source: CAP 1999-00.
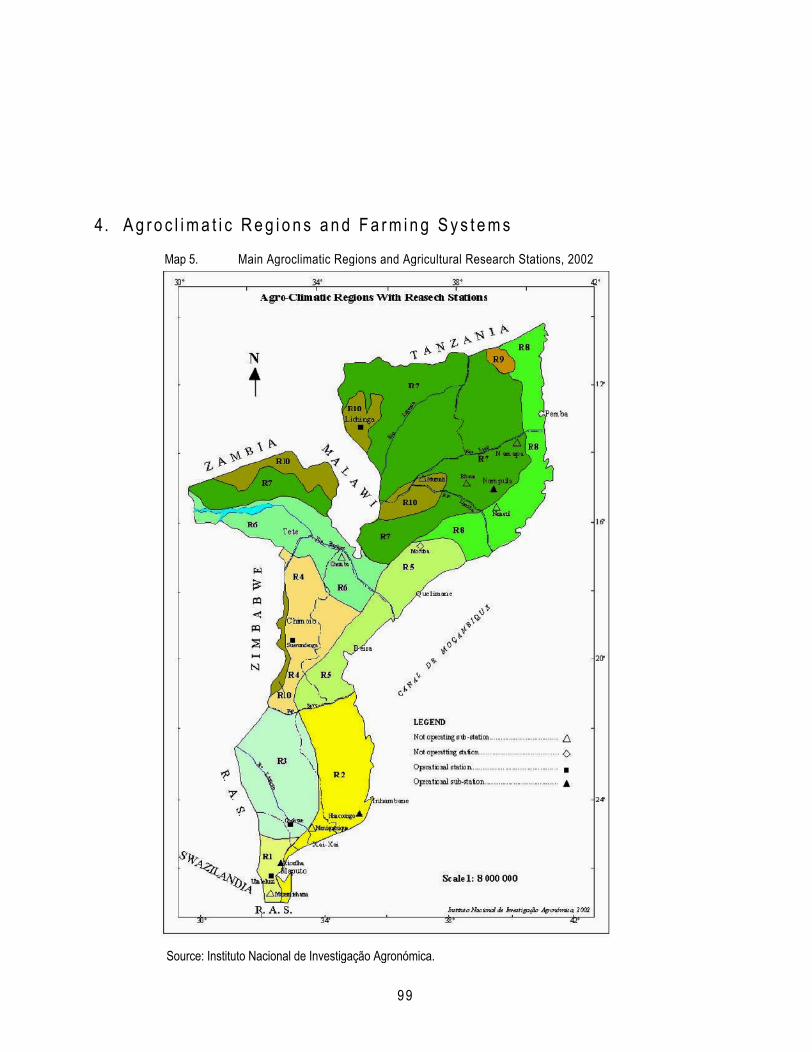
99
4. A g r o c l i m a t i c R e g i o n s a n d F a r m i n g S y s t e m s
Map 5. Main Agroclimatic Regions and Agricultural Research Stations, 2002
Source: Instituto Nacional de Investigação Agronómica.

100
Table 35. Main Agroecological Zones and Farming Systems in Mozambique
Zone Zone description Farming system description
Region (R1) —inland Maputo and iouth Gaza
The inland Maputo and south Gaza region is a small area covering the Inland strip of Maputo Province and the southern inland of Gaza Province. The major part of the region is under 200 meters altitude, the land of Namaacha reaches 500 meters altitude. Rains are concentrated from November to March and the season characterized by great irregularity with respect to the beginning, duration, and quantity of precipitation. Rain can occur in this region during the cool season. During the growing period a moderately warm temperature dominates (20-25 °C). With the exception of the region of Pequenos Libombos, Moamba, Limpopo valley, Incomati and Umbeluzi rivers, the soils are sandy or sandy loams.
Farmers cultivate land all year. During the rainy season they produce maize, cowpea, peanuts and cassava. The most preferred soils for cassava and groundnut are of light texture. Given the short duration of the growing season, short-cycle crop varieties are normally used. Sweet potato is grown on the lowest land and along watercourses and where moisture is retained. This region has large areas of pasture with a rural population that traditionally raises cattle and goats. In the region, important areas of irrigation exist that could be increased in the medium term.
Region (R2) —coastal region south of the Save River
The coastal region south of the Save River is an extensive area from southern Maputo Province to northern Inhambane Province that has one of the highest population densities in the country. There is a warm rainy season between November and March in most of the region, not including an area adjacent to the coast where rain can start in October and last until April. Rains can occur during the cool season, which has particular benefits for cassava and cashew nut. With the exception of alluvial land and certain low zones, the soils have a sandy texture.
The most important annual crops are maize, cowpea, groundnut, sweet potato, and cassava. Depending on the type of land, maize/cowpea and cassava/groundnut are the dominant crop systems. Due to the limited availability of land, there is a tendency to intercrop all four crops. The bush fallow rotation is in decline due to land shortage, and the fallow period has been reduced from 20 years to 5 years with 3 years of cropping. Without the use of fertilizers where conditions allow, it can be expected that land productivity will decrease significantly. The production of cashew in this region is one of the most important sources of income for the rural population. Local farmers can earn 2 –3.5 million metical . The low areas and the river valleys are important for rice production.
Region (R3) —center and north of Gaza and the west Inhambane
The central and northern parts of Gaza and the west Inhambane region consist of a vast interior zone with little population. It is one of the most arid regions of the county with an annual rainfall of only 400-600 mm, concentrated between November and February. Given the lack of soil moisture, sorghum and millet are also grown in the region. Maize has limited potential.
Family farmers also have small holdings of cattle and goats. Considering the duration of the crop growing period, short-cycle varieties and techniques of moisture conservation are important requirements to ensure an acceptable degree of food self-sufficiency for the rural population of this region.

101
Table 35. Main Agroecological Zones and Farming Systems in Mozambique (continued)
Zone Zone description Farming system description
Region (R4) —medium altitude region of central Mozambique
The medium altitude region of central Mozambique is a region that includes land between 200 and 1,000 meters above sea level located in the Provinces of Sofala and Manica. It has an annual rainfall of 1,000-1,200 mm concentrated between November and March. The crop growing period is 120-180 days. The majority of soils are light, with some occurrence of heavy soils. The average temperature during the crop growing period is 17.5 -22 °C.
Main crops are maize, sorghum, cassava, and cowpea. In the more moist areas, farmers cultivate sweet potato and rice. This region has good potential to produce cotton. It is a region with moderate to high population.
Region (R5) —low altitude region of Sofala and Zambézia
The low altitude region of Sofala and Zambézia embraces a strip of land on the coast of variable width that extends from the south of Sofala to Pebane district in Zambézia province. Depending on the topography, soils have a sandy texture alternating with regions of heavy texture (fluvisols and vertisols). In general the region has moderate to high annual rainfall (1,000 mm-1,400 mm) and a corresponding evapo-transpiration range. The rainy period starts in November and ends between March and May, depending on the area.
In heavy soils, rice cultivation is dominant. In regions of well-drained soils, maize, sorghum, millet, cassava, and cowpea are found in association depending on the availability of land and water. Cashew and cotton are important cash crops in the farming systems. Production estimates vary along the area, i.e., maize production of 600-800 kg/ha, sorghum and millet of 500 to 750 kg/ha, cassava of 6,000-8,000 kg/ha.
Region (R6) —Semi-arid Region of the Zambézi Valley and Southern Tete Province
The semi-arid region of the Zambézi valley and southern Tete province includes from the driest region of the Zambézi watershed upstream from Mopeia district to the border of Zambia. Most areas do not exceed 200 meters in altitude, and the rainfall is 500-800 mm, concentrated between November and March. Downstream is rainier and has two distinct regions of annual evapo-transpiration potential: one of 1,200-1,400 mm and an area with a large water deficit for most of the year and an elevated risk of crop loss.
The crops of sorghum and millet average 600 kg/ha. Cassava is not cultivated due to the complete absence of rain during the cool season and the elevated evapo-transpiration rate. There is great potential for cotton cultivation on well-drained land and rice on the margins of watercourses.
Region (R7) —Médium Altitude Region of Zambézia, Nampula, Tete, Niassa and Cabo Delgado
The medium altitude region of Zambézia, Nampula, Tete, Niassa and Cabo Delgado is vast and includes the land between 200 and 1,000 meters in altitude (sub-planaltic, low planaltic, and mid-planaltic) in the interior of Zambézia, Nampula and southern Cabo Delgado and Niassa. The annual rainfall and potential evapo-transpiration of the region ranges from areas above 25 °C (classified as warm region) and others with temperatures of 20-25 °C (moderately warm). The texture of the soils varies from sandy to clay, consistent with the topography.
Basically there are two types of cropping systems that differ by being dominated by maize or sorghum. Cassava is widely cultivated, cowpeas and groundnuts are other important crops. In the eastern-most part of the region cashew is very important, in almost the entire region there is high potential for cotton production that has been practiced over several decades. This is an agricultural area with important human and agroecological potential. Typical maize yields average 1,000 kg/ha, while sorghum production averages 750 kg/ha.

102
Table 35.Main Agroecological Zones and Farming Systems in Mozambique (continued)
Zone Zone description Farming system description
Region (R8) —coastal litoral of Zambézia, Nampula and Cabo Delgado
The coastal littoral of Zambézia, Nampula and Cabo Delgado consists of a strip of land of varying width on this coast from Pebane in Zambézia to Quionga in Cabo Delgado. The average temperature during the growing season is greater that 25 °C. The annual rainfall ranges is 800-1,200 mm, and the evapo-transpiration rate is 1,400-1,600 mm. Sandy soils, with heaver soils in the lowest areas.
The production system is characterized by the production of cassava and millet. In the low areas, rainfed rice is cultivated. Cashew has great importance for income for family farmers.
Region (R9) —north interior region of Cabo Delgado –Mueda Plateau
The northern region of Cabo Delgado includes the plateau of Mueda and Macomia and the surrounding areas of more that 200 meters altitude. The annual rainfall is 1,000 mm-1,200 mm, and the annual evapo-transpiration potential is 1,200 mm -400 mm. The rains are concentrated between December and March and are normally regular. The soils are loamy to sandy texture, with heavier soils occurring in the lowest areas.
The dominant crop in the production system is maize. Sorghum, cowpeas, cassava, and sesame are also cultivated. Cashew is an important source of income.
Region (R10) — high altitude region of Zambézia, Niassa, Angonia and Manica
The high altitude region of Zambézia, Niassa, Angonia-Maravia includes land above 1,000 meters, notably in the planaltic regions of Lichinga, Angonia, Maravia, high Zambézia, Serra Choa, Manica and Espungabera. The annual rainfall is greater that 1,200 mm and average temperature during the period is 15-22.5 °C. The soils are principally ferrasols.
Apart from maize, common beans and potatoes are the main crops. Given the high levels of rainfall, erosion, and the loss of soil fertility are important problems. Finger millet is also cultivated in the area and has important potential as a food and cash crop.
Source: IFAD (2005).

103
5. T h e S i g n i f i c a n c e o f E x t e n s i o n
Agricultural extension helps to improve livelihoods in rural Mozambique, but its main problem is its limited coverage. Only about 13 percent of rural households have access to extension. These are the main messages that emerge from an analysis of a household survey of extension services and related expenditures analysis in rural Mozambique.145 It is important to note that previous analysis in Mozambique has mostly been unable to identify positive effects of extension services on rural livelihoods.146 The present review can be seen as a response to this call.
A key instrument in the analysis is a survey of 478 households in rural areas. The questionnaire was designed as a follow-up analysis of the 2001-02 and 2002-03 agricultural survey. The survey was conducted in October 2004, an important distinction because extension services in Mozambique have seen a significant developments.
The study analyzes the effectiveness and efficiency of public expenditures in rural areas with particular focus on the agricultural extension service. To improve productivity in agriculture, significant public resources are allocated to the sector, of which large portions are donor funded. MADER reports that 81 percent of the resources of the important program PROAGRI are provided by donors, however, it is not known whether the resources going into the sector or the particular programs actually contribute to development of the country. Increasing productivity in agriculture is essential to development of Mozambique, and extension plays a key role, including seed distribution.
Signif icant Impact of Extension of Rural Livel ihoodsThe message from Figure 14 is that extension advice matters for living conditions, and illustrates responses to the question of how household conditions compare with the previous year. Using mean scores, the answers are sorted by whether or not households received advice from an extension office. For both an overall impression of living conditions and two important determinants (production and sales), households receiving extension advice report significantly more improvement than other households. The difference is significant at the 1 percent level. Correlation does not mean causation; variables that are correlated with extension service advice but hidden might cause the correlation implied by the figure.

104
Figure 14. Rural Household Conditions Compared With Previous Year, 2004
Source: ECON Household Survey
In order to test this possibility multiple regression analysis were undertaken, with encouraging results. Once controlled for outside factors, the analysis finds that extension services have a positive effect on rural livelihoods (e.g., perceived changes or rural well-being). The effect of having received extension advice is significant. That is, a household that has received advice is much more likely to answer positively to the question how do their household conditions compare with the previous year. That is the same result as what Figure 14 predicts. The results are considered to be robust. In fact, they are almost independent of the underlying econometric model or data source. For example, the regression analysis undertaken for this strategy, finds very similar results.147 Both in the 2001-02 TIA and 2002-03 IAF (Table 24) extension turns out to be an important explanatory variable for crop income or rural consumption. Interestingly, extension services from NGOs have a higher explanatory power and are more significant than public extension.
Building on these results, the analysis finds that extension works mainly through the introduction of new crop varieties. According to the survey, 43 percent of respondents introduced new varieties in the last five years if they had received advice. Only one-half as many (21 percent) introduced new varieties if they had not received advice. Farmers who introduced new varieties can count on a significantly higher probability of reporting improved living conditions. The extension service also works by encouraging new techniques. In particular, it seems that extensionists have been very successful in promoting natural pesticides among the farming population. Use of natural pesticides is a
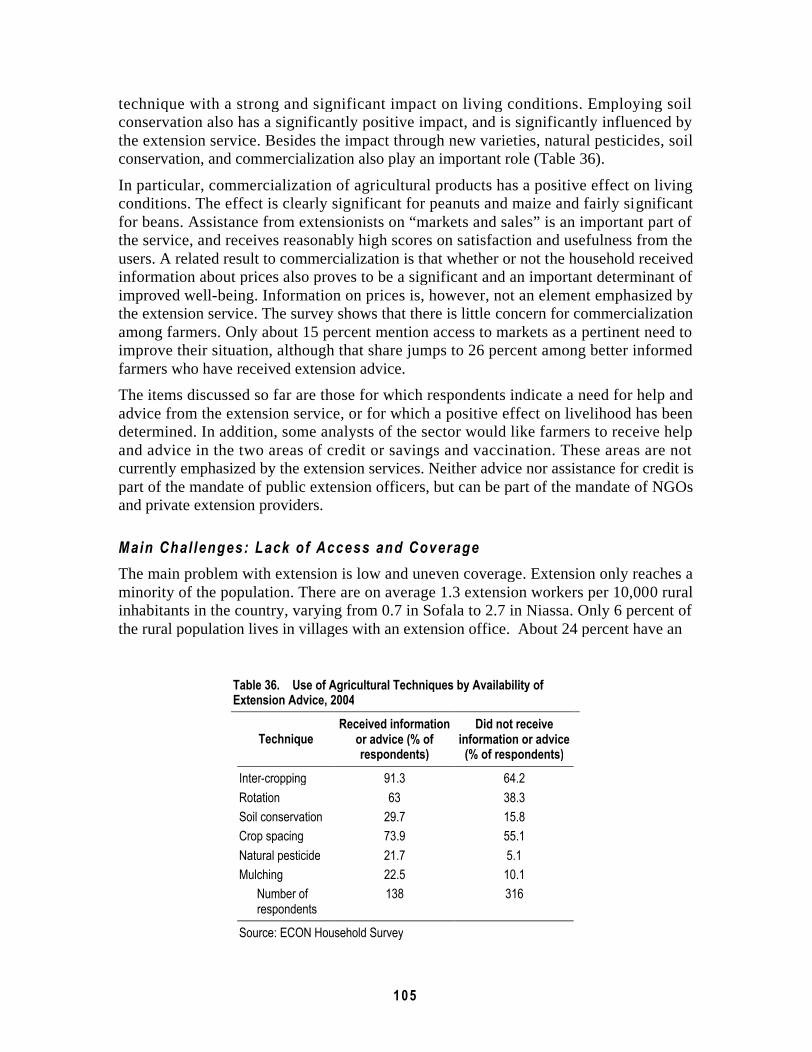
105
technique with a strong and significant impact on living conditions. Employing soil conservation also has a significantly positive impact, and is significantly influenced by the extension service. Besides the impact through new varieties, natural pesticides, soil conservation, and commercialization also play an important role (Table 36).
In particular, commercialization of agricultural products has a positive effect on living conditions. The effect is clearly significant for peanuts and maize and fairly significant for beans. Assistance from extensionists on “markets and sales” is an important part of the service, and receives reasonably high scores on satisfaction and usefulness from the users. A related result to commercialization is that whether or not the household received information about prices also proves to be a significant and an important determinant of improved well-being. Information on prices is, however, not an element emphasized by the extension service. The survey shows that there is little concern for commercialization among farmers. Only about 15 percent mention access to markets as a pertinent need to improve their situation, although that share jumps to 26 percent among better informed farmers who have received extension advice.
The items discussed so far are those for which respondents indicate a need for help and advice from the extension service, or for which a positive effect on livelihood has been determined. In addition, some analysts of the sector would like farmers to receive helpand advice in the two areas of credit or savings and vaccination. These areas are not currently emphasized by the extension services. Neither advice nor assistance for credit is part of the mandate of public extension officers, but can be part of the mandate of NGOs and private extension providers.
Main Chal lenges: Lack of Access and CoverageThe main problem with extension is low and uneven coverage. Extension only reaches a minority of the population. There are on average 1.3 extension workers per 10,000 rural inhabitants in the country, varying from 0.7 in Sofala to 2.7 in Niassa. Only 6 percent of the rural population lives in villages with an extension office. About 24 percent have an
Table 36. Use of Agricultural Techniques by Availability of Extension Advice, 2004
TechniqueReceived information
or advice (% of respondents)
Did not receive information or advice (% of respondents)
Inter-cropping 91.3 64.2Rotation 63 38.3Soil conservation 29.7 15.8Crop spacing 73.9 55.1Natural pesticide 21.7 5.1Mulching 22.5 10.1
Number of respondents
138 316
Source: ECON Household Survey

106
office within 50 kilometers of their farms, which means that three-fourths of households have to travel more than 50 kilometers to reach an office. Close to one-half of all households (43 percent) must travel more than 200 kilometers. Because extension officers travel, 14 percent of smallholders had received extension advice over a 12-month period, and one-third of the rural population lived in a village that had access to extension officers during the same period. However, based on the evidence it is fair to say that at least 50 percent of the rural population has no access to the extension service.
The evidence suggests that MADER makes an effort to allocate resources toward the poorest provinces. When NGO and commercial services are added to the government service, the analysis shows that farmers in the poorest provinces receive less extension advice than the other provinces. The NGO service does not seem to contribute to an equitable profile of the extension service. There are twice as many NGO extension workers as there are government extension workers in Mozambique, but there are more villages reporting access to a government extension service than to an NGO service. Similarly, commercial or private extension does not seem to contribute to an equitable profile. Only about 11 percent of extension workers are commercial or private, and they are concentrated in a limited number of districts in three provinces. Private and commercial extension service workers are primarily concerned with extension services to cash crop farmers, which is a minority of the farmers in Mozambique.
Increased coverage is the key to animproved extension service. Overall, the agricultural extension service is providing valuable advice and material goods to those who receive it. The assistance in introducing new crop varieties, natural pesticides, soil conservation, and help with commercialization has a robust and significant beneficial effect. Other services such as introducing other agricultural techniques also respond to the needs of those who are targeted by the program. In addition, there remains a significant and strong direct effect of extension, thus it appears that the extension service in Mozambique is in many respects well conceived.
Improvements, however, could be made through greater focus on providing assistance and information about prices, which has a strong measured beneficial effect, but is not a priority area of the extension service at present. Other aspects of commercialization may also deserve stronger emphasis because the awareness of its importance among farmers seems low. Advice and information about credit and saving schemes, as well as on vaccinations, are also warranted. An extension service that is inaccessible to the overwhelming part of the rural population is a significant cause of low agricultural productivity in Mozambique.

107
6. Ef fects of Neighbor ing Countr ies on Mozambique Agriculture
Agricultural development in Mozambique partly depends on policies set in neighboring countries. Geographical location, neighboring country policies or programs, and the regional political economy can affect growth of the agriculture and rural sectors in Mozambique. This appendix reviews and analyzes agricultural policies, food crop production, production costs and margins, marketing of agricultural produce, and prices for major food crops and cash crops.148 Malawi, Zimbabwe, and Zambia are discussed in this context.
Overall agricultural policies in the four countries broadly have the same objective, but the strategies for their implementation differ significantly. Agricultural input and output price controls and subsidies through Government intervention are commonly applied by the three neighboring countries, while Mozambique has moved toward a free market where the private sector predominates and the Government has refrained from intervention. The previous price policy for agricultural products has from 1996 gradually changed following a program of price liberalization. In Mozambique the general aim of the new agricultural policy is transformation of subsistence agriculture to agriculture more integrated with production, distribution, and processing with marketable surpluses, and to develop an efficient business sector integrated with agricultural activities.
Zimbabwe Zimbabwe is dominated by smallholder production, albeit large-scale farmers are more important than in Mozambique. Prior to land resettlement, the Zimbabwe agriculture sector included some 5,000 large-scale commercial farmers, 1.3 million smallholder households, and approximately 70,000 small-scale commercial and resettlement households. With land redistribution beginning in 2000, 4,000 to 4,500 large-scale commercial farmers have been forced off the land, with an estimated 200-300 left with their farms.
In the early 1990s, Zimbabwe adopted a liberal agricultural policy under which most agricultural crop markets were without government intervention, most parastatals were privatized, and domestic and foreign trade were liberalized. The main exception was the maize market in which the government continued to interfere. Producer floor prices are still maintained through the government-controlled Grain Marketing Board. The Government also controls maize exports through licensing requirements, and today private commercial maize exports are banned and imports are only allowed on a petty trader scale. The drastic policy changes have dramatically damaged the agriculture and food situation — the country has been transformed from a fairly large agricultural exporter to now being dependent on food aid. With consumption requirements of some

108
1.4 million metric tonnes it appears that the maize deficit in 2003-04 was about 400,000-450,000 metric tonnes.
Malawi Malawi has one of the highest population densities in Sub-Saharan Africa with arableland per rural dweller of 0.23 hectare compared to an average 0.4. Food production has not kept up with the population increase and maize production stands at 1.6-1.7 million metric tonnes compared to 1.3-1.4 in 1983-84. The country is a net importer of food crops and larger quantities of maize have been imported by the Strategic Grain Reserve and relief agencies in recent years. The commercial import of maize is in most years below 50,000 metric tonnes.
The Malawi Agricultural Sector Investment Program (MASIP) was created in 1999 but implementation has been slow. The Strategic Plan 2003-2008 for the Ministry of Agriculture and Irrigation supersedes both MASIP and the Agricultural and Livestock Development Strategy and Action Plan from 1995. The input and crop markets are in general open and free from government intervention, however, the government continues to intervene in the markets through ADMARC and creates uncertainty by its price policy. Maize imported and disposed off by NFRA has been heavily subsidized and a serious maize shortage in 2001-02 was probably influenced by ADMARC setting an unrealistically low sales price for white maize grain, forcing private grain importers out of the market.
The Government of Malawi also plays a significant role in the agricultural input sector. Through the Targeted Input Program the government provides subsidized fertilizer and seeds to “vulnerable” smallholders through “starter packs”. In the 2004-05 cropping season about 20 percent of the total fertilizer supply was given away, which created a shortage because private importers could not compete, and once the government approved a subsidy it was too late and only one-third of the national requirement arrived in time for planting.
ZambiaAgriculture and population in Zambia are relatively unconstrained by land and water resources and approximately 400,000 square kilometers have some agricultural potential, but only 9 million hectares are classified as having medium to good potential. Maize is the predominant smallholder crop but the traditional maize growing areas except for the northern province are experiencing increasingly erratic production due to drought and soil deterioration. Over the past decade maize production in Zambia has declined and commercial farmers are increasingly replacing it with high-value export-oriented crops.
The Zambia Agricultural Commercialization Program aims to facilitate sustainable and broad-based agriculture sector growth over the period 2002-05 by focusing on increasing income generation from farming through improved access to marketing, trade, agroprocessing opportunities, agricultural finance services, improved agriculture infrastructure, appropriate technology, and information. The program focuses on promoting development of small- and large-scale commercial agriculture in order to

109
achieve the overall goal of sustainable and broad-based agricultural growth as a basis for poverty reduction and economic growth.
The Strategic Grain Reserve is an active player in the maize market but its mandate is unclear and has been unsuccessful in developing and stabilizing the maize market. Recent Government interventions in input supply have tended to make the private sector lose confidence in the government’s stated policy of retreating from this area in favor of the private sector. Similarly, the Government’s intervention in the maize market in the form of export bans and farm-gate prices has a negative effect on private sector involvement in this market.
The Food Reserve Agency (FRA) purchased some 90,000 metric tonnes of maize from small-scale farmers in the 2004-05 season. The announced producer price effectively also functions as a market minimum as long as FRA is active in the market. As FRA withdraws after having secured its stocks, the producer price becomes a function of private sector purchases. The government bans exports of maize grain in years of anticipated scarcity. With an official shortfall in the 2004-05 season of some 300,000 metric tones, an export ban is currently in place.
Since economic reforms began, the Government has intervened in supply markets by importing fertilizer. The government’s Fertilizer Support Program, which was initiated in 2003-04, gives a 50 percent subsidy to fertilizer distributed through registered cooperatives. Another major fertilizer subsidy program is the Food Security Starter Pack scheme where the subsidy level is 70-80 percent. In a diversion from its original mandate, FRA was also distributing fertilizer for some years up to 2003-04. These “fertilizer loans” were based on barter, with FRA receiving maize in return with a recovery rate as low as 35 percent.
Impact of Agricultural Pol icies and Cross-border TradeThere is a significant difference among the countries in interpretation and implementation of policies and how to achieve the goals stipulated in their agricultural strategies. Malawi and Zambia apply heavy subsidies (supported by donors) on agricultural inputs, in particular fertilizers. The three neighboring countries, from time to time, intervene in produce marketing through state-owned enterprises. The Government of Mozambique has since the late 1990s not intervened and has largely left input supplies and produce marketing to the private sector. The situation in Zimbabwe is unclear after changes in government policies and land redistribution, which sharply decreased agricultural production.
The food crop production pattern in the region is similar with maize as the major crop for small-scale farmers. Along with other cereals, maize is more than one-half of food crop production, with a major part of production undertaken by subsistence farmers. A large part of maize production in Zimbabwe and to a certain extent in Zambia was previously grown by commercial farmers, but this has now changed dramatically in Zimbabwe. All countries in the region except South Africa usually have a deficit of cereals, but during years with favorable climatic conditions, Zambia and Tanzania have surplus production.
One analysis suggests different estimates for informal cross border trade between Mozambique and its neighboring countries ranging from below 100,000 to 200,000

110
metric tonnes for maize. The lower figures are likely to be the most accurate considering that a considerable quantity is traded on the domestic market. Other studies suggest that Mozambique is supplying more than 90 percent of the informal maize imports by Malawi and is the biggest exporter in the informal maize market in SADC, with a market share of more than 70 percent. Around half of Mozambique’s maize destined for Malawi passes the border post at Muloza in Mulanje district. Most of the maize from Mozambique is traded at the actual border although some of it is brought by Mozambique traders to urban centers such as Blantyre in the southern region.
The cross-border trade of other cereals is insignificant, while some smaller quantities of other food crops like beans and peas are traded across the border, in particular at harvest. Most rice that is informally traded within SADC originates in Asia and reduces the peaks and troughs in seasonal availability of the commodity. Malawi and Zambia are more or less self-sufficient in dry common beans although minor quantities are traded informally with Malawi from Mozambique. Although Mozambique and Zambia have a comparative advantage in dry bean production, it is unlikely that any significant trade with the neighboring countries will take place.
The free movement of produce across borders is hampered by a number of non-tariff barriers, including requirements for entry documents, invoices, and certificates, which in most cases cannot be met by traders. The grading, safety, and phytosanitary standards and requirements for import of agricultural produce still vary across the region, although the countries have signed the SADC trade protocol that aims to promote, coordinate, and harmonize regional trade in order to improve food security. Regulatory requirements for transportation across the frontier contribute to barriers. Although the SADC transport protocol has been signed, harmonization is still required within insurance, road user charges, weight restrictions. and license requirements. Duties, charges, and restrictions at the discretion of local officials and lack of inspection facilities when quality problems arise hamper cross-border trade.
Mozambique’s southern region is the major market with a maize deficit and determines the upper price level in the current situation based on import prices or export parity prices. The lower price level prevailing in surplus areas would be reflected by the export parity price and/or the Maputo price. Maize retail prices are low at harvest time after which they build, reaching a peak in the January and February. The price difference between producing surplus areas and consumption centers is considerable and reflects the poor state of the marketing structure through high margins mainly for transportation. The analysis of the value chain for cross-border trade shows that during harvest when there is a surplus, the price is determined by the CIF price in Maputo, and during the lean season the price is determined by demand from Malawi.
Policy Implicat ionsThe interventions discussed above have been erratic, without a long-term perspective, and are not based on profitability and return on the investment, but rather on increased food security without considering cost effectiveness of the investment. They are based on previous experience, and it is doubtful if massive support to subsistence farmers through extension, input subsidies, and intervention in the produce market is sustainable.
111
Introduction of floor prices has not had the desired effect. There are no financial resources to implement intervention policies.
The shift from subsistence to efficient commercial farming will most likely reduce the number of farmers and larger holdings per farmer. More emphasis on production of higher value crops, including value-added processing, will create employment opportunities and generate income for the rural population. Sugar is likely to be one of the most important export commodities in the future with removal of the EU subsidies and Mozambique has a comparative advantage in the region for access to the market. The region (except South Africa) has a large net import of cooking oil because few refiners demand oil crops for processing. The production of oil crops is on its increase and should be facilitated with an expanded processing industry.
Increased access to finance is essential for the development of the agriculture sector and generation of income among small-scale farmers. Seasonal price fluctuations are mainly caused by lack of means to finance and store crops, resulting in extremely low prices at harvest when farmers are forced to sell their produce. Inventory credit schemes to establish warehouse systems, where farmers are allowed to use crop receipts as collateral in order to obtain financing from banks, should be explored and encouraged.
Mozambique has the potential and some comparative advantages for production, processing, and export of cash crops, including land and water resources, labor, direct access to world marketed through its ports, an influx of expertise and resources from some neighboring countries, and a relative stable economic policy. Other neighboring countries (Zambia, Tanzania) are currently developing strategies to support small-scale contract farmers through partnerships between the public and private sectors within agriculture. The focus is on higher value crops that can be processed locally and create employment and generate income.

112

113
7. HIV/AIDS and Agricul ture
Agriculture and rural development are seriously affected by the prevalence of HIV/AIDS. A popular assumption is that AIDS-related mortality produces severe labor constraints, increased poverty, and land scarcity among affected households. The subsequent implication is that HIV/AIDS mitigation policies should prioritize technology and assistance targeted to affected households, for example, labor-saving technologies.
Mather et al. use nationally representative rural household survey data to evaluate the characteristics of affected individuals and households, household demographic changes, and livelihood adjustment strategies in response to prime-age death.149 Analysis of household composition of affected and non-affected households from 1999 to 2002 demonstrates that affected households do not uniformly have less available prime-age (PA) labor than non-affected households, either because affected households are able to attract new PA members or because they had more PA adults prior to death.
The survey found that PA women are more likely to die from illness than men (62 percent). Affected PA women tend to be younger than affected PA men, which concurs with previous estimates of HIV prevalence in Mozambique that show women to be a majority of the total HIV population. However, in contrast to the general assumption that HIV-related mortality is typically associated with household heads/spouses, the survey
Figure 15. Responses to Prime-Age Adult Chronic Illness by Gender, 1999-02
Source: Mather et al. (2005b, 2005c).
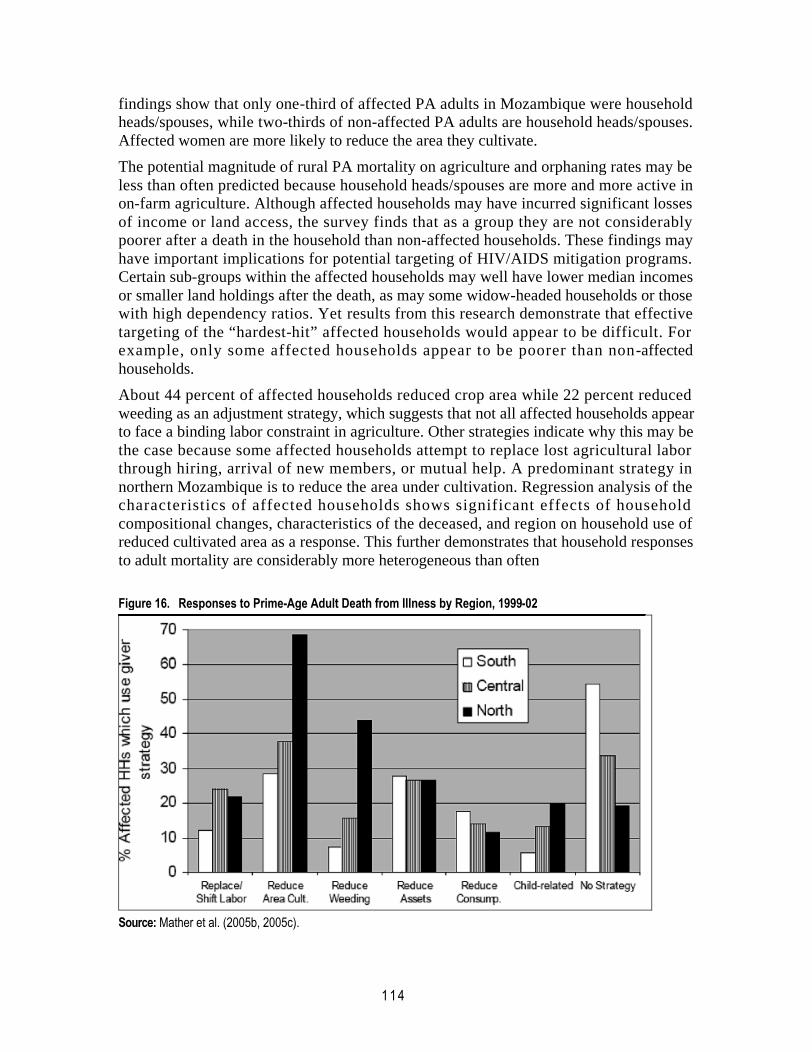
114
findings show that only one-third of affected PA adults in Mozambique were household heads/spouses, while two-thirds of non-affected PA adults are household heads/spouses. Affected women are more likely to reduce the area they cultivate.
The potential magnitude of rural PA mortality on agriculture and orphaning rates may be less than often predicted because household heads/spouses are more and more active in on-farm agriculture. Although affected households may have incurred significant losses of income or land access, the survey finds that as a group they are not considerably poorer after a death in the household than non-affected households. These findings may have important implications for potential targeting of HIV/AIDS mitigation programs. Certain sub-groups within the affected households may well have lower median incomes or smaller land holdings after the death, as may some widow-headed households or those with high dependency ratios. Yet results from this research demonstrate that effective targeting of the “hardest-hit” affected households would appear to be difficult. For example, only some affected households appear to be poorer than non-affected households.
About 44 percent of affected households reduced crop area while 22 percent reduced weeding as an adjustment strategy, which suggests that not all affected households appear to face a binding labor constraint in agriculture. Other strategies indicate why this may be the case because some affected households attempt to replace lost agricultural labor through hiring, arrival of new members, or mutual help. A predominant strategy in northern Mozambique is to reduce the area under cultivation. Regression analysis of the characteristics of affected households shows significant effects of household compositional changes, characteristics of the deceased, and region on household use of reduced cultivated area as a response. This further demonstrates that household responses to adult mortality are considerably more heterogeneous than often
Figure 16. Responses to Prime-Age Adult Death from Illness by Region, 1999-02
Source: Mather et al. (2005b, 2005c).

115
depicted, however, given the extent of rural poverty and the lack of broad-based growth of rural economic productivity in Mozambique, there is a need for an appropriate balance between investments in long-term rural economic growth and targeted assistance to AIDS-affected households and communities.
The loss of family labor due to a household death may not necessarily mean that agricultural labor becomes the limiting input in agricultural production. Both demographic changes and choice of cultivated area may come into play. In addition, available time-use data from neighboring Zambia suggest that the returns to investing in labor-saving technologies for domestic tasks are likely to be much higher than that for labor-saving technologies in agriculture given that more hours per household would likely be saved by the former, and that such technologies would also benefit many poor but non-affected households. Caution is therefore warranted before scarce agricultural research funds are diverted to labor-saving crop and input technologies intended for HIV/AIDS-affected households.
This heterogeneity of household responses to PA mortality has significant implications for the development of labor-saving agricultural technologies. Given scarce financial and human capital resources for applied technology research in Mozambique, consideration should be given to how potential returns to labor-saving technologies for agriculture might compare with technologies that could reduce labor demands for household domestic tasks such as food processing (e.g., hammermills or other food processing technologies for maize and cassava) and gathering water and fuel (e.g., community wells, fuel-efficient stoves). In addition, while specialized programs may be required to promote and finance labor-saving technologies for domestic tasks, these investment costs would generate benefits for many households living in poverty, not just the targeted households affected by HIV/AIDS.
More fundamentally, the development and dissemination of agricultural labor-saving technologies challenges the capacity of the research and extension system (governmental and non-governmental), which reaches very few farmers. Few have access to or have adopted improved varieties or cultural practices, thus shifting the focus of the limited financial and human capacity of Mozambican agricultural research and extension to respond to perceived demands of a relatively small group of geographically-dispersed farm households. This focus could strain the capacity of the system and would likely divert resources from development and dissemination of technologies appropriate for the vast majority of farm households.
Finally, the HIV/AIDS epidemic is a serious threat to Mozambican agriculture not only given its impact on labor or human capital, but also because of it seriously affects rural extension staff and primary school teachers. The Ministry of Agriculture is currently undertaking an impact study on its staff and the institution as a whole, and while this study is still underway, provisional findings show that that 1,800 to 2,400 staff (or 17 percent) have already been infected. Projections indicate that if this trend continues, the number of infected staff may reach 3,300 to 3,700 in 2,010. The Ministry of Agriculture could loose approximately 1,700 staff due to HIV/AIDS, which in turn represents a loss of about US$13 million invested in training and capacity building.

116
117
8. Comparat ive Advantage of Major Cash Crops in Mozambique
This appendix is based on the work of Gergely (2005).
C a s h e wCashew shows a high comparative advantage. With domestic resource costs (DRC) well below 1, including costs and value added during production stages, primary marketing, and local processing of nuts into kernels, cashew is an economically efficient use of domestic resources. Local processing contributes two-thirds of value-added, which confirms a focus on local processing instead of export of raw nuts. The financial analysis, based on a hypothetical new plantation using improved planting and maintenance methods, shows a high return to family labor and a large part of the profit in the value chain captured by farmers. The new semi-mechanical processing should be profitable, whereas large-scale mechanized processing could not compete with Indian processing costs.
RiceWith technological improvements, rice could become profitable in some regions. The rice value chain has been analyzed on the basis of two models (irrigated and mechanized rice in Chokwe combined with industrial processing; and rainfed rice in Zambézia combined with small-scale processing by dehullers). For each model, the current situation was compared to improved models (with yields of 6 and 3 tons per hectare, respectively), corresponding to the technical itinerary proposed by researchers, and which could be disseminated through development projects. For Chokwe, the analysis shows that while rice is currently not globally profitable, it would become profitable for farmers under the improved technical itinerary, with a relatively high return per day of work (this return has not been compared to the return on horticultural crops). The full financial cost of rice at the retail stage would leave a comfortable profit margin for the actors in the value chain, mainly captured by producers. The economic cost, both at the production and retail levels, would remain well below the corresponding economic prices, leaving a global 10 percent economic profit margin for the value chain. The DRC would be lower than 1, showing a clear comparative advantage.
In the current production system for Zambézia, rice is clearly not a profitable crop for farmers if surpluses have to be marketed. The return is negative when labor is fully costed, and the return per day of work is well below the average daily wage. The full financial cost of rice at the retail level remains slightly below the market, indicating a probable market failure at the disadvantage of farmers. The full cost of rice is virtually equal to its economic price, therefore close to a break-even situation. The improved model (which implies, inter alia, construction of water control devices, technical advice to farmers, and a credit scheme for payment of inputs) shows a considerable scope for improvement — rice production would become profitable for farmers, the
118
DRC would be around 0.5, thus showing a substantial comparative advantage, in particular over all other rice production systems.
PotatoesPotato production is highly profitable. Analysis of the potato value chain focuses on production in Angonia district, which is predominantly exported to neighboring Malawi. The analysis for a non-irrigated crop in prevailing cropping conditions shows that despite the low price (according to international standards), potato is still a rather profitable crop for farmers — it returns the cost of labor at 65,000 metical per day of work (i.e., three times the local cost of hired labor). Despite poor yields, the production cost is quite low (one-half the average cost in West Africa) due to lower labor costs, less use of fertilizers, and absence of irrigation, at least during the rainy season. The economic profitability is substantial (33 percent of export value), and the DRC, largely less than 1, shows a comparative advantage. Through improved cropping practices (improved seed and increased use of fertilizer produces 25 tons per hectare instead of 8), farmer income would double and income per day of work would increase by 25 percent. The unit production cost per kilogram would increase by 16 percent and the DRC would not be affected.
PaprikaPaprika is marginally profitable. Analysis of the value chain looked at production by small-scale farmers under a contract with a private operator in Angonia district. Based on current yields, average remuneration of US$1.30 (25,000 metical) per day of work is higher than the cost of hired labor but lower than for tobacco and potatoes, the two main competing cash crops in the area. The profitability of the crop depends to a large extent on intensity (i.e., the yield in response to an optimized use of pesticides and fertilizers). The potential yield (1.5-2.0 tons per hectare) is far above actual performance, but the agroindustry, which still considers itself on a learning curve, is cautious and limits its risks by minimizing credit to farmers, and therefore use of inputs. As mutual confidence grows between farmers and the exporter, the technical package can be improved, boosting yields and increasing profitability for both farmers and the exporter. The DRC calculation shows that paprika has a comparative advantage at both the farm and export levels.
CottonCotton appears to be unprofitable for farmers. An analysis was based on data for two local gins contracting with smallholders, using a 2001 sector study (to which a 10 percent price increase has been applied) and on prevailing world prices (US$0.62 per pound). At the current minimum price for seed cotton, the crop is clearly not profitable in the sense that family labor is paid at a lower price than the average price of agricultural labor. Farmers still grow cotton, however, because it is often the only cash crop available and because the outlet is secure because gins buy the entire production at a guaranteed price. When compared to the average world market price, after deducting freight and average quality discount for Mozambique origin, cotton is still slightly profitable despite poor productivity at the farm level. The domestic resource cost is 0.76 FOB, showing a slight comparative advantage. The profitability for the gin is slightly above the global profitability because cotton is purchased from farmers below its real cost. This profitability, of
119
course, is very fragile because it depends on the erratic market price of cotton that has dropped below US$0.50 per pound in recent years.
Bananas and Grapefrui tBanana and grapefruit production are highly profitable. Two estates export to South Africa and Europe. The grapefruit export operation is highly profitable in financial terms, and even more so in economic terms (40 percent profit margin) because of taxes (VAT). The comparative advantage as measured by the DRC is very high (ratio well below 1). The banana operation is hardly profitable in financial terms, but generates an economic profit once the incidence of taxes has been eliminated. The comparative advantage is substantial, although well below that for grapefruits.
S u g a rSugar does not appear to be economically profitable. The sugar value chain analysis is based on a previous sector study and corresponds to the average current and forecast performance of the four current operations. In the 2005 situation, the sugar industry was not economically profitable (although it was slightly financially profitable because of the subsidized domestic market). In 2002-03 based on the cautious expansion scenario elaborated by LMI (production increase from 240,000 to 390,000 tons), the industry would reach a breakeven point. The DRC would be virtually equal to 1, showing no comparative advantage or disadvantage.
The main findings of the financial and economic analysis are summarized in Table 37.

120
Table 37. Summary of Profitability Analysis for Major Cash Crops, 2004-05
Parameter Cashew Rice Cotton Sugar Potatoes Paprika Grapefruit Banana
Irrigated (Chokwe) Rainfed (Zambézia)
CNA zone; small farmer
Average of 4 operating
companies
Model
Improved planting and maintenance;
local nut processing
Current situation Improved
Current situation Improved
Current situation
Current situation
2012 forecast
Current practices (Angonia)
Improved practices (seeds,
fertilizer)
Contract farming Angonia
Large-scale orchards for export
Production stage
Unit kg nut kg paddy kg seed cotton tons raw sugar kg potatoes kg dried
paprika tons tons
Unit cost (US$) a 0.07 0.1557 0.1008 0.1974 0.1259 0.1826 169.6 155.5 0.0718 0.0836 0.4885 45 50Unit selling price by farmer (US$) 0.4 0.1579 0.1579 0.1579 0.1579 0.1474 0.1053 0.1053 0.6300Profit per unit (US$) 0.33 0.0022 0.0571 -0.0395 0.032 -0.0352 0.0334 0.0216 0.1415
Profit per ha (US$) 393 5 343 -39 96 -18 267 541 102Farmer remuneration/work day
(Mt) b 339,500 26,073 147,792 15,455 31,605 15,360 65,375 81,143 25,529
Processing/marketing stage
Unitkg nut
equivalent kg rice kg lint cotton
Cost/unit for the processor (US$) 0.7931 0.4033 0.4033 0.3662 0.3662 0.88 1.02
Price/unit (US$) 0.956 0.4216 0.4216 0.4516 0.4516 1.15 312 343 1.2 507 350Profit/unit for the processor (US$) 0.1629 0.0182 0.0182 0.0854 0.0854 0.27 0.18
Place of sale FOB for kernels retail Maputo retail Quelimane FOB ex mill local market CIF Delivered
In portDelivered
In port

121
Table 37.Summary of Profitability Analysis for Major Cash Crops, 2004-2005 (continued)
Parameter Cashew Rice Cotton Sugar Potatoes Paprika Grapefruit Banana
Irrigated (Chokwe) Rainfed (Zambézia)
CNA zone; small farmer
Average of 4 operating
companies
Model
Improved planting and maintenance;
local nut processing
Current situation Improved
Current situation Improved
Current situation
Current situation
2012 forecast
Current practices (Angonia)
Improved practices (seeds,
fertilizer)
Contract farming Angonia
Large-scale orchards for export
Production stageGlobal financial analysis (US$)
Total cost 0.4657 0.3998 0.3113 0.4298 0.3146 1.031 303 261.5 0.0718 0.0836 0.87 326 331Net profit 0.4903 0.0217 0.1103 0.0217 0.1370 0.12 9.00 81.50 0.0334 0.0216 0.33 181 19Part of profit retained by producer 67% 16% 83% n. a. 38% 0% 100% 100% 43%
Global economic analysis (US$)
Total economic cost per unit 0.51 0.551 0.356 0.415 0.292 0.985 280 242 0.070 0.082 0.85 301 305Economic price per unit 0.96 0.370 0.370 0.394 0.394 1.15 209 243 0.105 0.105 1.20 507 350Economic profit per unit 0.45 -0.181 0.015 -0.021 0.102 0.17 -72 1 0.035 0.023 0.35 206 45DRC (at place of final sale) 0.10 -2.60 0.81 1.07 0.53 0.76 17.04 0.99 0.36 0.38 0.58 0.15 0.40
a. Based on a standard cost of Mt 20,000 per man-day, either hired or family laborb. Assuming all the labor is family labor (profit divided by number of man-days) Source: Gergely (2005).
.

122

123
9. Hort icultural Export Sector
This appendix reviews recent developments in the Mozambican horticultural export industry and identifies the best opportunities and key constraints.150 Currently there are about 10 investments in horticultural exports — four are in production and exporting, six are in the establishment phase, and a further four are planned. The majority of these investments are in tropical fruit production. Given the lead time between investment and commercial production, it is doubtful if any of these investments are yet generating significant profits. Exports of horticultural produce from Mozambique were estimated at US$2 million in 2004, but are expected to increase significantly in 2005, mostly because of some significant investments in banana production.
Comparat ive Advantages and Market Opportunit ies for Hort icultureMozambique has some good opportunities to expand its horticultural exports. If the Government and donors make some significant resource commitments, there is an estimated potential market opportunity off about US$27 million per year in the medium term mainly by exploiting opportunities in South Africa (US$20 million per year). In the longer term, export opportunities are much larger and could exceed US$100 million per year, of which most will be to the Middle East (40 percent), South Africa (30 percent), Japan and India (20 percent), and Europe (10 percent). To achieve these export levels, a number of initiatives and a range of issues would have to be addressed. Mozambique’s key comparative position for horticultural exports can be summarized as follows:
With its tropical climate, Mozambique has an advantage over South African farmers with the potential for higher yields and better quality produce, and earlier seasons for some crops (e.g., mango, litchi, and some vegetables in the winter). Likewise, there is an opportunity to produce certain tropical fruits during northern hemisphere winters. It is not known whether the climate is sufficiently tropical to produce bananas competitively for the international market as opposed to regional markets.
The temperatures at Chimoio are neither cool nor constant enough for year-round production of the more profitable high-value air freighted products such as roses, beans, and peas.
The area where horticultural production destined for Europe is being tried (Manica province) does not have easy access to direct flights to Europe. Produce is trucked to Harare, which adds time and cost.
Beira and Maputo ports can handle fresh produce and both have specialized cold storage facilities and can hold and handle refrigerated containers. Over 25 refrigerated charter vessels leave Maputo to the Middle East, Southeast Asia, and

124
Europe during the citrus season (May-September) carrying mainly South African fruit. Further services can be attracted if production increases
Mozambique is becoming increasingly attractive to South African farmers because land is cheaper (albeit on a leasehold basis) and irrigation is more readily available. Importantly, the impact of land claims and the Black Economic Empowerment legislation in agriculture make investing in Mozambique attractive.
There are a number of “enabling environment issues” that reduce the returns to investing in Mozambique. Although progress is being made, further improvements are needed to enable exporters to be competitive with other countries, especially in international markets.
Access to finance is regarded by most investors, existing and potential, as a serious constraint.
There are a number of initiatives by both the Government and donors to support the horticultural sector. To date, many of these initiatives are disparate and not well integrated.
Mozambique’s key comparative advantage revolves around its tropical climate, but one disadvantage is a difficult business environment. Market opportunities include:
The South African market is showing strong growth and diversification in marketing channels. Road access, particularly from southern Mozambique, is good. There are distinct early-season opportunities for specific tropical and sub-tropical fruits. Banana exports will be in direct competition with South African growers, but the market has been growing (by 6 percent each year) and production in South Africa is expected to decline.
There are opportunities to grow crops such as squash and melons during the southern African winter (June to September).
The decrease in paprika production from Zimbabwe and South Africa, coupled with increased international demand for natural food colorings, provides an excellent market opportunity for Mozambique.
There is an opportunity to supply mangoes and litchis for the Middle East winter, and in the longer term, India and Southeast Asia, provided appropriate varieties are grown. Carefully targeting the Indian Ocean rim countries would enable Mozambique to take advantage of its expected market expansion.
A banana estate has been proposed for Metachuria near Beira, with a capacity to export 80,000 metric tonnes per year to the Middle East, the minimum needed to establish regular boat service carrying 2,000 metric tonnes every 10 days. The Middle East’s total market is 300,000 tons per year. Additional volume could over supply the market unless a marketing strategy is developed with a major importing company.
High-quality grapefruit can be grown in Mozambique. Currently Japan is the highest priced market, but can only be accessed if the necessary phytosanitary

125
protocols, trading agreements, and port-side cold sterilization facilities are put in place.
Constraints for the Hort icultural SectorFinancial analysis and benchmarking of exports of bananas and mangoes to South Africa and grapefruit to Europe and Japan are promising: (i) all three products would generate positive gross margins, and higher prices for early mangoes would give Mozambican farmers significantly higher profits than South African growers, (ii) the margins for grapefruit and bananas are broadly similar for both countries, and (iii) the one Government action to most increase profitability would be to ensure that IVA/VAT is reclaimed on packaging. Despite the positive benchmarking analysis, it should be noted that recent horticultural export investments are not yet making significant profits. The reasons include:
Most businesses are new and still building up their production.
New businesses, especially in new industries, travel through an expensive learning curve (e.g., developing markets and building technical knowledge and production techniques).
Dealing with complex or opaque bureaucratic processes is expensive.
Financing for investing in export horticulture has been difficult to obtain. Banks often require collateral of between two and two-and-a-half times the value of a loan. Start-up financing has had to be obtained from external sources, trading partners, or grants.
Mozambique’s banks are wary of investing in agriculture because of the sector’s poor record, limited capacity within the banks to appraise investments, and a preference to invest in lower risk treasury bonds.
In sum, if Mozambique’s horticultural export potential is to be realized, it is important to create financing for the necessary development functions (e.g., market and product research, establishment of effective out-grower networks). In addition, mechanisms to reduce investments in on-farm infrastructure and establishing long-term credit with grace periods to encourage investment in tree crops would be very useful.
Smallholder Hort iculture ProductionThe potential for smallholder production has yet to be identified. For example, the demands of traceability and the need for strict control over agrichemical use make itdifficult for smallholders to produce for the EU market. Many crops can only be grown by the most skilled managers coupled with high capital investment (e.g., cut flowers, most citrus crops). However, the smallholder farming sector has an advantage with the less perishable and labor intensive crops (e.g., paprika) to supply markets with lower quality and food safety requirements (e.g., local, South African, Middle East, and the Indian markets).
As a consequence, efforts should be made to reduce the risks for small-scale producers, especially when new crops or markets are being developed. This could be achieved if
126
commercial farmers and export businesses take the primary risks, create a critical mass, develop the technologies, and establish marketing chains. Finally, smallholders will benefit if exporters receive support (e.g., helping them identify best practices for out-grower production and market research on new crop opportunities and establishing out-grower networks).
127
10. Publ ic and Donor Sector Ini t iat ives to Develop Rural Finance in Mozambique
Under MINAG, three microfinance programs with limited budgets were set up by the National Directorate of Rural Development (DNDR) to undertake these programs. Microfinance programs cannot collect savings and make loans, and because they can only extend credit, their sustainability is an issue. Also, other Government development funds are of very limited scope and impact. Several receive funds primarily from the Government and some from donors, and a major portion of their funds is spent on administrative costs. Because they are considered government entities, clients do not believe they make loans, but rather think they extend only grants, thus their recovery rate has been extremely low.
Donor-supported microfinance institutions (MFIs) lend to rural traders and engage in pilot lending operations to smallholders through out-grower companies. Their portfolios and coverage are, however, small (probably not exceeding US$13 million). They are not sustainable without donor assistance because they do not take in savings. The entire portfolio of the microfinance sector is approximately US$4 million. Most MFIs are urban-based, and the combination of high operating costs and small clientele make it very hard for them to break even. The Mozambique Microfinance Facility (MMF, a temporary donor-funded body) calculates their basic operational costs to be as much as 40 percent higher than similar schemes elsewhere in the region. Moreover, prospects for MFIs to expand into rural areas are undermined by the lack of commercial banking in most rural towns and centers because MFIs rely on banking services for money transfers and for safekeeping of compulsory savings used as collateral. MFIs also face major problems of recruiting professional staff away from provincial capitals. In addition, there are also some emergency operations from donors.
Private sources of finance through traders and companies are important. Sales by large-and medium-size traders of materials on credit are an important source of in-kind credit to smallholders. However, large agricultural companies are by far the largest suppliers of credit to smallholders. In Mozambique, in the 2002-03 season some 270,000 smallholders in cotton concessions received an estimated US$2 million of company-financed input credit. In tobacco, some 100,000 smallholders received US$2.5 to US$5 million. The importance of companies as sources of credit is substantial.
Companies supply in-kind credit in the form of seasonal inputs. An estimated 400,000 farmers produce for out-grower companies, with some 240,000 of them working for cotton companies.151 The cases of cotton, and tobacco were discussed above. In addition, there are commercialization loans to umbrella groups of producer associations. In Nampula province, commercialization loans from traders to producers on a contract basis were developed between the Cooperative League of the United States of America (CLUSA, an NGO) and GAPI SARL, a joint stock company. The loans are granted to
128
legal producer groups screened by CLUSA.152 CLUSA also implemented a Rural Group Enterprise Development Program (RGE) in Nampula in 1995 to assist rural communities with marketing, which they have identified as their single biggest problem. By September 2002, CLUSA had supported numerous RGEs and producer associations (863 RGEs in Nampula, Zambézia, and Niassa, and 67 associations in Nampula province). These operations benefited almost 30,000 households in the three northern provinces.153 Loans were extended for cotton, sesame, sunflower, and paprika.
Informal and community-based savings and credit arrangements are common. The majority of Mozambicans are said to resort to informal credit sources provided by relatives, friends, and neighbors. Professional money lenders are rare. The most common type of informal savings and credit arrangement is the Xitique, a form of rotating savings from accumulating savings and credit associations (ASCAs). All members of the group contribute to the pool and loans are made at the same meeting, which cuts down on operating costs. All members are admitted on the basis of mutual trust, which reduces the risk of default.
CARE- and IRAM-sponsored schemes are based on experience of these informal schemes. On this basis, since 1997 CARE and IRAM have developed similar pooled savings-cum-credit mechanisms. These savings-cum-credit mechanisms are called Poupanças e Credito Rotativo (PCR) and Caixa Comunitária de Credito e Poupança (CCCP). These schemes are well-suited to rural conditions because they require low minimum savings to begin participation, no formal banks, and little external support. Members of savings groups can apply for a loan from the savings generated after about one month of membership. Borrowers pay 10 percent interest, which savers earn. PCR groups are estimated to receive a high internal rate of return of over 50 percent on their savings, and loan repayment rates are close to a 100 percent. An estimated 4,000 people are currently active in 150-200 ASCAs supported by CARE. The IRAM-supported CCCPs have some 6,000 rural clients who are members of about 55 CCCPs.
129
References
Benfica, R., 1998. An Analysis of the Contribution of Micro and Small Enterprises to Rural Household Income in Central and Northern Mozambique. M.Sc. Thesis. East Lansing: Michigan State University. Processed.
Benfica, R., D. Tschirley and L. Sambo, 2002. “The Impact of Alternate Agro-Industrial Investments on Poverty Reduction in Rural Mozambique.” Research report 51E. Maputo: Directorate of Economics, Ministry of Agriculture and Rural Development.
Benfica, R., J. Zandamela, A. Miguel et al., 2005. The Economics of Smallholder Households in Tobacco and Cotton Growing Areas in the Zambézi Valley of Mozambique. Maputo: Processed.
Benito-Spinetto, M. and P. Moll, 2005. “Mozambique: Macroeconomic Developments, Economic Growth, and Consequences for Poverty.” Background paper for the 2005 Country Economic Memorandum. Washington D.C.: World Bank. Processed.
Bias, C. and C. Donovan, 2003. “Gaps and Opportunities for Agricultural Sector Development in Mozambique.” Research report 54E. Maputo: Directorate of Economics, Ministry of Agriculture and Rural Development.
Boughton D., D. Tschirley, O. Osorio et al., 2003. “Cotton Sector Policies and Performance in Sub-Saharan Africa: Lessons Behind the Numbers in Mozambique and Zambia.” Paper submitted for IAAE 2003. Michigan State University: Processed.
Bougthon, D., D. Mather, D. Tschirley et al., 2005. What’s Driving Mozambique’s Rural Income Growth? A Comparative Analysis of the 1996 and 2002 National Agricultural Sample Surveys. Draft report. Maputo: Processed.
Brueck, T. and K. van den Broeck, 2005. “Growth, Employment and Poverty in Mozambique.” Draft consultant report for the International Labor Organisation. Berlin: Deutsches Institut für Wirtschaftsforschung. Processed.
Byerlee, D. and C. Jackson, 2005. Agriculture, Rural Development, and Pro-poor Growth: Country Experiences in the Post-Reform Era. Washington D.C.: World Bank. Processed.
Carl Bro, 2005. “Impact of Policies of Neighboring Countries on Agricultural Growth: Mozambique.” Consultant report for the 2005 Rural Development Strategy. Washington D.C.: World Bank. Processed.
Coulter J, T. Wandschneider and F. Carvalheiro, 2004. Study on Contract Farming and Supply Chain Financing in Mozambique. Washington D.C.: Natural Resources Institute. Processed.
Cramer C. and N. Pontara, 1998. “Rural Poverty and Poverty Alleviation in

130
Mozambique: What’s Missing from the Debate?” The Journal of Modern African Studies, 36(1): 101-138.
Cramer C. and N. Pontara, 1999. “A Reply to Pitcher”. The Journal of Modern African Studies, 37(4): 711-722.
DANIDA, 2004. “Mozambique: Assessment of Technical Assistance Needs ASPS II Formulation.” Final ASPS II mission report. Maputo: Danish International Development Agency. Processed.
de Barros, G., 2005. “Private Sector Development Contribution to the Mozambican Country Economic Memorandum.” Background paper for 2005 Country Economic Memorandum. Washington D.C.: World Bank. Processed.
de Sousa, E., 2005. Study on Contract Farming and Supply Chain Financing in Mozambique. Draft report. Washington D.C.: World Bank. Processed.
de St. Antoine, J.-J., 2004. Summary of Major Findings of the DHS 2003. Maputo: Processed.
de Vetter, F., 2003. “A Review of Three Successful Cases of Rural Finance in Northern Mozambique.” World Bank Consultative Group to Assist the Poor. Draft consultant report. Maputo: Processed.
Deininger, K., 2003. Land Policies for Growth and Poverty Reduction. A World Bank Policy Research Report. Washington D.C.
Detry, J.-F. and F. Chilengue, 2002. “Review and Consolidation of Methodological Aspects Relating to Crop Area, Yield and Production Estimates Procedures in Mozambique.” Consultant report to the FAO. Technical Annexes: Support to the National Aviso Previo System of Mozambique. Maputo: Processed.
Dixie, G., B. Bjerg and A. Sergeant, 2005. “Mozambique Horticulture Sector Development Study.” Draft consultant report for the Rural Development Strategy. Washington D.C.: World Bank. Processed.
Donovan, C., 2004. “Agricultural Growth and Poverty Reduction in Mozambique.” Paper prepared for the World Bank Video-Conference ‘Attacking Poverty in Mozambique.’ Washington D.C.: World Bank. Processed.
Dorward A., N. Poole, J. Morrison et al., 2002. Critical Linkages: Livelihoods, Markets, and Institutions. Ashford: Imperial College.
ECON Analysis, 2005. “Impacts of Extension Services in Rural Mozambique.” Consultant report for the 2005 Rural Development Strategy. Washington D.C.: World Bank. Processed.
Eide, A., 2004. “An Economic Analysis of Natural Resources in Mozambique Fisheries.” Draft consultant report for the 2005 Country Economic Memorandum. Washington D.C.: World Bank. Processed.
Elbers, C., C. Theodorus, M. Elbers et al., 2004. “On the Unequal Inequality of Poor Communities.” The World Bank Economic Review 18(3): 401-421.
Eleni, G.-H. and N. Minot, 2004. Successes and Challenges in Horticulture Development
131
in Africa: What Have We Learned? What Can The Public Sector Do? Power point presentation, April 26, 2004. World Bank: Washington D.C. Processed.
FEWS, 2005. “Informal Cross Border Food Trade in Southern Africa.” FEWS-Net 6. Funded by WFP and USAID. Processed.
Finney C., 2002. “Mozambique Public Expenditure Review.” Draft consultant report on Water. Washington D.C.: World Bank. Processed.
Finney, C., 2003. “Background Paper on Public Expenditure on Agriculture: Main Report.” Draft consultant report. Washington D.C.: World Bank. Processed.
Fischer, M., 2005. “Sugar price cuts threaten Mozambique’s sweet dreams.” Financial Times, March 10, 2004.
Fox, L., E. Bardasi and K. van den Broeck, 2005. “Evolution of Poverty and Inequality in Mozambique, 1996/7-2002/3.” Background paper for the 2005 Country Economic Memorandum. Washington D.C.: World Bank. Processed.
Gardner, B., 2002. American Agriculture in the Twentieth Century: How it flourished and what it cost. Cambridge: Harvard University Press.
Gergely, N., 2005. “Economic Analysis of Comparative Advantage for Major Agricultural Cash Crops in Mozambique.” Draft consultant report for the 2005 Rural Development Strategy. Washington D.C.: World Bank. Processed.
GRM International, 2005. “Contribution of Livestock to Poverty Alleviation in Mozambique.” Draft consultant report for 2005 Rural Development Strategy. Washington D.C.: World Bank. Processed.
Howard, J., J. Jeje, D. Tschirley et al., 1998. “What Makes Agricultural Intensification Profitable for Mozambican Smallholders? An Appraisal of the Inputs Subsector and the 1996/97 DNER/SG 2000 Program. Volume I: Summary.” Research report 32E. Maputo: Directorate of Economics, Ministry of Agriculture and Fisheries.
Hughes, G., 2005. “Rural Land Issues and Policies in Mozambique.” Background paper for 2005 Country Economic Memorandum. Washington D.C.: World Bank. Processed.
IFAD, 2005. “Agriculture Development.” In Republic of Mozambique, Agriculture Support Programme Formulation Report, Working Paper 2. Rome: International Fund for Agricultural Development. Processed.
INE, 2004. Estatísticas Sociais, Demográficas and Económicas de Moçambique. CD-ROM, 3rd version. Maputo: Instituto Nacional de Estatística.
IMF, 2004. “Republic of Mozambique: Financial System Stability Assessment.” IMF Country Report 04/52. Washington D.C.: International Monetary Fund. Processed.
James, R. and C. Arndt, 2005. Has Economic Growth in Mozambique Been Pro-poor? Maputo: Processed.
Jeje, J., J. Howard, P. Strasberg et al., 1999. “The Potential for Productivity Increases in Cotton and Maize Systems: The Case of Northern Mozambique.” Paper prepared for the Agricultural Transformation in Africa Workshop, June 27-30, 1999. Nairobi:

132
Processed.
Jensen, N., 2005. “Impact of Policies of Neighboring Countries on Agriculture Growth.” Draft consultant report for 2005 Rural Development Strategy. Washington D.C.: World Bank. Processed.
Khan, S., 2005. “Multi-Sector Reviews for the Mozambique Rural Development Strategy”. Draft consultant report for 2005 Rural Development Strategy. Washington D.C.: World Bank. Processed.
Klasen, S. and S. Wolkermann, 2005. “The Impact of Demographic Dynamics on Economic Development, Poverty, and Inequality in Mozambique”. Background paper for 2005 Country Economic Memorandum. Goettingen: University of Goettingen.
Kyle S., J. Chapman and P. Zucula, 2002. Opportunities and Constraints in the Mozambican Smallholder Sector. Concept paper draft. Ithaca: Cornell University. Processed.
Kyle, S., 2004. “Mozambique: Political Choices and Rural Development.” Paper presented to the World Bank Seminar on Rural and Agricultural Growth and Poverty Reduction in Mozambique. Ithaca: Cornell University.
Loening, J. and J. Perumalpillai-Essex, 2005. “Agriculture and Rural Poverty in Mozambique: Dimension, Profiles and Trends.” Background paper for the 2005 Rural Development Strategy. Washington D.C.: World Bank. Processed.
Margulis, S., 2005. “An Economic Analysis of Natural Resources Sustainability in Mozambique.” Background paper for the 2005 Country Economic Memorandum. World Bank: Washington D.C. Processed.
Mather, D., D. Boughton, D. Tschirley et al., 2005a. Analysis of Rural Income Growth in Mozambique 1996-2002 and Implications for Agricultural Development: Final Results based on TIA 1996 and TIA 2002. Draft presentation. East Lansing: Michigan State University. Processed.
Mather, D., C. Donavan, M. Weber et al., 2005b. “Household Responses to Prime Adult Mortality in Rural Mozambique: Implications for HIV/AIDS Mitigation Efforts and Rural Economic Development Policies.” Research report 56E. Maputo: Ministry of Agriculture and Rural Development.
Mather, D., H. Marrule, C. Donavan et al., 2005c. “Analysis of Adult Mortality Within Rural Households in Mozambique and Implications for Policy.” Research report 58E. Maputo: Ministry of Agriculture and Rural Development.
McEwan, M., 2004. “HIV and AIDS and Food and Nutrition Security Linkages in Mozambique.” Discussion document prepared for the Technical Secretariat for Food and Nutrition Security. Maputo: Processed.
McMillan, M. D. Rodrik and K. Horn Welch, 2002. “When Economic Reform Goes Wrong: Cashews in Mozambique.” NBER Working Paper 9117.
Nasir J., G. de Barros Gilbert, D. Wagle et al., 2003. “Pilot Investment Climate Assessment.”Draft paper for the Mozambique Industrial Performance and Investment
133
Climate 2003. Washington D.C.: World Bank. Processed
Nathan Associates, 2004. “Poverty Reduction and Agricultural Trade in Sub-Saharan Africa: Recommendations for USAID Interventions.” Consultant report for USAID. Washington D.C. Processed.
NEPAD, 2004. “Implementing the Comprehensive Africa Agricultural Development Programme and Restoring food Security in Africa.” Prepared by the NEPAD Secretariat for the African Partnership Forum Meeting in Washington D.C., October 4th to 7th 2004.
Oehmke, J. F., P. Anandajayasekeram and W. A. Masters, 1997. “Agricultural Technology Development and Transfer in Africa: Impact Achieved and Lessons Learned.” USAID Technical Paper 77.
Owens, T. and J. Hoddinott, 2003. “The Impact of Agricultural Extension on Farm Production in Resettlement Areas of Zimbabwe.” Economic Development and Cultural Change 51(2): 337-357.
Perumalpillai-Essex, J. and A. Achcar, 2005. “Mozambique: Key Determinants of Growth in the Agriculture Sector.” Draft report for 2005 Rural Development Strategy. Washington D.C.: World Bank. Processed.
Pitcher M., 1999. “What’s missing from ‘What’s Missing’? A Reply to C. Cramer and N. Pontara, Rural Poverty and Poverty Alleviation in Mozambique: What’s Missing from the Debate?” The Journal of Modern African Studies 37(4): 697-709.
Poulton C., P. Gibbon, B. Hanyani-Mlambo et al., 2004. “Competition and Coordination in Liberalized African Cotton Market Systems”. World Development 32(3): 519-536.
Republic of Mozambique, 2004a. Boletim da Republica, Serie 1, Numero 48. December 10, 2004. Maputo. Processed.
Republic of Mozambique, 2004b. Mozambique: PROAGRI Evaluation. Volume 1 : Main Report. Maputo: T&B Consult and Ministry of Agriculture and Rural Development. Processed.
Republic of Mozambique, 2004c. Draft Report of the Evaluation Mission on the PROAGRI II Strategy Document. Maputo: Ministry of Agriculture and Rural Development. Processed.
Scott, A., 2000. “Republic of Mozambique- Selected Issues and Statistical Appendix.” IMF Board Paper SM /00/280. Washington D.C.: International Monetary Fund. Processed.
Seroa da Motta, R., 2004. “An Economic Evaluation of Forestry in Mozambique”. Draft consultant report for the 2005 Country Economic Memorandum. Washington D.C.: World Bank. Processed.
Smulders, M., 2000. “Mozambique National Aviso Previo System: Review of Crop Production Forecasting Methodology Applied by the Aviso Previo Department/MADER.” Discussion document based on a consultancy carried out by J. Jansonius. FAO Sub-Regional Office for Southern and Eastern Africa, Zimbabwe.

134
Processed.
Tarp, F., C. Arndt, T. Jensen et al., 2002. “Facing the Development Challenge in Mozambique: An Economy-wide Perspective.” Research report 126. Washington, DC.: International Food Policy Research Institute.
Timmer, C., 2004. Agriculture and Pro-poor Growth: Reviewing the Issues. Draft report. Washington D.C.: International Food Policy Research Institute. Processed.
von Pishke, J. D., 1991. Finance at the Frontier: Debt Capacity and The Role of Credit In The Private Economy. Washington D.C.: Economic Development Institute of the World Bank.
Walker, T., D. Tschirley, J. Low et al., 2004. “Determinants of Rural Income in Mozambique in 2001-2002.” Research report 57E. Maputo: Directorate of Economics, Ministry of Agriculture and Rural Development.
Weimer, B. L. Cabral and D. Jackson., 2004. “Modalities, Flow of Funds and Partner Structures. Experiences and Recommendations for ASP II.” Final Report, Danish Support to the Agricultural Sector in Mozambique within the Framework of ASP. Maputo: Danish International Development Agency. Processed.
Whiteside, M., 2002. Neighbours in Development: Livelihood Interactions between Northern Mozambique and Southern Malawi. London: Department for International Development.
World Bank, 1997. Mozambique: Agriculture Sector Memorandum. Report 16529-MZ. Washington D.C. Processed.
World Bank, 2001a. Mozambique Country Economic Memorandum: Growth Prospects and Reform Agenda. Report 20601-MZ. Washington D.C.
World Bank, 2001b. Mozambique Public Expenditure Management Review. Report 22985-MZ. Washington D.C.
World Bank, 2003a. Country Assistance Strategy for the Republic of Mozambique. Report 26747-MZ. Washington D.C.
World Bank, 2003b. Mozambique: Public Expenditure Review. Phase 2: Sectoral Expenditures. Report 25969-MZ. Washington D.C. Processed.
World Bank, 2004a. Mozambique Health Country Status Report. Washington D.C.: Processed.
World Bank, 2004b. Mozambique: First Poverty Reduction Support Operation. Report 29262-MZ. Washington D.C. Processed.
World Bank and IMF, 2004. Public Expenditure Management Country Assessment and Action Plan. Draft report. Washington D.C.: Processed.
World Bank, 2005a. Agricultural Growth and Land Reform in Zimbabwe: Assessment and Recovery Options. Report 31699-ZW. Washington D.C.
World Bank, 2005b. Mozambique: Primary School Enrollment and Retention – The Impact of School Fees. Poverty and Social Impact Analysis. Report 29423-MZ.
135
Washington D.C.
World Bank, 2005c. Mozambique: Proposed Rural Development Strategy 2005-2010. Concept Note, AFTS1. Washington D.C. Processed.
World Bank, 2005d. The Role of Water in the Mozambique Economy: Identifying Vulnerability and Constraints to Growth. Draft Memorandum. Washington D.C.: World Bank, AFTU2. Processed.
World Bank, 2005e. Mozambique: Country Economic Memorandum – Sustaining growth and reducing poverty. Draft report. Washington D.C. Processed.
World Bank, 2005f. Mozambique: Second Poverty Reduction Support Operation. Draft report. Washington D.C. Processed.
World Food Programme. Concept Paper for the Implementation of a Monitoring System for Informal Cross-Border Food Trade in Southern Africa. Issue 1, July-September 2004. Processed.
Wuyts, M. and F. Tarp, 2005. “The Mozambican Economy: Past, Present, and Future”. An AMECON presentation on the occasion of the launching of the project ‘Technical Assistance for the Institutional Development of the Gabinete de Estudos.’ Maputo: Processed.
Zandamela, C. B., 2004. “An Assessment and Strategy for Development of the Fertilizer Market in Mozambique.” Draft report, Regional Fertilizer Procurement and Distribution Initiative. African Center for Fertilizer Development. Processed.

136
137
Notes
1 For further details on Mozambique’s agricultural potential, see Donovan (2004), Kyle (2004), and Benito-Spinetto and Moll (2005). 2 The share of the rural population declined from 79.6 percent in 1996/7 to 67.9 percent in 2002/3. The sharp decline is mainly due to a change of the rural definition. In 1996/7, rural areas were defined as all local communities outside the national and provincial boundaries. By contrast, in 2002/3, rural areas were re-defined to include all towns in the rural space, not just the capitals. This resulted in a sharp decline of the rural population. In absolute numbers, however, according to official numbers the rural population remained constant at about 12.5 millions (World Bank 2005c).3 There is also a small but potentially important category of medium farmers with average landholdings of 35 ha, known as privados. USAID estimates that by the mid-1990s, privados numbered some 3000. Many of these entrepreneurial farmers are women working in zonas verdes (green zones) and market most of their products. Many of these privados are said to have contractual arrangements with bigger commercial enterprises (Cramer and Pontara 1998).4 Fox et al. (2005). 5 Cramer and Pontara (1998).6 Republic of Mozambique (2004a) and World Bank (2005c).7 According to data from Aviso Previo.8 According to TIA 2003 (Appendix 3).9 Mather et al. (2005a). 10 According to TIA 2003 (Appendix 3).11 Benfica, Zandamela, and Miguel (2005), and Bias and Donovan (2003).12 Bias and Donovan (2003). 13 de Sousa (2005). 14 Jeje et al. (1999). 15 de Sousa (2005). 16 Finney (2003).
138
17 These estimates may have to be revised downwards because they are based on limited soil surveys.18 World Bank (1997). 19 Margulis (2005). 20 GRM International (2005).21 GRM International (2005).22 GRM International (2005).23 GRM International (2005).24 According to unpublished livestock data from the Ministry of Agriculture.25 GRM International (2005).26 GRM International (2005).27 There was a liberation war during the 1960s and early 1970s, and a devastating civil war during the 1980s and early 1990s.28 According to National Accounts data from INE.29. Despite strong evidence of an overall increase of agricultural output, there is an urgent need to revise and harmonize the measurement of agricultural production in Mozambique. Due to crop measurement problems with agricultural surveys, estimates of agricultural production trends in Mozambique are usually based on the Aviso Previo (or National Early Warning System; see Appendix 1 for a discussion). However, food crop production measured by agricultural surveys and the Aviso Previo are largely incompatible, in particular at the regional level. The exception is the level of maize production (Fig. 3).30 Benito-Spinetto and Moll (2005) based on data from IAF 1996/7 and 2002/3.31 According to CAP 1999/2000 (Appendix 3).32 According to National Accounts data from INE.33 According to data from Aviso Previo.34 Based mainly on unpublished data from agricultural surveys 1994-2003.35 Walker et al. (2004).36 Benfica, Zandamela, and Miguel (2005).37 Benfica, Zandamela, and Miguel (2005).38 Price changes are not considered. While there have been sharp seasonal fluctuations of maize, rice, and other crops, according to data from SIMA, there has been no secular tendency up or down from 1992 to 2004 for major food crops. Consequently, it appears that price changes are not a significant explanation for agricultural growth or improved living standards for smallholders (Benito-Spinetto and Moll 2005). However, Boughton
139
et al. (2005) find evidence that increased cropping income in Mozambique may have largely been driven by increased price increases, suggesting the need for further analysis on this issue.39 According to unpublished data from Aviso Previo.40 Loening and Perumalpillai-Essex (2005).41 Margulis (2005) finds that potential trade-offs between agricultural growth and the sustainable use of natural resources are negligible. The country is in a privileged situation because balancing these strategies at the current level of utilization of natural resources does not appear to involve major land use conflicts. Abundant land can be allocated for both subsistence and commercial agriculture. 42 According to data from TIA 2002-03.43 Bias and Donovan (2003). 44 According to INE (2004).45 This may have biased agricultural production estimates in Mozambique. Personal communication with Tom Walker, Michigan State University, February 2005.46 Bias and Donovan (2003) also report that beans from Niassa and groundnuts from Nampula have found their way to markets in Maputo. However, it is estimated that much of these crops have been transferred via the road infrastructure of Mozambique’s neighboring countries.47 Carl Bro (2005).48 FEWS (2005).49 Mather et al (2005a).50 See Appendix 3.51 Loening and Perumalpillai-Essex (2005).52 Donavan (2004). Other data sources are taken from Appendix 3.53 Loening and Perumalpillai-Essex (2005).54 In a follow-up of the 2003 agricultural survey, ECON Analysis (2005) finds that rural extension is positively correlated with rural welfare. Notice that Walker et al. (2004) find no significant impact of extension on rural incomes.55 Owens and Hoddinott (2003).56 Oehmke et al. (1997).57 Based on a comparison of TIA 1995-06 and 2001-02, see Appendix 3.58 However, the evidence of low rates of returns to schooling in Mozambican agriculture should be analyzed carefully and subject to further investigation. For example, the failure to control for family and community-level schooling could bias estimates of the returns to education. Community-level or family education could be complementary to education of

140
household heads, in particular for determining the adoption of new agricultural technologies. Moreover, estimates may also be biased due to the inclusion of variables correlated with education, capturing part of its effect.59 Mather et al. (2005a).60 Mather et al. (2005a).61 Fox et al. (2005).62 Fox et al. (2005).63 Fox et al. (2005).64 Loening and Perumalpillai-Essex (2005).65 Loening and Perumalpillai-Essex (2005).66 Fox et al. (2005).67 Elbers et al. (2004).68 James and Arndt (2005) and Fox et al. (2005).69 James and Arndt (2005).70 Bougthon, Mather, and Tschirley (2005).71 Brueck and van den Broeck. (2005).72 Brueck and van den Broeck. (2005).73 Brueck and van den Broeck. (2005).74 Mather et al. (2005a).75 Loening and Perumalpillai-Essex (2005). 76 Loening and Perumalpillai-Essex (2005).77 World Bank (1997). 78 Hughes (2005). 79 World Bank (2005d). 80 Margulis (2005). 81 World Bank (2005e). 82 World Bank (2003b). 83 World Bank (2003a). 84 World Bank (2003a). 85 World Bank (2005e). 86 World Bank (2005e).

141
87 Bias and Donovan (2003). 88 Benito-Spinetto and Moll (2005). The Dutch Disease is a problem typical of mineral exporting economies when mineral exports earn plentiful foreign exchange. This bounty in turn leads to an overvalued exchange rate that discourages exports from other sectors and encourages imports. This effect usually undermines the competitiveness of the non-oil export-oriented sectors. Dutch Disease is thus a tax on non-oil exporting sectors as a result of a plentiful influx of foreign exchange. 89 World Bank (2003b). 90 Finney (2003). 91 World Bank (2001b). 92 Finney (2003). The PROAGRI 1 2002 and 2003 budget (approximate) allocations are (as percentages): institutional development (42), research (14), extension (7), livestock (7), production support (7), forestry (7), wildlife (7), land management (7), and irrigation (5).93 World Bank (2003b). 94 World Bank (2001b). 95 World Bank and IMF (2004).96 Finney (2003).97 World Bank (2003b). 98 Khan (2005). 99 World Bank (2003b). 100 World Bank (2003b). 101 World Bank (2003b). 102 World Bank (2003b). 103 World Bank (1997). 104 Kyle (2004).105 World Bank (2005c). 106 World Bank (2005c).107 World Bank (2005c).108 Hughes (2005).109 World Bank (1997).110 Finney (2003).111 World Bank (1997).

142
112 McEwan (2004). This is the main source of information for the entire section. 113 Mather et al. (2005b).114 Republic of Mozambique (2004b). 115 Bias and Donovan (2003).116 World Bank (2001a). 117 Nasir et al. (2003). 118 Boughton et al. (2003). 119 Coulter et al. (2004). 120 Poulton et al. (2004).121 World Bank (2005a). 122 Coulter et al. (2004). 123 McMillan, Rodrik, and Horn. (2002). Finney (2003) estimates 18 percent, while Scott (2000) presents yet another set of estimates.124 When World Bank President James D. Wolfensohn first visited Mozambique in 1997, he was “greeted” by angry agroprocessors who blamed the Bank for the industry’s problems in procuring raw cashews. 125 World Bank (1997). 126 Researchers make a distinction between short-term static gains (versus longer-term efficiency gains), assuming no adjustments by smallholders in terms of investing in new trees, displaced workers looking for new jobs and agroprocessors investing in higher productivity/profitability technologies. They point out the critical importance of effective communication that can accelerate adjustments and reduce short-term costs. 127 McMillan et al. (2002). The main importers of processed cashews on the world market are the United States (34 percent) and India (32 percent).128 de Sousa (2005). 129 Finney (2003). 130 Finney (2002). 131 Benito-Spinetto and Moll (2005). 132 Detry and Chilengue (2002). 133 Byerlee and Jackson (2005).134 McEwan (2004). 135 Kyle et al. (2002). 136 von Pishke (1991).

143
137 Timmer (2004). 138 Timmer (2004).139 Dixie et al. (2005).140 Walker et al. (2004).141 Benfica (1998). 142 Kyle et al. (2002). 143 Detry and Chilengue (2002), and Smulders (2000).144 Mather et al. (2005a) and Perumalpillai-Essex and Achcar (2005).145 The background study was conducted by ECON Analysis (2005).146 For example, Finney (2003) and Walker et al (2004).147 Loening and Perumalpillai-Essex (2005).148 The background study was conducted by Carl Bro (2005).149 Mather et al. (2005b, 2005c).150 Dixie et al. (2005).151 IFAD (2005). 152 de Vetter (2003). 153 de Vetter (2003).