Embed Size (px)
Citation preview

Moving to Service Centric Management with OMi
Recommended Implementation Steps
Technical White Paper
Document release date: July 2017

Technical White Paper
Contents Introduction .............................................................................................................................................................................. 2
Overview .............................................................................................................................................................................. 2
Document structure ............................................................................................................................................................. 3
Abbreviations ....................................................................................................................................................................... 3
Related documents .............................................................................................................................................................. 4
Planning activities ................................................................................................................................................................... 5
Environmental analysis ........................................................................................................................................................ 5
Deployment planning and scenarios ................................................................................................................................... 5
Building blocks of an OMi solution ....................................................................................................................................... 7
RTSM considerations .......................................................................................................................................................... 8
Project implementation approach ........................................................................................................................................ 9
Step 1: Consolidate events ................................................................................................................................................... 11
Event sources .................................................................................................................................................................... 11
Mapping events to CIs ....................................................................................................................................................... 12
Derived Values and Benefits ............................................................................................................................................. 14
Step 2: Control events ........................................................................................................................................................... 15
Event qualification .............................................................................................................................................................. 15
Event correlation functions ................................................................................................................................................ 21
Event automation ............................................................................................................................................................... 26
Other activities ................................................................................................................................................................... 27
Derived values and benefits .............................................................................................................................................. 28
Step 3: Add end-user perspective ......................................................................................................................................... 29
Complement Infrastructure Monitoring with End-User Perspective ................................................................................... 29
Evolve RTSM ..................................................................................................................................................................... 29
Derived Values and Benefits ............................................................................................................................................. 29
Step 4: Business service centric management ..................................................................................................................... 31
Service modeling ............................................................................................................................................................... 32
Service Status and Service Health .................................................................................................................................... 39
Derived Values and Benefits ............................................................................................................................................. 46
Step 5: Self-service and Monitoring Automation ................................................................................................................... 47
Automation of monitoring ................................................................................................................................................... 47
Monitoring Service Provisioning ........................................................................................................................................ 49
Appendix ............................................................................................................................................................................... 51
List of tables ....................................................................................................................................................................... 53

Introduction HPE Operations Manager i (OMi) is the core component of the HPE Operations Bridge Suite. It provides capabilities to collect and consolidate event and metric information from various sources, perform valuable event correlation allowing to take corrective actions from a central console, link the information against a run-time service model consisting of infrastructure and business services, display service health information and integrate universally to external components.
The target audiences for this document are architects and consultants planning the implementation of an OMi-based solution.
It is assumed that the reader has a basic knowledge of OMi, its concepts and related products. This document has been created based on OMi 10.x.
Overview OMi provides instant value after the initial deployment due to its out-of-the box capabilities.
Using OMi with Management Packs and out-of-the-box integrations simplifies the deployment of a solution delivering value immediately without the need of dealing with the underlying technology-related complexity.
Management Packs are available for example for the following domains:
Infrastructure
Databases
Microsoft Environments
SAP Environments
Middleware
Cloud
Big Data
… and more
The following out-of-the-box integrations are supported with OMi:
Microsoft SCOM
Nagios
Oracle Enterprise Manager
IBM Tivoli and NetCool
BMC Remedy
NNMi
… and more
For a complete list of available Management Packs and integrations see https://saas.hpe.com/en-us/software/operations-manager-i-single-pane-of-glass/integrations.
OMi is highly flexible and extensible. Using Management Packs enables you to extend OMi with your specific integrations.
A successful implementation of OMi cannot achieve the maximum of its capabilities in one step. It is recommended to use a stepwise iterative approach described further in this document.
_____________________________________________________________________
Note: A key component of OMi is its run-time service model (RTSM), which builds the foundation for the OMi powerful event correlation and service management functions.
Management Packs and out-of-the-box integrations supply a discovery-based basic topology model automatically into the RTSM and maintain the RTSM data in a dynamic manner. This eliminates the need to spend the implementation effort upfront and brings immediate benefits.
_____________________________________________________________________

Document structure This document contains the following sections:
Planning activities This section describes the aspects to be considered when planning an OMi implementation.
Consolidate events This section recommends to start with the event consolidation and provides some background information and typical tasks to be performed to gather the event information. It also outlines the benefits related to consolidating events.
Control events This section describes the activities that can be performed to gain control over the events and to tune the event processing.
Add end-user perspective This sections describes how to complement monitoring with the status information from the end-user perspective.
Business service centric management This section provides information on how to leverage the outcome of previous phases to build a business service centric management solution and to provide business service centric views and dashboards.
Self-service and Monitoring Automation This section describes how to increase administration efficiency of OMi in dynamic and virtualized environments.
Abbreviations This section lists abbreviations used in this document.
Table 1: Abbreviations
Abbreviation Description and Glossary
BSM Business Service Management
CI Configuration Item
CIT Configuration Item Type
CMDB Configuration Management Database
CP Content Pack
DFM Data Flow Management
EM Element Manager
ETI Event Type Indicator
HI Health Indicator
KPI Key Performance Indicator
MA Monitoring Automation
MP Management Pack
OMi Operations Manager i
OpsCx Operations Connector
RTSM Run-time service model
RUM Real User Monitoring
SiS SiteScope
TBEC Topology-Based Event Correlation
TQL Topology Query Language

TV Transaction View
VA Virtual Appliance
UD Universal Discovery
Related documents This section lists additional documents that contain detailed information on the topics described in this document.
Table 2: Related documents
Document Reference / URL
RTSM Best Practices https://softwaresupport.hpe.com/KM/KM01996511
Effective Modeling for BSM 9 (although this guide is for BSM, the modeling concepts described therein apply to OMi as well)
https://softwaresupport.hpe.com/KM/KM01374330
Operations Connector User Guide https://softwaresupport.hpe.com/KM/KM02256113
End-to-End Service Monitoring in IT environment Best Practice
https://softwaresupport.hpe.com/KM/KM00446629
OMi Management Pack Development Kit https://marketplace.saas.hpe.com/itom/content/management-pack-development-kit-omi
OMi Online Help https://docs.software.hpe.com/OMi

Planning activities This section summarizes considerations for planning an OMi implementation.
Environmental analysis As an initial step in a successful OMi implementation, HPE recommends to perform the environment analysis. This helps determine boundary conditions for a project and elaborate the scope of systems and applications to be covered (e.g. identify external systems, such as existing element managers that will feed the information into OMi, higher-level systems that will consume the information gathered and processed by OMi, as well as its users and user groups).
To gather information upfront, HPE recommends to go through questionnaires and refine important topics through workshops with subject matter experts.
The following items can be collected as a starting point:
The scope of systems (including system properties, such as an OS type and version, system responsibilities and ownerships, as well as the relation between systems and applications)
Processes and organizations to be included or integrated with OMi
Important organizations, user groups and users and the stakeholders for these groups
Information about the relevant network topology
An overview of the monitored aspects (if monitoring of systems and applications is already in place)
Element managers to be integrated into the Operations Bridge that can act as a source of qualified event and status information
External systems, such as mail servers, SMS notification and trouble ticket tools that can act as consumers for the information consolidated in OMi
Deployment planning and scenarios OMi is a web-based application that can be deployed in different ways thus delivering an optimal fit for your requirements.
Drivers for planning the OMi deployment are summarized below:
• OS and database platform; virtualization Both Linux and Windows can be recommended for use with OMi. OMi supports MS SQL, PostgreSQL, and Oracle as database platforms. Virtualization is in general supported by OMi. Note: the target system(s) should be dedicated to OMi and cannot host additional applications.
• Role of system In small scaled environments, it is possible to develop the OMi configuration on a single OMi instance and use the same instance to run this configuration. However, this setup is not recommended in larger-scale environments, where a designated development system may be needed to separate development activities from the productive environment. Furthermore, it may be necessary to use a third instance of an OMi system to verify any developed configuration or a configuration change on a reference test/integration test environment before applying it in the production environment. Development systems typically have lower demand regarding scale and high availability, while production systems must meet the demands regarding scale, security, etc. required by the target environment. It is recommended to implement integration test/reference systems in the same way as implemented on the production systems.
• Connectivity Depending on the specific target network, it may be necessary to place the OMi system in the appropriate network segment. The following considerations need to be taken into account:
– From where do users connect to the system?
– The location of the systems that forward the events to OMi (“southbound”)?
– Does the event information need to use certain networks / management interfaces?
– What systems consume information from OMi (“northbound”)?
While in simple small-sized networks this aspect is not important and easy to evaluate, connectivity may become rather complex in service provider contexts.

As a result, it may be necessary to implement the network setup changes, such as opening ports on firewalls, establishing certain routes on the network, etc.
• Scalability OMi allows to implement different deployment scenarios: “typical” (single-node) deployment and distributed deployment for scalability by spreading the OMi components across several systems. Implementing a distributed deployment requires at least two systems: a Data Processor Server (DPS) and a Gateway Server (GW). A load balancer allows distributing communication load from users and event feeding systems evenly across a number of Gateway Servers.
The number of Gateway Servers can be increased at a later time by installing additional Gateway Servers and connecting them to an existing OMi installation. This allows flexible adaptation to increase scalability, e.g. due to the growing number of users or growing event rate.
• Security OMi UI communication can be secured with HTTPS/TLS. To meet specific security requirements, the OMi application can be configured to run in a non-root context. Network-related measures can be taken to restrict accessibility of the OMi application, e.g. by using firewalls. OMi features a user concept that allows a specific restriction of capabilities based on users / user group memberships.
• High availability Monitoring capabilities of a load balancer can be used to increase the Gateway Server availability: if a monitored Gateway Server is down, a load balancer recognizes this and re-routes the incoming request to one of the available Gateway Servers.
For increased availability, install a standby backup Data Processing Server.
You can increase availability of an existing OMi system at a later time by installing a standby Data Processing Server and additional Gateway Server instances.
• Use of RTSM
See the section RTSM Considerations.
There are three basic types of how OMi can be deployed:
Single-server (“typical”) deployment In this deployment, both Data Processor and Gateway Server components are installed on a single system. This is a good solution for the environments with medium to low scalability, which do not demand high availability (for example, small or development environments). The “typical” (single node) deployment is not recommended for use in production environments.
Distributed deployment on two systems This deployment is done on two servers, separating Data Processor Server and Gateway Server components. Compared to the One-Machine Deployment, this setup increases scalability.
Distributed deployment on multiple systems This deployment typically consists of one or two Data Processor Server(s) with multiple Gateway Server instances and utilizes a load balancer or a reverse proxy to distribute the load. This setup meets demands for increased scalability and high availability.
Note A container-deployment of the Operations Bridge Suite and OMi is also available. However, this containerized Operations Bridge Suite version 2017.04 does not yet offer similar scalability as the deployment options shown above. Therefore this deployment type is not yet recommended for production use.
Note HPE recommends to host the OMi database on a dedicated database server (in general, in all of the deployments described above the database can be local or remote).

Building blocks of an OMi solution OMi consolidates all events from the IT infrastructure monitoring in a central console and allows linking the event information against IT services. Combined with the complementary service status information from business service management components, OMi provides a complete overview of the overall IT infrastructure and provided services.
To achieve this, OMi provides the integration of various event sources through available out-of-the-box integrations.
On Event Data Acquisition, the integration covers (but is not limited to) the following event sources:
• Operations Manager Agents (can be connected via Monitoring Automation)
• Operations Manager for Unix / Windows
• Business Process Monitor
• Real User Monitor
• SiteScope
• Systems Insight Manager
• Alerts (e.g. CI status alerts, SLA alerts, event-based alerts)
• Integration of third-party element managers for specific domain environments using Operations Connector:
– Microsoft Systems Center Operations Manager (SCOM)
– Oracle Enterprise Manager
– Nagios
– IBM Tivoli
… and more
Monitoring solutions are available for a variety of platforms, middleware components, and applications:
• Management Packs for OMi Available for infrastructure (including virtualization and high availability), databases and more.
• ITOM Marketplace contributions A growing number of Management Packs is contributed for re-use via the ITOM Marketplace.
Northbound Integrations:
• Alarming and Notification
• Incident Management
• Generic integration into external event processing through flexible groovy script-based interfaces
The following figure shows an example architecture draft of an OMi solution with potential event sources.

Figure 1: Typical OMi solution architecture
Note For an introduction into OMi, refer to the Get Started section in the OMi Online Help.
RTSM considerations The RTSM is the configuration management database instance embedded into OMi. Its objective is to host an operational run-time service model consisting of all configuration items that are relevant for the infrastructure and service operations, including the CI’s relationship.
Within OMi, the run-time service model is the basis for a rich set of functions of the Operations Bridge, such as sophisticated event correlation, hosting of the service model and calculation of the KPI-driven service health.
The RTSM focus is clearly on monitoring as it reflects the dynamics of the managed environment in near real time.
The RTSM is not a replacement for a configuration management solution. A configuration management solution has a different scope as it acts as a master for the CI information. It is a single point of integration supporting various configuration management processes and supplying the right set of data for different use cases. The operational service model is only one use case.
Depending on the scope, it may be feasible to consider the RTSM only (for example, if an operational service model is the only relevant model). However, if the requirements demand a comprehensive support of configuration management processes or if extended integrations are required, the implementation of a central configuration management solution is highly recommended. Such solution can be integrated with the operational RTSM of OMi.

Figure 2: BSM (RTSM) integrated with a central CMDB
Note that it is not required to implement a sophisticated and comprehensive data model within the RTSM upfront. Instead, the data model can grow over time and be refined and extended at a later stage. As an example, out-of-the-box integrations supply the CI and CI relation information into the RTSM with little effort, which can act as a basis for operations at early stages.
Note: Management Packs and out-of-the-box integrations supply a basic topology to the RTSM with no effort. HPE recommends starting with this basic topology to consolidate and control events.
While extending and modifying the RTSM can be done in later project phases, HPE recommends to understand the RTSM concepts upfront and perform planning of the data model to identify the system contributing the CI information.
A good practice is to establish a basic topology consisting of nodes and the software running on these nodes during the event consolidation phase. Later, this can be complemented by the additional CI information, e.g. based on discovery.
Note: For more information on designing, implementing and tuning a fully compliant model, see the RTSM Best Practices document (https://softwaresupport.hpe.com/KM/KM01996511).
Project implementation approach An OMi implementation project can be divided into several phases following the environmental analysis and deployment planning described in previous sections. This sets the basis the solution is built upon.
HPE recommends to perform the steps for implementing an OMi-based Operations Bridge in a defined sequence. This allows a clear and structured implementation approach. Less is more: avoid too many functions to be performed at once.
Although a comprehensive approach may work under a well-defined scope with good starting conditions, a stepwise incremental approach consisting of the following steps is recommended:
Consolidate events
Control events
Add end-user perspective
Business service centric management
Self-service and Monitoring Automation

Figure 3: Steps and Sequence for a Successful Implementation
These steps are explained in more detail in the following sections.
Note: You do not need to implement all steps at once to benefit from using OMi. Implementing initial steps, such as Consolidate Events and Control Events, already returns a lot of value to operators and allows comprehending the OMi concepts and functions.
Carry out the steps sequentially. Benefits are gained with the implementation of every step. Activities related to the RTSM topology implementation are typically done in parallel.
Figure 4: Single Sequence
For larger-scale projects, it can be feasible to initially consolidate all events with a basic topology in the RTSM. Thereafter, the steps can be performed in smaller units, e.g. for each line of business.
Figure 5: Example - Streams for Line of Businesses
Note that this is just an example. A synchronization point after control events is not mandatory.

Step 1: Consolidate events This step combines all activities required to feed the event information into the OMi Operations Bridge. Although this is the basis for all consecutive steps, its implementation already provides the value associated with relatively low effort.
It is not mandatory to execute consecutive steps immediately, which enables you to gain experience with the solution before evolving it.
Figure 6: First Step – Consolidate Events
Event sources The following considerations are relevant for the event consolidation:
OM Agents can be integrated directly with OMi using the Monitoring Automation functionality. By using policy templates on systems with OM Agents, you can retrieve the event information from various sources, such as textual log files, windows event logs, monitoring services and processes, measuring numeric metrics for comparison against thresholds, intercepting SNMP traps and more.
Using Management Packs together with the Monitoring Automation functionality allows you to implement a consistent and easy integration of monitoring of common OS and virtualization platforms, Oracle database platforms, Hadoop and Vertica, and so on. These Management Packs contain everything required to implement management of the related object in a quick, defined and efficient manner.
Integration of already existing Operations Manager instances. With little effort, it is possible to gather and consolidate events of Operations Manager Servers. This approach incorporates synchronization of the event information derived from the already existing monitoring solution thus leveraging the investment done on this solution, e.g. Smart Plug-In based realization of monitoring. Furthermore, it is easy to include all existing CIs, offering a starting point to elaborate event-driven correlations in a next possible step.
Connection of additional element managers through existing connectors. Element managers and management tools, such as Microsoft SCOM, Nagios, Oracle Enterprise Manager, IBM Tivoli and many more, can be easily integrated.
Generic use of the Operations Connector. For specific element managers or integrating specific event sources, you can use the Operations Connector, as it provides a rich set of easy-to-use interfaces to accommodate these tasks.
At this point, the CI Information is already present in the RTSM. The integration of element managers, such as Microsoft SCOM, and the integration of OM Servers synchronize the set of CI instances. OM Agents connected to OMi directly via Monitoring Automation introduce the CI representation of the managed node in the RTSM. Depending on used Smart Plug-Ins or Management Packs, additional more specific CI information will be gathered through discovery and be present in the OMi RTSM.
In general, this CI information already provides a CI model and is the basis for more value-adding functions that can be built in the next phase.

Manual configuration in the RTSM allows the creation of CI collections to supply operations with a structured view.
Mapping events to CIs OMi maps incoming events to the CIs contained in the RTSM. Depending on the CI information available in the RTSM, the mapping will be performed on a node CI-type level. If an event source supplies more CI-related information and the topology synchronization matches this specific CI model, a more specific mapping of the events to the CI information occurs.
For the event sources that supply the source node information with the event but do not have the related CI in the RTSM at this point, you can consider using the automatic node generation option. This option populates the RTSM with node CIs based on the incoming events.
It is recommended to establish a basic model of nodes and running software in the RTSM as early as possible. Other RTSM-related activities can be performed later.
CI resolution
As events do not normally carry a detailed RTSM identifier of the related CI, OMi implements a resolution algorithm that maps an event to the closest possible CI. To perform the CI resolution efficiently, a CI resolution cache is used for caching CIs relevant for the event resolution.
Note: See the OMi Online Help for additional information about the CI Resolution algorithm and the CI resolver cache.
The CI event resolution can be controlled by supplying additional information with the event that has a special meaning for the resolution: CI resolution hints. If the algorithm cannot identify the detailed CI for an event, the node CI is used as a fallback.
It is important to ensure that the CIs for relevant events are resolvable. This is achieved by tuning of monitoring policies and templates to extend the current monitoring and supply CI resolution hints with the events.
Within OMi, CIs are associated with a set of indicators, which are stored in a repository and defined on a CI-type level. Incoming events are analyzed to determine the indicator status. Indicators are used to support event processing functions, abstract the event information to determine the health state of a CI and set the CI’s KPIs. Three kinds of indicators exist: Event Type Indicator (ETI), Health Indicator (HI) and Key Performance Indicator (KPI).
HPE recommends performing the indicator tuning in the next phase.
Populate RTSM topology with CIs and CI relations At this point, it is important to supply a basic model of the managed environment CIs. The basic model covers a node representation of the elements that are part of the environment. In addition, this basic model may cover relations to the running software, e.g. a database instance.
CIs can be created using available interfaces or through discovery. This is explained later in this section.
For more information on this topic, see the following documents:
The RTSM Best Practices document
The Effective Modeling for BSM 9 document
The online help topic “Dynamic Environments and Creating Nodes from Events”
The CI and CI relation data can be maintained in the RTSM topology manually. However, as the RTSM has to accurately reflect the CIs and CI relations in the scope of the Operations Bridge, maintaining the changes manually is not efficient due to the amount of changes occurring in daily operations.
Therefore, HPE recommends to create and maintain the RTSM model automatically.

Figure 7: Sources for RTSM Topology
Information on managed objects existing in management solutions, such as Operations Manager and NNMi, can be integrated as well.
While some solutions, such as RUM, create CI instances together with relations across domains, other monitoring sources and solutions typically focus on single aspects and certain monitored elements. For example, the relationship between cross-domain CIs is often not established. The RTSM provides mechanisms that allow creating relationships between CIs automatically, e.g. through RTSM enrichment rules.
To feed the CI information into the RTSM, it is recommended to use the Operations Connector (OpsCx) in combination with a discovery policy.
OpsCx provides a set of out-of-the-box topology scripts for a basic set of CIs.
If increased flexibility is required, custom topology scripts allow importing the CI information into the RTSM thus offering more control over discovery and mapping of the discovered information.
Note Refer to the OpsCx Online Help for more information on this topic.
As an alternative, a UD-based discovery solution can be integrated to perform a comprehensive discovery of the domain in a flexible and extensible manner. For this setup, consider implementing a central CMDB that will act as a consolidation point for the CI-related information. The central CMDB is more flexible in supporting change management processes.
Integration of an existing CMDB (or other RTSM instances) with the RTSM is possible at any time and is recommended.
Table 1: Integrating the CI information - recommendations
Integration of the external CI Information Recommendation for the RTSM integration
Products NNMi, OM Linux, OM Windows, RUM, SiteScope, BPI…
Use out-of-the-box topology integration.
Element managers via connector (e.g. Microsoft SCOM, Nagios, Oracle Enterprise Manager, Zenoss, IBM Tivoli, BMC Impact Manager)
Use the topology discovery and synchronization supplied with the Operations Connector.
Creating Node CIs from Events Use the OMi capability to create node CIs based on incoming events for the instant use of OMi.
Custom element manager integration Use the Operations Connector capabilities: out-of-the-box topology script or custom topology script.
Custom CI-related information from a set of defined sources
Use the Operations Connector for custom data sources.
Flexible and/or extensive discovery to be performed to gather the CI information.
Implement a separate CMDB instance and use UD to perform a discovery. Integrate the RTSM with CMDB.

Derived Values and Benefits Event consolidation into OMi provides a number of benefits enabling you to:
• Use the event perspective on the OMi application to gain an overall overview.
• Use event filters to analyze and focus on a certain subset of events. Predefined event filters can be supplied upfront; custom event filters can be saved for future reuse. Events can be searched and compared in an efficient manner.
• Use the event dashboard to design and implement predefined views on the events.
• Use event related KPIs (unassigned, unresolved) for the event filtering.
• Use automatic event assignment rules to increase operator efficiency.
• Use tools and actions to provide the right set of utilities to your operators. The out-of-the-box range of tools can easily be extended.
The example below shows an event dashboard. The upper part of the dashboard contains the elements allowing a quick and easy filtering of the events according to the category, event assignment, resolution state, and event age. Clicking an element performs filtering of the events; the result of the filtering is shown in the event browser on the bottom of the dashboard, from where all event data can be accessed.
Note that event dashboards offer flexible layout capabilities and are easily customizable.
Figure 8: Example: Event Dashboard with quick event filtering capabilities

Step 2: Control events The Control Events step summarizes the activities that elaborate on the amount, meaning and significance of the events. OMi supports this with a rich set of high-performance functions acting on the stream of incoming events.
You do not have to apply the activities mentioned in this section all at once. Instead, consider implementing some functions early within a single step and applying other functions as tuning at a later time.
The following functions are applicable with node centric monitoring and do not require much elaboration on the RTSM and its CI information upfront:
• Event qualification
• Event correlation
• Event automation
Figure 9: Second Step – Control Events
Event qualification A significant amount of tuning is typically performed on the source side of the events by tuning the policies
that intercept the event information and form it with its attributes. At this point, the filtering should be
adapted in order to avoid unwanted events from appearing in OMi. Also, the events should be reviewed
regularly to ensure that they appear with the correct severity and other attributes.
OMi provides the following event-centric functions that help to control the events:
• Tuning of monitoring parameters
Monitoring Automation allows the adjustment of monitoring based on parameters. • Event filtering
If unwanted events occur in OMi, filtering at the source side can be adjusted to suppress such events. If events have inappropriate attributes, event filters at the source side can be adjusted to ensure that events are generated with correct attributes.
• Event suppression
To ensure the availability of the OMi solution in case of erroneous or excessive event generation, the event storm detection facility can be used to identify such situations and take mitigation measures to protect OMi. The event storm detection enables the definition of exceptions.
• Event enrichment and processing through EPI
To provide high-quality meaningful events, it is possible to enrich events with the additional information through the event-processing interface (EPI). Event enrichment can be performed at different steps during the event processing. Based on a scripting interface, this functionality is highly flexible and efficient.
The range of functionality is not limited to enrichment, but also enables performing modifications on events, such as reworking event attributes to normalize the event format.
• Event typing

One of the OMi key concepts is event typification. Events are associated with event type indicators and health indicators. Such indicators are driving OMi correlation functions and provide the CI status and health information through key performance indicators.
Monitoring parameter tuning If Monitoring Automation is used, the monitoring provides customizable parameters.
Parameters can be adjusted for all OM Agent systems connected to OMi or for a defined subset group of OM Agents. Tunable parameters are typically thresholds and event attributes, such as event category and event severities.
Figure 10: Example policy – disk utilization threshold values as parameters
Event filtering through policies Event information sources are integrated with OMi as described below.
Monitoring Automation is used to connect systems monitored through an OM Agent to OMi. Monitoring Automation policies define the set of events accepted by the systems. They also determine the events’ attributes, such as title and severity. Policy tuning is a regular task performed to ensure that unwanted events are removed from the system and the wanted events are displayed correctly.
When the events are integrated from an underlying OM system, policy tuning works in a similar way; however, it needs to be performed on the OM level.
Other event sources integrated through an Operations Connector are also based on policies, which can be adjusted according to your needs.
The following picture shows an example log file policy with the list of event conditions including the pattern of a particular event.

Figure 11: Example Policy – Oracle Alert Log Policy Conditions
Event suppression
You can define event suppression rules based on event filters. The events matching one of these rules are rejected from further processing.
The following screenshot shows an event suppression rule based on a simple event filter, which matches the events containing the word test in the event title.
Event suppression rules can be enabled or disabled at any time.
Figure 12: Event suppression based on event filter

Event typing - Event Type Indicators
An event type indicator (ETI) is an event attribute supporting event processing functions defined on a CI-type level and set on incoming events. ETIs are used to typify similar events across various event sources. It is a clear and concise indicator of the event’s nature.
ETIs are the basis for performing event correlations, such as event de-duplication, pairwise correlation and topology-based event correlation.
ETI resolution is done in OMi on incoming events. The resolution process is performed based on hints contained in the events. In addition to a hint-driven resolution, indicator mapping rules can be configured to set the ETI on certain events or even to override the hints provided with the incoming events.
OMi comes with a large set of predefined ETIs. Those can be leveraged and extended if needed; however, they should not be deleted or modified without understanding the impact of the change to potentially affected health indicators.
Indicators are configured under Admin -> Operations Management in the Monitoring section. They mainly consist of a name and a set of possible states defined by the display name, status and a status icon.
Event type indicators are shown together with health indicators and can be distinguished by an icon. An ETI can be converted into an HI.
The following figure shows a sample ETI available for the Unix CI type. This ETI is inherited from the Computer CI Type and has the name BatchJobService. Its status is Available or Unavailable, associated with Normal and Major criticality.
Figure 13: Event Type Indicator Example
Event typing - Health Indicators A Health Indicator (HI) is similar to an ETI. It reflects the health of a specific operational characteristic of a CI and sets the status of a specific aspect of a monitored CI.
An HI impacts the propagation and calculation of Key Performance Indicators (KPIs) in the Service Health and Service Level Management components. Metric-based HI instances are also available, which are set via the metric information gathered by data collectors, such as SiS, BPI, etc.
One of HI examples is CPU Load. Its values can be Normal, Constrained, Overloaded, Bottlenecked, or Busy.

Note: Service Health will be covered later in this document. It is not necessary to focus on HIs at this stage, although they may already be present and functional, e.g. supplied by the out-of-the-box Management Packs.
Like ETIs, His can be used in OMi functions, such as event de-duplication and pairwise correlation.
The value of an event’s HI is resolved on the OMi Server. The resolution process is influenced by the hints contained in the event.
Like ETIs, HIs are maintained under Admin -> Operations Management in the Monitoring section. An ETI can be converted into an HI.
A rich set of pre-defined HIs is supplied with OMi out of the box. Those can be leveraged and extended if needed; however, they should not be deleted or modified without understanding the impact of the change to potentially affected HIs.
The following figure shows a sample HI named CPULoad, available for the Unix CI type. This HI is inherited from the Computer CI Type. Its status can be set to Normal, Constrained, Warning, Busy, Overloaded, Bottlenecked, or Critical. These states correspond to severity levels from Normal to Critical as shown in the figure.
Figure 14: Health Indicator Details
Event typing - Key Performance Indicators KPIs are high-level indicators of the CI performance and availability. A KPI is related to a CI type and defined in the KPI repository. Its status is calculated by HIs using business rules. In addition, KPIs are influenced by the KPIs of child CIs. They represent a high-level aggregated view on the CI status.
A set of pre-defined KPIs, such as performance and availability KPIs, is supplied with OMi out of the box. Additional KPIs aggregate information about the events present for a specific CI (or its child CIs): Unresolved Events KPI and Unassigned Events KPI. The OMi user interface displays the KPI status and status trend information in the health view with colored icons tagged to the related CIs.
Note: KPIs will be covered later in this document. It is not necessary to focus on KPIs at this stage, although they may already be present and functional, e.g. supplied by the out-of-the-box Management Packs.

Event enrichment and custom processing through EPIs Event processing customization enables you to implement custom script-based event processing directly on events. This is possible at four different processing stages: before the CI/ETI resolution, after the CI/ETI resolution, before storing the event in the database and after storing the event.
The range of events fed into the custom event processing can be controlled by specifying event filters. Different scripts can be enabled or disabled during runtime.
The script-based event processing logic has to be supplied as a groovy-based script. A number of sample scripts is available.
Figure 15: Sample EPI script to modify event attributes
import java.util.Date;
import java.util.List;
import com.hp.opr.api.scripting.Action;
import com.hp.opr.api.scripting.Event;
import com.hp.opr.api.scripting.EventActionFlag;
import com.hp.opr.api.scripting.LifecycleState;
import com.hp.opr.api.scripting.MatchInfo;
import com.hp.opr.api.scripting.NodeInfo;
import com.hp.opr.api.scripting.PolicyType;
import com.hp.opr.api.scripting.Priority;
import com.hp.opr.api.scripting.ResolutionHints;
import com.hp.opr.api.scripting.Severity;
/*
* This example set all possible event attribute to some example values.
*/
class SimpleExample
{
def init()
{
}
def destroy()
{
}
def process(List<Event> events)
{
events.each {
event -> modifyEvent(event);
}
}
def modifyEvent(Event event)
{
String application = event.getApplication();
event.setApplication("Modified by EPI: " + application);
long groupId = event.getAssignedGroupId();
event.setAssignedGroupId(groupId);
int assignedUserId = event.getAssignedUserId();
event.setAssignedUserId(assignedUserId);
Action autoAction = createSampleAction();
event.setAutoAction(autoAction);
ResolutionHints hints = createSampleResolutionHints();
event.setNodeHints(hints);
String ciInfo = event.getRelatedCiHint();
event.setRelatedCiHint("Modified by EPI: " + ciInfo);
}
def ResolutionHints createSampleResolutionHints()
{
ResolutionHints hints = new ResolutionHints(false);
hints.setCoreId("CoreId");
hints.setDnsName("mydqdn.com");
hints.setHint("My Hint");

hints.setIpAddress("0.0.0.0");
return hints;
}
def Action createSampleAction()
{
NodeInfo actionNodeInfo = new NodeInfo(false);
Action action = new Action(false);
actionNodeInfo.setCoreId("CoreId");
actionNodeInfo.setDnsName("myfqdn.com");
actionNodeInfo.setIpAddress("0.0.0.0");
action.setCall("Call");
action.setNode(actionNodeInfo);
action.setStatus(EventActionFlag.AVAILABLE);
return action;
}
}
The following figure shows the configuration dialog where EPI scripts are specified.
Figure 16: Sample EPI customization as displayed in OMi
Event correlation functions OMi offers a rich set of event correlation functions running centrally on the OMi server. They help to reduce the amount and improve the quality of events.
Event correlation functions relevant to this phase include:
• Duplicate event suppression It is possible to detect duplicate occurrences of events and suppress such duplicates based on the event attributes, such as the event key and others. Multiple occurrences are counted.
• Pairwise correlation For the events representing status information, OMi allows pairwise correlation of such events to display only the latest status information. At this stage, pairwise correlation of events based on event keys is available.
• Stream-based event correlation
Stream-based event correlation capability of OMi addresses a number of common correlation scenarios: – Suppression of repetitive events
Frequently re-occurring events can be suppressed and eliminated from further processing. This saves processing bandwidth as no duplicates have to be counted. Suppression is possible based on the rate and time interval.
– Check for missing events If the absence of an event within a given timeframe represents an incident (example: “Backup completed successfully” is missing for more than one day), OMi can generate an alert for such a situation.

– Combination of events OMi can combine a set of various events to raise a more meaningful alarm. This is useful if a certain event pattern stands for a specific cause. In this case, suppression of the originating events is optional.
• Topology-based event correlation
Using the RTSM topology information, OMi can automatically determine relationships between events and identify causal and symptom events.
• Event storm suppression
Duplicate event suppression Duplicate events can be identified in OMi based on different event attributes. Like in classic OM, duplicate event suppression can be based on the event key; however, in OMi, it can also be based on a configurable selection of event attributes. In addition, a specific event type indicator can be used to detect duplicate events (it can be configured in the Settings Manager). OMi allows to control its behavior.
Figure 17: Duplicate event suppression – configuration settings
Event keys and other regular event attributes are typically defined on the event source / policy level. Although they can be manipulated on the OMi server side (e.g. through an EPI script or with indicator mapping rules based on event filters), this approach should be limited to a low number of events.
Pairwise correlation OMi can automatically close a subsequent event based on the information contained in the event using pairwise correlation. The identification of the related events is based on the event key or the event type indicator attribute of the event. The behavior can be configured in the Infrastructure Settings.

Figure 18: Pairwise correlation – Infrastructure Settings
Like in classic OM, an event key in combination with a close event with key pattern can be used to trigger the pairwise correlation.
Figure 19: Pairwise correlation – example Event Key and Close Events with Key event attributes
The event type indicator, which is an event attribute linked to the CI instance, allows the implementation of the pairwise correlation: if an event matches the CI instance and the event type indicator of a previous event, it closes the previous event.
In the example below, the event type indicator File Server Service is set to Unavailable. A consecutive event setting the same indicator to a different value will close this event.
Figure 20: Pairwise correlation – example Event Type Indicator
Stream-Based Event Correlation: repetition, combination and missing recurrence
The stream-based event correlation of OMi allows the implementation of various correlation scenarios acting on a range of events potentially occurring within a defined time window. This functionality addresses a rich set of common correlation scenarios:
• A repetition rule A repetition rule acts on events identified as potential event duplicates. It is defined on an event filter combined with a time window. The events matching the event filter are counted: if a defined threshold is reached, an event action is triggered. The event action can close all

events, release the last event (closing the others) or release all events. As an option, a new event can be raised with defined attributes.
• A combination rule A combination rule combines different events. In order to identify the events, two or more event filters can be configured combined with a time windows. As an option, a certain order of events can be demanded. The action performed once a combination rule matches can be configured as follows: the related (or all but the last) events can be closed or the events can be released with or without modifications. As an example, event modification, events can be marked as cause and symptom events. In addition, it is possible to raise a new event with specific attributes.
• A missing recurrence rule Some events are expected to occur at a regular interval. As an example, an important positive event would be a “backup successful” event. If such an event does not occur within a given time window, an incident is indicated. The missing recurrence rule allows creating events if an expected event (identified by a filter) does not appear within the time window. The missing recurrence rule has the option to release, close or discard the events matching the filter.
Note For further information on the stream-based correlation capabilities and configuration of these scenarios, see the online help topic Stream-Based Event Correlation.
Topology-Based Event Correlation OMi allows correlating events based on a topology relationship of the CI instances related to events. The correlation is not limited to relating events to each other; it also identifies and marks Cause and Symptom events allowing the operators to focus on Cause Events for a quick and effective problem resolution.
Topology-based event correlation (TBEC) is based on the CI instance and CI relationship information contained in the RTSM. The RTSM consolidates CI instances across different domains potentially managed by different element managers. As an example, the CI instance and CI relationship information can be consolidated from system monitoring, network monitoring, as well as from a DB element manager, such as Oracle Enterprise Manager allowing to identify the events related to each other (although the event might originate from different sources).
The TBEC is built on top of event/health indicators, as well as on the topology information between the CI instances.
The following figure shows an out-of-the-box TBEC correlation rule, which is an example of how TBEC is configured. The TBEC correlation rule Generic::Node >> Node Status >> Database Server Status relates Node Status events, such as “Node Down”, “Node Hang” and other node statuses that indicate an unavailable system with the events originating from the database monitoring. In particular, the “Database Server Status Down” event is related to the “Node Status Down” event. The events are specified with the ETI/HI for particular events.
To perform such a correlation, node CI instances and the database instance must be related to each other. The RTSM models this relationship with a Composition relationship. The rule topology is configured using a corresponding topology query.

Figure 21: TBEC example – relates Node Down and Database Server Down
The events from related CI instances matching the topology query and having the right ETI/HI set are related to each other. The relation allows marking cause and symptom events. This information is displayed in the event and health perspective and can be used to filter the event browser, allowing the users to focus on the important events.
Figure 22: TBEC example – Node Down Cause Event and Related Database Server Down Symptom Event
Event Storm Suppression The event storm suppression is an OMi feature that constantly monitors the rate of occurring events per node. If the amount of events received from a particular node exceeds a threshold for a given time window, the event storm suppression assumes an abnormal situation and discards the events from the node until the situation stabilizes.
The settings of the event storm suppression, such as thresholds and a time window, are configurable. In addition, it is possible to define the exception rules based on event filters, meaning that events matching the exception rules are not taken into consideration. The event storm suppression raises the events when an event storm starts or ends.

Figure 23: Event Storm Suppression
Event automation This section describes the OMi features related to event automation: • Automatic and operator-initiated actions
Events can be related with defined corresponding actions. Such actions can be performed automatically and unattended or can be configured to require an operator initiation. Results of actions are typically stored in the event context as an annotation.
A target can be any system running an OM Agent. In case of using Operations Orchestration integration, actions can trigger OO run books.
• Automatic user assignments
• Time-based event automation
A set of optional time-based event automation functions can be used to further tune the event processing. Examples of such functions include increasing an event priority after a certain period of time or automatic-time based restarting of failed actions.
• Automatic or manual forwarding of events to external systems
OMi allows the setup of flexible event forwarding rules to different targets, such as a trouble ticket system or a notification solution.
If an environment contains multiple instances of OMi or OM systems, it is possible to set up flexible and hierarchical event forwarding to these systems based on event filters. This is also known as the Manager-of-Managers concept.
Automatic and operator-initiated actions Automatic and operator-initiated actions related to events are typically defined on a policy level. If Monitoring Automation is used, the policies can be easily reworked within OMi in order to define automatic or operator-initiated actions for the events.
The policies for the events integrated via the OM or Operations Connector can be modified accordingly in the OM/Operations Connector.
As an alternative, an event-processing interface (EPI) script can be used to set automatic or operator-initiated actions within OMi.

Automatic user assignments OMi allows performing automatic assignments of events to user groups. The events to be assigned are defined by an event filter. The event can be adjusted in a flexible manner to ensure the right set of events matches the filter. Automatic user assignment is initiated as soon as events arrive in OMi.
Time-based event automation Time-based event automation enables to configure the actions to be executed after a defined time.
The set of events relevant for the event automation is defined using an event filter.
Actions performed on events matching the event filter cover:
• Re-run of an automatic action associated with the event
• Modification of event attributes
• Forwarding events to external systems
• Assigning events to a user group
• Run of groovy scripts
• Launch of Operations Orchestration run books
The following example shows a time-based event automation scenario, which increases the severity of an open event after 1 hour.
Figure 24: Time-based event automation example – increase event severity and priority after 1 hour
Event forwarding and other functions OMi allows to forward events matching configurable filters to target servers, including other OMi instances or a trouble ticket system. Target systems must be configured as connected servers. For the generic event forwarding, a custom external event processing can be triggered via script or web service.
Note: For further information, see the online help topics Event Forwarding and Connected Servers.
Other activities During this phase, HPE recommends to regularly review the CI model contained in the RTSM. Typically, the event typing will identify gaps in the RTSM CI model and missing relations between CI instances. Plan and implement the generation of CI instances and establish relations as described in RTSM Considerations. This will result in more specific mapping of the events and, through a model of the CI relations, in assessing the impact of events cross-domain wise.

This model can also be used to implement more sophisticated event-related functions, such as topology-based event correlation (TBEC). From the operators perspective, this step enables the Operations Bridge to provide meaningful events and cross-domain views on CIs.
Derived values and benefits At this stage, an operator works with the event perspective, which provides a rich set of functions based on the events. It can be used to identify situations to act upon, analyze the situation in more detail and remediate it.
Use the tuning capabilities on policies to provide important high-quality events to your operators.
Use correlation functions mentioned previously to reduce the amount of events and enrich the event information.
Supply CI collections with grouped CIs to provide the operations with the views on managed objects, allowing them to filter the events and supply the additional information through the CI collection.
Extend the use of automatic or operator-initiated actions on events.
Offer performance graphs of a related system to allow operators an enhanced drilldown when analyzing a problem.
If available, supply problem remediation capabilities using the Operations Orchestration integration.
Supply instruction texts to the operators in order to solve problems quicker.
Provide a problem escalation path by integrating OMi with a trouble ticket system allowing the operators to raise tickets upon an event and transfer the problem resolution to the process implemented within the trouble ticket system.
Use TBEC to classify events as Cause and Symptom Events allowing the operators to focus on important Cause Events.
Provide filters based on Cause Events to focus operators on these events.
The following figure shows an example event perspective. In the View explorer, an out-of-the-box view shows node CI instances derived from OM node groups, which can be used to filter the events.
The event browser shows the event details when selecting an event. Available tools are shown on the Actions pane on the right-hand side.
Figure 25: Example Event Perspective

Step 3: Add end-user perspective At this stage, it is recommended to complement the infrastructure monitoring with the status information gained through probing the end-user perspective on services and applications. The BPM and RUM solutions can be used to achieve such probing-based monitoring.
The health status gathered through probing provides the meaningful status information, while the event information gained through the infrastructure monitoring complements the status with the technical information on the cause of the incident.
Figure 26: Third step – add end-user perspective and moving on to CI centric monitoring
Complement Infrastructure Monitoring with End-User Perspective Services and applications provide their functions through defined interfaces, such as web-based protocols (web services, http, soap, ftp and many more). Consumers of services and applications are the end users, as well as other systems.
BPM allows active probing of services and their transactions from probe systems. It measures the availability of the services and transactions and gathers additional metrics about the performance.
RUM performs similar monitoring; however, it is not based on active probing but on listening to the user traffic.
Through the APM-OMi integration, availability and performance KPIs calculated by BPM or RUM are supplied to OMi. This represents the important information from the end-user perspective and complements the events gathered from infrastructure-focused monitoring.
Both infrastructure monitoring and end-user perspective probing are key information for operations as they bring together the current state of services with potential causes and symptoms derived from the infrastructure monitoring. The OMi correlation functions allow correlating these events.
Evolve RTSM Use RTSM enrichment rules to refine CIs and CI relations in the RTSM as described below.
Use RTSM enrichment rules to add additional CIs and to relate them, as well as to add or update the attribute values of specific CI instances.
Implement views that allow the operators to focus on their relevant area of responsibility. The out-of-the-box configuration provides a number of infrastructure and technology-focused views that can be used as a basis. Custom views can easily be created by copying and adjusting existing views.
Derived Values and Benefits Adding the end-user perspective to monitoring brings the following benefits:
It provides the operational staff with the events related to the service availability and performance, enabling them to get notified about service problems instantly.
It supplies the views allowing the operational staff to use them on event filtering in the event and health perspective. Event filtering is thus extended by the view-based filtering, which allows the operator to quickly focus on the right set of events.

It provides view mappings enabling the health perspective to display a pre-selected view on related CIs in the event browser.
Figure 27: CI centric monitoring – filter by view on Event Perspective
In addition to the event perspective, the health perspective is supplied, where the CI centric monitoring offers comprehensive health information including relationships and CI status. The event information is complemented with the status information through HIs and KPIs (if already available, e.g. supplied by Management Packs).
Figure 28: CI centric monitoring – Health Perspective with event related mapped Health Top View and HIs
The health perspective provides information beyond the CI related to an event and broadens the view by allowing to discover the CI neighborhood and related CIs and their KPI status. Performance graphs allow a detailed drilldown into a wide range of metrics provided by data collectors, such as Operations Agent, SiteScope, BPM, RUM and more.
Step 4: Business service centric management This phase of the product implementation deals with transforming OMi from the CI centric monitoring to a service management level in order to provide meaningful service status and health information. To achieve this, the RTSM model is extended with a model of business services. This relates the event information to business services allowing the operational staff to identify and understand the impact of the events on business services and enable them to focus on the most important ones.
To support the service centric management, the RTSM must be extended by defining a model of business services and applications. Such a model must contain a relationship to all relevant CI instances contributing to the business service.
Unlike the CI centric monitoring (where CI instances and relationships are maintained through discovery, integrations and automatic processes), the modeling of business services and their relations is a manual procedure. It requires a profound understanding of the service and its dependencies to the contributing service elements. Additionally, the structure of the service presentation is service-specific and needs to consider the views on the business service model as required by the user.
In this context, the details, such as service health status calculation, are specific to the business service and the consumers of the related views. Different users will require specific views on the business service model.
As the service status and health information consolidated in OMi is often fed into service reporting and service management, the service model has to support such requirements and processes by supplying the right level of information for these solutions.
Beside the operational perspective on events and their impact on business services, a complementary view can be elaborated providing a view on the service health of particular services, e.g. for displaying this information on a read-only dashboard and for sharing it with management or end users.
Depending on the service model, monitoring and expectations of the users viewing the information, it may be possible to satisfy these requirements with a single service health model. In other cases, it may be required to implement different service models e.g. using a different set of KPIs and business rules to address different requirements.
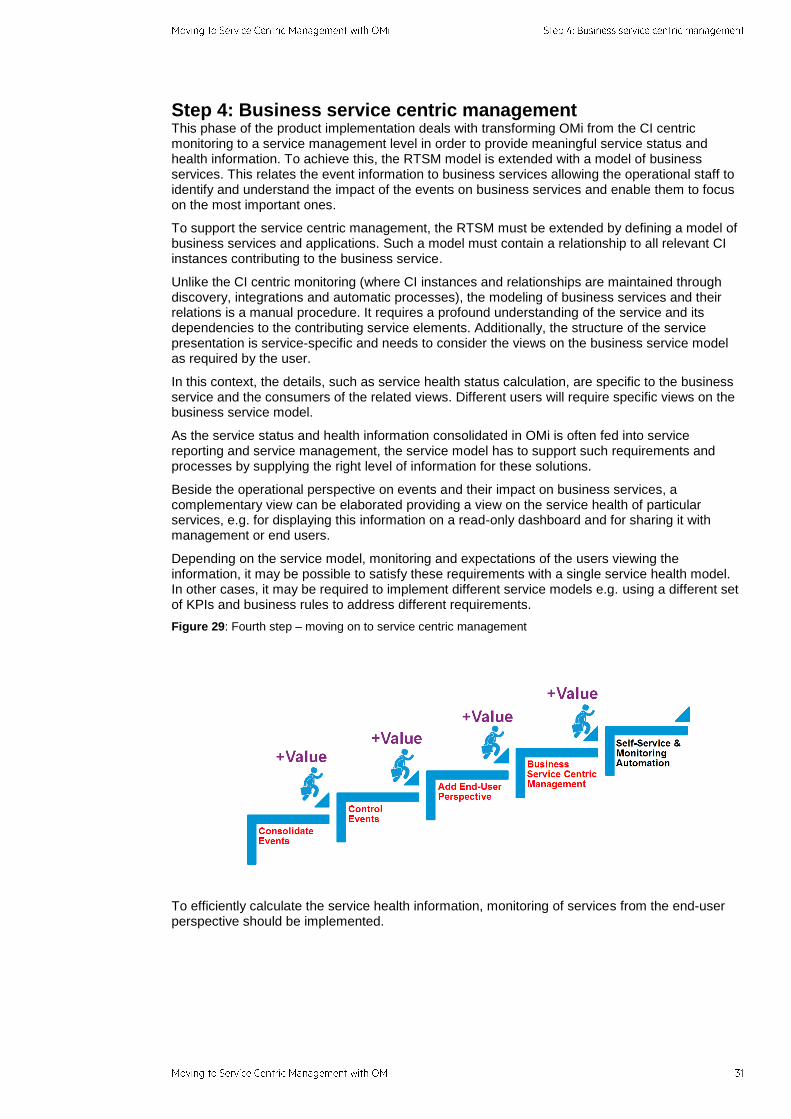
Figure 29: Fourth step – moving on to service centric management
To efficiently calculate the service health information, monitoring of services from the end-user perspective should be implemented.

Service modeling Figure 30: Logical Business Service Structure and Monitored Service Contributors
Note: For more information on this topic, refer to the:
Effective Modeling for BSM - Best Practices document
End-to-End Service Monitoring in IT Environment Best Practice (It provides information on how to deploy and implement end-to-end service monitoring solutions to ensure adherence to the level agreed upon between the service provider and the service consumer)
OMi online help Modeling Studio sections: Building a Business View, Business CI Model, Build a Business CI Model – Scenario
Example Business Service Model - Overview This section describes the steps required to build a example business model in the RTSM based on a pattern view.
Business Service Models can be created in different ways, e.g. as an instance-based model. Instance-based models are easy to create and maintain by building a nested structure of business CIs and dragging the related CIs into this structure. However, an instance-based model is static and requires manual maintenance, e.g. if new CI instances relevant to the service model need to be included.
Pattern-based models are defined via a TQL query, which determines the structure and the CIs returned as a result. This leads to a more dynamic service model, meaning that new CI instances fitting into the service model are automatically included if they match the related TQL query. This provides more automation.
The example described in this section uses a pattern-based model. The following steps are shown:
1. Designing the structure of the service model
2. Creating the structure of the service model based on a pattern view
3. Creating CI instances required for the example service model
4. Creating relations between the example service model and underlying infrastructure services
As the first step, the structure of the business service model has to be drafted. In the example, a fictional service named “Cool Product” consists of two major entities with different channels, the customer self-service and the branch office application. The customer self-service is elaborated in more detail below.
Workshops held with subject matter experts revealed that the customer self-service has two major work components with different systems and responsibilities involved: the Ordering and the Fulfillment.
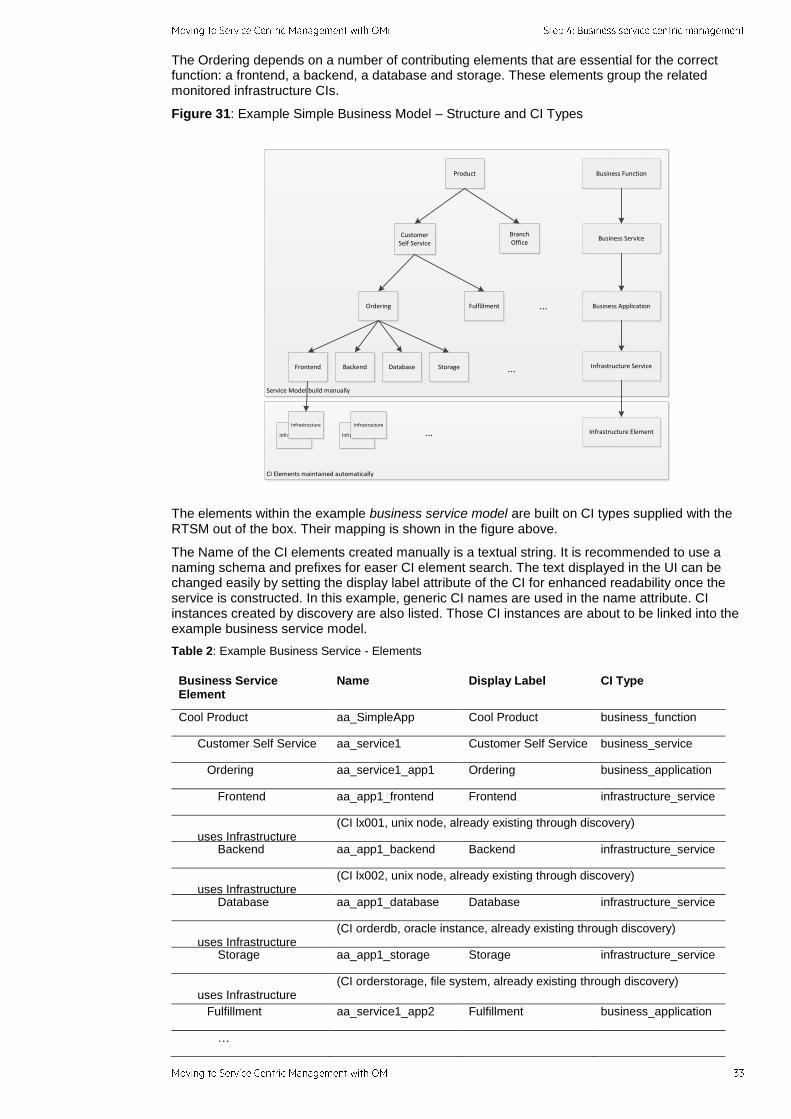
The Ordering depends on a number of contributing elements that are essential for the correct function: a frontend, a backend, a database and storage. These elements group the related monitored infrastructure CIs.
Figure 31: Example Simple Business Model – Structure and CI Types
Service Model build manually
CI Elements maintained automatically
Product
Customer Self Service
Branch Office
FulfillmentOrdering
Frontend Backend Database Storage
Infrastructure
Infrastructure
Infrastructure
Infrastructure
...
...
... Infrastructure Element
Infrastructure Service
Business Application
Business Service
Business Function
The elements within the example business service model are built on CI types supplied with the RTSM out of the box. Their mapping is shown in the figure above.
The Name of the CI elements created manually is a textual string. It is recommended to use a naming schema and prefixes for easer CI element search. The text displayed in the UI can be changed easily by setting the display label attribute of the CI for enhanced readability once the service is constructed. In this example, generic CI names are used in the name attribute. CI instances created by discovery are also listed. Those CI instances are about to be linked into the example business service model.
Table 2: Example Business Service - Elements
Business Service Element
Name Display Label CI Type
Cool Product aa_SimpleApp Cool Product business_function
Customer Self Service aa_service1 Customer Self Service business_service
Ordering aa_service1_app1 Ordering business_application
Frontend aa_app1_frontend Frontend infrastructure_service
uses Infrastructure Element lx001
(CI lx001, unix node, already existing through discovery)
Backend aa_app1_backend Backend infrastructure_service
uses Infrastructure Element lx002
(CI lx002, unix node, already existing through discovery)
Database aa_app1_database Database infrastructure_service
uses Infrastructure Element orderdb
(CI orderdb, oracle instance, already existing through discovery)
Storage aa_app1_storage Storage infrastructure_service
uses Infrastructure Element order_storage
(CI orderstorage, file system, already existing through discovery)
Fulfillment aa_service1_app2 Fulfillment business_application
…

Branch Office aa_service2 Branch Office business_service
…
Example Business Service Model - Create pattern-based view Next, a pattern-based view is created in order to implement a TQL query matching the structure of the example business service.
A new pattern view named “aa_MyService” is created in the Modeling Studio under Admin -> RTSM Administration, Modeling -> Modeling Studio.
Drag and drop the CI types that constitute the simple business view (BusinessFunction, BusinessService, BusinessApplication, InfrastructureService, InfrastructureElement CI types) into the query definition pane.
Extend the TQL query by specifying the required relationship between the CI types. Choose the relationship type “Containment” between the Business Elements. Choose the relationship type “Usage” between the InfrastructureService and the InfrastructureElement CI type.
Figure 32: Example simple business model – create a pattern-based view
Refine the query node properties for the nodes in the TQL query. For this simple business model example, set the query cardinality for all “Containment” relationships of the query to the type “0..*”.
Refine the query node property of the “Usage” relationship between InfrastructureService and InfrastructureElement to “1..*”.

Figure 33: Example Simple Business Model – Set relationship cardinality on the TQL query
The result of the query representation can be influenced by defining the hierarchy method in the Hierarchy Pane. For the simple business model, a tree-like presentation of the structure is desired. This means that the hierarchy is refined as shown in the following screenshot.
Figure 34: Example Simple Business Model – Hierarchy Layout
After this, the pattern view can be saved under the name aa_MyServices.
Example Business Service Model - Create the CI Instances Now that the pattern-based view has been created, the CI instances of the simple business view (see Table 2: Example Business Service - Elements ) are added manually to the RTSM.
This is done in under Modeling -> IT Universe Manager. Selecting the aa_MyServices view restricts the CI types available for the CI creation, which is recommended.

Figure 35: Example Simple Business Model – add CIs
Once all CI instances are created, the relationship between the business service instances must be established. This can be performed via the menu item “Insert Relationship”, which brings up a dialog that allows lookup/find of CI instances.
The CI instance’s relationship in the example needs to be added as a containment relationship as this has been defined within the view.
Figure 36: Example Simple Business Model – insert relationship, CI selection
The CI Type can be restricted (or extended) in order to return the right type of CI instances in the lookup. Multiple target CI instances can be selected.

Figure 37: Example Simple Business Model – Insert Relationship, Relationship Type and Direction Selection
Once all CI instances have been created and the CI instance’s relationship is defined, this step is complete.
Example Business Service - Relate monitored CI Instances Now the monitored CI instances are linked into the business service model below the infrastructure service instances.
In the example, the following existing infrastructure elements are related to the example business service model:
Frontend: Infrastructure element lx001 (Unix node)
Backend: Infrastructure element lx002 (Unix node)
Database: Infrastructure element orderdb (Oracle instance)
Storage: Infrastructure element orderstorage)
The workflow establishing these relationships is similar to the previous section; however, the relationship is of type “Usage”.
Example Business Service - Viewing the Result The example business service model is available in service health and in the event, health and performance perspective. Its structure and related CI instances can be reviewed in these components.
The following screenshots show the example business service in the service health top view, the service health topology map (including KPIs) and the OMi health perspective where all related events are displayed.

Figure 38: Example Simple Business Model – Service Health Top View
Figure 39: Example Simple Business Model – Service Health Topology Map
As an example within the health perspective, the example business service model can be used for event filtering purposes.

Figure 40: Example Business Model –View Explorer
Service Status and Service Health The Service Health application combines service-related information derived from the event and metric data consolidated in OMi and transforms this information into a near real-time service model.
To achieve this, Service Health combines topology information from business services and their related monitored CI instances contained in the RTSM with business rules that calculate the services’ status regarding health and performance. Service Health comes with the out-of-the-box configuration that allows instant use of the Service Health application. Depending on the requirements, it is possible to tune and adjust Service Health to present the desired information and perform the appropriate service health calculation, depending on the group consuming the information.
This section provides some information on service health concepts and customization options.
Note: The OMi online help topic Service Health gives additional information on this topic.

Figure 41: Example of Business Service Health View, with KPIs and CI Status
Key Performance Indicators The KPI is defined in the KPI repository. Its status is calculated by HIs using business rules. In addition, KPIs of a CI are influenced by the KPIs of child CIs. They represent a high-level aggregated view on the CI status. A set of out-of-the-box KPIs is defined, such as performance and availability KPIs. Additional KPIs aggregate information about events that are present for a specific CI (or its child CIs): Unresolved Events KPI and Unassigned Events KPI. The OMi user interface displays the KPI status and status trend information in the health view with colored icons tagged to the related CIs.
The following figure shows KPIs, such as Application Availability and Application Performance, defined within service health out of the box.

Figure 42: Key Performance Indicators Overview / Repository
The following sample configuration shows how Software Availability KPI of an Oracle database instance is determined from HI states. The assignment between CI types, KPIs and HIs is under Service Health Administration -> Assignments -> KPI Assignments.
Figure 43: KPI Assignment Example – Oracle CI and Oracle KPI Assignments
Navigating to the details of the Oracle KPI Assignment shows the details, such as related HIs and the business rule, used to aggregate the KPI status from related HIs.

Figure 44: KPI Assignment Example – Software Availability KPI, Related Health Indicators and Business Rule
KPI and list of related HIs A list of related HIs is maintained within this configuration.
In the following figure, the HI “Database Service Status” is a member of an HI list related to the Software Availability KPI of an Oracle database.
Figure 45: KPI Assignment Example – List of HIs assigned to KPI
KPI and CI Status Calculation
A KPI status is calculated from the KPI-related HIs based on a business rule. By default, the worst status rule is applied. The calculation is based on HIs and the child KPIs.
The CI status is determined by the status of its KPIs according the “worst status rule”. The worst status of CI-related KPIs determines the overall status of the CI.

Figure 46: KPI Status – Business Rule, Calculation Basis
Example: KPI and HI in Health Perspective The following figure shows a sample “database down” event, which sets the Database Service Status HI impacting the Software Availability KPI.
Figure 47: KPI Example – KPI and HI Related to Database Down Event
CIs and KPI Propagation When a KPI is assigned to a CI, the propagation mechanism propagates the KPI to the parent CIs based on propagation rules.
By default, a KPI of a CI is automatically propagated to parent CIs (exceptions include “Unresolved Events” and “Unassigned Events”).
Propagation rules are defined on the CI-type level and can be changed. They are maintained under the Service Health Administration section under Assignments -> Propagation Rules.
Propagation rules defined on higher-level CI types are inherited by descendant CI types.

Note See the OMi online help topic Customizing KPI Propagation for more information.
Figure 48: Sample Propagation Rule – Do Not Propagate Unassigned Events KPI
Customize KPIs Displayed in Views Service Health allows selecting a range of KPIs that are displayed for a view. For all KPIs potentially available within a view, a subset can be selected. In addition, you can define which KPIs are considered for the overall CI status calculation.
This customization is performed in View Builder of the Service Health Administration. This is useful for providing custom views for different audiences. As an example, the operational staff should typically have all KPIs visible. A dashboard view provided to an end user can be limited to contain the basic availability and performance KPI information.

Figure 49: View Properties – KPIs to be included in View, CI Status Calculation
The following figure shows two sample views taken at the same time, with the identical TQL. The view on the left-hand side uses default view properties leading to all propagated KPIs shown in the view. The view on the right-hand side is limited to show the System Availability KPI only.
Figure 50: Two Views on the Same Service – Full KPIs (Left) and System Availability KPI Only (Right)
Event Priority Once events and their related CIs impact business services, OMi instantly calculates an additional event attribute allowing to classify events depending on their impact on a business service. The event attribute, Event Priority, can be used by the operational staff to identify the events to work on.
The calculation of the event priority is based on the event severity and the business service impact, as shown in the following table.
Table 3: Event Priority Mapping
Business Service Impact
Impact
Event Severity
Unknown Normal Warning Minor Major Critical
No Impact Lowest Lowest Low Low Medium Medium
Low Lowest Lowest Low Low Medium Medium

MediumLow Low Low Low Medium Medium High
Medium Medium Low Medium Medium High High
MediumHigh High Medium Medium High High Highest
High Highest Medium High High Highest Highest
Figure 51: Example Business Impact of a CI – Medium Low
Note: To display the Business Impact information in Service Health’s 360° View, the business impact bar needs to be enabled in Service Health’s infrastructure settings. See the online help topic How to Configure the Business Impact Component for further information.
Figure 52: Example: Resulting Event Priority in Event Browser
Derived Values and Benefits Implementation of Service Centric Management brings the following benefits: • Using the event priority allows classification of the events according to their business impact.
This enables the operators to focus on key events.
• Providing business service-related context with the trouble ticket integration.
• Extending the dashboard by views. This provides a business service perspective by combining the status information collected across different domains.
• Supplying dashboards that provide tailored views with the right level of the service-related information to customers, end users and management personnel.

Step 5: Self-service and Monitoring Automation This phase targets administrative aspects of the solution. The objective of this phase is to increase administration efficiency.
Figure 53: Fifth Step – Moving On to Self-Service and Automation
Today’s monitored environments are highly dynamic: the number of applications is growing; the underlying infrastructure elements are frequently changed or replaced. With virtualization and cloud concepts, changes are performed instantly and often automatically.
Implementing this phase of the solution will allow achieving the following goals:
Reduced administrative effort needed to configure the underlying monitoring solution
Self-provisioning of monitoring by customers
Standardized monitoring, which at the same time allows defined adaptation to target environments via parameters modifiable by the subject matter experts
Providing monitoring as a service through a service portal
This section describes some of these aspects in more detail.
Automation of monitoring Current IT environments are highly dynamic. The number of IT services, applications and infrastructure components that need to be monitored is growing. Infrastructure components are constantly added or removed by means of virtualized environments. OMi addresses the resulting administrative demand with its Monitoring Automation (MA) component that enables automatic configuration of monitoring in changing environments.
This section contains a brief description of the OMi MA components. It also shows how Monitoring Automation helps in monitoring virtualized or dynamic environments and provides the efficient monitoring configuration by using parameterized monitoring.
Monitoring Automation component Monitoring Application provides the following capabilities:
It allows configuring monitoring products in a single place. It covers the OM Agent-based monitoring, as well as the agentless SiteScope-based monitoring. This enables the maintenance and distribution of policies from OMi.
Monitoring Automation’s aspects concept allows definition of monitoring in a CI-specific manner.
It provides a powerful mechanism to implement adjustable monitoring standards that can be tuned to the target environment via a set of defined parameters. This hides the complexity and details of monitoring and its underlying technology allowing defining relevant parameters for tuning purposes.
The reporting capabilities can be used to quickly gain an overview about the monitoring configured in the environment.
Management Templates concept allows definition of monitoring in a service-specific context.

Monitoring Automation allows designing flexible models of distributed, composite applications corresponding to the CI topology contained in the RTSM. It is able to configure the corresponding distributed monitoring with minimal configuration activities.
The deployment of monitoring of distributed composite applications can be automated based on discovery results. The monitoring configuration can react on the changes occurred due to dynamicity.
Note: The OMi Management Pack Development Guide provides background information on how to use
the Monitoring Automation component.
Coping with monitoring of infrastructure that is changing Monitoring Automation enables OMi to perform monitoring of provisioned systems in an efficient manner.
At the startup of an installed system, it is possible to bundle system images with the OM Agent software. During the initial startup, the process for registering the OM Agent with the OMi server can be handled automatically, e.g. through implementing an automatic certificate granting through OMi server-based scripts.
In addition, Monitoring Automation allows defining triggers for the automatic deployment of discovery policies extending the RTSM with the CI information about the provisioned system based on discovery results.
This can be used as a trigger to deploy an additional defined set of monitoring configuration matching the results of the discovery.
Subsequent changes on the system are detected by regular re-discovery routines, propagating the related changes to the RTSM, which leads to adaptation of monitoring if necessary.
The Infrastructure Management Pack provides a set of common monitoring configuration targeting the system and OS resources and events and is ready to leverage the MA functionality.
Other Management Packs for common middleware components, such as databases, are available as well (the number of Management Packs is constantly growing).
Monitoring Automation also allows customers to design and develop their own tailored set of monitoring configuration as a management template, leveraging these concepts and fitting and extending the existing out-of-the-box capabilities.
Monitoring Automation Management Templates allow the definition of monitoring based on the RTSM CI topology information in a service context. It allows taking different CI types, relations and patterns into account to determine the applicable monitoring configuration.
Monitoring configuration developed with OM Windows or OM Linux can be imported into Monitoring Automation to build and evolve a monitoring solution on investment done in the past.
Note: The OMi Management Pack Development Guide gives some background information and
provides details on how to design and develop custom Management Packs.
Virtualization monitoring Operations Bridge Cloud Optimizer and the Management Pack for Infrastructure provides a rich set of functionality that targets the monitoring of virtualized environments from the guest and the host perspective. Beside provisioning monitoring of a virtualized system upon startup as described in the previous section, the Management Pack for Infrastructure can also gather the event, status change and performance metric information available by the virtualization platform itself covering common solutions, such as KVM and XEN.
Cloud Optimizer can be integrated into OMi and is covering X86-based virtualization platforms such as VMware.
Standardize monitoring with parameters Monitoring Automation allows adaptation of the monitoring configuration to a specific target based on parameters. Typical parameters include a category, a set of thresholds, environmental

parameters, such as installation paths or filenames, and environment variables or the credential information needed by monitoring to access the monitored application.
The MA parameter concept allows defining a certain baseline of standard default monitoring that can be adjusted to the needs of the target environment.
Parameterization of the monitoring configuration allows an easy adaptation of monitoring to different target systems and application instances. The parameters can have a default value (if no specific parameters are required for a target system) or can be tuned for specific needs.
Delegate monitoring administration to SMEs Tuning a parameter does not require an in-depth knowledge on how the monitoring is configured. The parameters can be used to hide the complexity of the underlying monitoring configuration and technology.
Designing and implementing the monitoring configuration should be separated from deploying the monitoring (the deployment task can be delegated to domain subject matter experts, reducing the amount of work for the OMi administrators).
Automation of OMi configuration OMi provides web service interfaces for automating configuration tasks and steps. These web services can be used to script the configuration changes and to integrate OMi configuration tasks into external workflow systems.
Monitoring Service Provisioning Today’s IT is dominated by concepts, such as cloud, infrastructure as a service, platform as a service, software as a service and more. Various solutions are available that support the implementation of such concepts.
Cloud Service Automation CSA combined with Operations Orchestration provides a solid and proven solution that is scalable and capable of handling the complexity of heterogeneous customer environments. It provides various functions, such as automated service lifecycle support, as well as an open and extensible architecture.
Provisioning of monitoring and service management is an important aspect, since service level objectives and the service levels related to provisioned services must be fulfilled instantly at the startup of the service with little or no latency.
By providing interfaces through exposing a rich set of web services, OMi can perform the necessary steps required to configure, deploy and maintain all monitoring and service management aspects in an automatic manner.
OO workflows can use web services to instrument all tasks required for the OMi configuration. Monitoring and service monitoring provisioning go along with the provisioning of services instantly and reliably.
As an example, CSA can be used allowing to choose a desired service. CSA and the underlying OO do not simply provision the infrastructure, platform and software; they also extend OMi and its RTSM with related CI instances and relations, as well as the views and business service representation in the service model. The provisioned systems register with the OMi system at the startup, which automatically triggers the deployment and activation of related monitoring.

Figure 54: Integrated Service Provisioning Covering OMi

Appendix This section contains the list of figures and list of tables.
Figure 1: Typical OMi solution architecture ............................................................... 8
Figure 2: BSM (RTSM) integrated with a central CMDB ........................................... 9
Figure 3: Steps and Sequence for a Successful Implementation............................ 10
Figure 4: Single Sequence ...................................................................................... 10
Figure 5: Example - Streams for Line of Businesses .............................................. 10
Figure 6: First Step – Consolidate Events ............................................................... 11
Figure 7: Sources for RTSM Topology .................................................................... 13
Figure 8: Example: Event Dashboard with quick event filtering capabilities ........... 14
Figure 9: Second Step – Control Events ................................................................ 15
Figure 10: Example policy – disk utilization threshold values as parameters ......... 16
Figure 11: Example Policy – Oracle Alert Log Policy Conditions ............................ 17
Figure 12: Event suppression based on event filter ................................................ 17
Figure 13: Event Type Indicator Example ............................................................... 18
Figure 14: Health Indicator Details .......................................................................... 19
Figure 15: Sample EPI script to modify event attributes ......................................... 20
Figure 16: Sample EPI customization as displayed in OMi ..................................... 21
Figure 17: Duplicate event suppression – configuration settings ............................ 22
Figure 18: Pairwise correlation – Infrastructure Settings ......................................... 23
Figure 19: Pairwise correlation – example Event Key and Close Events with Key event attributes ......................................................................................................... 23
Figure 20: Pairwise correlation – example Event Type Indicator ............................ 23
Figure 21: TBEC example – relates Node Down and Database Server Down ....... 25
Figure 22: TBEC example – Node Down Cause Event and Related Database Server Down Symptom Event .................................................................................. 25
Figure 23: Event Storm Suppression ....................................................................... 26
Figure 24: Time-based event automation example – increase event severity and priority after 1 hour ................................................................................................... 27
Figure 25: Example Event Perspective ................................................................... 28
Figure 26: Third step – add end-user perspective and moving on to CI centric monitoring ................................................................................................................. 29
Figure 27: CI centric monitoring – filter by view on Event Perspective ................... 30
Figure 28: CI centric monitoring – Health Perspective with event related mapped Health Top View and HIs .......................................................................................... 30
Figure 29: Fourth step – moving on to service centric management ...................... 31
Figure 30: Logical Business Service Structure and Monitored Service Contributors .............................................................................................................. 32
Figure 31: Example Simple Business Model – Structure and CI Types .................. 33
Figure 32: Example simple business model – create a pattern-based view ........... 34
Figure 33: Example Simple Business Model – Set relationship cardinality on the TQL query ................................................................................................................. 35
Figure 34: Example Simple Business Model – Hierarchy Layout............................ 35
Figure 35: Example Simple Business Model – add CIs .......................................... 36
Figure 36: Example Simple Business Model – insert relationship, CI selection ...... 36
Figure 37: Example Simple Business Model – Insert Relationship, Relationship Type and Direction Selection.................................................................................... 37
Figure 38: Example Simple Business Model – Service Health Top View ............... 38

Figure 39: Example Simple Business Model – Service Health Topology Map ....... 38
Figure 40: Example Business Model –View Explorer .............................................. 39
Figure 41: Example of Business Service Health View, with KPIs and CI Status .... 40
Figure 42: Key Performance Indicators Overview / Repository ............................... 41
Figure 43: KPI Assignment Example – Oracle CI and Oracle KPI Assignments .... 41
Figure 44: KPI Assignment Example – Software Availability KPI, Related Health Indicators and Business Rule ................................................................................... 42
Figure 45: KPI Assignment Example – List of HIs assigned to KPI ........................ 42
Figure 46: KPI Status – Business Rule, Calculation Basis ...................................... 43
Figure 47: KPI Example – KPI and HI Related to Database Down Event ............... 43
Figure 48: Sample Propagation Rule – Do Not Propagate Unassigned Events KPI ............................................................................................................................ 44
Figure 49: View Properties – KPIs to be included in View, CI Status Calculation ... 45
Figure 50: Two Views on the Same Service – Full KPIs (Left) and System Availability KPI Only (Right)...................................................................................... 45
Figure 51: Example Business Impact of a CI – Medium Low .................................. 46
Figure 52: Example: Resulting Event Priority in Event Browser ............................. 46
Figure 53: Fifth Step – Moving On to Self-Service and Automation ...................... 47
Figure 54: Integrated Service Provisioning Covering OMi ...................................... 50

List of tables Table 1: Integrating the CI information - recommendations ..................................... 13
Table 2: Example Business Service - Elements ...................................................... 33
Table 3: Event Priority Mapping ............................................................................... 45

Technical White Paper
© Copyright 2017 Hewlett Packard Enterprise Development LP. The information contained herein is subject to
change without notice. The only warranties for Hewlett Packard Enterprise products and services are set forth in the
express warranty statements accompanying such products and services. Nothing herein should be construed as
constituting an additional warranty. Hewlett Packard Enterprise shall not be liable for technical or editorial errors or
omissions contained herein.
This document contains confidential and/or legally privileged information. It is intended for Hewlett Packard
Enterprise and Channel Partner Internal Use only. If you are not an intended recipient as identified on the front
cover of this document, you are strictly prohibited from reviewing, redistributing, disseminating, or in any other way
using or relying on the contents of this document.
Best Practices for minimal/zero downtime during OMi software upgrade in an HA setup, April 2017
Learn more at
https://saas.hpe.com/en-us/software/operations-manager-i-single-pane-of-glass
https://marketplace.saas.hpe.com/itom/category/all?product=Operations%20Manager%20i%20(OMi)&version=All
https://saas.hpe.com/en-us/software/data-center-automation