Embed Size (px)
Citation preview

MOVES Briefing for NACAA
EPA Office of Transportation and Air QualityMarch 3, 2009
22
Outline
What is MOVES?
Functional comparison to MOBILE6.2
Model versions and schedule
Draft MOVES2009 results and implications
Next Steps

3
MOVES
MOtor Vehicle Emission Simulator State-of-the-art modeling framework Will replace current models (MOBILE & NONROAD)
and expand capabilities Designed to allow easier incorporation of large
amounts of in-use data from a variety of sources– MOBILE structure limited ability to incorporate new emissions
data

How is MOVES better than MOBILE6.2?

55
MOBILE6.2 Uses Text Input and Output Files

66
MOVES Has a Graphical User Interface
(MOVES can also be executed from a command line interface withoutuse of the GUI, for batch or unattended operation)
77
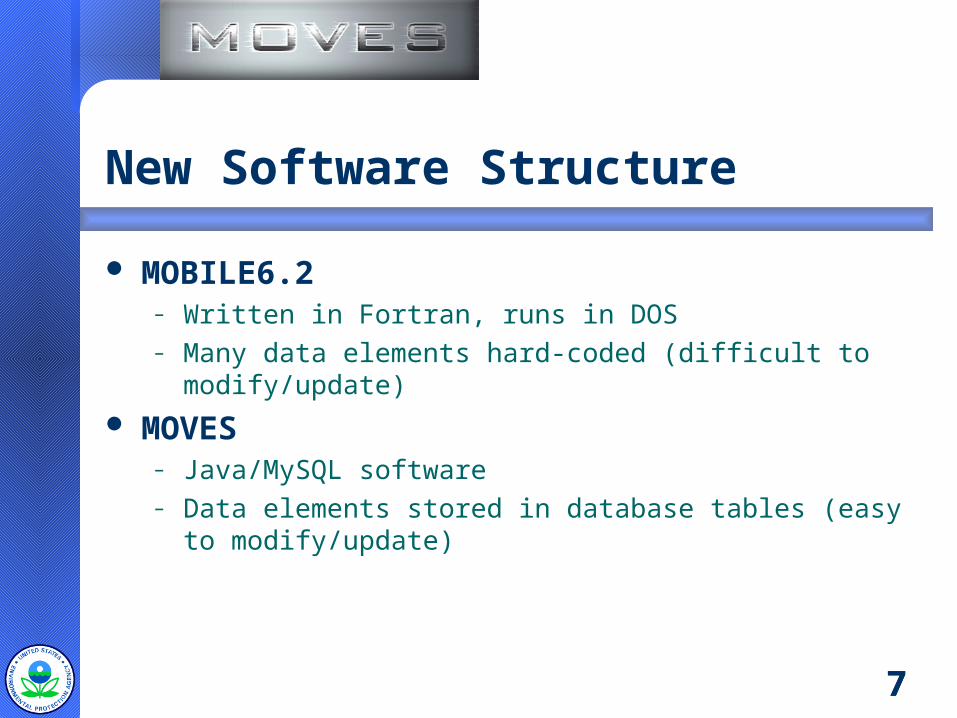
New Software Structure
MOBILE6.2– Written in Fortran, runs in DOS– Many data elements hard-coded (difficult to modify/update)
MOVES– Java/MySQL software– Data elements stored in database tables (easy to
modify/update)

88
More Flexibility
MOBILE6.2– Gram/mile emission factors– Fixed output formats
MOVES– Gram/mile emissions factors (grams/time for some processes)– Total emissions: inventories for specific areas and time
periods– Easily customizable output (many levels of
aggregation/disaggregation possible)

99
Multiple Geographic Scales
MOBILE6.2– Emissions rates based on regional-scale trip patterns (no
specific geographic area)
MOVES – Emissions inventories can be calculated at the national level,
county level, or project level– Lookup table option for emission rates

1010
Modal Emissions
MOBILE6.2 rates based on aggregate driving cycles
MOVES rates based on “operating modes”– Second-by-second activity is captured by the model
(does not need to be provided by users, but can be)

1111
MOVES will be largely shaped by data collected since release of MOBILE6
Activity– In-use vehicle trip patterns– Rural area activity data
Light-duty vehicles– Assessed millions of light-duty vehicles– Landmark gasoline PM study (Kansas City)– Remote Sensing Data
Heavy-duty vehicles– More than 100 in-use vehicles from WVU (E-55 plus)– New on-board real-world driving data from over 300
vehicles

MOVES versions and schedule

13
What have we done so far?
Released Draft MOVES2004 (1/2005)– Includes energy consumption, greenhouse gases
Released MOVES Demo (5/2007)– Basic structure of MOVES without criteria pollutant emission
factors– Received and responded to comments on model function from
several states
Previewed details of MOVES to FACA group– Briefed stakeholders on MOVES details over several meetings
of MOVES Review Workgroup since May 2007– NACAA reps: Mike Sheehan (NY), Chris Bovee (WI)

1414
Draft MOVES2009
Developing Draft MOVES2009 for release at end of March 2009
– Adding criteria pollutant emission factor databases– Adding more features to simplify regional and project-level
analysis for SIPs and conformity Will be a draft model
– No official use requiring Draft MOVES2009– Cannot be used for SIPs or conformity analyses– Followed by public review, training, and EPA guidance
development– May not include all data or features planned for official
MOVES2009

1515
New Features in Draft MOVES2009
Improving modeling of different domain sizes– Adding GUI for county level (nonattainment area) and project
level analysis to allow users to specify local inputs
Developing data importers which will:– Allow input of data as Excel files– Ease conversion of MOBILE inputs to MOVES inputs
Result - Adding detailed local input data is much simpler in Draft MOVES2009 than in MOVES Demo

16
Official MOVES2009
Official MOVES2009 planned for release at end of 2009– Essential to allow states to use in next round of SIPs (due 2012 and
2013) Will be official emissions model for on-road vehicles outside
of California Use will be required for:
– State Implementation Plans (SIPs)– Regional conformity analysis
Following regional conformity grace period of 3 to 24 months
– Project level conformity analysis for PM and CO Following project level conformity grace period which could be shorter
than regional conformity grace period
– NEPA analysis (e.g., air toxics)

Early Draft MOVES2009 Results

18
Early Draft MOVES Results
Data collected since MOBILE6 released drives differences between MOVES and MOBILE6
National trends– HC and CO emissions similar or lower than MOBILE6.2– Total NOx emissions moderately higher than MOBILE6.2– Total PM emissions substantially higher than MOBILE6.2
Local results may vary– Local fleet mix, fuels, activity are important– Temperature drives PM emissions
For attainment analysis, relative change in emissions between base year and attainment year is more important than absolute emissions

19
Analysis of Local Area Impacts
Did preliminary comparison of MOVES and MOBILE6 using surrogate local data to represent 3 different urban counties
– Local data very limited, may not be consistent with what states will actually use
Local data varied by:– Fleet age distribution– Fraction of light and heavy duty VMT– Local fuel specifications– Meteorology– Other input factors
Working with New York, Wisconsin, Georgia, Utah to develop real local area comparisons with current, detailed local data
– Results available later this month

NOx
I/M program data shows MOBILE6 underestimated NOx emissions from light trucks
On-road data on heavy trucks shows higher emissions than MOBILE6 estimated from cert data
Extended idle emissions become significant share of heavy-duty inventory in future
City B - NOx
0
5000
10000
15000
20000
25000
30000
35000
40000
2008 2015 2020
An
nu
al T
on
s
M O VES
M O VES
M O VES
M 6
M 6
M 6
H D
H D
LDLD
Extended Idle=34%
City A - NO x
0
10000
20000
30000
40000
50000
60000
70000
80000
90000
2008 2015 2020
An
nu
al T
on
s
M O VES
M O VES
M O VES
M 6
M 6
M 6
H D
H D
LDLD
City C - NOx
0
5000
10000
15000
20000
25000
2008 2015 2020
An
nu
al T
on
s
M O VES
M O VES
M O VES
M 6
M 6
M 6
H D
H D
LDLD

HC
I/M program data shows MOBILE6 overestimated HC emissions from newer technology cars
Evaporative emissions on newer technology vehicles very low; re-evaluating leak emissions for final model
City B - HC
0
2000
4000
6000
8000
10000
12000
14000
16000
2008 2015 2020
An
nu
al T
on
s
M O VES
M O VES
M O VES
M 6
M 6
M 6
H D H D
LD LD
City A - HC
0
10000
20000
30000
40000
50000
60000
2008 2015 2020
An
nu
al T
on
s
M 6
M 6M 6
M O VES
M O VES
M O VES
H D
H D
LD LD
City C - HC
0
2000
4000
6000
8000
10000
12000
2008 2015 2020
An
nu
al T
on
s
M O VES
M O VES
M O VES M 6
M 6
M 6
LDLD
H DH D

PM2.5
Kansas City program found high gas PM emissions esp. at cold temps
New data on heavy trucks shows higher deterioration than MOBILE6
MOVES accounts for impact of vehicle speed – MOBILE did not
City B - PM 2.5
0
300
600
900
1200
1500
2008 2015 2020
An
nu
al T
on
s
M O VE
M O VE
M O VES
M 6M 6
M 6
HD
HD
LDLD
C ity A - PM 2.5
0
1000
2000
3000
4000
2008 2015 2020
An
nu
al T
on
s
M O VES
M O VES
M O VES
M 6M 6
M 6
H D
H D
LDLD
C ity C - P M 2.5
0
150
300
450
600
2008 2015 2020
An
nu
al T
on
s
M O VE
M O VE
M O VE
M 6M 6M 6
H D
H D
LDLD

Percent Reduction in On-Road Emissions 2008 to 2015
MOVES MOBILE6 MOVES MOBILE6 MOVES MOBILE6HC 50% 50% 39% 32% 38% 31%
NOx 54% 56% 40% 52% 36% 53%PM2.5 57% 40% 52% 40% 38% 23%
City A City B City C

24
What It Means
Higher NOx and PM emissions mean mobile sources have bigger role in attainment
Percent reduction from base year is key to attainment analysis
– PM2.5 shows higher overall emissions and higher % reductions Effect on attainment demonstrations could be positive
– NOx shows higher overall emissions but lower % reduction Harder to show attainment Future NOx control measures will have a bigger impact
States may need to redo some motor vehicle emissions budgets to meet conformity requirements with MOVES

25
I/M Effects In MOVES
Benefits are comparable to MOBILE6 now, but will shrink over time.
– Conservative M6 OBD assumptions not supported by data CRC did comprehensive survey of MIL response in non-I/M areas Found high response even after warranty
– Our analysis of I/M program data confirms that OBD works
26
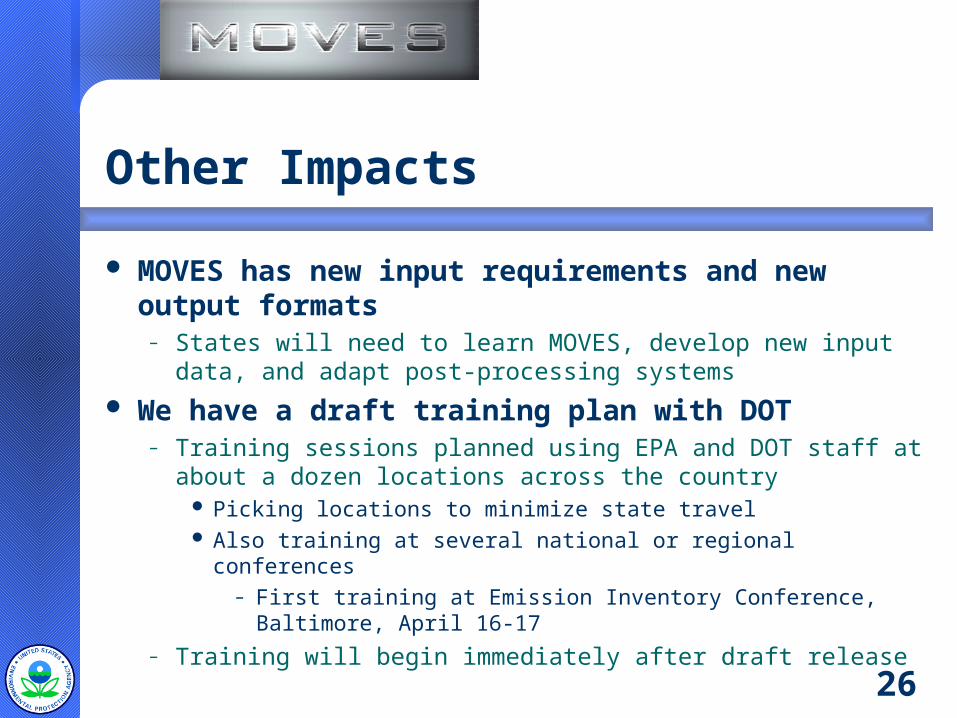
Other Impacts
MOVES has new input requirements and new output formats
– States will need to learn MOVES, develop new input data, and adapt post-processing systems
We have a draft training plan with DOT– Training sessions planned using EPA and DOT staff at about a
dozen locations across the country Picking locations to minimize state travel Also training at several national or regional conferences
– First training at Emission Inventory Conference, Baltimore, April 16-17
– Training will begin immediately after draft release

Next steps

28
Future Guidance Documents
EPA expects to release several guidance documents that will help with the transition for final MOVES
– MOVES Technical Guidance for SIPs and conformity– Project Level Conformity Guidance for PM– MOVES SIP and Conformity Policy Guidance
Will release draft guidance for comment sometime after release of Draft MOVES2009
Final guidance documents will be available when Official MOVES2009 is released

2929
What Should You Do Now?
Plan to attend MOVES training events after release of Draft MOVES2009
Provide feedback on Draft MOVES2009– Early feedback gives more time to make revisions
Update computer hardware– Dual-core processor (faster is better)– At least 1 GB memory (more is better)– At least 40 GB storage (more is better, output files can be very large )– Consider setting up a distributive network (specs of “master”
computer are key)– Windows XP or 32-bit Vista
Current version of MySQL does not work on 64-bit Vista
3030
What Should You Do Now?
Build staff expertise in relational databases and MYSQL
– Not needed for simple runs– Some basic knowledge gives users flexibility to customize
outputs and view inputs– In-house expert would be helpful for more advanced analysis
Subscribe to MOBILENEWS email list for MOVES updates
http://www.epa.gov/otaq/models/mobilelist.htm

3131
Feedback
We need your comments and ideas for improving MOVES
Comment Period:– Begins when Draft MOVES2009 is released– Comments are most effective when obtained early
Send an email to [email protected]

3232
Visit the MOVES website:http://www.epa.gov/otaq/ngm.htm
Software, technical documentation, conference and meeting presentations, and other helpful background materials