Embed Size (px)
Citation preview
Paper submitted to International Journal of Computer Integrated Manufacturing
Tooling Cost Estimation driven by Part, Mould and Method design
and its application for Design to Cost of Cast Products
Durgesh Joshi
Reader, Dept. of Industrial and Production Engineering,
SGS Institute of Technology and Science Indore
Dr. B Ravi
Professor, Dept. of Mechanical Engineering,
Indian Institute of Technology Bombay
ABSTRACT
In the present change driven environment, cost is determined by the competition. Hence, it
has become necessary to determine cost of new product early during the design stage. Tooling
cost is the major component of the fixed cost for new product development and is often
determined based on past experience. In this work the tooling cost is estimated by performing
regression analysis on 150 tooling pertaining to 50 cast parts of varying size and complexity.
Parameters considered for cost estimation are volume ratio, thickness ratio, flat surface ratio,
curved surface ratio, control dimensions, accuracy and surface finish. An integrated
framework for Design to Cost is proposed in this paper. In this framework solid model of cast
part is taken as input along with metal and process data. Automated parting surface selection,
along with simulation of feeding and gating system is performed to ensure optimal mould,
and method design. Part and mould design generate the basic form of the tooling. Additional
features are added on this basic form by method design to complete the tool design.
Parameters required for tooling cost estimation are computed from the solid model of the tool
design and cost of tooling is determined in advance at the design stage.
1. INTRODUCTION
Early cost estimation employing design to cost techniques translates into larger profits
because the cost reduction advantage starts from the first unit. It also enables companies to
deploy R&D resources for more innovative ideas, instead of modifying existing designs to
reduce costs (Davila and Wouters 2004). Also managing the cost during development stage –
while the design is still fluid – is usually easier and cheaper than after the product is

introduced. Target costing is the most popular Design to Cost technique. The target costing
process begins by establishing a selling price, based on market research, for the new product.
From this target selling price, the desired (target) profit is subtracted to determine the target
cost. In all likelihood, this target is below the company‟s current manufacturing cost. Teams
from many departments then perform functional cost analysis in an attempt to meet the target
cost. If the current cost estimate is at the target, or above the target, functional cost analysis is
used to make changes and prepare another cost estimate (Gagne and Discenza 1995).
Functional cost analysis requires a framework that relates the cost drivers and cost modifiers
to the geometry, quality and process parameters. This work focuses on development of such
framework for new products made by sand casting process. The total cost of a sand cast
product comprises of tooling cost, cost of metal, cost of indirect material, cost of processing,
cost of melting and cost of machining. The cost of tooling (patterns and core boxes) is
amortized over the number of castings produced, and can be a significant proportion of the
casting cost, especially when the order quantity is low. Research in casting cost estimation is
primarily focused on process and material selection to facilitate quotations. Traditionally in
industry especially small and medium enterprises (SMEs), tooling cost estimation is done
primarily by weight calculation. Some efforts have been made by researchers for estimating
the tooling cost on the basis of product complexity. We present a new approach to estimate
the tooling cost based on geometry parameters and quality parameters of existing tooling. The
geometric parameters considered are volume ratio, thickness ratio, flat surface ratio, and
curved surface ratio. The quality parameters considered are control dimensions and accuracy.
Tooling cost can be obtained for new product under development. Other costs are added to
tooling cost to facilitate functional cost analysis
2. LITERATURE REVIEW
A significant portion of profit that the product generates over its life is determined before the
product reaches to the market (Davila and Wouters 2004). During the product development
stage, the organization designs the features that (1) give the product an edge over competition
and (2) affect the cost that will shape the profit margins. Product design significantly affects
the revenue side - technological performance, customer appeal and timely market introduction
- before the first unit is sold. The cost side follows a similar pattern as a rule of thumb 80% of
the costs are engineered in, during the product development. Thus managing cost at the
product development stage emerges as important process to increase the profitability of future
products. Target costing is the most popular Design to Cost technique.
2.1 Design to Cost
Target costing was invented by Toyota in 1965 (Gagne and Discenza 1995). The target
costing process begins by establishing a selling price, based on market research, for the new
product. From this target selling price, the desired (target) profit is subtracted to determine the
target cost. In all likelihood, this target is below the company‟s current manufacturing cost.
Teams from many departments then perform functional cost analysis in an attempt to reach
the target cost. If the current cost estimate is at the target, the firm must decide whether or not
to introduce the new product. If the current cost estimate is above the target, functional cost
analysis is used to make changes and prepare another cost estimate. Bayou and Reinstein
(1998) presented three routes of target costing these are (1) Value Engineering: VE refers to
cost improvements through basic functional changes in product development stage VE is
conducted before mass production of model begins. (2) Cost Improvement: Cost improvement
refers to cost development by employing a structure that connects costing, pricing, market
share, normal profit margin and long term investment into a unified whole. This structure is
called Total cost management (TCM). The basic structure of cost development includes the
strategies for comprehensiveness, integration, flexibility, dynamic and long term continuity.
(3) Cost Cutting and Cost Shifting: Cost cutting entails slashing cost without going through
TCM. Thus the decision to reduce the last years cost by 20% is a cost cutting judgment. Cost
cutting refers to, decreasing the avoidable inefficiencies. To reduce unavoidable inefficiencies
redesigning or restructuring the production may be necessary. Cost shifting differs from cost
cutting in that it aims at reducing the cost even by decreasing the unavoidable inefficiencies.
Some ways of decreasing unavoidable inefficiencies can be: the manufacturer replaces the
current supervisor, leased or owned equipment and facilities, insurance policies or insures
with ones requiring less fixed expenditures. Variable cost items are decreased in quality also,
for example, by switching to cheaper raw material, less skilled hourly labor and less
expensive maintenance and repair supplies. For the cost iterations with above approaches it is
required to develop functional cost analysis models. These cost models must be complete and
must relate the cost drivers and cost modifiers with parameters related to geometry, process,
and quality. The existing models of cost estimation of cast products are presented as under
2.2 Casting cost estimation

The major cost elements of a casting cost such as material, labor, energy, tooling and
overheads have been identified by early researchers (Chronister, 1975; Jain, 1987; Kulkarni,
1988). The material cost includes metal cost (actual cost of metal and alloys), and indirect
material cost (dispensable mold material, fluxes, sleeves, filters, chills, etc.). Metal casting is
an energy intensive process requiring large amount of energy for different activities,
dominated by melting. The tooling cost covers the cost of pattern/die and core boxes. The
overheads include expenses for equipment usages, supervisory staff, inspection staff and
administrative staff. The other costs include transportation, taxes, and premium (such as for
special inspection and just in time delivery). The other elements that have a significant
impact on the casting cost are productivity, yield and defects. The productivity varies
depending on the equipment used. The yield of a foundry is defined as the percentage output
of castings per kg of input to the melting unit. On the other hand, casting yield gives an
indication of additional metal (for gating and feeding system) melted and poured for getting a
casting. The defect level in foundries may range from 2 to 20 percentage during regular
production.
Cost models have been proposed by identifying and calculating the detailed cost elements.
Ajmel developed a computer aided process planning and cost estimating system (Ajmel and
Dale, 1990). It has an interactive data base system in which data was fed by the user. The
system had different modules to estimate volume and weight, density and cost per unit
weight, labor time, labor and material cost. Similar cost model are also reported by Creese et
al., 1992; Creese and Rao, 1995. These systems are meant for cost estimation at the
manufacturing stage and it did not have any facility to perform „what if‟ analysis to study the
effect of change in design on cost. The DFMA (Design for Manufacture and Assembly)
software has a detailed casting cost estimation module aimed at product designers (Boothroyd
and Dewhurst Inc., 2003). It however, requires a considerable amount of interactive input
about the process, such as the time required for each activity and the corresponding labor rate.
It does not consider the effect of two key parameters that significantly affect casting cost:
internal quality requirement (which depends on the end application) and yield (which varies
with casting geometry, metal and process).
2.3 Tooling cost estimation
The cost of tooling (pattern, core box, mold, etc.) is amortized over the number of castings
produced, and can be a significant proportion of the casting cost, especially when the order
quantity is low. Considerable efforts have been made in tooling cost estimation for injection
moulding and pressure die casting (Lowe, et al. 1985; Chin, et al. 1996; Sundaram, et al.
1999; Smith, 1999; Duverlie, et al. 1999; Naganumiah and Ravi, 2005). Even though, sand
casting process produces 90% of total casting by weight as per 41st Census of casting
production (MCS, 2005), less work has been reported for tooling cost estimation for sand
casting process. A parametric equation for tooling cost, driven by volume, shape complexity
of part and accuracy alone has been developed employing regression analysis for sand cast
parts (Chougule and Ravi, 2006). Shape complexity has been considered in their equation
based on part geometry alone. In practice, tooling geometry is determined by combination of
part design, mould design and method design.
There appears need for developing a cost model that can evaluate tooling cost while
performing iterations with mould design, gating design and feeding design. Such a cost model
in conjunction with standard cost element can be utilized for early cost estimation of sand cast
products. In practice, many foundries and their customers still estimate cost based on
component weight, corrected for the expected level of production difficulties, scrap and yield.
The weight based method involves accounting all expenses (material, energy, labor, etc.) and
total weight of saleable castings produced, during a predetermined period. Based on this data,
the average rate of castings per kg is calculated, and is used for calculating the cost of new
castings based on their weight. The method works well in mass production foundries making
castings of similar characteristics, but is not suitable for job shop or batch type foundries that
have a wide range of products. Each foundry usually specializes in a particular process (such
as green sand casting, investment casting or gravity die casting), focusing on a narrow range
of metals (either ferrous or non-ferrous) and applications (in terms of size/weight and
geometric complexity). It may have a unique combination of equipment, automation level,
worker skill and past experience. The tooling (patterns, core boxes, molds) and methoding or
rigging (feeding and gating systems), which greatly affect casting quality and yield, are
designed in different ways based on knowledge gained from previous projects. These factors
lead to significant variations in manufacturing cost among different foundries. Ironically,
most foundries do not maintain detailed cost data, making it difficult to establish the
profitability of specific casting projects. This is becoming critical in the light of increasing
pressure from original equipment manufacturers to reduce casting prices on a continuous
basis.

3. TOOLING COST ESTIMATION
Mould design establishes the parting surface that in turn determines the mould segments.
Optimal mould design implies minimum mould division with minimum complexity and
maximum conformance resulting in greater economy due to reduced tooling cost and higher
yield. The mould segments can be one of the following types (1) Mould segments that
represent the external shape of the cast product (2) Mould segments that represent the internal
cavities or hollow portions or undercut features of cast product (cored features) (3) Mould
segments added due to methoding.
{Add figure for tooling design and explain the same}
Mould division determines the number of mould segments and their complexity. More
number of mould segments are not desirable as each mould segment require separate tooling
and with increasing number of mould segments, mould assembly requires more time also
possibilities of flash and mould segments‟ mismatch increases. The cavity generated by the
assemblage of these mould segments is the cast part. A more complex mould segment
requires more steps in producing the tooling as well as costly machining operations of surface
(freeform) machining of convex or concave pockets. A mould segment whose tooling requires
only plane surface machining and cylindrical surface machining results in better economy.
Thus more the complexity of mould segments higher will be tooling cost.
3.1 Tooling Element Cost
Each of the mould segments requires a corresponding tooling element. Total tooling cost is
the summation of individual tooling elements cost. Tooling element cost has two components,
material cost and manufacturing cost (machining cost). Material cost is dependent on order
quantity and accuracy. Total tooling manufacturing cost depends on number of tooling
elements and their volume as well as complexity and accuracy of individual tooling element
3.2 Estimation of manufacturing cost for a tooling element
Cost of a tooling element depends on volume, complexity, accuracy and material.
Tooling element manufacturing cost = f (volume, complexity, material) (1)
Complexity of a tooling element is evaluated by comparing its machining cost with respect to
simple shapes as cubes or spheres. Geometry that has higher variation in section thickness,
larger surface area, less volume as compared to the volume of bounding box, smaller

orthogonal surface area, larger free form surface area, results in higher machining cost. Also
tooling with convex shape will be more costly as compared to concave shape. Thus, cost of a
tooling element depends on volume, complexity, accuracy and material.
Complexity = f (Vr, tr,, Acurved, Aortho, Ncd , Ql) (2)
Vr Volume ratio = volume of bounding box / volume of part contained by the tooling
Tr Thickness ratio = Max. thickness / min. thickness
Acurved Curved SA ratio = total SA / Curved SA
Aortho Orthogonal SA ratio = total SA / Orthogonal SA
Ncd No of controlled dimensions and surfaces
Ql Accuracy required
Tooling element manufacturing cost
TEcost= W1 + W2Vr+W3tr+ W4Vcurved+ W5Aortho + W6Ncd + W7Ql (3)
The above eight interdependent parameters can be obtained from a CAD model of the tooling
element. The weights for the above can be determined by regression analysis.
Ctooling = 1/N. ( n
i miiTEi
n
iCV ..TE
costi ) (4)
Ctooling Cost of tooling
N Order Quantity
n Number of tooling elements
costiTE Tooling element cost
VTEi Volume of tooling element
i Density of tooling material
Cmi Cost of tooling material
3.3 Regression analysis for tooling cost estimation
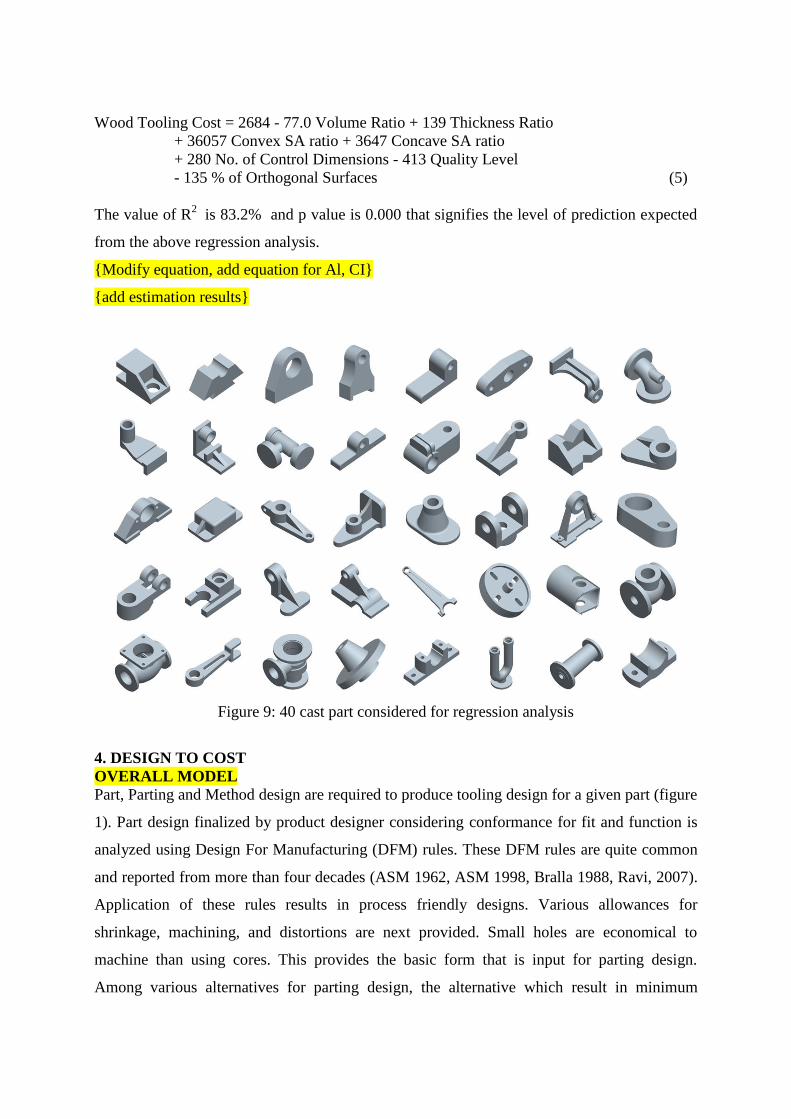
The above parameters are computed for 40 parts (figure 1) resulting in 102 tooling elements.
Seven parameters, Volume ratio, Thickness ratio, Curved SA ratio, Orthogonal SA, No of
control dimensions, and Quality level are compiled for these 102 tooling (Appendix I). Cost
data for manufacturing of wooden tooling is obtained by tooling experts. Regression is
performed using Mintab statistical analysis software. The regression equation obtained is as
follows.
Wood Tooling Cost = 2684 - 77.0 Volume Ratio + 139 Thickness Ratio
+ 36057 Convex SA ratio + 3647 Concave SA ratio
+ 280 No. of Control Dimensions - 413 Quality Level
- 135 % of Orthogonal Surfaces (5)
The value of R2
is 83.2% and p value is 0.000 that signifies the level of prediction expected
from the above regression analysis.
{Modify equation, add equation for Al, CI}
{add estimation results}
Figure 9: 40 cast part considered for regression analysis
4. DESIGN TO COST
OVERALL MODEL
Part, Parting and Method design are required to produce tooling design for a given part (figure
1). Part design finalized by product designer considering conformance for fit and function is
analyzed using Design For Manufacturing (DFM) rules. These DFM rules are quite common
and reported from more than four decades (ASM 1962, ASM 1998, Bralla 1988, Ravi, 2007).
Application of these rules results in process friendly designs. Various allowances for
shrinkage, machining, and distortions are next provided. Small holes are economical to
machine than using cores. This provides the basic form that is input for parting design.
Among various alternatives for parting design, the alternative which result in minimum

number and complexity of tooling elements as well as minimum draw distance is the optimal
one. Optimal feeding design ensures casting free from hot posts during solidification with
maximum feeder yield. Similarly optimal gating design ensures smooth, uniform and
complete filling while maximizing gating yield. Criteria for optimal part design, parting
design, feeding design and gating design have been reported by Ravi and Srinivasan (1995)
and Ravi et al (2007). Here we present in brief about mould design, feeding design and gating
design.
{Add new framework, discuss}
Figure 1: Methodology for tool design
3.1 Mould design
Optimal mould design implies the minimum number and complexity of mould elements to
create the casting cavity closest to the desired geometry.
Non planer parting surface, complex mould elements more number and volume of cored and
undercut features result in more costly tooling hence mouldability is directly associated with
tooling cost. A parting surface which results in more draw distance decreases the casting yield
(figure 2). Higher mouldability is necessary for better economy of cast product. Figure depicts
the various options of parting plane for a given cast geometry. Option „A‟ results in more
number of undercut / core features while option „C‟ results in less undercut volume with non

planer parting plane and increased draw distance. Option „B‟ can be considered best as it
results in flat parting plane, minimum undercuts, with minimum draw distance.
Figure 2: Part orientation effect on mould design
3.2 Gating design
Optimal gating design implies smooth, uniform and complete filling of mould cavity with
molten metal.
The flow of molten metal after being poured is a transient phenomenon accompanied by
turbulence, splashing, separation of streams near change of sections, branching off and
rejoining of streams, and the onset of solidification. Two major characteristics of flow in
casting is fluidity and turbulence. Lack of fluidity results in defects like misrun and cold shut
while higher turbulence results in gas and air entrapment as well as can cause slag and sand
inclusions.
3.3 Feeding design
Optimal feeding design implies every location inside a casting receives feed metal (from a
neighbouring location) to compensate for solidification shrinkage.
The temperature history of a location inside the casting with respect to the neighbouring
locations governs the formation of hot spots in casting. A hot spot in a casting will solidify
last and will eventually result in shrinkage cavity. This can be avoided by attaching a feeder
designed to solidify later than the hot spot. A modest 4% volumetric shrinkage in a Short
freezing range alloy can cause a cavity of size d/3 in a cube of size d in case of no feeders. It

is not only important to have feeders of necessary volume, it is equally important to locate
them so that they keep supplying liquid metal to last solidifying regions.
4. AUTOMATED PARTING AND METHOD DESIGN
CASE STUDY FOR PARTS FOR SIMULATION AND APPLYING TARGET
COSTING
BRACKET CASTING
PORWAL PART
The method design and casting simulation is carried out using AutoCAST (r) software
program (Ravi and Srinivasan, 1999). The main inputs include: part model, casting alloy, and
process. Method design involves three major tasks: (i) parting, mould and core design, (ii)
feeder and feedaid design, and (iii) gating system design. Process simulation includes mould
filling and casting solidification.
The parting line is generated to minimise undercuts and draw distance (Ravi and Srinivasan,
1990). The mould size is selected to provide sufficient gap around the casting cavity. Holes
are automatically recognised, and the corresponding cores (along with support) are designed
to minimise failure by distortion and other modes. Figure 3 shows a casting (valve body) and
its STL representation. The STL file is input to the AutoCAST software. The parting design
and core design are shown in figure 4.
Figure 3: Model of valve body and its STL representation

Figure 4: Parting design and core design
Feeder design mainly involves decisions regarding the number, location, shape and
dimensions of feeders and feed-aids. Automated feeder design uses geometric reasoning to
suggest the best location of feeder (closest to the hot spot, on a flat surface at the top or side,
preferably a thick section to facilitate fettling). Its dimensions are calculated based on
geometric modulus of the region surrounding the hot spot. Based on the dimensions, the
feeder model is created and attached to the casting through an appropriately sized neck. The
user may modify the dimensions of the feeder and model it again, and add more feeders, if
necessary. Feed-aids such as insulating and exothermic sleeves and covers, and chills are also
semi-automatically designed and modelled in a similar manner (figure 5).
Figure 5: Feeder design and cooling map
Casting solidification is simulated using the Vector Element Method, which traces the feed
metal paths in reverse to pinpoint the location of hot spots (Ravi, and Srinivasan, 1996) It is
based on the principle that the direction of the highest temperature gradient (feed metal path)
at any point inside the casting is given by the vector sum of individual thermal flux vectors in
all directions around the point. Multiple hot spots, if present, are detected by starting from

several directions. Ideal feeding implies that the feed paths connect and converge inside a
feeder.
Gating system design includes deciding the number and location of gates, and designing the
choke so that the mould fills in a predetermined range of time (Ravi, 1997). The gate
locations are suggested at thick sections along the parting line that have low free fall height
and fewer obstructions (such as cores blocking the path of metal emerging from an ingate).
The program determines ideal filling time (function of casting weight, section thickness and
fluidity), followed by choke velocity (based on metallostatic head), and choke area (using the
gating ratio). Other process parameters are determined by comparing with similar previous
projects (Chougule et al 2004).
The mould filling is simulated to determine the actual fill time and velocity of metal at
different locations (figure 3.6). It uses a layer-by-layer filling algorithm that considers the
instantaneous velocity of metal through the gates (which depends on the head), and the area of
casting cross-section being filled up. Part property, parting and core design, feeding design,
gating design, and pouring data are presented in table 1, table 2, table 3, table 4, and table 5
respectively.
Figure 6: Gating design and mould filling simulation
Table 1: Part Properties
Cast Metal Surface Area
(mm2)
Volume (mm3)
[Bounding box size] Weight (Kg)
Cast Iron 784639 1802656
[375*290*270] 12.7
Table 2: Parting and core design
No. of Cores Under Cut
Volume (mm3)
Mould Box Size Match Plate Size
1 8932799 600*450*400 800*600

Table 3: Feeding design No. of
Feeders
Feeder Size
L/D
Feeder Weight
(Kg)
Hot Spot in
Feeder
Feeder Yield
(%)
4 90/60 4 Yes 74.8
Table 4: Gating design
No. of
In-gates
Gating
Weight
(Kg)
Gating
Yield (%) Gating Ratio
Choke
Area
(mm2)
In-gate
Cross
Section
Runner
Cross
Section
Fill
time
(secs)
Max.
Velocity
(m/s)
1 1.8 87.8 1.00:1.42:1.29 85 20*13 15*19 21.3 21.3
Table 5: Pouring data
5. TOOLING DESIGN
Application of parting design and method design results in tooling design. For the valve body
part under consideration the tooling required would be (1) pattern for cope (2) pattern for
drag, and (3) core box for the hollow cavity. These are shown in figure 7 and 8.
Figure 7: Pattern for cope and drag for valve body
Figure 8: Lower core box for valve body.
Pouring Time
(sec.)
Pouring Rate
(Kg/sec.)
Pouring Temp.
(Cel.)
5.8 2.2 1324

7.0 CONCLUSION
Parting design and method design along with part design determine the tooling design. Parting
design determines the number of tooling elements and complexity of individual tooling.
Feeding design determines the feeder layout that adds to volume and complexity of the
tooling. Similarly gating design also contributes to the tool design. In this work optimal
tooling design methodology was discussed with an example. Seven parameters, volume ratio,
thickness ratio, convex SA ratio, concave SA ratio, orthogonal SA, no of control dimensions,
and quality level were complied for 102 tooling elements belonging to 40 cast parts. The
regression equation thus obtained can be used for estimation of tooling cost.
REFERENCES
ASM 1962, Casting Design Handbook, American Society of Metals
AutoCAST user guide, Advanced Reasoning Technologies, 2007
Bidanda B, Kadidal M, Billo R, “Development of an Intelligent Castability and Cost Estimation
System,” International Journal of Production Research, Vol. 36, No. 2, pp. 547–568, (1998).
Boothroyd and Dewhurst Inc., “Design for Manufacture Concurrent Costing Software – User
Manual, Boothroyd and Dewhurst Inc: RI, (2003).
Bralla J, “Handbook of Product Design for Manufacturing.” McGraw-Hill Book Company, New
York, (1988).
Chen Yuh-Min, and Liu Jang-Jong, “Cost effective design for injection molding,” Robotics and
Computer Integrated Manufacturing, Vol. 15, pp. 1-21, 1999.
Chin, K.S. and Wong, T.N., “Developing a knowledge based injection mold cost estimation
system by decision tables,” International Journal of Advanced Manufacturing Technology,
Vol. 11, No. 5, pp. 353-365, 1996.
Chougule, R.G. and Ravi, B., “Casting cost estimation in an integrated product and
process design environment”, International Journal of Computer Integrated
Manufacturing, Vol. 19, No. 7, pp.676-688, 2006.
Chougule R G, Jalan M K and Ravi B, Casting Knowledge Management for Concurrent Casting
Product Process Design, Transactions of the AFS, 112, 2004, pp 105-114.
Creese R, Rao A, “Scrap vs. Profitability,” Modern Casting, August 1995, pp. 38-41, (1995).
Creese R, Adithan M, Pabla B, “Estimating and Costing for the Metal Manufacturing Industry,”
Cost Engineering Series, Volume 18, Marcel Dekker Inc., pp. 1-5, (1992).

Duverlie, P.J. and Castelain, M., “Cost estimation during design step: parametric method versus
case based reasoning method,” International Journal of Advanced Manufacturing
Technology, Vol. 15, pp. 895-906, 1999.
Lowe, P.H. and Walshe, K.B.A., “Computer aided tool cost estimating: an evaluation of the
labor content of injection molds,” International Journal of Production Research, Vol. 23, No.
2, pp. 371-380, 1985.
Nagahanumaiah, Ravi, B., and Mukherjee, N.P., “Rapid tooling manufacturability evaluation
using Fuzzy-AHP methodology,” International Journal of Production Research, submitted in
May 2005
Sundaram, M. and Masleka,r D. “A regression model for mold cost estimation,” Proceedings of
8th Industrial Engineering Research Conference, Phoenix, Arizona, 1999
Ravi B, Intelligent Design of Gating Channels for Casting, Materials Science and
Technology, 13, No. 9, 1997, pp 785-790.
Ravi, B., 2007, Metal Casting-computer aided design and analysis, Prentice Hall India
Smith, C.S. “The Manufacturing Advisory Service: Web based process and material selection,”
Ph.D. Thesis, University of California, Berkeley, Spring 1999.
Ravi B, Creese, R C, and Ramesh, D, “Design for Casting - A New Paradigm for Preventing
Potential Problems”, AFS Transactions, vol. 107, p197-202, (1999)
Ravi, B, Srinivasan M. N., "Casting solidification analysis by modulus vector method", Int. J.
Cast Metals Res., vol. 9, p1-7 (1996)
Ravi, B, Srinivasan M. N., "Feature based Castability Evaluation", Int. J. Prodn. Res., vol. 22,
p3367-3380 (1995)
Ravi, B., Srinivasan, M. N., "Decision criteria for computer-aided parting surface design",
Computer Aided Design, vol. 22 No jan/feb, 1990, p11-1
ASM Metal Handbook Volume 15 Casting, American Society of Metals (1998)
B Ravi, Durgesh Joshi, Rahul Chougule, 2005, Survey of Computer Applications in Indian
Foundry Industry: Benefits and Concerns, proceedings of 53rd
Indian Foundry Congress,
Kolkata, January 2005

APPENDIX
Regression data
S.
No.
Volume
Ratio
Thickness
Ratio
Convex
SA
ratio
Concave
SA ratio
% of
Orthogonal
Surfaces
No. of
Control
Dimensions
Quality
Level
Wood
Tooling
Cost
(Rs)
1 6.266 4.000 0.075 0.000 37.13 7 2 747.16
2 6.277 4.000 0.074 0.000 37.44 6 2 747.16
3 1.186 6.000 0.000 0.110 21.36 3 2 347.95
4 1.213 5.000 0.000 0.119 21.29 2 1 140.28
5 10.004 1.000 0.099 0.000 43.33 12 3 2929.16
6 10.038 1.000 0.100 0.000 43.48 11 3 2929.16
7 1.763 6.000 0.000 0.194 19.20 2 3 313.97
8 1.122 2.750 0.000 0.116 20.95 2 3 330.97
9 6.646 1.000 0.075 0.000 38.20 8 3 1965.60
10 1.472 3.500 0.000 0.226 25.12 2 3 276.86
11 6.343 2.000 0.081 0.000 44.02 16 3 903.90
12 6.394 2.000 0.085 0.000 44.51 14 3 903.90
13 1.288 3.000 0.000 0.202 24.16 2 3 92.03
14 1.297 2.500 0.000 0.163 24.90 2 3 108.82
15 3.659 1.000 0.065 0.000 41.41 11 2 615.62
16 3.672 1.000 0.061 0.000 41.74 10 2 615.62
17 1.595 2.760 0.000 0.250 24.71 2 2 100.15
18 3.798 1.000 0.089 0.000 37.41 9 3 562.95
19 3.803 1.000 0.084 0.000 37.53 8 3 562.95
20 1.410 2.456 0.000 0.219 25.05 2 3 92.24
21 4.174 4.750 0.072 0.000 38.10 8 1 604.82
22 1.355 2.456 0.000 0.183 23.27 2 1 78.83
23 3.467 2.000 0.055 0.000 38.57 9 1 853.42
24 1.408 3.000 0.000 0.222 28.14 2 1 2469.19
25 6.863 3.000 0.152 0.000 32.69 10 1 4416.26
26 6.949 3.000 0.133 0.000 32.93 9 1 4416.26
27 5.025 3.800 0.060 0.007 40.19 7 1 2785.07
28 5.678 3.800 0.076 0.006 36.84 6 1 2812.60
29 1.301 2.600 0.000 0.187 24.85 2 1 78.70
30 5.341 1.000 0.090 0.000 40.88 4 1 809.53
31 1.563 4.933 0.000 0.224 19.18 3 2 397.95
32 9.041 1.000 0.078 0.000 33.70 12 2 1355.85
33 10.595 1.000 0.086 0.000 33.84 11 2 1355.85
34 1.214 2.750 0.000 0.145 23.62 5 2 1575.42
35 1.253 1.000 0.000 0.155 23.01 2 3 78.72
36 1.361 1.000 0.000 0.200 22.63 2 3 120.67
37 1.221 1.000 0.000 0.172 28.49 2 3 78.57
38 12.685 7.000 0.131 0.000 38.02 10 3 1333.48
39 9.266 1.500 0.070 0.002 40.68 11 2 2761.61
40 9.369 1.500 0.062 0.002 41.01 10 2 2761.61
41 7.598 2.500 0.068 0.002 41.71 19 1 2987.72
42 7.671 2.500 0.070 0.002 42.48 18 1 2987.72
43 1.413 2.600 0.000 0.177 21.63 2 1 138.32
44 1.453 2.700 0.000 0.223 24.51 2 1 92.80
45 8.295 12.000 0.083 0.001 38.68 19 2 6182.96
46 8.558 12.000 0.062 0.001 39.73 17 2 6182.96
45 1.639 2.980 0.000 0.185 20.89 2 2 275.60
48 7.476 2.000 0.057 0.000 41.90 9 2 1216.46
49 6.169 2.000 0.120 0.000 42.58 9 2 1216.46
50 8.267 2.610 0.000 0.208 23.42 2 2 85.53
51 5.797 4.000 0.055 0.000 38.99 9 2 2104.88

Regression data (continued)
S.
No.
Volume
Ratio
Thickness
Ratio
Convex
SA
ratio
Concave
SA
ratio
% of
Orthogonal
Surfaces
No. of
Control
Dimensions
Quality
Level
Wood
Tooling
Cost
(Rs)
52 6.488 4.000 0.051 0.000 42.05 8 2 2104.88
53 1.406 2.530 0.000 0.196 23.36 2 2 79.06
54 9.166 13.000 0.149 0.000 39.05 15 3 6584.76
55 9.513 13.000 0.150 0.000 39.72 14 3 6584.76
56 5.611 3.000 0.081 0.000 37.52 15 2 1755.03
57 1.298 7.200 0.000 0.135 19.91 3 2 139.55
58 1.520 2.970 0.000 0.185 20.59 2 2 92.62
59 11.387 5.000 0.056 0.000 42.67 10 2 470.31
60 8.477 5.000 0.090 0.000 37.49 10 2 1282.43
61 1.609 2.840 0.000 0.241 23.86 2 2 119.57
62 1.609 2.840 0.000 0.241 23.86 2 2 119.57
63 1.332 2.454 0.000 0.169 22.58 2 2 78.72
64 5.595 1.000 0.106 0.000 40.34 5 2 1709.18
65 1.726 5.042 0.000 0.239 24.33 2 2 275.42
66 5.470 3.000 0.058 0.000 41.61 9 2 1694.23
67 5.478 3.000 0.060 0.000 41.79 7 2 1694.23
68 1.472 2.646 0.000 0.208 23.20 2 2 105.41
69 6.242 7.200 0.070 0.000 39.20 10 2 2458.56
70 6.264 7.200 0.066 0.000 39.58 9 2 2133.56
71 1.364 2.380 0.000 0.209 25.23 2 2 79.01
72 1.453 3.500 0.000 0.198 22.69 2 2 205.12
73 6.306 2.000 0.042 0.000 43.05 18 1 2817.83
74 6.306 2.000 0.036 0.000 43.04 16 1 2817.83
75 1.802 2.800 0.000 0.224 27.05 2 1 112.06
76 1.374 2.800 0.000 0.170 28.24 2 1 66.51
77 1.374 2.800 0.000 0.170 28.24 2 1 66.51
78 6.995 8.000 0.140 0.000 29.70 11 1 6882.72
79 7.167 8.000 0.143 0.000 30.20 6 1 6882.72
80 6.590 2.063 0.068 0.000 38.24 16 2 1794.96
81 6.624 2.063 0.068 0.000 38.60 14 2 1794.96
82 1.505 3.400 0.000 0.236 24.87 2 2 92.86
83 1.505 3.400 0.000 0.236 24.87 2 2 92.86
84 6.207 1.814 0.120 0.000 31.15 16 2 6345.61
85 6.946 1.814 0.128 0.000 31.37 14 2 5565.61
86 6.785 4.286 0.154 0.000 27.17 17 1 10278.06
87 6.783 4.286 0.155 0.000 27.21 16 1 10278.06
88 6.982 4.600 0.152 0.000 28.42 19 2 11654.50
89 7.573 3.864 0.020 0.000 41.62 11 1 2753.01
90 6.036 3.864 0.110 0.000 41.30 8 1 3143.01
91 1.237 2.500 0.000 0.192 26.88 5 1 268.43
92 5.530 1.432 0.057 0.000 39.39 18 2 3854.18
93 5.545 1.432 0.056 0.000 39.57 17 2 3854.18
94 1.124 1.700 0.000 0.090 27.25 2 2 164.60
95 1.154 1.800 0.000 0.256 27.03 2 2 106.15
96 11.195 5.250 0.062 0.000 39.54 13 2 955.53
97 11.443 5.250 0.049 0.000 40.32 12 2 955.53
98 1.312 2.600 0.000 0.195 25.28 2 2 78.78
99 7.550 2.143 0.150 0.000 30.06 15 3 7869.16
100 7.615 2.143 0.149 0.000 30.31 14 3 7869.16
101 1.334 2.500 0.000 0.227 27.21 2 2 166.04
102 1.193 2.500 0.000 0.148 27.50 2 2 166.04

ALTERNATE REGRESSION ANALYSIS
S.
No.
Volume
Ratio
Thickness
Ratio
Conve
x SA
ratio
Concave
SA ratio
% of
Orthogona
l Surfaces
No. of
Control
Dims
Quality
Level
Wood
Pattern
Cost
(Rs)
1 6.266 4.000 0.075 0.000 37.130 7 2 747.156
2 6.277 4.000 0.074 0.000 37.440 6 2 747.156
3 1.186 6.000 0.000 0.110 21.360 3 2 347.945
4 1.213 5.000 0.000 0.119 21.290 2 1 140.279
5 10.004 1.000 0.099 0.000 43.330 12 3 2929.160
6 10.038 1.000 0.100 0.000 43.480 11 3 2929.160
7 1.763 6.000 0.000 0.194 19.200 2 3 313.967
8 1.122 2.750 0.000 0.116 20.950 2 3 330.972
9 6.646 1.000 0.075 0.000 38.200 8 3 1965.600
10 1.472 3.500 0.000 0.226 25.120 2 3 276.865
11 1.288 3.000 0.000 0.202 24.160 2 3 92.033
12 1.297 2.500 0.000 0.163 24.900 2 3 108.818
13 3.672 1.000 0.061 0.000 41.740 10 2 615.615
14 1.595 2.760 0.000 0.250 24.710 2 2 100.151
15 1.410 2.456 0.000 0.219 25.050 2 3 92.239
16 1.355 2.456 0.000 0.183 23.270 2 1 78.826
17 3.467 2.000 0.055 0.000 38.570 9 1 853.424
18 6.863 3.000 0.152 0.000 32.690 10 1 4416.263
19 6.949 3.000 0.133 0.000 32.930 9 1 4416.263
20 1.301 2.600 0.000 0.187 24.850 2 1 78.698
21 5.341 1.000 0.090 0.000 40.880 4 1 809.530
22 1.563 4.933 0.000 0.224 19.180 3 2 397.946
23 10.595 1.000 0.086 0.000 33.840 11 2 1355.855
24 1.214 2.750 0.000 0.145 23.620 5 2 1575.419
25 1.253 1.000 0.000 0.155 23.010 2 3 78.723
26 1.361 1.000 0.000 0.200 22.630 2 3 120.671
27 1.221 1.000 0.000 0.172 28.490 2 3 78.574
28 9.266 1.500 0.070 0.002 40.680 11 2 2761.614
29 7.598 2.500 0.068 0.002 41.710 19 1 2987.718
30 7.671 2.500 0.070 0.002 42.480 18 1 2987.718
31 1.413 2.600 0.000 0.177 21.630 2 1 138.320
32 1.453 2.700 0.000 0.223 24.510 2 1 92.799
33 1.639 2.980 0.000 0.185 20.890 2 2 275.603
34 7.476 2.000 0.057 0.000 41.900 9 2 1216.464
35 8.267 2.610 0.000 0.208 23.420 2 2 85.532
36 5.797 4.000 0.055 0.000 38.990 9 2 2104.879
37 1.406 2.530 0.000 0.196 23.360 2 2 79.057
38 1.298 7.200 0.000 0.135 19.910 3 2 139.545
39 1.520 2.970 0.000 0.185 20.590 2 2 92.619
40 11.387 5.000 0.056 0.000 42.670 10 2 470.308
41 1.609 2.840 0.000 0.241 23.860 2 2 119.570
42 1.609 2.840 0.000 0.241 23.860 2 2 119.570
43 1.332 2.454 0.000 0.169 22.580 2 2 78.723
44 5.595 1.000 0.106 0.000 40.340 5 2 1709.175
45 1.726 5.042 0.000 0.239 24.330 2 2 275.419

46 5.470 3.000 0.058 0.000 41.610 9 2 1694.228
47 5.478 3.000 0.060 0.000 41.790 7 2 1694.228
48 1.472 2.646 0.000 0.208 23.200 2 2 105.405
49 6.242 7.200 0.070 0.000 39.200 10 2 2458.560
50 6.264 7.200 0.066 0.000 39.580 9 2 2133.560
51 1.364 2.380 0.000 0.209 25.230 2 2 79.007
52 1.453 3.500 0.000 0.198 22.690 2 2 205.119
53 6.306 2.000 0.042 0.000 43.050 18 1 2817.830
54 1.802 2.800 0.000 0.224 27.050 2 1 112.059
55 1.374 2.800 0.000 0.170 28.240 2 1 66.510
56 1.374 2.800 0.000 0.170 28.240 2 1 66.510
57 6.995 8.000 0.140 0.000 29.700 11 1 6882.720
58 6.624 2.063 0.068 0.000 38.600 14 2 1794.957
59 1.505 3.400 0.000 0.236 24.870 2 2 92.857
60 1.505 3.400 0.000 0.236 24.870 2 2 92.857
61 6.207 1.814 0.120 0.000 31.150 16 2 6345.612
62 6.946 1.814 0.128 0.000 31.370 14 2 5565.612
63 6.036 3.864 0.110 0.000 41.300 8 1 3143.010
64 1.237 2.500 0.000 0.192 26.880 5 1 268.432
65 5.530 1.432 0.057 0.000 39.390 18 2 3854.175
66 5.545 1.432 0.056 0.000 39.570 17 2 3854.175
67 1.124 1.700 0.000 0.090 27.250 2 2 164.604
68 1.154 1.800 0.000 0.256 27.030 2 2 106.151
69 11.195 5.250 0.062 0.000 39.540 13 2 955.529
70 11.443 5.250 0.049 0.000 40.320 12 2 955.529
71 1.312 2.600 0.000 0.195 25.280 2 2 78.776
72 7.550 2.143 0.150 0.000 30.060 15 3 7869.160
73 1.334 2.500 0.000 0.227 27.210 2 2 166.038
74 1.193 2.500 0.000 0.148 27.500 2 2 166.038
Wood Cost = 463 - 155 Volume Ratio + 53.6 Thickness Ratio + 37484 convex ratio
+ 3920 concave ratio + 246 No. of Control Dimensions
- 76.6 % of Orthogonal Surfaces + 163 Quality Level
Rsq= 91.7 p=0.000
Part attributes as thickness ratio, area ratio, and volume ratio influence the shape complexity.
Mould design determines the number of tooling elements and their complexity, volume of
tooling elements, volume of undercut and cored features. Method design consists of gating
design and feeding design. Gating design should ensure complete, uniform, and smooth filling
of mould cavity. Feeding design should ensure absence of isolated hot spots in casting during
solidification and uniform cooling. Gating layout, channel shape and size, and other elements
of gating system influence the tooling cost. Similarly feeder layout, feeder size and shape,
provision of feed aids increase the tooling volume and its complexity.

Thus managing cost at the product development stage emerges as important process to
increase the profitability of future products.
Table 6: Parameters for tooling cost estimation for valve body part.
Tooling Ele. V Vb Tmax Tmin SA Aconvex Aconcave Aortho Ncd QL
Cope 8606152.2 54000000 120 28 1043024.7 153218 0 27.17 17 1
Drag 7955386 54000000 120 28 992354.53 153606 0 27.21 16 1
Core Up. 25135995 30000000 150 37.5 771374.15 0 119331 25.92 9 1
Core Lo. 25135995 30000000 150 37.5 771374.15 0 119331 25.92 9 1
(V: Volume, Vb: Volume of bounding box, Tmax: Maximum thickness; Tmin: Minimum
thickness, SA: Surface Area)
Cost Drivers / Cost modifiers
Part Design
Volume, Vpart Material cost, rmetal Surface area, SA Number of control dimension, Ncd Quality level, Ql Order quantity, n
Material Selection
Density, Specific heat, Cp Thermal conductivity, K Melting temp (range), Tm Latent heat, L
Process Design
Furnace efficiency, fefficiency Factor for metal loss, fmetal_loss Factor for mold material loss in process, fmold_mat_loss Factor for sand recycling, frecycle Factor for mould rejection, fmold_rej Factor for casting rejection, fcast_rej
Mould Design
Draft Volume, Vdraftvol Volume to be machined (Machining allowance), Vmachining Volume of small holes (require drilling), Vmach_holes Volume of moulding sand, Vmould_sand Volume of core sand, Vcore_sand Amount of mould additives (binders), B% Mould making cost, Mrate
Feeder Design Feeder Yield, Fyield Amount of feed aids, Nchills, Nex_sleeves, Nex_cover, Nins_sleeves, Nins_cover Feeder fettling cost, Ffettling
Gating Design Gating Yield, Gyield Gate fettling cost, Gfettling
Mould design, Feeder design and Gating design
Number of tooling, Nt Complexity of tooling elements (Vr, tr,, Acurved, Aortho, Ncd , Ql) Tooling material cost, rtool_metal

Total cost equation
The total cost of a cast product comprises of tooling cost per part, cost of metal, cost of
indirect material, cost of processing, cost of melting and cost of machining.
Ccasting = Ctooling +Cmetal + Cind_mat + Cprocess + Cmelting + Cmachining. (6.1)
Ctooling tooling cost per part
Cmetal metal cost per part
Cind_mat indirect material cost per part
Cprocess process cost per part
Cmelting secondary process cost per part
Cmachining machining cost per part
Cost of Metal
Cmetal = rmetal × ρmetal × Vcasting × fmetal_loss (6.5)
Vcasting = (Vpart + Vmachining + Vdraftvol) / Casting Yield (6.6)
Vmachining = Vmach_surface + Vmach_holes (6.7)
Vmach_surface = pmach_surface × Apart × amach (6.8)
rmetal cost rate of metal
ρmetal density of metal
Vcasting volume of as-cast part (without feeder, gating)
fmetal_loss factor for metal loss in casting process
Vpart volume of the machined part
Vmachining volume to be machined
Vdraftvol volume of drafts
Vmach_surface volume of surface machining (excluding holes)
Vmach_holes total volume of (uncored) holes to be machined
pmach_surface percentage of part surface to be machined (decimal)
Apart surface area of part
amach machining allowance
Cost of Indirect Metal
Cind_mat = Cmold_sand + Cmisc_mat (6.9)

Cmold_sand = rmold_sand × Wmold_sand × frecycle × fcast_rej × fmold_rej (6.10)
Wmold_sand = Vmold_sand ×ρmold × fmold_mat_loss (6.11)
Vmold_sand = Apart × wmold (6.12)
Cmisc_mat = Cmold_sand × fmisc_mat (6.13)
Cmold_sand cost of mold sand mix
Cmisc cost of miscellaneous items (cores, wax, filters, etc.)
rmold_sand cost rate of moulding sand mix
Wmold_sand weight of mold sand mix required per casting
frecycle factor for sand recycling
fcast_rej factor for casting rejection
fmold_rej factor for mold rejection
Vmold_sand volume of mold material
ρmold_sand density of mold material
fmold_mat_loss factor for mold material loss in process
Apart Surface area of part
wmold Average thickness of mold wall
Cmold_sand cost of mold sand mix
fmisc_mat factor for miscellaneous materials
Cost of Process
Cprocess = Cmolding +Cmelt_pour + Cfettling + Cother + Cenergy (6.14)
Cmolding = ( Vmold_sand / Rmolding ) × rlabor_mold × fcast_rej × fmold_rej × fshape (6.15)
Cmelt_pour = (( Vcasting ×ρmetal )/( Rmelt_pour ×Y )) × rlabor × fcast_rej (6.16)
Cfettling = ( Vcasting ×ρmetal ) / ( Rfettling ×Y )× rlabor ×fshape (6.17)
Cother = (Cmolding + Cmelt_pour + Cfettling) × fother_labor (6.18)
Cenergy = Cmelting + Cother_energy (6.19)
Cmelting = lossmetalrejcastefficiencyenergy fffEr __ (6.20)
E = ρmetal × (Vcasting / Y) × (L + (ssp ×Ttap)) (6.21)
Cother_energy = Cenergy × fother_energy (6.22)
Csec_process = Cheat_treat + Cinspection (6.23)
Cheat_treat = Vcasting × ρmetal ×rheat_treat (6.24)
Cinspection = Vcasting ×rinspection × fshape× fclass (6.25)

Cmolding processing cost to create mold (ready to pour)
Cmelt_pour processing cost for melting and pouring
Cfettling processing cost for cleaning and fettling
Cother processing cost for other tasks in casting
Cenergy energy cost in casting process
Vmold_sand volume of mold
Rmolding production rate of molding - casting volume basis
rlabor cost rate of labour
fcast_rej factor for casting rejection
fmold_rej factor for mold rejection
fshape part shape complexity
Vcasting volume of as-cast part (without feeder, gating)
ρmetal density of metal
Rmelt_pour production rate of melting and pouring
Y yield of casting (as-cast weight / poured weight)
rlabor cost rate of labour
fcast_rej factor for casting rejection
Vcasting volume of as-cast part (without feeder, gating)
ρmetal density of metal
Rfettling production rate of fettling
Y yield of casting (as-cast weight/ poured weight)
rlabor cost rate of labor
fshape part shape complexity
Cmolding processing cost to create mold (ready to pour)
Cmelt_pour processing cost for melting and pouring
Cfettling processing cost for fettling
fother_labor factor for labor required for other tasks in casting
Cmelting cost of melting the metal to tapping temperature
Cother_energy total cost of energy other than melting
renergy cost rate of energy
E energy required for melting
fefficiency factor for furnace efficiency
fcast_rej factor for casting rejection
fmetal_loss factor for metal loss in casting process

ρmetal density of metal
Vcasting volume of as-cast part (without feeder, gating)
Y yield of casting (as-cast weight/ poured weight)
L latent heat of fusion of metal
ssp specific heat of metal
Ttap tapping temperature of metal
Cenergy energy cost
fother_energy factor for energy other than melting
Cheat_treat cost of heat treating the casting
Cinspection cost of inspecting the casting
Vcasting volume of as-cast part
ρmetal density of metal
rheat_treat average cost of heat treating per unit volume
Vcasting volume of as-cast part
rinspection average cost of fettling per unit volume
fshape part shape factor
fclass casting class factor
Cost of machining processes
Cmachining = Cmach_surface + Cdraft_surface + Cmach_holes (6.26)
Cmach_surface =(Vmach_surface + Vdraft_surface) ×rmachining × fshape× faccuracy (6.27)
Cmach_holes = Vmach_holes ×rdrilling × fpart_shape× faccuracy (6.28)
Cmach_surface cost of machining surfaces (excluding holes)
Cmach_holes cost of drilling holes
Vmach_surface volume of surface machining including drafts (excluding holes)
Vdraft_surface volume of draft surface machining including drafts
rmachining average cost of machining per unit volume
fshape part shape factor
faccuracy accuracy factor: standard = 1.0, high = 1.5, very high = 2.0
Vmach_holes volume of holes to be drilled
rdrilling average cost of drilling per unit volume
fpart_shape part shape factor
faccuracy accuracy factor: standard = 1.0, high = 1.5, very high = 2.0