Embed Size (px)
Citation preview
Portland State University Portland State University
PDXScholar PDXScholar
Dissertations and Theses Dissertations and Theses
Winter 3-25-2014
Motivation and Engagement Across the Motivation and Engagement Across the
Kindergarten Transition: A Self Determination Kindergarten Transition: A Self Determination
Perspective Perspective
Rita McLeod Yelverton Portland State University
Follow this and additional works at: https://pdxscholar.library.pdx.edu/open_access_etds
Part of the Child Psychology Commons, and the Social Psychology Commons
Let us know how access to this document benefits you.
Recommended Citation Recommended Citation Yelverton, Rita McLeod, "Motivation and Engagement Across the Kindergarten Transition: A Self Determination Perspective" (2014). Dissertations and Theses. Paper 2026. https://doi.org/10.15760/etd.2025
This Thesis is brought to you for free and open access. It has been accepted for inclusion in Dissertations and Theses by an authorized administrator of PDXScholar. Please contact us if we can make this document more accessible: [email protected].

Motivation and Engagement Across the Kindergarten Transition:
A Self Determination Perspective
by
Rita McLeod Yelverton
A thesis submitted in partial fulfillment of the requirements for the degree of
Master of Science in
Psychology
Thesis Committee: Andrew Mashburn, Chair
Thomas KindermannEllen Skinner
Portland State University 2014

i
Abstract
The American school system currently faces gaps in achievement between its low-
income, minority students and their higher-income, white peers. These gaps exist both in
academic and socioemotional skills, are present by kindergarten entry, and persist
throughout students' school careers. One proposed strategy through which these gaps
may be reduced is through the promotion of student motivation and engagement. In the
primary and secondary school settings, these constructs are promoted through teachers'
motivational support of students' psychological needs for relatedness, autonomy, and
competence. However, the development of these factors prior to kindergarten entry has
not been as well studied.
Data from 333 students and their 98 preschool classrooms were used to examine
whether highly motivationally supportive preschool experiences can buffer the negative
effects of risk in order to support the development of a high sense of motivation and
engagement that is sustained across the transition to kindergarten. In terms of normative
changes, results indicated that both engagement and disaffection declined across the
kindergarten transition. High maternal education was a consistent predictor of increases
in engagement and motivation and declines in disaffection across the kindergarten
transition. While need support did not consistently buffer the loss of engagement or
enhance declines in disaffection, it did seem particularly beneficial for boys, whose
motivation and disaffection outcomes tended to improve after preschool experiences
characterized by high warmth. Additionally, children's declines in frustration across the
kindergarten transition were enhanced by well-structured preschool experiences.

ii
Details of analyses, results, strengths, limitations, and implications for future
research are discussed.

iii
Acknowledgements
This thesis could not have been completed without the support of many wonderful
people.
I would like to thank the full Developmental Psychology team for their constant
help both in meetings and outside of school. I would particularly like to thank all of the
people who participated in my focus group on transforming the CLASS into a Self
Determination tool or who approached me outside of our meetings to give me further
resources. An extra-special thanks to Jen Pitzer for being a rock star statistics trouble-
shooter, Cailin Currie for keeping me motivated, and to Amy Cordier and Lizzy Tremaine
for helping me brainstorm questions and interpretations.
I would like to thank the Read it Again research team for their hard work
designing and implementing the study from which I took my sample, as well as for
sharing that data with me.
Finally, I would like to thank my excellent advisor, Dr. Andy Mashburn, and my
committee members, Dr. Ellen Skinner and Dr. Thomas Kindermann, without whom this
project could never have gotten off the ground. Thank you so much for all of the help
you have given me throughout this thesis process and during my time so far in this
program!

iv
Table of Contents
Title Page
Abstract iAcknowledgements iiiList of Tables viList of Figures vii
Chapter One: Problem Statement 1
Chapter Two: Literature Review 8Student Motivation and Engagement 9
Theories of Motivation 9Development of Motivation: Self Determination Theory 13
Motivation and Engagement in the Preschool Context 17The value of studying the preschool context 17Motivation and engagement as Approaches to Learning 21Development of Approaches to Learning 24Preschool contexts that support Approaches to Learning 27
Student Motivation and Engagement across the Kindergarten Transition 34Changing contexts across the kindergarten transition 34Child characteristics and the kindergarten transition 35
Chapter Summary 36
Chapter Three: Purpose of The Current Study 38Research Questions and Hypotheses 40
Chapter Four: Preliminary Measurement Work 43The CLASS as a Measure of Need Support 43The Learning Behavior Scale as a Measure of 55 Engagement and Disaffection
Chapter Five: Method 71Participants 71Procedures 72Measures 73
v
Title Page
Chapter Six: Results 76Preliminary Analyses 76Descriptive Analyses 76Preliminary Hierarchical Linear Modeling Steps 82Research Questions 84
Research Question One 84Research Question Two 88Research Question Three 90Research Question Four 95Research Question Five 95
Follow-Up Analyses 100
Chapter Seven: Discussion 102Summary of Findings 102Implications 104Strengths and Limitations 109Future Directions 115
References 117
Appendix A: Summary of Hypotheses and Findings 123

vi
List of TablesTitle Page
Table 1. PLBS Principal Components Analysis 64
Table 2. LBS Principal Components Analysis 65
Table 3. Items and Reliability for Engagement and Disaffection Scales 75
Table 4. Child Characteristics 77
Table 5. Correlations between Child Variables 80
Table 6. Intercorrelations between Engagement Variables 81
Table 7. Difference Score Frequencies 85
Table 8. Competence Motivation: Multi-Step Model 92
Table 9. Engagement: Multi-Step Model 93
Table 10. Depersistence: Multi-Step Model 93
Table 11. Frustration: Multi-Step Model 94
Table 12. Apathy: Multi-Step Model 94
vii
List of FiguresTitle Page
Figure 1. Factor Loadings: Engagement 57
Figure 2. Factor Loadings: Frustration Model One 58
Figure 3. Factor Loadings: Frustration Model Two 59
Figure 4. Factor Loadings: Anxious Disaffection 61
Figure 5. Factor Loadings: Enervated Disaffection 62
Figure 6. Factor Loadings: Depersistence Model One 66
Figure 7. Factors Loadings: Depersistence Model Two 67
Figure 8. Factor Loadings: Apathy Model One 68
Figure 9. Factor Loadings: Apathy Model Two 69
Figure 10. Need Support x Gender Interaction on Change in 97
Competence Motivation
Figure 11. Need Support x Gender Interaction on Change in Depersistence 98
Figure 12. Need Support x Gender Interaction on Change in Apathy 100

1
Chapter One: Problem Statement
It is a goal of the American school system to create learning environments in
which students from all backgrounds graduate with high levels of knowledge and skill
that will allow them to be competent as they move into their chosen careers. However,
recent evidence has shown that the school system has been more effective at reaching this
goal for some students than for others. Across the primary and secondary school years,
there is a well-documented gap in academic skills between students who are members of
African-American and Hispanic minority groups and their Caucasian peers (Burchinal et
al., 2011; Reardon & Gallindo, 2009). Even more so, the gap in achievement between
students who come from low-income families and those who come from high-income
families is not only wide, but is growing in size (Reardon, 2011).
These disparities in achievement exist not only in test scores and development of
academic competencies but also in high school retention and rates of degree attainment.
While 95% of Caucasian students obtain a high school diploma or its equivalent by the
age of 29, only 89% of African-American students and 69% of Hispanic students
complete this goal (Aud et al., 2010). This disparity is troubling, as many jobs, especially
those that are high-paying, require a high school degree. In this light, it appears that the
school system may not be adequately serving the needs of all of its students.
However, not all of these gaps can be accounted for by students' differential
development within the primary and secondary school system setting. The achievement
gaps between African-American and Hispanic students and their Caucasian peers already
exist by the time these students enter kindergarten (Burchinal et al., 2011; Reardon &
Gallindo, 2009), and these gaps generally widen during school vacations (Alexander,

2
Entwisle, & Olson, 2007). The achievement gap between students from low-income
backgrounds and their higher-income peers is also present at kindergarten entry and
remains fairly consistent throughout the rest of these students' school careers (Reardon,
2011).
In addition to gaps in academic skill at kindergarten entry, some students are at
risk for the development of poor socioemotional skills by kindergarten entry as well.
Students with low family income and low maternal education tend to enter kindergarten
with lower self-regulation skills, less enjoyment of learning, and more difficulty with
social interactions than their peers (Zill & West, 2001). The same is true for boys and
students who enter kindergarten at a comparatively young age. These gaps in
socioemotional competence are not only noteworthy for their own sake, but they may
also contribute to later academic difficulties, as socioemotional competence at
kindergarten entry is predictive of academic achievement throughout students' school
careers (Duncan et al., 2007; Claessens, Duncan, & Engel, 2009; Li-Grining, Votruba-
Drzal, Maldonado-Carreño, & Haas, 2010).
These statistics paint a troubling picture for those interested in promoting positive
educational outcomes for students from all backgrounds. In order to reduce these
achievement gaps, it is critical to identify points of leverage through which student
outcomes may be improved. One such lever is academic motivation, which is a
socioemotional approach to learning characterized by interest, challenge-seeking,
participation, and enthusiasm. Motivation to learn has gained research interest both for
its effects on achievement and dropout rates (Niemiec and Ryan, 2009; Greene and
Miller, 1996; Klem and Connell, 2004) and the degree to which it can be influenced

3
through students' learning environments (Niemiec & Ryan, 2009). Because high
motivation can be a helpful tool for students as they progress through school,
interventions designed to boost students' motivation may be one strategy through which
to improve achievement.
The processes by which motivation is developed have been studied mostly in the
k-12 school system setting. One particularly useful theoretical framework that has
emerged to explain the development of these values and behaviors is Self Determination
Theory, which proposes that when students' academic contexts meet their psychological
needs for relatedness, competence, and autonomy, they will be highly motivated and
engaged in their schoolwork (Ryan & Deci, 2000). There are certain practices that
teachers can utilize to support these needs: when teachers are warm, have autonomy-
supportive classroom practices, and have high structure in their classes, students'
psychological needs are met, and they go on to develop high motivation to learn and high
engagement in school (Stroet, Opdenakker, & Minneart, 2013).
Gaps in both academic achievement and motivation to learn are already present at
the start of kindergarten; therefore, in order to fully understand how to support motivation
as a strategy through which to reduce achievement gaps, it is essential to understand how
motivation develops prior to kindergarten entry. First, it is critical to understand how the
development of motivation can be supported in the preschool context. Furthermore, to
understand whether early motivation to learn can be helpful in ameliorating gaps present
at kindergarten entry, it is also important to understand how children maintain their
motivation during the transition to kindergarten.
The processes underlying students' development of motivation have not been

4
studied as closely in the preschool setting as in the primary and secondary school
settings. This is surprising for several reasons. First, interventions during this
developmental stage have been shown to have societal payoffs that are particularly high
in magnitude (Heckman, 2000, 2007). In addition, there may be something about the
preschool context that is unique from the k-12 setting in the way it promotes development
of motivation and engagement. The two contexts are structured very differently (Rimm-
Kaufman, 2000), which may impact the ways in which need-supportive environments
function to promote motivation and engagement. Additionally, there is some evidence
that suggests that the trajectory of motivation and engagement may be positive across
preschool years (Dominguez, Vitiello, Maier, & Greenfield, 2010), whereas it is negative
across k-12 school years (Ladd, Buhs, & Seid, 2000; Marks, 2000).
When motivation has been studied during the preschool years, it has typically
been studied as part of a higher-order socioemotional construct called Approaches to
Learning, which combines motivation, engagement, self-regulation, attention skills, and
creativity into a single factor (Duncan et al., 2007; Li-Grining et al., 2010; Dominguez et
al., 2010; Dominguez, Vitiello, Fuccillo, Greenfield, and Fulotsky-Shearer, 2011).
Students' overall Approaches to Learning at kindergarten entry positively predict both
their later math and reading achievement (Duncan et al., 2007; Claessens et al., 2009) and
also the rate at which they gain academic skills (Li-Grining et al., 2010). While this
factor does not include only motivation and engagement, it is probable that students'
motivation and engagement are important contributors to these positive outcomes.
Efforts to understand the development of Approaches to Learning at the preschool
level have generally used a wide set of classroom process quality measures to predict

5
Approaches to Learning. However, because this factor contains a broad set of
socioemotional skills, attitudes, and behaviors, each of which may have a different
developmental trajectory and different developmental precursors, it may be that this
approach introduces extraneous information into both the predictor and the outcome that
acts as noise in the analysis. Furthermore, this approach does not tell us anything specific
about the development of motivation. In order to understand the development of this
narrower construct of interest, it may be beneficial to narrow the predictors to only those
classroom processes that Self Determination Theory suggests form a need-supportive
classroom (Stroet et al., 2012).
This study also examines the extent to which students retain their engagement
with school across the transition to kindergarten. The kindergarten transition can be a
time of difficulty for many children (Rimm-Kaufman, Pianta, & Cox, 2000), as
evidenced by findings that students' engagement starts to decline after kindergarten entry
(Ladd et al., 2000). Because children's socioemotional skills at kindergarten entry seem
to matter for their future academic success (Duncan et al., 2007; Claessens et al., 2009;
Li-Grining et al., 2010), navigating this transition with motivation and engagement intact
may be crucial for students.
There is evidence that providing students with additional supports during this
transition is especially beneficial to those students who are at risk for academic and
socioemotional problems (Schulting, Malone, & Dodge, 2005, LoCasale-Crouch,
Mashburn, Downer, & Pianta, 2008). This may mean that the kindergarten transition is a
good developmental context in which to provide interventions designed to reduce
achievement gaps. It is therefore critical to study the processes behind the development

6
of early motivation for students from these backgrounds, in order to build a strong
theoretical understanding of this construct that will be applicable to later intervention.
In sum, this study will examine whether the qualities of students' experiences in
preschool contexts can buffer the impacts of high-risk personal and background
characteristics in order to support the development of a high sense of motivation and
engagement that is sustained across the transition to kindergarten. The following chapter,
Chapter Two, will a) describe popular theories of motivation and engagement, b)
highlight Self Determination Theory as a useful theoretical framework with which to
understand the development of motivation and engagement, c) discuss the preschool
context as ripe for further research, d) summarize what is known about motivation and
engagement in preschool through research on Approaches to Learning, e) propose a
narrower framework through which to study motivation and engagement in preschool, f)
describe the challenges students may face during the kindergarten transition, and g)
present several potential child personal and background characteristics that may impact
their motivational development.
Chapter Three will present the current study, including research questions and
hypotheses, proposing that a) motivation and engagement will decline across the
kindergarten transition; b) this decline will be more pronounced for students who are
male, young, and/or whose mothers had low levels of educational attainment; c) need-
supportive preschool classrooms will buffer the loss of motivation and engagement across
the kindergarten transition; and d) the effects of high levels of need support will be more
beneficial for children who are male, young, and/or whose mothers had low levels of
educational attainment.

7
Chapter Four will describe preliminary measurement work that was completed to
create a measure of need support in preschool that aligned with Self Determination
Theory as well as measures of engagement in preschool and kindergarten. Chapter Five
will describe the methods through which the study's hypotheses will be tested, including
information on the participants, measures, and procedures this study will use. Chapter
Six describe the results of the study. Finally, Chapter Seven will include discussion of
the results of this study and their implications, as well as the strengths and limitations of
this research.

8
Chapter Two: Literature Review
Chapter One has identified a major problem facing our system of public
education: there is a troubling achievement gap between low-income and high-income
students (Reardon, 2011), as well as between students from racial minority groups and
their white peers (Reardon & Gallindo, 2009; Burchinal et al., 2011). This gap exists not
only in test of academic skills and grades, but also in drop-out rates and approaches to
learning (Aud et al., 2010, Zill & West, 2001). Academic and socioemotional gaps are
already present at kindergarten entry and persist throughout the duration of students'
academic careers (Reardon, 2011; Burchinal et al., 2011, Zill & West, 2001). The
previous chapter presented one potential strategy through which to improve students'
achievement and reduce their dropout rates-- boosting students' academic motivation--
and argues that this construct would benefit from further study among preschool-aged
children. The current chapter will expand upon these arguments.
The first section, Student Motivation and Engagement, describes what is known
about the development of motivation and engagement in the primary and secondary
school context. The second section, Student Motivation and Engagement in the
Preschool Context, discusses what is currently known about the development of
motivation and engagement in the preschool setting, highlighting areas that could benefit
from further research. Finally, the last section, Student Motivation and Engagement
across the Kindergarten Transition, summarizes research about the kindergarten
transition, emphasizing how what is known about this transition can be applied to the
study of motivation and engagement.

9
Student Motivation and Engagement
Theories of motivation. The concept of motivation represents the internal
factors that lead people to pursue certain courses of behavior (Ryan & Deci, 2000). In
the academic context, the study of motivation often focuses around students' motivation
to learn, which refers specifically to the factors that lead students to engage in learning
activities. While there are countless theoretical frameworks that have been developed to
explain students' motivation to learn, the following review will highlight two in
particular: intrinsic vs. extrinsic motivation and learning vs. performance goal
orientations.
This review will also highlight the construct of engagement, which represents an
observable state during which students are active and enthusiastic participants in
classroom activities. While the concept of engagement is distinct from motivation in that
it refers to an externally observable state as opposed to internal perceptions and values,
the two are related in that they both represent positive student approaches to learning,
both have similar academic outcomes, and the development of both can be explained
through the same theoretical framework.
While these three frameworks are all different ways to consider students'
motivation, each has been shown to lead to positive academic outcomes (Niemiec &
Ryan, 2009; Greene & Miller, 1996; Klem & Connell, 2004). The following section will
describe these three theories of motivation and their outcomes as they have been studied
in students in primary, secondary, and post-secondary schools.
Intrinsic vs extrinsic motivation. One theory of motivation makes the
distinction between intrinsic and extrinsic motivation. Proponents of this theory argue

10
that learning is an activity in which humans are naturally inclined to engage (Ryan &
Deci, 2000). Because of this, people find tasks in which they get to develop new
competencies intrinsically motivating. When individuals have high senses of intrinsic
academic motivation, their desire to learn stems from their personal values. They feel
that their actions have an internal locus of control, resulting from their own interests
rather than from external sources (Niemiec & Ryan, 2009).
In contrast, when people feel that their actions stem from external sources like
punishment or desire to please another person, they are extrinsically motivated. Some
external motivators are in line with individuals' intrinsic personal values while others
conflict with them, and as such, extrinsic motivation exists on a continuum that ranges
from external motivation, based on fear of punishment and desire for reward, to
integrated motivation, in which values that were once external to a person become fully
internalized. The more internalized academic values become to a student, the closer to
intrinsic their academic motivation becomes. Research indicates that students who have
an intrinsic or integrated motivation to learn have higher psychological wellbeing, lower
anxiety, greater interest in and enjoyment of their work, and higher academic
achievement than students who are extrinsically motivated (Niemiec & Ryan, 2009).
Learning vs. performance goals. Another similar way to conceptualize
motivation is to consider the different reasons that students choose to engage in learning
activities. Theorists who think about motivation from this perspective look at students'
goals and place them into two primary categories: learning goals and performance goals
(Dweck, 1986; Mueller & Dweck, 1998). In this framework, learning goals represent a
more intrinsic approach to learning, in which students engage in learning activities

11
because they wish to understand the subject matter and develop new competencies. In
contrast, performance goals represent a more extrinsic approach, in which students
engage in learning activities mostly to gain others' admiration or to avoid incurring
disapproval from others.
Students who have learning goal orientations are more likely to believe that effort,
not inherent ability, is the way to succeed (Dweck, 1986). These students are more likely
to seek challenging tasks that will support their development of new skills and base their
self-perceptions of competence on how much they have learned. In contrast, students
who have performance goal orientations prefer tasks that they already know how to do,
tend to believe that ability is fixed, and base their self-perceptions of competence on how
they are externally evaluated or how their performance compares to other students'
performance. Research indicates that mastery goal orientation has been linked to
increased academic achievement (Greene & Miller, 1996).
Engagement. Another approach to understanding motivational precursors
to achievement is through the study of engagement. Students who are highly engaged in
school are characterized through their enthusiastic participation in classroom activities.
Through the framework of engagement, students learn best when they are both
emotionally and behaviorally engaged in their schoolwork. The study of engagement is
distinct from the study of motivation in that engagement refers to an observable state in
which students have productive classroom behaviors and positive attitudes, whereas
motivation delves into students' perceptions and values. However, both engagement and
motivation are precursors to effective learning and predict student achievement (Niemiec
& Ryan, 2009; Greene & Miller, 1996; Klem & Connell, 2004), and both can be

12
influenced through support of the same psychological needs (Ryan & Deci, 2000;
Skinner, Furrer, Marchand, & Kindermann, 2008).
Academic engagement consists of two distinct components: emotional
engagement and behavioral engagement. Students who are emotionally engaged exhibit
positive emotions as they participate in school activities. These emotions can include
enthusiasm, interest, and enjoyment (Skinner, Kindermann, & Furrer, 2009). A student
who is emotionally engaged during class may smile and show excitement during learning
activities.
In comparison, behavioral engagement refers to students' participation in class.
Engaged behaviors include on-task behavior and class participation and can be marked by
effort, persistence, attention, and concentration. Students who are behaviorally engaged
can be observed to be actively involved in classwork.
The opposite pole of engagement is called disaffection. Emotional disaffection
can come in many forms, which are described in detail by Skinner et al. (2009). One
form is enervated disaffection, which includes emotions like being tired, bored, and sad.
Enervated students may seem disinterested in class. Another type of emotional
disaffection involves alienation. Students who feel alienated during school may express
anger and frustration. A final possible dimension of emotional disaffection is pressured
participation, in which students feel anxious about academics. While these students may
be actively involved with tasks, they experience anxiety and worry about their class
activities instead of enjoyment. Behaviorally, disaffection can take the form of passivity,
lack of initiation, lack of effort, giving up, and lack of attention.
Students with high engagement are more likely to have higher grades and better

13
test scores than their disaffected peers, and they are also less likely to drop out of school
(Klem & Connell, 2004). In contrast, disaffected students are at risk for poor academic
outcomes, including absenteeism and behavior problems.
Summary. Intrinsic motivation, learning goal orientation, and behavioral
and emotional engagement are three ways to think about students' motivation that have
been shown to be associated with students' achievement (Niemiec & Ryan, 2009; Greene
& Miller, 1996; Klem & Connell, 2004). In the academic context, these have mostly
been studied in primary, secondary, and post-secondary schools. Because of their link to
achievement, they have been targeted as a potential leverage point through which to
improve student outcomes. In order to intervene on motivation and engagement,
however, researchers must first understand how they develop.
Development of motivation: Self Determination Theory. One theory that has
been effective at explaining the development of motivation and engagement in primary
and secondary school students is Self Determination Theory. This is a needs-based theory
of motivation that states that all people have three main innate psychological needs-- the
need for relatedness, autonomy, and competence-- and that when these needs are met, a
host of positive outcomes follow (Ryan & Deci, 2000). This theory initially sprung from
research into intrinsic and extrinsic motivation (Ryan & Deci, 2000), but it has since been
applied to a diverse set of outcomes, including engagement (Skinner et al., 2008). The
following section outlines Self Determination Theory in detail and describes the
contextual factors that can support the fulfillment of its psychological needs.
Psychological needs. Self Determination Theory proposes that all people
have three primary psychological needs that need to be met in order to function optimally

14
(Ryan & Deci, 2000). The first of these needs is relatedness, which is fulfilled when
people feel close to, cared for by, and connected with the people around them. In the
school setting, students can receive support for their need for relatedness from many
sources: teachers, classmates, and even parents all influence the degree to which students'
need for relatedness is met through their academic pursuits. However, some studies have
suggested that teachers may be the most salient social partner as a source of relatedness
support in the school context, as the degree to which students feel connected with and
supported by their teacher is the most consistent predictor of their motivation,
engagement, and satisfaction in school (Wentzel, 1998; Ryan, Stiller, & Lynch, 1994;
Furrer and Skinner, 2003).
The second psychological need espoused by Self Determination Theory is the
need for competence. People feel competent when they feel that they are able to
successfully complete the tasks they are attempting (Ryan & Deci, 2000). In the school
setting, this may mean that students feel able to complete the work they are assigned and
gain mastery over the concepts they are being taught (Niemiec & Ryan, 2009).
The final psychological need proposed by Self Determination theory is autonomy.
People whose need for autonomy is fulfilled feel that the actions they are performing are
meaningful to them and are being performed of their own volition (Ryan & Deci, 2000).
Often, people feel a high sense of autonomy while participating in activities that they
choose to do of their own free will. In the school context, however, autonomy may look
different, since generally, children's school attendance and the activities they experiences
are requirements, not choices. However, students may still feel high senses of autonomy
in school if they feel that the tasks they are performing in class are meaningful, relevant,

15
and aligned with their values (Niemiec & Ryan, 2009). Additionally, research has shown
that for some students, particularly those from cultures who value interdependence,
relatedness and autonomy in the school context may be linked such that students from
these cultures feel high senses of autonomy when a trusted adult is making decisions for
them (Iyengar & Lepper, 1999).
When students feel autonomous, competent, and related to the people around
them, they develop high senses of motivation and engagement (Niemiec & Ryan, 2009).
However, the fulfillment of the need for relatedness, autonomy, and competence is a
personal experience that cannot be observed but can only be measured through a self-
report survey. It is also not something that can be directly acted upon by those wishing to
intervene on students' motivation in schools. As such, it is important to understand how it
is possible to alter students' contexts to provide them with environments that support the
fulfillment of these needs, which will then lead to positive student attitudes and
behaviors.
Need supportive classroom contexts. A great deal of research has
focused on ways that k-12 teachers can build classroom environments that are supportive
of students' relatedness, autonomy, and competence. Through behaving in a way that is
motivationally supportive and gearing students' learning activities in a way that is
optimally structured for their need fulfillment, teachers can create an environment in
which students develop high senses of relatedness, competence, and autonomy, and,
subsequently, develop positive motivational approaches and high degrees of engagement
(Stroet et al, 2013).
Teachers can support students' need for relatedness by behaving in a way that

16
expresses warmth and caring about students, being emotionally available, and spending
time with students (Stroet et al., 2013). Adolescent students report perceiving teachers as
caring when teachers have warm affect and pay attention to the students as individuals
and learners (Wentzel, 1997). Conversely, teachers can undermine students' sense of
relatedness by expressing coldness and through aggressive communication styles. In
Wentzel's (1997) study of student perceptions of caring and uncaring teachers, students
reported a rude communication style, characterized by yelling and interrupting, as being
the most salient attribute of an uncaring teacher.
To support students' sense of competence, teachers can structure learning
activities and feedback in a way that allows students to effectively develop academic
mastery and feel successful in their activities (Stroet et al., 2012). The provision of
structure is split into four primary categories. The first category, clarity, refers to the
degree to which teachers make task instructions and goals explicit and understandable to
students. The second component is guidance, which teachers provide by offering support
to students as they attempt to complete their work and master new skills. Third, teachers
can provide structure through encouragement of academic development; for instance,
through communicating positive expectations of students' abilities. Finally, the provision
of informational feedback can help students develop a sense of control over their
outcomes.
The final dimension of need supportive teacher behavior is autonomy support,
which refers to teacher behaviors that help students feel a sense of agency in their own
education. There are several ways that teachers can create an autonomy supportive
environment in the classroom (Stroet et al., 2012). Teachers can provide students with a

17
choice of activities, allowing them to control some portion of their classroom experience
based on their own personal interests. A second way teachers can provide autonomy
support is through aligning learning activities with topics that will be relevant to students'
actual lives, thereby allowing students to feel like their work has meaning.
Summary. By supporting students' needs for competence, autonomy, and
relatedness, teachers can impact students' development of academic motivation and
engagement (Niemiec & Ryan, 2009). They can do this through creating classrooms that
are warm, autonomy-supportive, and well structured (Stroet et al., 2012). These
processes have been demonstrated largely during primary and secondary schools (Stroet
et al., 2012); however, to understand the foundations of these approaches to learning, it
may be fruitful to examine their development at an even earlier age.
Motivation and Engagement in the Preschool Setting
The value of studying the preschool context. The preschool context is a ripe
time during which to study the development of motivation and engagement for a variety
of reasons. First, because gaps in achievement and socioemotional skill exist by
kindergarten entry, it is important to understand how the preschool context can support
kindergarten readiness. Furthermore, not only does preschool represent a setting that in
many ways is ideal for intervention, it also is a setting that may be uniquely
motivationally supportive.
Achievement gaps at kindergarten entry. The achievement gap
between minority and low-income students and their white and high-income peers
already exists by the time children enter kindergarten. The gap in academic scores
between black children and their white peers can be found in children as young as three

18
years old (Burchinal et al., 2011), indicating that interventions that are aimed at school-
age children are already missing the beginnings of the achievement disparity. This is not
the only minority group in which this is the case: Hispanic children are also at risk for
low achievement by kindergarten entry (Reardon & Gallindo, 2009). Furthermore, the
achievement gap between low-income students and high-income students at kindergarten
entry is not only high but is also growing in size (Reardon, 2011). This gap has gotten
30-40% more pronounced since 1970, and it is now nearly twice as large as the black-
white achievement gap.
In addition to gaps in achievement, students enter kindergarten with different
socioemotional skillsets, and some personal and background characteristics can put
students at risk for lower socioemotional kindergarten readiness. Students who are older
at kindergarten entry and/or female tend to be more eager to learn, more persistent, and
more attentive during class than their younger and/or male peers (Zill & West, 2001).
These gender gaps persist across students' school careers, as girls tend to have higher
engagement than boys across elementary, middle, and high school (Marks, 2000).
Some family background characteristics also predict socioemotional skills by
kindergarten entry. In Zill and West's (2001) analysis of the Early Childhood
Longitudinal Study-- Kindergarten cohort (ECLS-K) dataset, four family risk factors
were identified: low maternal education, low family income, single-parent family, and
primary home language other than English. The researchers combined these risk factors
to create a risk index. Students with one or more of these risk factors were at risk for low
academic, socioemotional, and motivational skills by kindergarten entry. Again, some of
these gaps persist through school, as socioeconomic status positively predicts

19
engagement during elementary, middle, and high school (Marks, 2000).
All in all, the presence of achievement gaps at kindergarten indicates that it may
be helpful to start interventions prior to kindergarten. The preschool setting is one
context in which it is possible to implement interventions that will help these students
gain the skills and competencies they need to be on an even footing at the beginning of
kindergarten.
The value of preschool intervention. In general, preschool is a good
time to begin interventions that are designed to boost students' achievement, reduce
problem behaviors, and help students learn the socioemotional skills that are critical to
later school success. Nobel Laureate James Heckman (2000, 2007) demonstrated that the
earlier in students' lives interventions are implemented, the greater the societal return for
those interventions. For example, Cunha and Heckman (2006) showed that for the Perry
Preschool Project, a program in the 1960s that gave poor, African-American students who
scored low on early IQ tests the opportunity to attend a daily preschool program, there
was $9 return on every $1 spent in early interventions when adult outcomes such as
higher high school completion rates and lower adult arrest rates were taken into account.
This high rate of return for early intervention indicates that the preschool years may be a
prime time to begin interventions aimed towards improving youth's lives.
With the value of early intervention in mind, preschool becomes particularly
noteworthy as a point during which to concentrate efforts to boost children's success,
because it represents the first time that large groups of children from all backgrounds
come to a school setting. In the United States, 69% of 4-year-olds enrolled in pre-
Kindergarten in 2012 (Organization for Economic Cooperation and Development, 2012),

20
making this a time in which the majority of children are in an environment in which they
can be easily reached by interventions. Because this represents an early point at which it
is possible to intervene directly on children's lives on a broad scale, understanding how to
positively impact preschoolers' lives is particularly key to those interested in improving
student outcomes at all ages.
Preschool is a unique motivational setting. Finally, preschool represents
a very different context than the k-12 school system, and due to these qualitative
differences, the development of motivation and engagement may look different in the
preschool context than it does for older students. Kindergarten and preschool contexts
generally differ on a variety of factors. When children enter kindergarten, they enter a
context that is characterized by far more formal instruction-- instructions directly aimed
at improving children's academic skills-- than they generally experience in the preschool
setting (Rimm-Kaufman & Pianta, 2000). Whereas preschool is often more nourishing of
socioemotional competence, kindergarten's primary goal is to impart academic skills.
Interactions with teachers may now be more focused on academic growth than social
growth (Rimm-Kaufman & Pianta, 2000). These qualitative shifts in context may have
dramatic impacts on children's development of motivation as well as engagement in class.
One indicator that these processes may develop differently in these different
contexts is that while there is some evidence that children grow in motivation-related
approaches to learning across a given preschool year (Dominguez et al., 2010), students
who have entered the formal school system actually lose motivation and engagement
across school years (Ladd et al., 2000; Marks, 2000). One potential explanation for this
may be age effects; however, another explanation may be that there is something about

21
the preschool context that is particularly supportive of the development of motivation and
engagement.
Summary. The preschool context is an interesting context in which to
study motivation and engagement, because not only is it a valuable setting in which to
implement effective interventions, it also may be a time during which the processes by
which positive motivation and engagement are developed happen differently than they do
in the context of formal schooling. Despite this, not much has been studied about
motivation and engagement during the preschool years.
Motivation and engagement as Approaches to Learning. When motivation
and engagement have been examined in early education, they have been included as part
of a comprehensive factor that combines several attitudes, socioemotional skills, and
behaviors. This factor, called Approaches to Learning (ATL), has gained researchers'
interest because it is a positive predictor of later academic outcomes and trajectories of
learning (Duncan et al., 2007; Claessens et al., 2009; Li-Grining et al., 2010). The
following section will describe the ATL construct emphasizing its ties to motivation and
engagement, summarize what is known about the outcome of early ATL, describe its
apparent developmental trajectory in preschool, and critique the construct's usefulness in
intervention.
The Approaches to Learning construct. Approaches to Learning, as it is
measured, includes several items that assess different positive socioemotional skills,
behaviors, and attitudes as indicators of a child's overall attitudinal and behavioral style
in the classroom. Because a one-factor scale measuring ATL contains items relating to
motivation, engagement, self-regulation, attention behaviors, interest, and creativity, what

22
this variable actually represents can be difficult to piece apart, and different researchers
have interpreted the scale in different ways.
For an example of the ways in which the one-factor ATL model can be interpreted
differently by different researchers, it is instructive to examine a variety of studies that
have all analyzed the same dataset and interpreted the ATL variable in different ways.
One such dataset is the Early Childhood Longitudinal Study—Kindergarten Cohort
(ECLS-K). This study followed students from kindergarten entry through eighth grade,
documenting a comprehensive set of factors, including students' family lives,
achievement, and classroom behavior. This set of factors included a scale called Positive
Approaches to Learning, which consisted of six items in which teachers reported on
students' classroom behavior. The differences with which this scale was interpreted in
different studies were fairly dramatic.
Hair, Halle, Terry-Humen, Lavelle, and Calkins (2006) take the broadest
interpretation of the ECLS-K's scale, saying that “approaches to learning include
openness and curiosity to tasks and challenges, task persistence, imagination,
attentiveness, and cognitive learning style (p 433)” Other theorists interpreted the
construct as representing more self-regulatory behaviors. Li-Grining et al. (2010) argue
that “with components such as persistence, emotion regulation, and attentiveness,
children’s ATL largely reflects self-regulation (p 1062).” Duncan et al. (2007) further
reduce the construct, interpreting it largely as attention-related behaviors. While they
state that Approaches to Learning represents “both attention skills and achievement
motivation (p 1434)”, they go on to call the construct “attention skills” for the rest of
their analyses. Duncan et al. (2007) are not alone in viewing this construct as related to

23
motivation: Xue and Meisels (2004) call Approaches to Learning “a proxy for motivation
(p 203).” Similarly, Bodovski and Farkas (2007) use the ATL construct to measure
engagement.
Overall, many researchers agree that the one-factor measure of ATL, as
represented in the ECLS-K, seems to include information about students' motivation and
engagement. However, it seems that this variable also contains a great deal of
information about other positive classroom attitudes and behaviors.
Outcomes of Approaches to Learning. Despite its issues with
interpretability, the Approaches to Learning construct has gained interest over the course
of the past few years because ATL at kindergarten entry is a good predictor of later
achievement.
Duncan et al. (2007) used the ECLS-K to examine early predictors of third grade
academic success. They found that students' attention-related behaviors at kindergarten
entry (assessed with the ATL scale) predicted third grade reading and math achievement
test scores and teacher-rated achievement over and above students' reading and math
ability at school entry. In fact, this was the only socioemotional factor to uniquely predict
third grade achievement: internalizing and externalizing behaviors and social skills were
unrelated to later achievement when ATL was controlled for. Furthermore, a later study
showed the same pattern in students' fifth grade achievement (Claessens et al., 2009).
Li-Grining et al. (2010) showed that in addition to predicting later levels of
achievement, ATL at kindergarten entry was also positively related to trajectories of
academic achievement from 1st to 5th grade. In other words, children who have positive
ATL develop academic competencies more quickly than their peers who have less

24
positive ATL.
These promising results indicate that attention should be given to Approaches to
Learning. The skillset that this measure comprises seems to be a beneficial one for
students' academic development. However, because this construct contains so many
different skills, attitudes, and behaviors, it is impossible to know which active ingredient
or ingredients in this measure might be contributing to children's development.
Development of Approaches to Learning. Although the Approaches to
Learning construct at kindergarten entry has been shown to predict positive academic
outcomes, not much research has looked at kindergarten entry ATL as an outcome itself.
However, a few studies have examined the trajectory of ATL during the preschool years.
Dominguez et al. (2010) tracked the preschool development of ATL. They
followed four-year old students through their first year of Head Start to assess the
trajectory of development of ATL as well as predictors of that development. They found
that in general, students made gains in ATL across the preschool year. Girls had both
higher baseline scores on the ATL scale and also gained more across the school year.
Additionally, students who were in well-organized classrooms gained in ATL more
quickly than those whose classrooms were less well-organized.
Another study also looked preschool predictors of ATL. Dominguez et al. (2011)
looked at the interactions between fall child characteristics and classroom environments
that predicted spring ATL in preschool. They found that students’ problems in structured
learning situations and with teacher and peer interaction in the fall predicted lower ATL
by the spring. Additionally, there were significant interactions between child
characteristics and classroom environments. For children with problems interacting with

25
teachers or in structured class activities, low teacher emotional support was particularly
detrimental to later ATL.
Overall, both child and classroom characteristics seem to influence students'
development of ATL in preschool. Both classroom organization and teacher emotional
support seem important to students' development of these skills, attitudes, and behaviors,
as do demographic and personality characteristics like gender and shyness. However,
again, this measure of Approaches to Learning flattens several socioemotional factors
into one construct, making it hard to say what these relationships mean. In particular, it is
impossible to say whether these patterns represent predictors and trajectories of
motivation and engagement during preschool or whether these patterns are due to the
influence of some other socioemotional factor that is also represented by the ATL
construct.
Preschool Learning Behavior Scale as a solution. One possible way to
separate the distinct factors present in the Approaches to Learning construct can be found
in the Preschool Learning Behavior Scale (PLBS). The PLBS is a measure of ATL that is
theoretically attuned to three major dimensions: competence motivation,
attention/persistence, and learning strategies (McDermott, Leigh, & Perry, 2002).
Although this scale is often collapsed to give an overall ATL score (Dominguez et al.,
2010; Dominguez et al., 2011), these three dimensions are distinguishable from each
other and represent distinct socioemotional constructs.
The first dimension of the PLBS, competence motivation, has close ties to
intrinsic, mastery-oriented motivational approaches. Competence motivation is an early
theory of motivation whose central idea is that all humans have an intrinsic desire to

26
develop new skills (White, 1959, as cited by Stipek, 2002). Individuals with high
competence motivation seek out challenging tasks and are primarily driven to master new
skills. Students who score highly on the competence motivation dimension of the PLBS
tend to approach rather than avoid difficult tasks and do not give up easily when faced
with setbacks (McDermott et al., 2002), behaviors that are indicative of a mastery
approach to learning (Dweck, 1986). Additionally, they show a high degree of interest in
their class work, demonstrating behavior that is in line with what one might expect from
someone who is intrinsically motivated (Ryan & Deci, 2000).
Additionally, while neither of the other pre-existing dimensions of the PLBS
aligns with engagement and disaffection, the scale includes 29 different items measuring
a rich set of behaviors that relate to a variety of socioemotional constructs, including
items that represent students' engagement and disaffection in the classroom. While the
three dimensions that are already part of the structure of the PLBS may not be organized
in ways that allow researchers to understand engagement and disaffection, it may be
possible to use this measure in a different way. By examining only those items that
represent engagement and disaffection, it may be possible to adapt this commonly-used
scale to provide information about these attitudes and behaviors.
Summary. When motivation and engagement have been studied in early
years, they have largely been collapsed into a larger measure of Approaches to Learning,
which includes other socioemotional skills, attitudes, and behaviors in addition to
motivational constructs. This factor has been shown to predict later academic
achievement (Duncan et al., 2007; Claessens et al., 2009; Li-Grining et al., 2010).
Students tend to gain in positivity in their Approaches to Learning across the preschool

27
years, a gain that is moderated by both student and classroom characteristics (Dominguez
et al., 2010; Dominguez et al., 2011). However, because the Approaches to Learning
construct contains so many theoretically distinct components, it is impossible to say what
the active ingredient or ingredients in this variable are. One potential solution to this
problem can be found through use of the PLBS, which can be disaggregated into
dimensions that are more directly theoretically aligned with motivational constructs.
Preschool contexts that support Approaches to Learning. In general, there are
two primary categories within which to understand the qualities of a preschool setting
that support student development. The first is structural quality, which refers to the
features of preschool programs that are determined through policies, which can include
elements such as training requirements for preschool teachers, required child-adult ratios
in classrooms, curricular demands, and extra services that are provided by preschools. In
contrast, process quality refers to the elements of a preschool that the children directly
experience day-to-day, which includes teacher-child interactions and the physical
environments that children interact with through the program. While structural quality
does not have consistent positive impacts on children's academic and social competence,
research on process quality has shown consistently positive ties between high-quality
interactions and physical learning space in preschool and children's development of
academic and social skills (Mashburn, in press). This indicates that measures of quality
that directly tap into students' classroom experiences may be the best predictors of those
students' outcomes.
Dominguez et al. (2010, 2011) demonstrated that there are measures of process
quality that predict the development of student Approaches to Learning. Both classroom
28
organization and classroom level of teacher emotional support predicted student
outcomes. However, while these measures do represent the quality of interactions that
students experience during kindergarten, the measures used were still fairly broad, as
were the outcomes measured. It is not enough to know that in general, process quality is
predictive of student outcomes; rather, in order to truly understand the factors underlying
students' development of motivation and engagement, it is necessary to understand which
specific processes lead to the development of which specific outcomes. In order to do
this, it may be valuable to re-imagine current measures of process quality, to determine
how these measures might be used to get at specific, rather than broad, processes.
Classroom Assessment Scoring System (CLASS). One of the most
commonly used measures of preschool process quality is the Classroom Assessment
Scoring System (CLASS; Pianta, La Paro, & Hamre, 2008). With this measure,
independent observers enter classrooms and rate the frequency with which they observe a
variety of behaviors that are indicative of the quality of classroom processes. While the
class-level attributes this system measures include a broad array of behaviors, the CLASS
aggregates lower-level classroom context dimensions into three higher-level domains:
emotional support, classroom organization, and instructional support. Each of these
primary domains is composed of three or four lower-level dimensions.
The CLASS was designed to measure contexts that boost students' development
of a host of academic and socioemotional competencies. Its primary domains include a
broad array of dimensions that should theoretically provide high-quality contexts for the
development of an equally broad array of positive child outcomes, including motivation
and engagement. When focusing on narrower outcomes, however, it may be more

29
helpful to focus in on the specific dimensions that might target the development of
specific outcomes. The following review will elaborate on the CLASS structure to
provide more detail about the contexts that each domain and dimension directly measure.
Emotional support. The domain of emotional support represents
positive, close relationships between teachers and students and a warm classroom
environment. It includes four dimensions: positive climate, negative climate, teacher
sensitivity, and regard for student perspectives. The creation of this domain was guided
by research indicating that children who feel high senses of connectedness to others
during their early years are more likely to go on to develop positive trajectories of social
and academic development later in life (Hamre & Pianta, 2001; Ladd, Birch, & Buhs,
1999).
Positive climate refers to “the emotional connection, respect, and enjoyment
demonstrated between teachers and students and among students.” (Pianta et al., 2008, p.
3) A high score on this dimension reflects a classroom that contains warm relationships,
positive affect from teachers and student, positive verbal and physical communication,
and an atmosphere of respect.
In contrast, negative climate refers to “the level of expressed negativity such as
anger, hostility, or aggression exhibited by teachers and/or students in the classroom.”
(Pianta et al., 2008, p 3) This measure is marked by high irritability, yelling, harsh
punishment, sarcasm, and victimization in a classroom.
Teacher sensitivity refers to “teachers' awareness of and responsivity to students'
academic and emotional concerns.” (Pianta et al., 2008, p 3). A high score on this
construct means that teachers are aware of students who need extra support, provide

30
individualized support, help resolve problems effectively, and create an atmosphere in
which students feel comfortable seeking support from the teacher.
Finally, regard for student perspective represents “the degree to which teachers'
interactions with student and classroom activities place an emphasis on students'
interests, motivations, and points of view.” (Pianta et al., 2008, p 3) This measure is
marked by a flexible class schedule that is responsive to students' interests, in an
environment where student autonomy is supported, student expression is encouraged, and
students have the freedom to move during activities.
Classroom organization. The domain of classroom organization
constitutes the measurement of classroom processes related to the management of
students' behavior, time, and attention. This domain includes three dimensions: behavior
management, productivity, and instructional learning formats. The development of this
domain was guided by research on the development of children's self-regulation, which
has shown that students develop self-regulatory skills best in well-regulated classroom
environments (Pianta et al., 2008).
Behavior management represents “how effectively teachers monitor, prevent, and
redirect behavior.” (Pianta et al., 2008, p 4) A high score on this dimension indicates that
teachers have clear and consistent behavior expectations, anticipate problem behavior,
have low reactivity, effectively redirect misbehaving children, and have classrooms in
which students are mostly compliant.
Productivity refers to “how well the classroom runs with respect to routines and
the degree to which teachers organize activities and directions so that maximum time can
be spent in learning activities.” (Pianta et al., 2008, p 4) This measure is high in a

31
classroom that maximizes learning time, with few disruptions and appropriate pacing, in
which there are consistent routines, brief transitions, and in which the teacher is fully
prepared for activities and lessons.
Finally, instructional learning formats is a dimension that represents “how
teachers facilitate activities and provide interesting materials so that students are engaged
and learning opportunities are maximized.” (Pianta et al., 2008, p 4). A high score on this
dimension represents a classroom in which teachers effectively facilitate students'
engagement in activities and use a variety of materials that allow for hands-on learning,
students actively participate and maintain interest in activities and lessons, and learning
objectives are made clear to students.
Instructional support. The final domain, instructional support,
represents activities that support the development of academic competencies such as
language and critical thinking. This domain includes three dimensions: concept
development, quality of feedback, and language modeling. The development of this
measure was theoretically guided by research indicating that critical thinking and
metacognitive skills are critical to academic development, as is appropriate scaffolding
(Pianta et al., 2008).
Concept development refers to “how teachers use instructional discussions and
activities to promote students' higher-order thinking skills in contrast to a focus on rote
instruction.” (Pianta et al., 2008, p 5) This dimension represents how often classroom
activities provide the opportunity for students to analyze and use creativity, in addition to
teachers' integration of multiple concepts and application of concepts to students' real
lives.

32
Quality feedback represents “how teachers extend students' learning through their
responses to students' ideas, comments, and work.” (Pianta et al., 2008, p 5) A high
score on this dimension represents a class in which teachers appropriately scaffold
concepts to students, have back-and-forth exchanges with students, ask students to
explain their rationale for answers, provide additional information to clarify concepts,
and encourage students' efforts and persistence.
Finally, language modeling represents “the extent to which teachers facilitate and
encourage students' language.” (Pianta et al., 2008, p 5) A high score on this dimension
represents a classroom in which there are frequent conversations and in which teachers
ask many open-ended questions, often repeat students' responses, map actions with
language, and use advanced language with students.
CLASS and Approaches to Learning. While the dimensions of the
CLASS were constructed to map onto the three primary domains set forth by Pianta et al.
(2008), they represent a broad and varied set of high-quality processes that are observable
within classrooms. In turn, these processes are theorized to boost the development of a
wide set of positive educational outcomes, both academic and socioemotional. When
targeting a specific outcome or set of outcomes, such as those represented in the
Approaches to Learning family, it may be helpful to determine the specific processes that
are predicted to impact the specific outcome variables, based on what is known
empirically and theoretically about their development.
In the case of motivation and engagement, two of the target factors that are central
to ATL, these processes include those that boost students' senses of relatedness,
autonomy, and competence-- respectively, student-teacher relationships and classroom
33
environments that convey a high sense of warmth, a curriculum that supports children's
choices, and a learning environment that is structured and well-scaffolded. Many of the
contextual supports for the needs stipulated by Self-Determination Theory can be found
in the classroom processes measured by the CLASS.
While the CLASS's dimensions were not originally organized through the
framework of Self-Determination Theory, it is possible to map certain dimensions onto
the three needs stipulated by the theory. Because these dimensions directly translate into
contexts that should support the fulfillment of relatedness, autonomy, and competence,
which in turn support the development of motivation and engagement, classrooms that
are high in these dimensions should be particularly supportive of students' development
of these facets of children's ATL.
Summary. High process quality in preschool is generally more predictive of
positive child outcomes than is structural quality, indicating that the interactions that
children directly experience impact their development more than distal predictors. One
measure of process quality is the CLASS, which is a comprehensive measure of a variety
of high-quality classroom processes that are theoretically predicted to positively impact a
breadth of student outcomes (Pianta et al., 2008). Some of the processes measured by the
CLASS are theoretically aligned with Self Determination Theory. While the full CLASS
has been used before to predict the development of ATL in preschool (Dominguez et al.,
2010), it may be more theoretically useful to look at narrower subsets of both measures.
Specifically, to predict motivation and engagement, it may be useful to examine only
those dimensions of the CLASS that best represent structure, autonomy support, and
warmth.

34
Student Motivation and Engagement across the Kindergarten Transition
Understanding how motivation and engagement develop at the preschool level is
not sufficient when explaining children's differences at kindergarten entry: it is also
critical to study how students maintain their motivational approaches across the
kindergarten transition. As has been demonstrated, children's socioemotional Approaches
to Learning at kindergarten entry are strong predictors of their later academic
achievement (Duncan et al., 2007; Claessens et al., 2009; Li-Grining et al., 2010);
therefore improving students' motivation and engagement at kindergarten entry may be a
good goal for those wishing to design interventions. While much of this motivation and
engagement may be developed in preschool, it is also important that students maintain
high motivation across the kindergarten transition.
Changing contexts across the kindergarten transition. The process of
transitioning to kindergarten represents a unique time in children's lives, which may
present some students with difficulties. To begin, students are transitioning from an
environment which is generally more focused on socioemotional growth to one that is
academically oriented (Rimm-Kaufman & Pianta, 2000). This context shift presents a
new set of challenges for children, as in addition to an increase in academic requirements,
they also are required to maintain attentive behavior for longer durations and remain
away from home for more hours a day (Rimm-Kaufman & Pianta, 2000).
While most children seem to adapt to their new environment well, a sizable
minority of students have difficulty adapting to this new context. Rimm-Kaufman et al.
(2000) found that teachers reported that 16% of kindergarten students experienced
difficulties with the transition. Over a third of kindergarten teachers reported that half or

35
more of the students in their class entered kindergarten with socioemotional difficulties
that impeded their adaptation to the k-12 environment.
The kindergarten transition may pose particular difficulties for students'
maintenance of high motivation and engagement. While students seem to increase in
general socioemotional skills during preschool (Dominguez et al., 2010), their
engagement tends to decrease over a typical k-12 school year (Marks, 2000), a decline
that begins as soon as children enter kindergarten (Ladd et al., 2000). Despite the
differences in these two contexts and the importance of socioemotional skills at
kindergarten entry, there is a gap in the current understanding of motivational
development at the connection between preschool and kindergarten. Understanding how
these approaches to learning change across the kindergarten transition is key to creating
interventions to help ensure that they are high at kindergarten entry.
Child characteristics and the kindergarten transition. Some child and family
characteristics put students at risk for low academic and socioemotional competence by
kindergarten entry. Young age and male gender are two individual factors that are
predictive of low socioemotional skill development by kindergarten entry (Zill & West,
2001; Marks, 2000). Members of African-American and Hispanic minority groups,
students whose families have low incomes, and students whose mothers had low levels of
education attainment may be at risk not just for low kindergarten-entry socioemotional
competence but also low achievement (Reardon & Galindo, 2009; Reardon, 2011;
Burchinal et al., 2011, Zill & West, 2001).
Although there seem to be personal and background characteristics that put
children at risk of developing lower socioemotional and academic skills by kindergarten

36
entry, not all hope is lost: there is evidence to suggest that additional supports during the
kindergarten transition may be especially beneficial for these students. Specifically,
programs designed to facilitate a successful kindergarten transition have had stronger
effects for students who are from low-SES backgrounds than for their high-SES peers
(Schulting et al., 2005), and the same is true for students with low maternal education
(LoCasale-Crouch et al., 2008). These findings indicate that providing extra support for
all students across the kindergarten transition may be helpful in reducing gaps in
kindergarten readiness, as those students who are at-risk for low kindergarten readiness
benefit more from intervention than do their peers.
Chapter Summary
Students' motivation and engagement represent a potential leverage point through
which students’ academic outcomes can be improved. Research in the k-12 setting has
shown that to act on these motivational factors, teachers can support students' needs for
relatedness, autonomy, and competence by providing warmth, autonomy support, and
structure in their classrooms. However, this research has not been extended to the
preschool level, which is surprising given that academic and socioemotional gaps start
early, and the preschool setting is a particularly ripe context for intervention.
What research has been conducted at the preschool level has combined
motivational factors into a larger construct called Approaches to Learning (ATL), which
combines motivation and engagement with other socioemotional approaches to learning
such as self-regulation, attention skills, and creativity. ATL at kindergarten entry predicts
later achievement; however, it is unclear which components of this construct actively
contribute to this pattern. Previous studies have used broad measures of classroom

37
process quality to predict ATL in preschool, demonstrating that both classroom and child
factors play into its development. However, to understand the development of motivation
and engagement specifically, it may be helpful to narrow both the ATL outcome and its
predictors into variables that are theoretically aligned with Self Determination Theory.
Finally, it is not enough to simply examine the development of motivation and
engagement during preschool: to understand how these factors are developed by
kindergarten entry, it is also necessary to examine how students maintain high motivation
across the kindergarten transition. Furthermore, it is necessary to take into account that
the processes through which motivation is developed may not be the same for all children
and to closely examine these processes in those students who are at risk for developing
low motivation and engagement by kindergarten entry.

38
Chapter Three: Purpose of the Current Study
The current study examined whether the qualities of students' experiences in
preschool contexts can buffer the negative effects of risk in order to support the
development of a high sense of motivation and engagement that is sustained across the
transition to kindergarten. In order to examine these issues, data from 333 rising
kindergarteners and their 98 preschool teachers who participated in a preschool reading
intervention were analyzed. The results of this study have the potential to make four
contributions to our current understanding of motivation and engagement, each of which
is discussed in the following sub-sections.
Motivation and Engagement in Preschool: Moving Beyond Approaches to Learning
One contribution of this study is that it includes more precise measures of
students’ motivation and engagement than have typically been used with preschool-aged
children. Previous studies tend to measure motivation and engagement as part of a host
of socio-emotional factors called Approaches to Learning. While these studies have
found that both child and contextual factors predict early development of approaches to
learning, the broadness of this construct makes it impossible to say whether these
findings apply to the specific dimensions of motivation and engagement that are derived
from theories. Thus, this study will narrow this construct back to its constituent parts to
examine the extent to which child and contextual factors predict these specific
components of motivation and engagement.
The CLASS as a Measure of Need-Supportive Classrooms
A second contribution of this study is that it modifies the Classroom Assessment
Scoring System (CLASS; Pianta et al., 2008), a very common measure of the quality of

39
children’s interactions in preschool settings, in order to create a measure of need-
supportive classrooms that aligns with Self Determination Theory in a classroom
environment. While parts of the CLASS were created with Self-Determination Theory in
mind (Pianta et al., 2008), the measure is typically used as a comprehensive observation
tool that extends beyond assessing the behaviors that are supportive of relatedness,
competence, and autonomy. Because of this measure’s versatility and widespread use,
this study will provide a structure through which this tool can be streamlined to create a
measure of need-supportive classrooms, in particular, which can be useful to researchers
interested in studying Self Determination Theory across all school years.
Motivational Development across the Kindergarten Transition
The current study will also fill a gap in the research literature regarding
motivation and engagement across the kindergarten transition. Although previous studies
have examined socio-emotional skills at kindergarten entry as a predictor of later
outcomes (Duncan et al., 2007; Claessens et al., 2009; Li-Grining et al., 2010), and other
studies have examined the predictors of these approaches to learning in preschool
(Dominguez et al., 2010; Dominguez et al., 2011), it remains to be seen how motivational
approaches to learning change across the kindergarten transition. This is especially
important because while socio-emotional approaches at kindergarten entry are a
consistent predictor of later academic achievement, it may be that children's motivation
and engagement suffer during the transition to kindergarten (Rimm-Kaufman & Pianta,
2000; Ladd et al., 2000).
For Whom is Need Support Important?
Finally, this study will examine not just the contexts that predict a successful

40
transition from preschool to kindergarten in supporting children’s motivation, but it will
also identify the students for whom these contexts are most salient. Because the
achievement gap is particularly large for students from low-income families, this study
will primarily track children who belong to that demographic, to determine whether the
processes suggested by Self Determination Theory apply to children from this
background at this age. Additionally, the study will determine whether a need-supportive
environment differentially impacts students with differing maternal education levels.
Finally, there is some evidence to suggest that students who are younger at kindergarten
entry and students who are male may be at risk for low socio-emotional development by
kindergarten entry; as such, the impact of need support on students with these
characteristics will also be examined.
Research Questions and Hypotheses
Guided by the previous literature review, the following section will outline the
research questions and hypotheses of the current study.
Research Question One. How do motivation, engagement, and disaffection
change from preschool to Kindergarten?
Hypothesis One. The kindergarten transition is difficult time for many
children (Rimm-Kaufman & Pianta, 2000), and there is some evidence to suggest that
while children may gain in motivation and engagement during preschool (Dominguez et
al., 2010), these attitudes and behaviors may begin to decline upon entering kindergarten
(Ladd et al., 2000). It is hypothesized that, on average, children’s motivation and
engagement will decrease between preschool and kindergarten, while disaffection will
increase.
41
Research Question Two. Does classroom need support in preschool predict
students’ concurrent levels of motivation, engagement, and disaffection?
Hypothesis Two. Research has shown that classrooms high in warmth,
autonomy support, and structure support students’ needs for relatedness, autonomy, and
competence (Stroet et al, 2013). This, in turn, is expected to lead to high motivation and
engagement (Ryan & Deci, 2000). Because of this, it is expected that students in
preschools that are highly need supportive will have high motivation and engagement
during preschool, while they will have low disaffection.
Research Question Three. Are changes in motivation, engagement, and
disaffection across the kindergarten transition more pronounced for children who
experience greater levels of social and economic risk?
Hypothesis Three. Researchers have argued that the achievement gap
between low-SES children and their high-SES peers is due, in large part, to differential
experiences during their time at home (Alexander et al., 2007). While students from all
backgrounds have parallel trajectories of achievement during the school year, students
from low-SES backgrounds tend to lag behind their high-SES peers in summer learning,
and this pattern holds true to a lesser degree for the achievement gap between White
students and their Black and Hispanic peers (Burkam, Ready, Lee, and LoGerfo, 2004).
It seems that much of the widening of achievement gaps occurs during times when
students are not in school. It may be that these processes occur the same way for
motivation and engagement as they do for achievement, meaning children from high-risk
backgrounds would tend to lose more motivation during times when they are not in
school (e.g. the break between preschool and kindergarten). Because of this, it is

42
hypothesized that students from backgrounds that put them at higher risk for low
socioemotional development will tend to lose more motivation and engagement while
simultaneously gaining more disaffection across the kindergarten transition.
Research Question Four. Are the levels of relatedness, autonomy, and
competence support in preschool classrooms positively associated with children’s
development of motivation and engagement across the kindergarten transition?
Hypothesis Four. It is expected that students who have been in highly
need supportive environments will lose less motivation across the kindergarten transition
than those in less need-supportive classrooms. As students' needs for autonomy,
competence, and relatedness are fulfilled, they should develop views of themselves as
competent, cared for, and in control of their own outcomes. This, in turn, is expected to
buffer students from the potentially damaging effects of a stressful kindergarten
transition. For this reason, it is expected that high need support will buffer the loss of
motivation and engagement across the kindergarten transition.
Research Question Five. Does motivational support during preschool buffer
losses in motivation and engagement and reduce gains in disaffection across the
kindergarten transition for children with specific demographic risk factors?
Hypothesis Five. Because previous research has shown that extra
supports during the kindergarten transition are more beneficial for those students who are
at-risk for low kindergarten readiness (Schulting et al., 2005; LoCasale-Crouch et al.,
2008), it is predicted that higher levels of need support will be especially protective for
students whose personal and background characteristics put them at risk for low socio-
emotional development upon kindergarten entry.

43
Chapter Four: Preliminary Measurement Work
In order to test theoretically attuned models of the development of engagement
and disaffection, it was first necessary to adapt existing measures to represent classroom
support of psychological needs as well as student engagement and disaffection. The
following section details the methods through which these measures were adapted.
The CLASS as a Measure of Need Support
In order to answer research questions pertaining to levels of preschool classroom
need support, it was first necessary to determine which dimensions of the CLASS best
aligned with Self Determination Theory. To ensure that the final measure of need support
was theoretically grounded, a systematic analysis of the content of the CLASS was
conducted to align its specific dimensions of the quality of classroom interactions with
those dimensions derived from Self Determination Theory that have been identified as
supporting students’ motivation and engagement.
The CLASS observation procedure requires observers to make ratings about three
overall domains of classroom quality-- emotional support, classroom organization, and
instructional support. Each of these domains is comprised of three or four dimensions
(e.g. Positive Climate, Behavior Management, and Quality of Feedback) that represent
more nuanced types of quality. In order to rate these dimensions, observers pay attention
to indicators of classroom quality that demonstrate a given dimension within a classroom
(e.g. the indicators for the Positive Climate dimension include evidence of relationships,
positive affect, positive communication and respect). In order to make judgments about
these indicators, observers are trained to recognize teacher and student behaviors, which
are individual instances of interactions that relate to the indicator. While CLASS ratings
44
are made only at the dimension level, this rubric represents quality at four different
levels, extrapolating from individual behaviors all the way up to the domain level.
Because the dimension level is the most nuanced level at which rating information
is available, the current study asked a focus group to use the indicators of each dimension
to determine how closely that dimension aligned with Self Determination Theory.
Process. A focus group of two professors and seven graduate students, who have
expertise in the theories of motivation and engagement and the measures of teacher
behaviors that best support children’s needs, was convened to assess which of the
dimensions measured by the CLASS best aligns with each component of the motivation
and engagement identified in Self Determination Theory. Each participant was provided
a copy of the CLASS scoring guide (Pianta et al., 2008), which contains details about all
10 CLASS dimensions (e.g. “positive climate,” which measures the overall positivity of
the class) and each of four indicators within each dimension (e.g. “positive
communication,” “positive affect,” “relationships,” and “respect”, each of which
represents just one way in which a classroom's climate can be positive).
Before any discussion about the dimensions occurred, participants went through
the CLASS scoring guide, independently noting which self-determination need or needs
was supported or inhibited by each indicator. Because not all indicators were aligned
with the Self Determination framework, participants were encouraged to leave any
indicator blank that they felt did not fit the theory. Considering their ratings of the
indicators, the participants then noted which psychological need or needs, if any, they felt
were supported by each dimension as a whole.
After rating each dimension independently, the group then discussed their ratings

45
and came to a consensus about each dimension. When compared with the participants'
independent ratings, the consensus that the focus group arrived upon reflected the
opinions of the majority of the individuals. The results from the focus group are reported
in the following subsections. Because not all participants rated each dimension or
indicator, some items will not have nine ratings.
Content Analysis.
Positive Climate. All nine participants agreed that three or more of the
Positive Climate indicators represented classroom-wide warmth, which supports students'
need for relatedness. This is reflected in the “relationships” indicator, on which a high
score means that “teacher and students enjoy warm, supportive relationships with one
another.” It is further reflected in the “positive affect” indicator, in which a high score
indicates that there is high level of positive affect between the teacher and/or students.
Warmth was also indicated by the “positive communication” indicator, in which a high
score means high frequency of positive communications among teachers and students.
The participants were split with regards to the final indicator, “respect”. Some of the
participants felt that respect between teachers and students was most supportive of
relatedness, while others felt that respect could also support students' autonomy. Upon
discussion, participants agreed that despite this small discrepancy in opinion regarding
the respect indicator of Positive Climate, the dimension as a whole represented warmth
and supported students’ need for relatedness.
Negative Climate. The focus group's consensus regarding the Negative
Climate dimension placed this dimension in both the realm of relatedness and autonomy:
the behaviors expressed by teachers and students in this dimension represented behaviors

46
that would create a harsh, coercive environment that would undermine students'
development of both needs. The first indicator, “negative affect,” represented irritability,
anger, and aggression between teacher and students. Six focus group participants felt this
indicator best described an environment of rejection that would undermine students' sense
of relatedness, while two participants felt this indicator represented a coercive style that
would undermine students' sense of autonomy. This split in opinion continued to the next
indicator, “punitive control,” which represents an environment in which a teacher yells or
makes threats to establish control over the classroom. Five participants felt this typified a
coercive environment that would undermine students' autonomy, while three argued that
this again demonstrated an environment of high rejection that would undermine students'
relatedness. The next indicator, “sarcasm/disrespect,” which described an environment
where there is little respect between teacher and students, also seemed to represent both
types of need support: seven participants felt this best aligned with an environment that
would hinder relatedness, while two felt it most aligned with the autonomy dimension.
The same was found for the final indicator, “severe negativity,” which measured the
presence of bullying and victimization in a class. Upon discussion of these ratings, the
group agreed that both perspectives were theoretically valid, and it was determined that
this dimension represented a mix of rejection and coercion that would undermine
students' sense of both relatedness and autonomy.
Teacher Sensitivity. The focus group agreed that the Teacher Sensitivity
dimension also contributed to the fulfillment of multiple psychological needs. The
behaviors observed in this dimension were both indicative of high classroom warmth and
effective structure, which support relatedness and competence, respectively. The first

47
indicator, “awareness,” represented a classroom in which teachers are aware of which
students require special needs and support. Four participants felt this aligned with a well-
structured class supportive of students' competence, two felt this represented an
environment supportive of relatedness, and two rated this indicator as supportive of both
competence and relatedness. The second indicator, “responsiveness,” included behaviors
where teachers acknowledge student emotions, provide comfort and assistance, and
provide individual support to students. This indicator seemed to include aspects of all
three types of need support: four participants felt this represented a well-structured
environment that supported competence development, three rated this as an environment
high in warmth and supportive of relatedness, and two noted that the individual support
was autonomy supportive. The third indicator, “addresses problems,” is rated high when
a teacher effectively helps to resolve students' problems. Five participants rated this as
representative of a well-structured environment supportive of competence. Two felt this
represented teachers' warm responsive behavior that supported students' relatedness,
while one left this indicator blank. The final indicator, “student comfort,” described an
environment in which students freely seek support from and share ideas with the teacher.
Five participants felt this was indicative of a warm environment that is supportive of
students' relatedness, while three felt that it represented both relatedness and autonomy
support.
Reviewing these ratings in the discussion group, it was clear that this dimension
did not represent one pure form of need support. While the first three indicators were
most often categorized as supportive of structure, sizable minorities of participants felt
these indicators also showed relatedness support. In light of overwhelming agreement

48
that the fourth indicator represented relatedness support, it was agreed that this dimension
as a whole seemed to represent both structure and relatedness. Some participants felt that
aspects of the “responsiveness” and “student comfort” indicators seemed supportive of
autonomy. However, it was agreed that these components of this dimension were
relatively minor in comparison with the overarching theme of competence and
relatedness support.
Regard for Student Perspectives. It took less than a minute for the focus
group to arrive at a consensus on the Regard for Student Perspectives dimension: each of
the four indicators clearly supports students' need for autonomy. There was full
agreement on each part of this dimension. The first indicator, “flexibility and student
focus,” was rated highly when instruction is guided towards students' interests and
sensitive to students' ideas, which are both behaviors in line with autonomy support. The
“support for autonomy and leadership” indicator was also aligned with autonomy
support, as the name suggests. The third indicator is “student expression,” and it is rated
highly when students have many opportunities for self-expression, which again allows
students' school experience to be authentic and meaningful, supporting their autonomy.
Finally, the “restriction of movement” indicator is high when students are allowed to
move freely during activities, again allowing for some degree of student freedom.
Behavior Management. Eight of the nine participants agreed that the
Behavior Management dimension represented mostly structure, with one participant
leaving the dimension blank. This consensus was also reflected in further discussion.
The first indicator, “clear behavior expectations” refers to the provision of consistent
classroom structure, which is supportive of students' competence. The next indicator,

49
“proactivity,” also echoes this. A high score on this indicator represents high teacher
proactivity and effective behavioral monitoring in the classroom, which further feeds into
competence-supportive structure. Similarly, “redirection of misbehavior” refers to
positivity in behavioral management, reflecting the positive encouragement dimension of
structure provision. The final indicator, “student behavior,” did not reflect structure
provision. This indicator reflects the degree to which students comply with classroom
expectations. While this indicator does not directly reflect the structure dimension, an
environment in which students behave appropriately may demonstrate that teachers'
structure provision has been successful.
Productivity. Six of the nine participants agreed that the Productivity
dimension also represented a well-structured classroom that was supportive of students'
competence, with one participant rating it as autonomy support and two participants
leaving the dimension blank. The first indicator, “maximizing learning time,” represents
a well-paced classroom in which activities run efficiently and disruptions are few. Six
participants felt this indicator most closely aligned with competence support, while one
felt it represented an autonomy supportive environment. The next indicator, “routines,”
indicates a classroom in which every student knows what is expected of them. Four
participants rated this as indicative of structure, while three also felt that this represented
a classroom that is supportive of students' autonomy. The next indicator, “transitions,”
was rated as high when transitions are quick and efficient. Five participants left this
dimension blank, revealing in later discussion that they did not feel this aligned well with
any need, while two rated this as supportive of students' competence. Finally, the last
dimension, “preparation,” represented teachers' level of preparation for classroom

50
activities. Ratings of this indicator were also mixed, with four participants leaving it
blank and three rating it as supportive of competence.
In discussion, it was agreed that while much of the behavior measured by this
dimension did not seem to be aligned with Self Determination Theory, on the whole,
most of the indicators seemed to represent a well-structured classroom that should
support students' competence. While there did seem to be some elements of autonomy
support in this dimension, the group's consensus was that this dimension best represented
competence support.
Instructional Learning Formats. The Instructional Learning Formats
dimension was one of the more complex dimensions of the CLASS in terms of its ties to
Self Determination Theory. After rating and lengthy discussion, the focus group agreed
that this dimension theoretically aligned with not only all three psychological needs but
also with theoretical outcomes of those needs' fulfillment. Seven participants chose not
to rate the dimension as a whole, while two rated it as supportive of autonomy. Ratings
of each indicator were highly varied; therefore, only the final consensus regarding each
indicator will be reported here.
The first indicator, “effective facilitation,” is rated as high when teachers facilitate
students' participation and involvement in classroom activities. This indicator was seen
as supportive of all three needs: when scores were high, teachers showed that they valued
students, which should show warmth and bolster relatedness. In classrooms that scored
high on this indicator, teachers used effective questioning and structured activities well,
supporting students' competence. Furthermore, providing opportunities for students to
actively participate in class is supportive of their autonomy. Finally, this indicator

51
represents high student engagement, a theoretical outcome of high need support. The
second indicator, “variety of modalities and materials”, represented a classroom in which
teachers use a variety of methods to effectively interest students and increase
participation. This indicator, like the last one, represented an intersection of need support
that was well-structured and autonomy-supportive. The next indicator, “student interest,”
represented students' active participation. All participants agreed that this seemed to be a
pure measure of behavioral engagement. Finally, “clarity of learning objectives” refers to
a classroom in which students are aware of the purpose of their activities. The group
agreed that this was both a sign of high structure and clarity and also of an autonomy-
supportive environment in which students felt that their activities were meaningful.
Overall, the group agreed that this dimension did not align with any particular dimension
of Self Determination Theory but seemed to be supportive of all three needs.
Concept Development. The consensus of the focus group was that the
dimension of Concept Development was most closely aligned with autonomy support,
but that this dimension also included a substantial amount of information that was not
aligned with any form of need support. The first indicator, “analysis and reasoning,”
referred to teachers' use of activities that encourage analysis and reasoning. Six
participants left this item blank, indicating that it did not clearly align with any
psychological need. Three participants, however, felt that this indicator was indicative of
structure and supported competence. The second indicator, “creating,” was rated highly
when students often had opportunities to generate their own ideas. Eight participants
agreed that this indicator was supportive of students' autonomy, while one participant left
the item blank. The next indicator, “integration,” represented the degree to which

52
teachers link concepts and activities to one another. Seven participants did not rate this
indicator. The two participants that felt this item aligned with a psychological need
agreed that this item represented autonomy. Finally, the “connections to the real world”
indicator, which represents the degree to which concepts are applicable to students' lives,
seemed to represent autonomy. Seven participants agreed that this item was indicative of
autonomy, while two did not feel that it aligned with Self Determination Theory. Upon
further discussion, it was agreed that parts of this dimension represented an autonomy
supportive classroom environment, while other parts seemed to not directly align with the
theory.
Quality of Feedback. Like the Instructional Learning Formats
dimension, the Quality of Feedback dimension seemed to include support for all three
psychological needs. While three participants thought that the overall dimension
represented structure, others' ratings varied, and in further discussion, the group's
consensus was that all three needs were represented by this dimension. Because ratings
of each indicator varied considerably, only the final agreement about each indicator will
be described here.
The first indicator, “scaffolding,” represents a classroom in which teachers
scaffold students who are having difficulties. The group agreed that this scaffolding is
supportive of both students' sense of competence and autonomy. The next indicator,
“feedback loops,” describes the frequency of back-and-forth exchanges between teachers
and students. This acknowledgment from the teacher may support students' development
of relatedness, while quality feedback may also support a sense of competence.
Furthermore, this active engagement with students' ideas may bolster their autonomy.
53
These same processes seem to underlie the ways in which the next indicator, “prompting
thought processes,” impacts students' fulfillment of their psychological needs. A high
score in this indicator indicates that teachers prompt students to think deeply about their
answers to questions. It was agreed that this indicator should support competence,
autonomy, and relatedness. The next indicator, “providing information,” represented the
degree to which teachers provide additional information to expand students'
understanding of concepts. It was agreed that this indicator represents structure and is
supportive of competence. Finally, “encouragement and affirmation” represents the
degree to which teachers offer encouragement that increases students' participation. This
is another complex indicator: clearly, encouragement and affirmation are warm behaviors
that may support students' relatedness. However, through affirming student participation,
a teacher may create an environment in which students feel that their participation is
meaningful, which would support their need for autonomy.
Language Modeling. In both discussion and ratings, it was agreed that
this dimension did not directly align with Self Determination Theory. The classroom
characteristics represented in this dimension seemed to be supportive of specific
academic development rather than of motivational outcomes. There was near-unanimous
agreement on each indicator. The first indicator, “frequent conversations,” represented
how often conversations occurred in the classroom. The second, “open-ended questions,”
refers to the degree with which teachers ask open-ended questions instead of closed-
ended questions. The next indicator is “repetition and extension,” which is rated as high
when teachers often repeat and elaborate on student responses. “Self- and Parallel Talk”
refers to the degree to which the teacher maps his or her own and student actions using

54
words. Finally, “advanced language” represents the sophistication of language that
teachers use with students. Each of these indicators targets language development
specifically, and while some of these behaviors may be supportive of psychological
needs, this represents a small amount of the variance that can be expected in scores on
this dimension.
Content Analysis- Interpretation. The results of the focus group demonstrated
that the majority of the dimensions in the CLASS are theoretically aligned with one or
more components of Self Determination Theory. However, many of those dimensions
that are aligned with Self Determination Theory do not support a single need but rather
are supportive of two or three needs. In deciding how to best use the CLASS to measure
need support, two approaches could have been taken.
The first approach that this study might have used would be to include in the final
measure of need support every dimension that aligned with Self Determination Theory.
While this approach would include the full scope of variance in need support that is
reported in the CLASS, it would also run the risk of introducing noise to the data by
including indicators that are not well-aligned with the overall theory.
The second approach, which this study will take, is to use in the final measure
only those dimensions that are best aligned with relatedness, autonomy, and competence
support. While this approach runs the risk of losing some of the information available
about psychological need support in the CLASS, it has the advantage of being most
closely aligned with the overall theory.
After deciding to use this approach, the next decision addressed the question:
which measures most closely align with the three needs? For relatedness and autonomy,

55
the answer to this question was clear, since only one dimension purely aligned with each
of these needs. For relatedness support, this dimension was Positive Climate. For
autonomy support, this dimension was Regard for Student Perspectives.
Two dimensions theoretically aligned with competence support--Behavior
Management and Productivity. Comparing the results of the focus group regarding each
of these dimensions, behavior management emerged as being more closely aligned to the
dimension of competence support. In initial ratings, more participants agreed that this
dimension represented structure, and this confidence held true in participants' ratings of
each sub-dimension. Finally, it was decided that because these dimensions are highly
correlated, they would be combined into an overall measure of need support instead of
being used individually. A preliminary analysis found that this three-item measure of a
need supportive preschool classroom achieved an internal consistency reliability
(Cronbach’s alpha) of 0.72.
The Learning Behavior Scale as a Measure of Engagement and Disaffection
To answer questions regarding students' engagement and disaffection, it was
necessary to adapt the Learning Behavior Scale (McDermott et al., 2002) for use as a
measure of engagement. This process was completed in two steps. First, a theory-driven
a priori approach was taken, in which items were sorted into categories that align with the
dimensions of engagement and disaffection that are observable in older students (Skinner
et al., 2009). However, because dimensional analysis of disaffection has been conducted
mostly with older students, it is possible that disaffection looks different in younger
students. Because of this, a second step used a data-driven exploratory approach to
determine whether any new types of disaffection were distinguishable within this young

56
sample.
Step one: Theory-directed Confirmatory Factor Analyses. Items from the
PLBS/LBS were sorted into four different categories, which represent the types of
engagement and disaffection that have been observed in older children: engagement,
frustrated disaffection, enervated disaffection, and anxious disaffection (Skinner et al.,
2009; for definition, see p 11). These four scales were then tested using confirmatory
factor analysis and were evaluated using the following criteria: models with non-
significant chi square tests of model fit, CFIs above .97, and RMSEAs below .05 were
considered well-fitting models. Factor loadings were examined, and items with factor
loadings above .3 were considered acceptable. Cronbach's alpha was also calculated for
each scale. The results of these analyses are reported in the following section.
Engagement. Four items were identified that represent engagement:
“pays attention to what you say,” “sticks to an activity for as long as can be expected,”
“cooperates in group activities,” and “shows a lively interest in activities.” A
confirmatory factor analysis showed that the proposed measure for engagement fit the
data well for both the PLBS (χ2(2)=3.806, p=.149; CFI=.996, RMSEA=.042), and the
LBS (χ2(2)=.928, p=.629 CFI>.99, RMSEA<.001). Factor loadings for this scale can be
found in Figure 1. Reliability was acceptable for this scale in both the PLBS (α=.77) and
LBS (α=.72).
Frustrated disaffection. Five items were identified as representing
frustration: “is unwilling to accept help even when an activity proves too difficult,”
“bursts into tears when faced with a difficulty,” “gets aggressive or hostile when
frustrated,” “doesn't achieve anything constructive when in a mopey or sulky mood,” and

57
“is willing to accept needed help (reverse).”
Figure 1. Factor Loadings: Engagement
PLBS
LBS
Item 1: Pays attention to what you sayItem 2: Sticks to an activity as long as can be expected for a child of this ageItem 3: Cooperates in group activitiesItem 4: Shows a lively interest in the activities
A confirmatory factor analysis showed that the proposed measure for frustration
did not fit the data well in the PLBS (χ2(5)=23.985, p<.001; CFI=.931; RMSEA=.087).
However, the structure did seem to fit the data well in the LBS (χ2(5)=6.22, p=.285;
CFI=.993; RMSEA=.022). Factor loadings for these analyses can be found in Figure 2.
Reliability of this measure in the PLBS was lower than acceptable (α=.66), while the

58
reliability of this measure in the LBS was extremely low (α=.58).
Figure 2. Factor Loadings: Frustration Model One
PLBS
LBS
Item 1: Gets aggressive or hostile when frustratedItem 2: Is unwilling to accept help even when an activity proves too difficultItem 3: Is willing to be helpedItem 4: Doesn't achieve anything constructive when in a mopey or sulky moodItem 5: Bursts into tears when faced with a difficulty
An analysis of the factor loadings showed that the item “bursts into tears when
faced with a difficulty” had a particularly low factor loading (.23) in the LBS. The
results of the reliability analysis also indicated that this item was not highly correlated
with the rest of the items in the scale and reliability would improve if this item were
deleted. From this examination, it was concluded that this item likely should be excluded

59
from the scale.
Figure 3. Factor Loadings: Frustration Model Two
PLBS
LBS
Item 1: Gets aggressive or hostile when frustratedItem 2: Is unwilling to accept help even when an activity proves too difficultItem 3: Is willing to be helpedItem 4: Doesn't achieve anything constructive when in a mopey or sulky mood
A new confirmatory factor analysis was performed on this scale including only
the items “is unwilling to accept help even when an activity proves too difficult,” “is
willing to be helped,” gets aggressive or hostile when frustrated,” and “doesn't achieve
anything constructive when in a mopey or sulky mood.” The results of this analysis
showed improved model fit (PLBS: χ2(2)=6.520, p=.038; CFI=.978, RMSEA=.067; LBS:

60
χ2(2)=.071, p=.965, CFI>.99, RMSEA<.001). These results showed that the fit of this
measure in the PLBS was marginal, while the fit in the LBS was excellent. Factor
loadings for this measure can be found in Figure 3.
Reliability analyses were conducted indicating that reliability of this scale was
lower than would be desired (PLBS: α=.64; LBS: α=.63). Despite this, this scale was
included in further analyses, because the construct of emotional disaffection through
frustration is theoretically interesting, and fit and reliability of this measure were close to
acceptable.
Anxious disaffection. Four items were identified that represented
anxiety: “is reluctant to tackle a new activity,” “seems to take refuge in helplessness,”
“uses headaches or other pains as a means of avoiding participation,” and “bursts into
tears when faced with a difficulty.” Confirmatory factor analysis showed that the fit of
this scale was marginal in the PLBS (χ2(2)=9.159, p=.010; CFI=.964, RMSEA=.084) and
good in the LBS (χ2(2)=2.801, p=.246; CFI=.993; RMSEA=.028). Factor loadings can be
found in Figure 4. An examination of the factor loadings show that the factor loading for
“bursts into tears when faced with a difficulty” is unacceptably low in the LBS.
Reliability was low in both the PLBS (α=.605) and the LBS (α=.517).
An examination of inter-item correlations and factor loadings indicated that
removing the item “bursts into tears when faced with a difficulty” would improve the
reliability of the LBS; however, it would reduce the reliability of the PLBS. Because fit
and reliability for this scale were poor and could not be improved, it was not included in
further analyses.

61
Figure 4. Factor Loadings: Anxious Disaffection
PLBS
LBS
Item 1: Is reluctant to tackle a new activityItem 2: Seems to take refuge in helplessnessItem 3: Uses headaches or other pains as a means of avoiding participationItem 4: Bursts into tears when faced with a difficulty
Enervated disaffection. Five items were identified that might represent
enervated disaffection: “says task is too hard without making much effort to attempt it,”
“adopts a don't care attitude to success or failure,” “shows little desire to please you,”
“shows little determination to complete an activity, gives up easily,” and “is too lacking
in energy to be interested in anything or to make much effort”. Confirmatory factor
analysis indicated that this model did not fit the data well in the PLBS (χ2(5)=32.012,

62
p<.001; CFI=.957; RMSEA=.103) or the LBS (χ2(5)=43.099, p<.001; CFI=.934;
RMSEA=.123). Factor loadings were all acceptable and are reported in Figure 5.
Reliability was high in both the PLBS (α=.796) and the LBS (α=.811).
Figure 5. Factor Loadings: Enervated Disaffection
PLBS
LBS
Item 1: Says task is too hard without making much effort to attempt itItem 2: Adopts a don’t care attitude to success or failureItem 3: Shows little desire to please youItem 4: Shows little determination to complete an activity, gives up easilyItem 5: Is too lacking in energy to be interested in anything or to make much effort
Examination of inter-item correlations and factor loadings did not identify any
item that clearly did not fit with this scale. Because of this, the scale was not modified
but was excluded from further analyses.

63
Step Two: Principal Components Analysis. Because preschool and
kindergarten-aged children may have patterns of disaffection that are qualitatively
distinct from those seen in older children, a principal components analysis was conducted
on the disaffection items that either did not theoretically align with frustrated, enervated,
or anxious disaffection or that were in those a priori scales that failed to meet CFA and
reliability criteria for inclusion in further analyses.
Item selection for analysis. First, all items that were included in the
engagement and frustration scales were eliminated from the pool of items that represent
disaffection. Furthermore, the item “bursts into tears when faced with a difficulty” was
excluded because it had low correlations with most other disaffection items, with the
exception of those included in the frustration scale. Eleven items that might represent
disaffection were left: “says task is too hard without making much effort to attempt it”;
“is reluctant to tackle a new activity”; “adopts a don't care attitude to success or failure”;
“seems to take refuge in helplessness”; “shows little desire to please you”; “is distracted
too easily by what is going on in the room, or seeks distractions”; “is very hesitant in
talking about his or her activity”; “shows little determination to complete an activity,
gives up easily”; “uses headaches or other pains as a means of avoiding participation”; “is
too lacking in energy to be interested in anything or to make much effort”; and “tries hard
but concentration soon fades and performance deteriorates.”
Principal Components Analysis. A Principal Components Analysis was
conducted with an oblique rotation on both the PLBS and the LBS for these eleven items.
The results of this analysis can be found in Table 1 (PLBS) and Table 2(LBS).
An examination of the results of this analysis revealed that ten items grouped
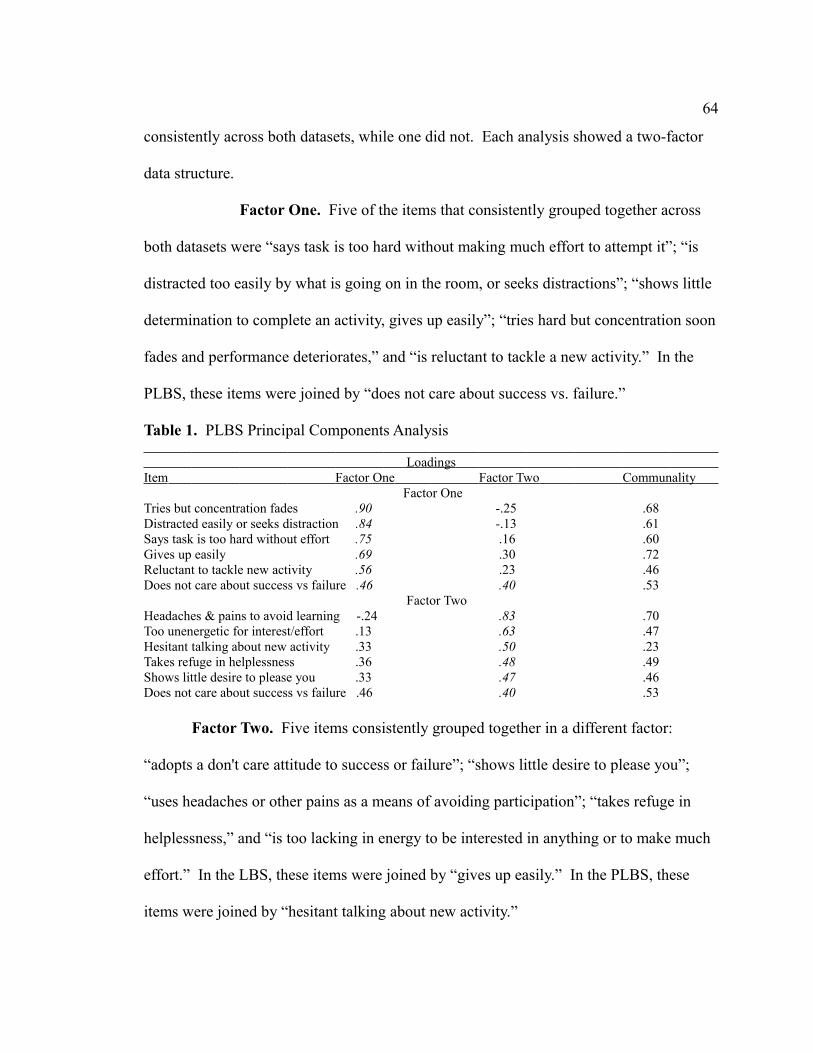
64
consistently across both datasets, while one did not. Each analysis showed a two-factor
data structure.
Factor One. Five of the items that consistently grouped together across
both datasets were “says task is too hard without making much effort to attempt it”; “is
distracted too easily by what is going on in the room, or seeks distractions”; “shows little
determination to complete an activity, gives up easily”; “tries hard but concentration soon
fades and performance deteriorates,” and “is reluctant to tackle a new activity.” In the
PLBS, these items were joined by “does not care about success vs. failure.”
Table 1. PLBS Principal Components Analysis Loadings Item Factor One Factor Two Communality
Factor OneTries but concentration fades .90 -.25 .68Distracted easily or seeks distraction .84 -.13 .61Says task is too hard without effort .75 .16 .60Gives up easily .69 .30 .72Reluctant to tackle new activity .56 .23 .46Does not care about success vs failure .46 .40 .53
Factor TwoHeadaches & pains to avoid learning -.24 .83 .70Too unenergetic for interest/effort .13 .63 .47Hesitant talking about new activity .33 .50 .23Takes refuge in helplessness .36 .48 .49Shows little desire to please you .33 .47 .46Does not care about success vs failure .46 .40 .53
Factor Two. Five items consistently grouped together in a different factor:
“adopts a don't care attitude to success or failure”; “shows little desire to please you”;
“uses headaches or other pains as a means of avoiding participation”; “takes refuge in
helplessness,” and “is too lacking in energy to be interested in anything or to make much
effort.” In the LBS, these items were joined by “gives up easily.” In the PLBS, these
items were joined by “hesitant talking about new activity.”

65
Table 2. LBS Principle Components Analysis
Loadings Item Factor One Factor Two Communality
Factor OneTries but concentration fades .91 -.24 .70Distracted easily or seeks distraction .73 .12 .59Says task is too hard without effort .69 .13 .57Reluctant to tackle new activity .62 .31 .66Gives up easily .51 .49 .72Hesitant talking about new activity .35 .30 .31
Factor TwoShows little desire to please you .03 .72 .52Takes refuge in helplessness .09 .72 .58Too unenergetic for interest/effort .07 .71 .54Headaches & pains to avoid learning -.15 .66 .37Does not care about success vs failure .28 .64 .62Gives up easily .51 .49 .72
Interpretation. The patterns revealed by this analysis showed some
insight into how these two factors might be distinguishable in the data. The first set of
factors seem to represent a state of disaffection that is best characterized by trying but
giving up, or depersistence, while the second set of factors seem to mostly represent a
state of apathy or not caring.
Step Three: Confirmatory Factor Analysis. Confirmatory factor analyses were
conducted to assess how well these two new scales fit the data.
Depersistence. A confirmatory factor analysis was performed with the
five items proposed in the depersistence scale. This analysis showed that the proposed
structure did not fit the data well in either the PLBS (χ2(5)=100.355, p<.001, CFI=.882,
RMSEA=.194) or the LBS (χ2(5)=39.149, p<.001, CFI=.947, RMSEA=.116). Factor
loadings for this proposed scale can be found in Figure 6.
Reliability analysis was performed for this scale, indicating that reliability was
high for both the PLBS (α=.821) and the LBS (α=.838).

66
Figure 6. Factor Loadings: Depersistance Model One
PLBS
LBS
Item 1: Says task is too hard without making much effort to attempt itItem 2: Is distracted too easily by what is going on in the room, or seeks distractionsItem 3: Shows little determination to complete an activity, gives up easilyItem 4: Is reluctant to tackle a new activityItem 5: Tries hard but concentration soon fades and performance deteriorates
An examination of the factor loadings showed that the item “tries hard but
concentration soon fades and performance deteriorates” had the lowest factor loading of
all five items and the least amount of variance explained by the overall “giving up” factor
across both the PLBS and the LBS. Theoretically, this item may act in a double-barreled
way and also may represent issues with attention rather than emotional disaffection.
Because of this, this item was excluded from the scale.

67
Figure 7. Factor Loadings: Depersistence Model Two
PLBS
LBS
Item 1: Says task is too hard without making much effort to attempt itItem 2: Is distracted too easily by what is going on in the room, or seeks distractionsItem 3: Shows little determination to complete an activity, gives up easilyItem 4: Is reluctant to tackle a new activity
A confirmatory factor analysis was conducted with the new proposed scale,
including only the items “says task is too hard without making much effort to attempt it”;
“is distracted too easily by what is going on in the room, or seeks distractions”; “shows
little determination to complete an activity, gives up easily”; and “is reluctant to tackle a
new activity.” The fit of this new scale was improved but still marginal in the PLBS
(χ2(2)=12.773, p=.002; CFI=.981; RMSEA=.103) and good in the LBS (χ2(2)=2.961,

68
p=.228; CFI=.998; RMSEA=.031). Reliability was high for both scales (PLBS: α=.792;
LBS: α=.83). Factor loadings for this scale can be found in Figure 7. Despite its
marginal fit in the PLBS, this scale was included in further analyses.
Figure 8. Factor Loadings: Apathy Model One
PLBS
LBS
Item 1: Adopts a don’t care attitude to success or failureItem 2: Seems to take refuge in helplessnessItem 3: Shows little desire to please youItem 4: Is too lacking in energy to be interested in anything or to make much effortItem 5: Uses headaches or other pains as a means of avoiding participation
Apathy. A confirmatory factor analysis was performed to determine how
well the proposed structure of the apathy scale fit the data. The results of this analysis
indicated that fit was marginal in both the PLBS (χ2(5)= 21.106, p=.001; CFI=.963;

69
RMSEA=.080) and the LBS (χ2(5)=12.793, p=.025; CFI=.982; RMSEA=.056). Factor
loadings of this scale can be found in Figure 8. Reliability analyses indicated that
reliability for both scales was acceptable (PLBS: α=.742; LBS: α=.779).
Figure 9. Factor Loadings: Apathy Model Two
PLBS
LBS
Item 1: Adopts a don’t care attitude to success or failureItem 2: Seems to take refuge in helplessnessItem 3: Shows little desire to please youItem 4: Is too lacking in energy to be interested in anything or to make much effort
Factor loadings and interitem correlations were examined to see whether any item
seemed to not fit well with the scale. Across both the PLBS and the LBS, the item “uses
headaches or other pains as a means of avoiding participation” had the lowest factor
loadings and very low amounts of variance explained by the overall apathy factor. This

70
item also had comparatively lower inter-item correlations with the other items on this
proposed scale. Theoretically, this item involves two distinct components: “uses
headaches or other pains” and “avoids participation”, which may explain why it was not
well aligned with the other items. Because of this, the item was removed from the scale.
A confirmatory factor analysis was performed using only the items “adopts a don't
care attitude to success or failure”; “seems to take refuge in helplessness”; “shows little
desire to please you”; and “is too lacking in energy to be interested in anything or to
make much effort.” The results of this analysis indicated improved but still marginal fit
in the PLBS (χ2(2)=7.223, p=.027; CFI=.985; RMSEA=.072), while fit was good in the
LBS (χ2(2)=4.520, p=.104; CFI=.993; RMSEA=.050). Reliability was good for both
scales (PLBS: α=.733; LBS: α=.790). Factor loadings for this scale can be found in
Figure 9. Despite its marginal fit in the PLBS, this scale was included in further
analyses.
Summary. A total of four measures were adapted from the PLBS/LBS to assess
students' engagement and disaffection. The first measure, engagement, consists of items
pertaining to students' on-task behavior, cooperation, and interest in class activities. The
second measure represents frustrated disaffection and consists of items pertaining to
hostility, moodiness, and help-seeking. The third measure, depersistence, refers to
students who may try in school but quickly give up. This scale contains items relating to
students' reluctance to attempt new tasks, lack of determination in activities, and
distraction-seeking. Finally, a last measure, apathy, represents students who have low
interest in class. This scale consists of items regarding students' attitude towards learning
and lack of energy.

71
Chapter Five: Method
Data for this project were taken from the Read it Again impact study, which
evaluated the efficacy of the Read It Again language and literacy intervention program
for low-income, rural preschoolers. The original study used a cluster randomized trial, in
which schools were assigned randomly into one of three treatment conditions, to assess
the impacts of this program children’s development of literacy and language skills.
Participants
Participants in the Read It Again impact study were 506 preschool students and
their 104 teachers. These students and teachers were members of preschool classrooms
that served 4-year-old students in rural counties in Ohio, Virginia, and West Virginia. All
classrooms were located within the geographic and cultural region of the eastern United
States called Appalachia.
To recruit participants, research staff approached district or regional program
directors of preschool programs to introduce them to the study. Those who were
interested in participating were then given more detail as to the demands, benefits, and
requirements of the study. From the programs that agreed to participate in the study,
classrooms were identified that met key eligibility requirements. To participate in the
study, classrooms needed to serve at least 75% of students from low-income households,
expect at least six students to enroll who would be eligible to enroll in kindergarten the
following year, and needed to have high stability as measured by high attendance, low
rates of student mobility, and low rates of staff turnover.
The lead teachers of the classrooms that met these criteria were approached over
the phone or through email. Those who were interested in participating in the program

72
met with research staff to discuss the program in detail. Teachers who agreed to
participate filled out consent forms. In total, 104 teachers agreed to participate in the
study.
Following teacher recruitment, students were recruited to the study at the
beginning of the school year. At this time, lead teachers sent students home with a
description of the study, a demographic questionnaire, and a consent form. An average of
13.7 students per classroom attained parental consent. To be eligible for the study,
students had to be expected to enroll in kindergarten the following year, have no known
disability, and speak English as a primary language. From the pool of students that met
the eligibility criteria and had parental consent, five students per classroom were
randomly selected to participate in the study.
Of these students, only those students who had complete kindergarten data were
included. This left 333 kindergarten students (46% male) and their 98 preschool teachers.
The children were largely white (90%), and many came from low-income
backgrounds. The average family income was $28,912 (SD=$2,365), and around half of
the sample came from families whose income was lower than $20,000 a year (47.2%).
On average, children were 53.1 months of age upon preschool entry (SD=3.22).
Procedures
Three cohorts of students and teachers participated in this study during three
consecutive school years (2008-09; 2009-10; and 2010-11). These students were
followed from the fall of their final preschool year to fall of their kindergarten year.
Preschool classroom quality was assessed three times during the year, in fall, winter, and
spring. Student motivational outcomes were measured during the winter of their final
73
preschool year and again during the fall of kindergarten.
Measures
Engagement and disaffection. Engagement and disaffection were measured
using and adaptation of the Learning Behaviors Scale/Preschool Learning Behaviors
Scale. The LBS/PLBS is a 29-item teacher-report measure of children's observable
classroom learning behaviors. In this scale, teachers responded to a series of questions
about children's classroom behavior. For each item, teachers reported how often students
display the given behavior on a 3 point Likert-type scale (2 = Most often applies, 1 =
Sometimes applies, 0 = Does not apply). Students' preschool teachers completed the
PLBS during the winter of the preschool year. Students' Kindergarten teachers completed
the LBS during the fall of the Kindergarten year.
Students' motivation was assessed with the competence motivation scale
of the LBS/PLBS, which represents the degree to which children approach learning
activities and try new tasks in the face of challenge. Sample items for this scale include
“Is reluctant to tackle a new activity,” and “Says task is too hard without making much
effort to attempt it.” Previous studies have shown that internal consistency for this
measure is high (PLBS: α=.85, McDermott, Leigh, & Perry, 2002; LBS: α=.86, Worrell,
Vandiver, & Watkins, 2001).
Students' engagement, frustration, depersistence, and apathy were assessed using
four-item scales, as described in Chapter Four. The items and reliabilities for each of
these scales is presented in Table 3.
Need support. The level of relatedness, autonomy, and competence support
provided in the preschool classroom context were assessed using dimensions of the

74
CLASS. A content analysis of the CLASS (as described in Chapter Four) informed the
development of a measure of a need supportive classroom. Procedures for conducting the
observations were as follows. Observers entered classrooms and rated all dimensions on
a 1-7 Likert-type scale, in which 1-2 represents low levels, 3-5 represents moderate
levels, and 6-7 represents high levels of the given classroom behavior. The CLASS was
assessed at three points during the pre-Kindergarten year, during the Fall, Winter, and
Spring. For the purposes of this study, scores were averaged across these three time
points to give a full representation of the overall level of contextual need support over the
course of the year.
Scores from the dimensions of positive climate (warmth), regard for student
perspectives (autonomy support), and behavior management (structure) were averaged
together to create an overall measure of need support. Reliability analysis indicated that
this measure had adequate internal consistency (alpha=.72).
Child characteristics. Parents completed a brief demographic survey at the
beginning of students' pre-Kindergarten year in which they reported on child and family
characteristics. Students' age was reported in months (M=52.9, SD=3.18). Gender was
reported (48% of participants were male). Finally, parents reported on maternal
education in years of schooling.

Tab
le 3
. It
ems
and
Rel
iabi
lity
for
Eng
agem
ent a
nd D
isaf
fect
ion
Sca
les
Ite
ms
P
LB
S
α
L
BS
α
E
ngag
emen
t
.77
.72
1.
Pay
s at
tent
ion
to w
hat y
ou s
ay2.
Stic
ks to
an
activ
ity
for
as lo
ng a
s ca
n be
exp
ecte
d3.
Coo
pera
tes
in g
roup
act
ivit
ies
4.S
how
s a
livel
y in
tere
st in
act
ivit
ies
Fru
stra
tion
.6
4
.63
1.Is
unw
illin
g to
acc
ept h
elp
even
whe
n an
act
ivit
y pr
oves
too
diff
icul
t2.
Is w
illin
g to
be
help
ed3.
Get
s ag
gres
sive
or
host
ile
whe
n fr
ustr
ated
4.D
oesn
't ac
hiev
e an
ythi
ng c
onst
ruct
ive
whe
n in
a m
opey
or
sulk
y m
ood
Dep
ersi
sten
ce
.79
.8
31.
Say
s ta
sk is
too
hard
with
out m
akin
g m
uch
effo
rt to
atte
mpt
it2.
Is d
istr
acte
d to
o ea
sily
by
wha
t is
goin
g on
in th
e ro
om, o
r se
eks
dist
ract
ions
3.S
how
s li
ttle
det
erm
inat
ion
to c
ompl
ete
an a
ctiv
ity,
giv
es u
p ea
sily
4.Is
rel
ucta
nt to
tack
le a
new
act
ivit
y
Apa
thy
.7
3
.79
1.A
dopt
s a
don'
t car
e at
titu
de to
suc
cess
or
failu
re2.
See
ms
to ta
ke r
efug
e in
hel
ples
snes
s3.
Sho
ws
litt
le d
esir
e to
ple
ase
you
4.Is
too
lack
ing
in e
nerg
y to
be
inte
rest
ed in
any
thin
g or
to m
ake
muc
h ef
fort
.__
____
____
____
____
____
____
____
____
____
____
____
____
____
____
____
____
____
____
____
____
____
____
____
____
____
_
75

76
Chapter Six: Results
Preliminary Analyses
All data analysis was performed using SPSS statistical analysis software.
One hundred seventy-three students were missing teacher reports at kindergarten.
Logistic regression indicated that this missingness met MAR (missing at random)
assumptions, since whether or not a child had a missing LBS at kindergarten was not
dependent on any other variable in the dataset, including preschool score on the PLBS.
However, because this represented 34% of the dataset, listwise deletion was used for
these students due to concerns about imputing such a large number of datapoints. No
other variable was missing such a substantive number of datapoints, and so all of these
missing data were imputed using Full Information Maximum Likelihood estimation.
Additionally, because data were obtained from a study that included two
intervention conditions, ANOVAs were conducted to determine whether any child or
classroom characteristics or outcomes differed across study condition. The results
indicated that there was no difference between children and classrooms across conditions
for any variable included in the analyses, including child characteristics, need support,
and preschool and kindergarten motivation, engagement, and disaffection. Because of
this, classrooms from different conditions were collapsed and analyzed together. A
summary of all research hypotheses and results can be found in Appendix A.
Descriptive Analyses
Mean levels were computed for all variables of interest. Descriptive statistics for
the child level variables can be found in Table 4. These showed that in general, children
were highly engaged and had high competence motivation both in preschool and

77
kindergarten. Further examination of these variables indicated that there was a ceiling
effect for engagement in that 43.3% of students were rated at the top anchor of the
engagement scale in preschool; however, by kindergarten, this had dropped to 27.7%. A
substantive proportion of children were also rated above a 1.75 on competence
motivation in both preschool (38.1%) and in kindergarten (39.1%).
Table 4. Child Characteristics
N Mean SD DemographicMother's Education (years) 308 12.94 1.61Family Income ($) 301 28,912 2,365Age (Months) 333 53.06 3.22
Competence MotivationPreschool 320 1.62 .336Kindergarten 330 1.61 .338Difference Score 317 .004 .391
EngagementPreschool 321 1.64 .41Kindergarten 332 1.46 .47Difference Score 320 -.18 .50
FrustrationPreschool 321 .32 .38Kindergarten 333 .25 .33Difference Score 321 -.06 .55
DepersistencePreschool 321 .56 .50Kindergarten 333 .51 .53Difference Score 321 -.07 .43
ApathyPreschool 320 .29 .38Kindergarten 332 .24 .39Difference Score 319 -.05 .44
Similarly, levels of all three types of disaffection were fairly low in both
preschool and kindergarten. In preschool, 28.3% of children were rated at the bottom

78
anchor of the depersistence scale, with 39.9% at the lowest anchor of frustration and
50.6% at the lowest anchor of apathy. There was slightly more of a floor effect at
kindergarten, with 33.9% of students rated at the bottom anchor of depersistence, 50.5%
at the bottom anchor of frustration, and 60.2% at the bottom anchor of apathy.
In addition to preschool and kindergarten scores on motivation and engagement
variables, difference scores were computed to represent the degree to which each
individual child increased or decreased in motivation, engagement and disaffection across
the kindergarten transition. To do this, each individual child's preschool score was
subtracted from his or her kindergarten score for each outcome variable. In general, these
scores were slightly negative for all engagement and disaffection variables, and there
were no floor or ceiling effects found. The average difference score for competence
motivation was very close to zero.
In general, classroom levels of need support were fairly high (M=5.05); however,
there were no ceiling effects in this variable. The standard deviation for this variable was
fairly low (SD=.50), however, indicating that there was not much variance in classroom
levels of need support. Further descriptive analysis of this variable showed that the scale
had a range of 3.87-6.56: in fact, only one classroom had a need support score under 4,
which was the midpoint of the need support scale.
In addition to means, correlations were computed between child variables. These
correlations are reported in Table 5. These correlations indicate that levels of motivation,
engagement and disaffection remained moderately linked between preschool and
kindergarten (motivation: r=.325, p<.001; engagement: r=.370, p<.001; depersistence:
r=.412, p<.001; frustration: r=.269, p<.001; apathy: r=.338, p<.001). Motivation,

79
engagement and disaffection outcomes were also highly interrelated. These correlations
were extracted from the larger table and can be found in Table 6.

Tab
le 5
. C
orre
latio
ns b
etw
een
Chi
ld V
aria
bles
___
____
____
____
___
1
2
3
4
5
6
7
8
9
1
0
11
12
13
14
15
1. G
ende
r-
2. M
ater
nal E
duca
tion
-.02
8-
3. A
ge.0
46-.
043
-
4. P
resc
hool
Eng
agem
ent
-.18
2**
.230
**.0
10-
5. K
G E
ngag
emen
t-.
132*
.273
**.0
03.3
70**
-
6. E
ngag
emen
t Dif
f. .0
43.0
64-.
016
-.47
9**
.638
**-
7. P
resc
hool
Dep
ersi
st.
.228
**-.
220*
*.0
43-.
640*
*-.
407*
*.1
47**
-
8. K
G D
eper
sist
ence
.172
**-.
221*
*-.
073
-.42
4**
-.66
9**
-.26
8**
.412
**-
9. D
eper
sist
ence
Dif
f.-.
065
-.00
4-.
092
.176
**-.
256*
*-.
385*
*-.
512*
*.5
72**
-
10. P
resc
hool
Fru
stra
tion
.100
-.15
8**
.134
*-.
496*
*-.
246*
*.1
79**
.472
**.2
10**
-.22
7**
-
11. K
G F
rust
rati
on.0
81-.
089
.050
-.27
0**
-.46
2**
-.20
5**
.274
**.4
34**
.164
**.2
69**
-
12. F
rust
rati
on D
iffe
renc
e-.
030
.064
-.06
6.2
33**
-.12
7*-.
314*
*-.
208*
*.1
47**
.325
**-.
680*
*.5
24**
-
13. P
resc
hool
Apa
thy
.159
**-.
187*
*.0
04-.
683*
*-.
271*
*.3
09**
.710
**.3
70**
-.29
0**
.523
**.2
43**
-.27
7**
-
14. K
G A
path
y.1
02-.
240*
*-.
055
-.39
2**
-.54
1**
-.18
2**
.346
**.6
67**
.310
**.1
60**
.425
**.1
81**
.338
**-
15. A
path
y D
iffe
renc
e
-.0
54
-.0
54
-.0
35
.243
**
-
.237
**
-.
424*
*
-.
308*
*
.2
57**
.520
**
-
.308
**
.1
67**
.398
**
-
.564
**
.5
86**
-
80

81
Table 6. Intercorrelations between Engagement Variables______________________________________________________________________ Engagement Depersistence Frustration Apathy Comp. Mot. Engagement .370** -.669** -.462** -.541** .669**Depersistence -.640** .412** .434** .667** -.871**Frustration -.496** .472** .269** .425** -.469**Apathy -.683** .710** .523** .338** -.750**Comp. Mot. .644** -.836** -.566** -.780** .325**Note: correlations in the top half of the graph represent kindergarten; those on the bottom half represent preschool. The center line represents the correlation between preschool and kindergarten outcomes.
These analyses also show that male gender was associated with lower engagement
in both preschool and kindergarten (preschool: r=-.182, p=.001; kindergarten: r=-.132,
p=.016), while simultaneous being associated with higher depersistence in preschool and
kindergarten (preschool: r=.228, p<.001; kindergarten: r=.172, p=.002) and higher levels
of apathy in preschool (r=.159; p=.004). Male gender was also correlated with lower
competence motivation in preschool (r=-.186, p=.001).
Maternal education also showed expected patterns. High levels of maternal
education were associated with higher engagement at both preschool and kindergarten
(preschool: r=.230, p<.001; kindergarten: r=.273, p<.001), lower levels of depersistence
at both timepoints (preschool: r=-.220, p<.001; kindergarten: r=-.221, p<.001), lower
levels of frustration in preschool (r=-.158, p=.006), and lower levels of apathy in both
preschool and kindergarten (preschool: r=-.187, p=.001; kindergarten: r=-.240, p<.001).
Maternal education was associated with higher competence motivation in both preschool
and kindergarten (preschool: r=.170, p=.003; kindergarten: r=.232, p<.001).
Finally, while age was mostly uncorrelated with children’s engagement, it was
significantly correlated with preschool levels of frustration in that older students tended
to be more highly frustrated (r=.134, p=.017). Additionally, it was associated with

82
competence motivation difference score, indicating that older students tended to have
higher gain scores in competence motivation between preschool and kindergarten
(r=.121, p=.032).
Preliminary Hierarchical Linear Modeling Steps
Because participants were nested within classrooms, and both individual and
setting-level variables were evaluated, hierarchical linear modeling was used to analyze
some research questions. Hierarchical linear modeling is a statistical technique that
accounts for group dependency in data. It allows for the inclusion of both individual-
level (Level One) variables and setting-level (Level Two) variables in the same model.
Because the outcome of primary interest to this study is students' changes in competence
motivation, engagement, and disaffection, preliminary analyses were conducted on
students' difference scores between preschool and kindergarten.
These preliminary tests were run to determine how much variance in difference
scores was predicted by preschool class membership. First, one-way ANOVAs were run
to determine whether there were significant differences across groups in motivation and
engagement outcomes. Next, intercepts-only models were run. From these, intraclass
correlation coefficients (ICCs) were computed, which show how much variance in
outcome is due to group membership. In general, ICCs of greater than .1 indicate that
there is enough group dependency in the data to make multi-level modeling necessary.
Competence motivation. An ANOVA was conducted to determine whether there
were significant differences in competence motivation difference scores across children
from different preschool classrooms. This revealed that there were significant differences
in students' competence motivation difference scores across classrooms (F(95)=1.601,

83
p=.002). An intercepts-only model was run, which showed that the ICC for difference in
engagement was .227. This indicates that 22.7% of variance in children's competence
motivation difference scores was attributable to their preschool classroom membership,
representing a substantive enough amount of group dependence to require hierarchical
linear modeling as an analysis strategy.
Engagement. An ANOVA was run to determine whether there were significant
differences in engagement difference scores across children from different preschool
classrooms. This revealed that there were significant differences in students' engagement
difference scores across classrooms (F(95)=1.648, p=.001). An intercepts-only model
was run, which showed that the ICC for difference in engagement was .171. This
indicates that 17.1% of variance in children's engagement difference scores was
attributable to their preschool classroom membership, representing a substantive enough
amount of group dependence to require hierarchical linear modeling as an analysis
strategy.
Depersistence. An ANOVA was run to determine whether there were significant
differences in depersistence difference scores across children from different preschool
classrooms. This ANOVA revealed that there were significant differences in students'
depersistence difference scores across classrooms (F(95)=1.646, p=.001). An intercepts-
only model was run, which showed that the ICC for difference in giving up was .145.
This indicates that 14.5% of variance in children's depersistence difference scores was
attributable to their preschool classroom membership, representing a substantive enough
amount of group dependence to require hierarchical linear modeling as an analysis
strategy.

84
Frustration. An ANOVA was run to determine whether there were significant
differences in frustration difference scores across children from different preschool
classrooms. This revealed that there were significant differences in students' frustration
difference scores across classrooms (F(95)=1.590, p=.003). An intercepts-only model
was run, which showed that the ICC for difference in frustration was .124. This indicates
that 12.4% of variance in children's frustration difference scores was attributable to their
preschool classroom membership, representing a substantive enough amount of group
dependence to require hierarchical linear modeling as an analysis strategy.
Apathy. An ANOVA was run to determine whether there were significant
differences in apathy difference scores across children from different preschool
classrooms. This revealed that there were significant differences in students' apathy
difference scores across classrooms (F(95)=1.623, p=.002). An intercepts-only model
was run, which showed that the ICC for difference in apathy was .142. This indicates
that 14.2% of variance in children's apathy difference scores was attributable to their
preschool classroom membership, representing a substantive enough amount of group
dependence to require hierarchical linear modeling as an analysis strategy.
Research question one: How do motivation, engagement, and disaffection change
from preschool to Kindergarten?
It was expected that competence motivation and engagement would decrease
between preschool and kindergarten, while disaffection would increase.
This question was analyzed in three different ways. First, students' difference
scores were examined to look at students' patterns of change descriptively. The number
and percentage of students that decreased, exactly maintained, or increased their

85
competence motivation, engagement and disaffection are reported in Table 7. Next,
paired sample t-tests were performed to determine whether there was a significant
difference between students' competence motivation, engagement and disaffection during
preschool and during kindergarten. Finally, because it was expected that students'
changes in competence motivation, engagement and disaffection between preschool and
kindergarten are linked to their preschool experiences, it was determined that this
individual-level analysis may not be sufficient to reveal true differences. To account for
the effects of this nesting, intercepts-only models were run using students' difference
scores as the outcome variables. The intercept of this model was examined: a significant,
negative intercept indicated that, controlling for preschool classroom membership,
students tended to lose engagement or disaffection across the kindergarten transition.
Table 7. Difference Score Frequencies
_____________________________________________________ Total N % Decrease (N) %Maintain (N) %Increase (N)Competence Mot. 317 43.5% (138) 9.5% (30) 47.0% (149)Engagement 320 50.6% (162) 25.3% (81) 12.5% (77)Frustration 321 38.9% (125) 36.1% (116) 12.8% (80)Depersistence 321 43.3% (139) 24.9% (80) 20.2% (102)Apathy 319 33.5% (107) 43.9% (140) 12.5% (72)
Competence Motivation.
Difference scores. As shown in Table 7, similar numbers of students
increased (47.0%) and decreased (43.5%) in competence motivation between preschool
and kindergarten, while approximately 10% maintained a steady level of competence
motivation across the transition.
Paired sample t-test. A paired-sample t-test between students' preschool
and kindergarten competence motivation showed that there was no significant difference

86
between competence motivation during preschool (M=1.62, SD=.336) and kindergarten
(M=1.61, SD=.338), t(316)=-.180, p=.858.
Intercepts-only model. An intercepts-only model was conducted to
predict students' competence motivation difference score controlling for preschool class
membership. The intercept of this model was slightly less than zero but was not
statistically significant (b=-.001, p=.987), indicating that, controlling for class
membership, there was no significant difference in competence motivation across the
kindergarten transition.
Engagement.
Difference scores. As shown in Table 7, approximately half of the
students decreased in engagement between preschool and kindergarten, while
approximately a quarter maintained a steady level of engagement. Only 12.5% of
students increased in engagement across the kindergarten transition.
Paired sample t-test. A paired sample t-test between students' preschool
and kindergarten engagement showed that engagement decreased between preschool
(M=1.64, SD=.41) and kindergarten (M=1.46, SD=.47), t(319)=6.481, p<.001.
Intercepts-only model. An intercepts-only model was run with students'
engagement difference score as a level-one outcome. The intercept of this model was
significantly negative (b=-.180, p<.001), indicating that, controlling for class
membership, students decreased in engagement.
Depersistence.
Difference scores. As shown in Table 7, 43.3% of students decreased in
depersistence across the kindergarten transition. About a quarter of students maintained

87
the same level of depersistence, and 20.2% increased across the transition.
Paired sample t-test. A paired sample t-test between students' preschool
and kindergarten depersistence showed that there was not a significant difference
between depersistence in preschool (M=.56, SD=.50) and kindergarten (M=.50, SD=.53),
t(320)=1.803, p=.072.
Intercepts-only model. An intercepts-only model was run with students'
depersistence difference score as a level-one outcome. The intercept of this model was
-.059 indicating that, controlling for class membership, students slightly decreased in
depersistence; however, this difference was not significant (p=.111).
Frustration.
Difference scores. As shown in Table 7, a similar number of students
decreased and maintained frustration across the kindergarten transition (decreased:
38.9%; maintained: 36.1%). Only 12.8% of students increased in frustration between
preschool and kindergarten.
Paired sample t-test. A paired sample t-test between students' preschool
and kindergarten frustration showed that frustration decreased between preschool
(M=.33, SD=.38) and kindergarten (M=.26, SD=.33), t(320)=2.883, p=.004.
Intercepts-only model. An intercepts-only model was run with students'
frustration difference score as a level-one outcome. The intercept of this model was
significantly negative (b=.073, p=.010), indicating that, controlling for class membership,
students decreased in frustration.
Apathy.
Difference scores. As shown in Table 7, the greatest number of students
88
maintained the same level of apathy between preschool and kindergarten (43.9%). The
next most common pattern of change was a decrease, with 33.5% of students decreasing
in reported apathy across the transition. Finally, only 12.5% of students increased in
apathy between preschool and kindergarten.
Paired sample t-test. A paired sample t-test between students' preschool
and kindergarten apathy showed that apathy decreased between preschool (M=.28,
SD=.38) and kindergarten (M=.24, SD=.38); however, this difference only approached
significance (t(318)=1.958, p=.051).
Intercepts-only model. An intercepts-only model was run with students'
apathy difference score as a level-one outcome. The intercept of this model was -.054,
indicating that, controlling for class membership, students slightly decreased in
anxiety/boredom; however, this difference only approached significance (p=.063).
Research Question Two: Does classroom need support in preschool predict students’
concurrent levels of motivation, engagement, and disaffection?
It was expected that classroom level of need support would positively predict
students' engagement in preschool and would negatively predict students' disaffection at
this timepoint. To evaluate this hypothesis, hierarchical linear models were run, using
preschool engagement and disaffection as level-one outcome variables and classroom
need support as a level-two predictor. All continuous predictor variables were centered in
this analysis for ease of interpretation.
Competence motivation. Preliminary hierarchichal analysis showed that there
were significant differences in children's levels of competence motivation across
classrooms (F(95)=1.469, p=.011), with ICC=.192. Because this ICC indicated that the

89
amount of variance in preschool competence motivation was substantively dependent on
class membership, a hierarchical linear model was used to determine whether preschool
need support predicted preschool competence motivation. The results of this analysis
indicated that controlling for child characteristics and classroom membership, preschool
classroom need support did not predict concurrent competence motivation (b=.049,
p=.419).
Engagement. Preliminary hierarchical analysis showed that there were
significant differences in children's levels of engagement across classrooms
(F(95)=1.335, p=.043), with ICC=.088. Because this ICC indicated that the amount of
variance in preschool engagement was not substantively dependent on class membership,
a simple linear regression model was used to determine whether preschool need support
predicted preschool engagement. This model indicated that controlling for child
characteristics, there was not a significant association between need support and
engagement at this timepoint (b=.102, p=.098).
Depersistence. Preliminary hierarchical analysis showed that there were
significant differences in children's levels of depersistence across classrooms
(F(95)=1.342, p=.040), with ICC=.040. Because this ICC indicated that the amount of
variance in preschool depersistence was not substantively dependent on class
membership, a simple linear regression model was used to determine whether preschool
need support predicted preschool depersistence. This model indicated that, controlling
for child characteristics, there was not a significant association between need support and
depersistence at this timepoint (b=-.025, p=.679).
Frustration. Preliminary hierarchical analysis showed that there were significant

90
differences in children's levels of frustration across classrooms (F(95)=1.850, p<.001),
with ICC=.200. Because this ICC indicated that the amount of variance in preschool
frustration was substantively dependent on class membership, a hierarchical linear model
was run to determine whether preschool need support predicted preschool frustration.
This model indicated that controlling for class membership and child characteristics,
there was not a significant association between need support and frustration at this
timepoint (b= -.080, p=.247).
Apathy. Preliminary hierarchical analysis showed that there were significant
differences in children's levels of apathy across classrooms (F(95)=1.847, p<.001), with
ICC=.183. Because this ICC indicated that the amount of variance in preschool apathy
was substantively dependent on class membership, a hierarchical linear model was run to
determine whether preschool need support predicted preschool apathy. This model
indicated that controlling for class membership and child characteristics, preschool need
support was not significantly associated with apathy at this timepoint (b=-.084, p=.227).
Research Question Three: Are changes in motivation, engagement, and disaffection
across the kindergarten transition more pronounced for children who experience
greater levels of social and economic risk?
It was expected that students who are younger, are male, and whose mothers have
lower levels of education would experience greater motivational decreases between
preschool and kindergarten than their peers. Hierarchical linear modeling was used to
test this hypothesis, to account for the fact that participants were nested in preschool
classrooms. A series of models were tested, to determine the relationships between child
characteristics (age, gender, and maternal education) and each outcome variable

91
(competence motivation, engagement, frustration, depersistence, or apathy). These
models included child characteristics as level-one predictors, with motivation,
engagement or disaffection as a level-one outcome. All continuous predictor variables
were centered in this analysis for ease of interpretation.
Competence motivation. The results for this analysis can be found in Table 8,
Model One (p 92). When controlling for preschool competence motivation (b=.318,
p<.001) and all other child characteristics, maternal education and student age
significantly positively predicted kindergarten competence motivation (maternal
education: b=.035, p=.010; age: b=.012, p=.045). Gender did not uniquely predict
kindergarten competence motivation (b=-.023, p=573).
Engagement. The results for this analysis can be found in Table 9, Model One (p
93). When controlling for preschool engagement (b=.359, p<.001) and all other child
characteristics, maternal education significantly positively predicted kindergarten
engagement (b= .061, p<.001). Neither student age (b= .007, p=.419) nor gender
(b=-.077, p=.167) were significant predictors of kindergarten engagement, when
controlling for preschool engagement and all other child characteristics.
Depersistence. The results for this analysis can be found in Table 10, Model One
(p 93). When controlling for preschool depersistence (b=.353, p<.001) and all other child
characteristics, maternal education significantly negatively predicted kindergarten
depersistence (b= -.044, p=.023). Neither student age (b= -.015, p=.105) nor gender
(b=-.074, p=.231) were significant predictors of kindergarten depersistence, when
controlling for preschool depersistence and all other child characteristics.

92
Frustration. The results for this analysis can be found in Table 11, Model One (p
94). When controlling for preschool frustration (b=.241, p<.001) and all other child
characteristics, no child characteristic significantly predicted kindergarten frustration
(gender: b=.023, p=.574; maternal education: b=-.009, p=.469; age: b=.005, p=.474).
Apathy. The results for this analysis can be found in Table 12, Model One (p 94).
When controlling for preschool apathy (b=.362, p<.001), maternal education significantly
negatively predicted kindergarten apathy ( b= -.040, p=.007). Neither student age (b=
-.006, p=.398) nor gender (b= .042, p=.372) were significant predictors of kindergarten
apathy, when controlling for preschool apathy.
Table 8. Competence Motivation: Multi-Step Model
Model predictor Model 1 Model 2 Model 3 Fixed EffectsLevel 1 variables
Preschool Comp. Mot. .318*** .317*** .313***Gender -.023 -.021 -.022Age .012* .012* .012Maternal Education .035** .035*** .037***
Level 2 variableNeed Support .040 .045
Cross-level InteractionsGender x Need Support .234*Age x Need Support -.010Maternal Ed x Need Support -.020
Random EffectsIntercept .012 .013 .010
Residual .084*** .084*** .085***

Tab
le 9
. E
ngag
emen
t: M
ulti-
Ste
p M
odel
Mod
el p
redi
ctor
M
odel
1
M
odel
2
M
odel
3F
ixed
Effe
cts
Lev
el 1
var
iabl
esP
resc
hool
.3
59**
* .3
54**
* .3
65**
* e
ngag
emen
tG
ende
r-.
077
-.07
5-.
071
Age
.007
.007
.006
Mat
erna
l Ed.
.0
61**
* .0
62**
* .0
61**
*L
evel
2 v
aria
ble
Nee
d S
uppo
rt
.054
.060
Cro
ss-l
evel
Int
erac
tions
Gen
der
x N
eed
Supp
ort
.115
Age
x N
eed
Sup
port
-.
026
Mat
erna
l Ed
x N
eed
Sup
port
-.04
6R
ando
m E
ffec
tsIn
terc
ept
.020
.013
.012
R
esid
ual
.15
8***
.168
***
.16
6***
Tab
le 1
0. D
eper
sist
ence
: Mul
ti-S
tep
Mod
el
M
odel
pre
dict
or
Mod
el 1
Mod
el 2
Mod
el 3
Fix
ed E
ffec
tsL
evel
1 v
aria
bles
Pre
scho
ol
.353
***
.350
***
.348
***
de
pers
ist.
Gen
der
.074
.071
.074
Age
-.01
5-.
015
-.01
4M
ater
nal E
d.
-.04
4*-.
045*
-.04
6*L
evel
2 v
aria
ble
Nee
d S
uppo
rt
-.07
1-.
085
Cro
ss-l
evel
Int
erac
tion
sG
ende
r x
Nee
d S
uppo
rt
-.38
8**
Age
x N
eed
Sup
port
-.
007
Mat
erna
l Ed
x N
eed
Sup
port
.026
Ran
dom
Eff
ects
Inte
rcep
t .0
16.0
15 .0
10
Res
idua
l
.
205*
**
.2
04**
*
.
201*
**
93

94
Tab
le 1
1. F
rust
ratio
n: M
ulti-
Ste
p M
odel
Mod
el p
redi
ctor
M
odel
1
M
odel
2
M
odel
3F
ixed
Effe
cts
Lev
el 1
var
iabl
esP
resc
hool
.241
***
.232
***
.231
***
fr
ustr
atio
nG
ende
r .0
23 .0
19 .0
18A
ge .0
05 .0
05 .0
06M
ater
nal E
d.
-.00
9-.
010
-.01
4L
evel
2 v
aria
ble
Nee
d S
uppo
rt
-.10
2*-.
107*
Cro
ss-l
evel
Int
erac
tions
Gen
der
x N
eed
Supp
ort
-.06
1A
ge x
Nee
d S
uppo
rt
-.02
1M
ater
nal E
d x
Nee
d S
uppo
rt .0
39R
ando
m E
ffec
tsIn
terc
ept
.006
.005
.005
R
esid
ual
.09
2***
.091
***
.09
0***
Tab
le 1
2. A
path
y: M
ulti-
Ste
p M
odel
Mod
el p
redi
ctor
M
odel
1
M
odel
2
M
odel
3F
ixed
Eff
ects
Lev
el 1
var
iabl
esP
resc
hool
.363
***
.359
***
.361
***
an
xiet
yG
ende
r .0
42 .0
41 .0
40A
ge-.
006
-.00
6-.
005
Mat
erna
l Ed.
-.
040*
*-.
041*
*-.
042*
*L
evel
2 v
aria
ble
Nee
d S
uppo
rt
-.04
0-.
048
Cro
ss-l
evel
Int
erac
tion
sG
ende
r x
Nee
d S
uppo
rt
-.18
0+A
ge x
Nee
d S
uppo
rt
.005
Mat
erna
l Ed
x N
eed
Sup
port
.039
Ran
dom
Eff
ects
Inte
rcep
t .0
08.0
08 .0
07
Res
idua
l
.
126*
**
.1
26**
*
.
124*
**

95
Research Question Four: Are the levels of relatedness, autonomy, and competence
support in preschool classrooms positively associated with children’s development of
motivation and engagement across the kindergarten transition?
It was predicted that high preschool need support would buffer the loss of
engagement across the kindergarten transition. Hierarchical linear modeling was used to
assess this hypothesis. To do this, a series of models were run, in which the level-two
variable of preschool need support was added to the models run to explore research
question three, which predicted engagement and disaffection outcomes using level-one
child characteristics. All continuous predictor variables were centered in this analysis for
ease of interpretation.
The results of these analyses can be found in Tables 9-13 (competence
motivation: Table 8, Model 2, p 92; engagement: Table 9, Model 2, p 93; depersistence:
Table 10, Model 2, p 93; frustration: Table 11, p 94, Model 2; apathy: Table 12, Model 2,
p 94). Controlling for child characteristics and preschool frustration, preschool need
support significantly negatively predicted kindergarten frustration (b= -.102, p=.045).
Need support was not a unique predictor of any other kindergarten outcome, however
(competence motivation: b= .040, p=.457; engagement: b= .054, p=.433; depersistence:
b= -.071, p=.349; apathy: b= -.040, p=.499).
Research Question Five: Does motivational support during preschool buffer
losses in motivation and engagement and reduce gains in disaffection across the
kindergarten transition for children with specific demographic characteristics?
It was predicted that high levels of need support would be more beneficial for
students from high-risk backgrounds. This hypothesis was, again, assessed using

96
hierarchical linear modeling. In these models, cross-level interaction terms (gender x
need support, age x need support, and maternal education x need support) were added to
the previous models. All continuous predictor variables were centered in these analyses.
Competence motivation. The results for this analysis can be found in Table 8,
Model Three (p 92). Controlling for child characteristics, need support, and students'
preschool competence motivation, a significant interaction was found between male
gender and need support, b= .234, p=.012. This interaction shows that the boys in highly
supportive classrooms tended to have more positive trajectories of change while their
female peers had slightly negative trajectories of change. This is illustrated in the
following equations, which demonstrate the relationship between need support and
kindergarten competence motivation for boys and girls respectively, controlling for other
child characteristics. A graphical representation of this relationship at average preschool
competence motivation can be found in Figure 10.
Boys (at average maternal education and age):
Kindergarten comp. mot. = (1.102+.313(pre-K comp. mot.)) + .173(need support)
Girls (at average pre-K competence motivation, maternal education and age):
Kindergarten comp. mot. = (1.122+.313(pre-K comp. mot.)) - .064(need support)
Controlling for child characteristics, need support, and students' preschool
behavioral disaffection, no other cross-level interactions between child characteristics and
need support were found (age x need support: b=-.010, p=.528; maternal education x
need support: b=-.020, p=.544).

97
Engagement. The results for this analysis can be found in Table 9, Model Three,
p 93. Controlling for child characteristics, need support, and students' preschool
engagement, no cross-level interactions between child characteristics and need support
were found (gender x need support: b= .116, p=.364; age x need support: b= -.026,
p=.221; maternal education x need support: b= -.046, p=.274).
Figure 10. Need Support x Gender Interaction on Kindergarten Competence Motivation
Depersistence. The results for this analysis can be found in Table 10, Model
Three (p 93). Controlling for child characteristics, need support, and students' preschool
depersistence, a significant interaction was found between male gender and need support,
b= -.388, p=.006. This interaction shows that the boys in highly supportive classrooms
had more pronounced decreases in depersistence across the kindergarten transition than
girls whose preschool classrooms were highly supportive. This is illustrated in the
following equations, which demonstrate the relationship between need support and
kindergarten depersistence for boys and girls respectively, controlling for other child
characteristics. A graphical representation of this interaction at mean preschool

98
depersistence can be found in Figure 11.
Boys (at average maternal education and age):
Kindergarten depersistence = (.5323+.348(pre-K depersistence)) - .294(need
support)
Girls (at average maternal education and age):
Kindergarten depersistence = (.4593+.348(pre-K depersistence)) + .092(need
support)
Figure 11. Need Support x Gender Interaction on Kindergarten Depersistence
Controlling for child characteristics, need support, and students' preschool
depersistence, no other cross-level interactions between child characteristics and need
support were found (age x need support: b= -.007, p=.759; maternal education x need
support: b=.026, p=.575).
Frustration. The results for this analysis can be found in Table 11, Model Three

99
(p 94). Controlling for child characteristics, need support, and students' preschool
frustration, no cross-level interactions between child characteristics and need support
were found (gender x need support: b= -.061, p=.513; age x need support: b= -.021,
p=.169; maternal education x need support: b= .039, p=.209).
Apathy. The results for this analysis can be found in Table 12, Model Three (p
94). Controlling for child characteristics, need support, and students' preschool apathy,
no cross-level interactions between child characteristics and need support were found for
age (b= .005, p=.802) or maternal education (b= .039, p=.287). While an interaction
between gender and need support was not significant (b= -.180, p=.091), this interaction
did approach significance. This interaction, though non-significant, showed that the boys
in highly supportive classrooms had more pronounced decreases in apathy across the
kindergarten transition than girls whose preschool classrooms were highly supportive.
This is illustrated in the following equations, which demonstrate the relationship between
need support and kindergarten apathy for boys and girls respectively, controlling for other
child characteristics. A graphical representation of this interaction at average preschool
apathy can be found in Figure 12.
Boys (at average maternal education and age):
Kindergarten apathy = (.2739+.361(pre-K apathy)) - .144(need support)
Girls (at average maternal education and age):
Kindergarten apathy = (.2349+.361(pre-K apathy)) + .034(need support)
A summary comparing research hypotheses to results can be found in Appendix

100
A.
Figure 12. Need Support x Gender Interaction on Kindergarten Apathy
Follow Up Analyses: Relatedness, Autonomy, and Competence
Follow-up analyses were conducted in which need support was broken down into
its component pieces to determine whether significant effects of need support were due to
the construct as a whole or due to warmth, autonomy support, and/or structure
specifically. Each component of need support was entered separately from the others,
due to the theoretical issues that arise when examining one type of need support while
controlling for the others (e.g. what does it mean to have high structure while controlling
for warmth?).
Competence motivation: gender x need support interaction. Controlling for
class membership, child characteristics, positive climate, and the interaction between
positive climate and all other child characteristics, there was an interaction between

101
warmth and gender, in that warmth was more beneficial for boys than for girls (b=.238,
p=.01). This same pattern was not significant for either autonomy support (b=.103,
p=.071) or structure (b=.121, p=.124).
Depersistence: gender x need support interaction. Controlling for class
membership, child characteristics, positive climate, and the interaction between positive
climate and all other child characteristics, there was an interaction between warmth and
gender, in that warmth led to greater declines in depersistence across the transition for
boys than for girls (b=-.372, p=.009). The same pattern was also true for autonomy
support to a lesser degree (b=-.194, p=.026) but was not true for structure (b=-.161,
p=.174).
Frustration: main effects of need support. Controlling for class membership
and child characteristics, structure significantly predicted decreases in frustration across
the kindergarten transition (b=-.101, p=.021). This pattern was not significant for
positive climate (b=-.091, p=.077) or regard for student perspectives (b=-.030, p=.354).
Apathy: gender x need support interaction. Controlling for class membership,
child characteristics, positive climate, and the interaction between positive climate and all
other child characteristics, there was an interaction between warmth and gender, in that
warmth was more beneficial for boys than for girls (b=-.289, p=.009). This same pattern
was not significant for either autonomy support (b=-.088, p=.196) or structure (b=-.003,
p=.975).

102
Chapter Seven: Discussion
Summary of Findings
The following section will describe the current study's key findings. A summary
of all hypotheses and results can be found in Appendix A.
Patterns of motivation, engagement and disaffection. It was predicted that in
general, students' engagement would decrease across the kindergarten transition, while
their disaffection would increase. This prediction was partially confirmed and partially
contradicted. While students did generally decrease in engagement across the
kindergarten transition, as indicated by difference scores, paired sample t-tests, and a
nested intercepts-only model, disaffection also tended to decline or be maintained across
this transition. In contrast, competence motivation did not change significantly across the
kindergarten transition.
Maternal education and motivation, engagement and disaffection. Maternal
education was the only consistent child characteristic to predict changes in motivation,
engagement and disaffection across the kindergarten transition. For motivation and
engagement, high maternal education was positively related to change across the
transition, while maternal education predicted decreases in both depersistence and apathy
across the transition. Maternal education was also consistently correlated with
motivation, engagement and disaffection in both preschool and kindergarten.
This indicates that students whose mothers had low education levels not only
tended to be lower in motivation and engagement and higher in disaffection than their
peers at the end of preschool, these gaps may have widened across the kindergarten
transition, as these students were also more likely to lose engagement and gain

103
disaffection across these gaps.
Boys and motivation, engagement, and disaffection. Male gender was also
consistently correlated with motivation, engagement and disaffection during preschool
and kindergarten; however, gender did not predict changes in engagement and
disaffection across the kindergarten transition. This indicates that while boys seem to
have lower mean levels of engagement than girls, they do not seem to be changing at a
different rate.
There was an interaction between gender and need support for changes in
motivation and disaffection, in that boys who received high levels of need support in
preschool experienced lesser declines in motivation and greater decreases in certain types
of disaffection across the kindergarten transition. This was shown in a significant
interaction between gender and need support on changes in motivation and depersistence
across the transition and in an interaction that approached significance on changes in
apathy across this transition. Follow-up analyses indicated that these interactions were
most consistently driven by classroom warmth in preschool, as measured by the “positive
climate” dimension of the CLASS.
Need support and motivation, engagement and disaffection. There was no
consistent pattern in the association between need support and children's motivation,
engagement and disaffection. Classroom levels of need support did not predict students'
concurrent motivation, engagement and disaffection during preschool. Additionally, for
the most part, higher levels of preschool need support did not predict changes in students'
motivation, engagement and disaffection across the kindergarten transition. There was
one exception, however: classroom level preschool need support significantly predicted

104
decreases in frustration across the kindergarten transition. Follow-up analyses indicated
that this was primarily driven by classroom structure, as measured with the “behavior
management” dimension of the CLASS.
Additionally, preschool need support seemed to be beneficial for boys, as it
predicted decreases in boys' disaffection for both giving up and apathy across the
kindergarten transition.
Implications
The patterns of change of engagement and disaffection across the kindergarten
transition may have implications on our understanding of students' early development.
The fact that children generally decline in engagement across this transition is consistent
with expectations and is in line with the idea that kindergarten may be a context that can
be challenging for students' maintenance of enthusiastic participation in the classroom
(Rimm-Kaufman & Pianta, 2000). This result is also in line with previous studies that
have found that students' liking for school begins to decline at kindergarten entry (Ladd et
al., 2000).
However, students' disaffection changed in the opposite direction as was
predicted, as most forms of disaffection also declined across the kindergarten transition.
This indicates that disaffection and engagement may not be bipolar, which supports
previous findings that demonstrate that these two dimensions are distinguishable from
each other and are not perfectly negatively correlated (Skinner et al., 2009). If
engagement and disaffection both decline across the kindergarten transition, this opens
new questions about the development of disaffection and whether it should be studied
separately from engagement.

105
Taken together, the decline of both of these constructs across the kindergarten
transition suggests that as students move into kindergarten, they may become more
subdued in both positive and negative emotions and behaviors.
Findings regarding the association between child characteristics and motivation,
engagement, and disaffection are largely in line with previous findings. Both maternal
education and gender were associated with students' motivation, engagement and
disaffection during preschool and kindergarten in the expected directions. This adds
further support to previous findings that students who are male and whose mothers have
low levels of education are at risk for low socioemotional development by kindergarten
entry (Zill & West, 2001).
However, the data did not support previous findings about students' age, which
have indicated that students who are comparatively younger at kindergarten entry are at
risk for low socioemotional development (Zill & West, 2001). Age was mostly
uncorrelated with engagement or disaffection at any time point, with the exception of a
positive correlation between age and preschool levels of frustration. This correlation was
in the opposite direction from the study's expectation, indicating that older students
experienced more frustration during preschool. The paucity of findings regarding age in
this study may indicate that young age is not a consistent risk factor for students' early
socioemotional development. It is worth noting that nearly all students in this sample
came from low-SES, Caucasian families in rural Appalachia: it may be that age at
kindergarten entry is less salient in this population than in the United States as a whole.
Of the child risk factors, only maternal education consistently predicted changes
in motivation, engagement and disaffection across the kindergarten transition. One

106
potential interpretation of this finding is that maternal education represents something
about students' experiences outside the classroom, while both age and gender are
characteristics of the child. One argument for why achievement gaps tend to expand
during the times students are not in the classroom is that students from different
backgrounds have home experiences that are differentially supportive of their academic
growth (Alexander et al., 2007). If maternal education represents something about
children's home experiences, it may be that declines in students' engagement and
disaffection over the summer are partially explainable by students' experiences at home.
In contrast, while male gender predicted lower levels of engagement and higher
levels of disaffection in both preschool and kindergarten, it was not predictive of change
over time in these outcomes. This finding was particularly interesting when taken in
combination with previous findings that girls tend to gain in Approaches to Learning
more than boys over the course of the school year (Dominguez et al., 2010). It may be
that gaps in socioemotional skill between boys and girls tend to get more pronounced
during the school year and are maintained over the summer-- the opposite pattern as is
found with SES-related achievement gaps, which grow over the summer and are
maintained during the school year. If this is true, then it seems that it may be students'
differential classroom experiences based on their genders that are driving early gaps in
engagement and disaffection. However, a great deal more research is needed to
investigate this possibility.
While gender itself did not predict changes in engagement and disaffection across
the kindergarten transition, there was a pattern regarding changes in boys' disaffection
related to preschool levels of need support. Boys in classes with high levels of need

107
support experienced declines in depersistence and in apathy across the kindergarten
transition. It seems that for boys, high quality, motivationally supportive preschool
experiences enhance declines in disaffection across the kindergarten transition.
There are several different potential theoretical interpretations of this interaction.
It may be that the development of early disaffection operates differently for boys and
girls and what is beneficial to one group may not be similarly beneficial to the other.
This interpretation, however, does not align with Self Determination Theory and does not
match findings in older students (Ryan & Deci, 2000).
It may be that although supporting students' needs is beneficial both for boys and
for girls, boys are struggling more, and so they benefit more from support. This matches
previous findings that students who are most at risk for development of low
socioemotional skills by kindergarten entry tend to benefit more from support across the
kindergarten transition (LoCasale-Crouch et al., 2008). However, this interaction was not
found between need support and maternal education in this sample, indicating that only
certain students who were struggling benefited from highly supportive preschool
classrooms.
A final potential interpretation of these findings is that the experience of being a
boy in a highly supportive preschool classroom may be qualitatively different than the
experience of being a girl in that same classroom. It may be that while support of
students' needs for relatedness, competence, and autonomy is the mechanism through
which their disaffection is reduced, preschool-aged boys and girls have different avenues
through which these needs can be met. However, this possibility was not explicitly
explored in this study and would require further research.

108
Interestingly, there were not clear patterns in the association between preschool
classroom need support and students' motivation, engagement and disaffection. The fact
that classroom need support was not related to students' concurrent engagement and
disaffection is contrary to what Self Determination Theory would suggest (Ryan & Deci,
2000). However, there is a major caveat to this: there was not a great deal of variance in
need support across the classrooms in the study. The lowest level of need support in any
classroom was around the midpoint of the overall scale, with the majority of classrooms
being strongly positive. It seems that students' needs for relatedness, autonomy, and
competence may have been mostly met in every classroom in the study. Because of this,
this lack of findings may not be indicative that Self Determination Theory does not apply
to the development of engagement and disaffection in preschool.
However, this does invite the question of whether the relationship between the
support of students' needs and their development of engagement and disaffection is
strictly linear. Does going from a five to a seven on a scale of need support have the
same impact as going from a three to a five, or a one to a three? Is there a cutoff point
beyond which increasing need support does not lead to greater gains in engagement?
Without a wider variance in classroom need support, it is impossible to answer these
questions. If this is the case, however, and our sample is largely above that cutoff point,
this may partially explain the lack of consistent significant associations between need
support and motivation, engagement and disaffection.
Despite this limitation, there was a significant main effect of need support on
students' development of frustration across the kindergarten transition. Students whose
classrooms were highly need supportive tended to experience greater decreases in

109
frustration between preschool and kindergarten. This indicates that support of students'
relatedness, autonomy, and competence may be important in their development of
disaffection, which is consistent with Self Determination Theory (Ryan & Deci, 2000).
This was not the only difference between frustration and the other two
disaffection outcomes. While maternal education predicted changes in all other
outcomes, it did not predict changes in students' frustration. Furthermore, while it
seemed that warmth was the key ingredient in improvements in motivation,
depersistence, and apathy for boys, structure seemed to be key for improvements in
frustration across the kindergarten transition. This suggests that there may be some
different processes underlying students' frustration than underlie other forms of
disaffection. Practically, this means that not only might future research need to examine
engagement and disaffection separately from each other, different forms of disaffection
may also take different developmental courses.
Finally, the fact that the same types of disaffection that are observable in older
students did not consistently emerge in the PLBS indicates that disaffection may look
different in younger children than older students. While this may be due to the fact that
the PLBS was not designed to measure disaffection and so many of the items may not
have been well-aligned with theories of disaffection, it may be that there are qualitative
differences in what it means to be a disaffected kindergartner as opposed to a disaffected
middle school student. Future developmental studies of disaffection might be able to
investigate this further.
Strengths and Limitations
The following section will detail the theoretical, design-related, and analysis-

110
related strengths and limitations of the current study.
Theory. A major strength of the current study is that it extends a well-developed
theory of motivation to a younger age group. This helped to illuminate early predictors
of motivation, engagement and disaffection and also helped to determine how well Self
Determination Theory applies in the preschool context.
Bringing this theory to the preschool level also helped to tease apart some of the
variance in the Approaches to Learning variable. Studies of ATL in preschool have
traditionally lumped a variety of socioemotional skills together. Separating this variable
down to some of its component parts allowed for a more nuanced view of how children
develop socioemotionally during this time, revealing different patterns of change in
motivation, engagement, and disaffection. The fact that separate components of the ATL
construct did seem to operate distinctly from each other supported the study’s suggestion
that future research should look at students’ socioemotional skills separately from each
other. This may contribute valuable nuance to our current understanding of the skills
children need at kindergarten entry.
Theoretically, the study is based on a launch assumption that the experiences
students have in preschool will stay with them and set them on certain trajectories of
change as they transition into kindergarten. However, this may not be the most accurate
model for the development of early motivation and engagement. A more theoretically-
attuned model might include studying both preschool and kindergarten contexts to
understand how students' experiences over time contribute to their growth.
Sample. Another strength of the current study is its sample. The students who
participated in the Read it Again study represent a population with a high level of social

111
and economic risks. Most notably, half of the students came from families whose yearly
incomes were less than $20,000, and the average family income for the sample was
$26,922. Low-income students are increasingly at risk for achievement gaps at
kindergarten entry (Reardon, 2011), and as such, it is critically important to understand
the development of the factors that can lead to these students' later academic
achievement. Because of this, this was an ideal sample for this study.
However, the sample also has limitations. 89% of students were white, which
meant that there was not enough variance in race and ethnicity to be able to get a good
picture of how these motivational processes might vary between these groups. Students
who are Hispanic (Reardon & Gallindo, 2009) or African-American (Burchinal et al.,
2011) are also at risk for low achievement at kindergarten entry. However, these gaps are
not expanding as drastically as are the gaps between low-income students and their
higher-income peers, so for the purposes of this study, the tradeoff was considered
acceptable.
Measures. There were both strengths and limitations in the study's measures.
One strength, the narrowing of both Approaches to Learning and CLASS constructs, ties
into the theoretical strengths of the study. Using only those dimensions of the PLBS and
the CLASS that are aligned with motivational theories allowed the current study to
examine specific relationships between classroom motivational support and students’
development of motivation, engagement, and disaffection. Because subdimensions of the
CLASS were identified that aligned with warmth, autonomy support, and structure, the
study was able to determine which type of motivational support was most influential on
students’ outcomes.

112
Another measurement strength was in the comprehensive measurement of the
CLASS. This measure of classroom climate was taken at three different times during the
school day in Fall, Winter, and Spring. This breadth of measurement times makes it more
likely that the measure of classroom quality is an accurate representation of classroom
quality across the school year.
However, there were also shortcomings associated with the current measure of
need support. The three dimensions of the CLASS that were used to represent warmth,
structure, and autonomy support were chosen because they were the three dimensions
that best represented each need. However, these dimensions were not the only
dimensions to include behaviors that were theoretically supportive of the three Self
Determination Theory needs. A more comprehensive measure of need support might
have included all dimensions that were supportive of relatedness, autonomy, and
competence; however, including more dimensions into the final need support measure
risked including sub-dimensions that were not as aligned with the theory. In the end, it
was decided that a more conservative approach would be the most theoretically sound;
however, this approach may have missed a substantive amount of variance in the actual
level of need support in the classroom.
On the other end of the analysis, there was also a measurement problem in the
scales used to represent disaffection in this study. It was not possible to isolate measures
of disaffection that were structurally sound and highly reliable in both preschool and
kindergarten. In general, the disaffection scale models fit the data well in kindergarten
but had only marginal fit in preschool. This is not necessarily surprising, since the
original scale was not designed to measure engagement and disaffection; however, it
113
casts some doubt onto whether these scales are truly meaningful ways through which to
interpret children’s disaffection. There is a need for a well-constructed and validated
measure of early disaffection—this may be a direction for future research.
Finally, there may be important control variables missing from the study that
partially account for variance in engagement and disaffection. One possible third
variable might be students' activity level. Highly active students may appear both more
highly engaged and more highly disaffected. It may be that students become less active
across the kindergarten transition, which may be partially accounting in reductions in
both engagement and disaffection.
Design. A strength of the study's design is its longitudinal nature. Often, studies
of early childhood development focus on either the preschool or k-12 school system. The
fact that the study spanned the kindergarten transition and included both pre-K and
kindergarten measurement points made it possible to study children as they moved
between these two school systems.
However, a limitation in this design is the lack of a need support measure in
kindergarten. Part of the study's hypothesis rests on the theory that in general, preschools
may be a more motivationally supportive environment than formal classrooms. However,
this may not always be true. A more detailed study might consider the level of need
support in kindergarten in addition to that in preschool. It is easy to imagine a scenario in
which a student moves from a highly need-supportive preschool to a much less optimal
kindergarten classroom. A student like this may actually lose more motivation than a
student who transfers from one sub-optimal environment to another. Being able to
examine how this change in context is associated with change in motivational outcomes

114
would allow for better understanding of how need support plays into students'
motivational development.
Additionally, the measurement times of the preschool and kindergarten motivation
assessments may be too far apart to truly tell whether any differences are attributable to
the kindergarten transition. The preschool measurement point is in January, which is well
before the end of a typical school year, while the kindergarten measurement point is in
November. The kindergarten measurement point was set a few months after the
beginning of the school year to ensure that teachers were familiar enough with their
students to make accurate assessments. However, this may mean that kindergarten-level
contexts are what truly support kindergarten motivation, and this measurement does not
precisely represent “kindergarten readiness” in the most pure sense of the word.
However, because attitudes towards learning tend to grow over the preschool year
(Dominguez et al., 2010), it is likely that having a January measurement point reduced
the magnitude of decreases in engagement across the kindergarten transition. It is
therefore likely that the effects found were actually fairly conservative estimations of
declines across the kindergarten transition.
Finally, there were several design decisions that limited the generalizability of the
study. If the students who were hardest to reach in kindergarten were those who might be
struggling most, then list-wise deletion may have eliminated from the study a group of
students with particular challenges in the school system. Additionally, the schools and
classrooms who participated in this study were all interested in a reading intervention. It
may be that this sampling procedure only identified a certain set of classrooms, which
may not be fully representative of Appalachian schools. The same issue was true for the

115
sampling procedure for children in classrooms. Only five children were sampled from
each classroom, and only those whose parents consented to research were included.
Again, this may have missed those students whose parents were hardest to reach.
Analyses. The multi-level modeling of the research questions is a strength of the
study. This type of analysis allowed for the separation of student-level and class-level
sources of variance, which is most appropriate for this set of research questions.
However, there is also a potential limitation in the current set of analyses. Because
students are from small, rural towns, it is likely that students who were nested together
within the same preschool classroom were also nested in the same kindergarten
classroom. This means that class-level variance may be partially attributable to children's
kindergarten experiences and not their preschool experiences. However, this similarity in
nesting is not likely to be systematic in any way; nor was it expected to affect a majority
of the students.
Future Directions
There is a great deal more to understand about the development of students' early
motivation, engagement and disaffection, especially in regards to the classroom processes
through which teachers can boost students' early motivation and engagement and reduce
their early disaffection. Because variance in psychological need support did not
consistently explain a significant amount of variance in children's preschool engagement
and disaffection, the question remains: what contexts support the development of these
emotions and behaviors at this age?
Furthermore, the results of this study indicate that engagement and disaffection
may not develop as flip sides of the same coin: instead, they may have distinct

116
trajectories. Because much of the work on the developmental trajectory of engagement
has treated disaffection as the direct opposite of engagement, it may be that this work has
missed important nuances in the development of both. Even beyond this, it seems that
different types of disaffection may behave in different ways. Unpacking the current
concept of engagement may be an important next step to understanding students'
development.
Finally, further examination of the processes underlying gender differences in the
impacts of need support on disaffection would also be another potential avenue for future
research. While there was a consistent pattern of findings regarding this interaction, there
are multiple competing explanations for why this association exists.

117
References
Alexander, K. L., Entwisle, D. R., & Olson, L. S. (2007). Lasting consequences of the
summer learning gap. American Sociological Review, 72(2), 167-180.
Aud S., Hussar W., Planty M., Snyder, T., Bianco, K., Fox, M.A., Frohlich, L., Kemp, J.,
& Drake, L. (2010). The Condition of Education 2010 (NCES 2010-028).
Washington, DC: National Center of Education Statistics, Institute of Education
Sciences, US Department of Education; 2010.
Bodovski, K., & Farkas, G. (2007). Mathematics growth in early elementary school: The
roles of beginning knowledge, student engagement, and instruction. The
Elementary School Journal, 108(2), 115-130.
Burchinal, M., McCartney, K., Steinberg, L., Crosnoe, R., Friedman, S. L., McLoyd, V.,
& Pianta, R. (2011). Examining the black–white achievement gap among low‐
income children using the NICHD study of early child care and youth
development. Child development, 82(5), 1404-1420.
Burkam, D. T., Ready, D. D., Lee, V. E., & LoGerfo, L. F. (2004). Social-class
differences in summer learning between kindergarten and first grade: Model
specification and estimation. Sociology of Education, 77(1), 1-31.
Claessens, A., Duncan, G., & Engel, M. (2009). Kindergarten skills and fifth-grade
achievement: Evidence from the ECLS-K. Economics of Education Review, 28(4),
415-427.
Cunha, F., & Heckman, J. (2007). The technology of skill formation (No. w12840).
National Bureau of Economic Research.
Domínguez, X., Vitiello, V. E., Fuccillo, J. M., Greenfield, D. B., & Bulotsky-Shearer, R.
118
J. (2011). The role of context in preschool learning: a multilevel examination of
the contribution of context-specific problem behaviors and classroom process
quality to low-income children's approaches to learning. Journal of School
Psychology, 49(2), 175-195.
Dominguez, X., Vitiello, V. E., Maier, M. F., & Greenfield, D. B. (2010). A Longitudinal
Examination of Young Children's Learning Behavior: Child-Level and
Classroom-Level Predictors of Change throughout the Preschool Year. School
Psychology Review, 39(1), 29-47.
Duncan, G. J., Dowsett, C. J., Claessens, A., Magnuson, K., Huston, A. C., Klebanov, P.,
Pagani, L.S., Feinstein, L., Engel, M., Brooks-Gunn, J., Sexton, H., Duckworth,
K., & Japel, C. (2007). School readiness and later achievement. Developmental
psychology, 43(6), 1428-1446.
Dweck, C. S. (1986). Motivational processes affecting learning. American psychologist,
41(10), 1040-1048.
Greene, B. A., & Miller, R. B. (1996). Influences on achievement: Goals, perceived
ability, and cognitive engagement. Contemporary Educational Psychology, 21(2),
181-192.
Hair, E., Halle, T., Terry-Humen, E., Lavelle, B., & Calkins, J. (2006). Children's school
readiness in the ECLS-K: Predictions to academic, health, and social outcomes in
first grade. Early Childhood Research Quarterly, 21(4), 431-454.
Hamre, B. K., & Pianta, R. C. (2001). Early teacher–child relationships and the trajectory
of children's school outcomes through eighth grade. Child development, 72(2),
625-638.

119
Heckman, J. J. (2000). Policies to foster human capital. Research in economics, 54(1), 3-
56.
Heckman, J. J. (2007). The economics, technology, and neuroscience of human capability
formation. Proceedings of the National Academy of Sciences, 104(33), 13250-
13255.
Iyengar, S. S., & Lepper, M. R. (1999). Rethinking the value of choice: A cultural
perspective on intrinsic motivation. Journal of personality and social psychology,
76, 349-366.
Klem, A. M., & Connell, J. P. (2004). Relationships matter: Linking teacher support to
student engagement and achievement. Journal of School Health, 74(7), 262-273.
Ladd, G. W., Birch, S. H., & Buhs, E. S. (1999). Children's social and scholastic lives in
kindergarten: Related spheres of influence?. Child development, 70(6), 1373-
1400.
Ladd, G. W., Buhs, E. S., & Seid, M. (2000). Children's initial sentiments about
kindergarten: Is school liking an antecedent of early classroom participation and
achievement?. Merrill-Palmer Quarterly (1982-), 255-279.
Li-Grining, C. P., Votruba-Drzal, E., Maldonado-Carreño, C., & Haas, K. (2010).
Children's early approaches to learning and academic trajectories through fifth
grade. Developmental Psychology, 46(5), 1062-1077.
LoCasale-Crouch, J., Mashburn, A. J., Downer, J. T., & Pianta, R. C. (2008). Pre-
kindergarten teachers’ use of transition practices and children's adjustment to
kindergarten. Early Childhood Research Quarterly, 23(1), 124-139.
Marks, H. M. (2000). Student engagement in instructional activity: Patterns in the

120
elementary, middle, and high school years. American educational research
journal, 37(1), 153-184.
Mashburn, A. (In press.) The importance of quality pre-kindergarten programs for
promoting school readiness skills.
McDermott, P. A., Leigh, N. M., & Perry, M. A. (2002). Development and validation of
the preschool learning behaviors scale. Psychology in the Schools, 39(4), 353-365.
Mueller, C. M., & Dweck, C. S. (1998). Praise for intelligence can undermine children's
motivation and performance. Journal of personality and social psychology, 75,
33-52.
Niemiec, C. P., & Ryan, R. M. (2009). Autonomy, competence, and relatedness in the
classroom Applying self-determination theory to educational practice. Theory and
Research in Education, 7(2), 133-144.
Organization for Economic Cooperation and Development. (2012). Education at a
glance 2012: OECD indicators. Retrieved from http://www.oecd.org/edu/EAG
%202012_e-book_EN_200912.pdf.
Pianta, R. C., La Paro, K. M., & Hamre, B. K. (2008). Classroom assessment scoring
system. Baltimore: Paul H. Brookes.
Reardon, S. F. (2011). The widening academic achievement gap between the rich and the
poor: New evidence and possible explanations. Whither opportunity, 91-116.
Reardon, S. F., & Galindo, C. (2009). The Hispanic-White achievement gap in math and
reading in the elementary grades. American Educational Research Journal, 46(3),
853-891.
Rimm-Kaufman, S. E., & Pianta, R. C. (2000). An ecological perspective on the

121
transition to kindergarten: A theoretical framework to guide empirical research.
Journal of Applied Developmental Psychology, 21(5), 491-511.
Rimm-Kaufman, S. E., Pianta, R. C., & Cox, M. J. (2000). Teachers’ judgments of
problems in the transition to kindergarten. Early Childhood Research Quarterly,
15(2), 147-166.
Ryan, R., & Deci, E. (2000). Self Determination Theory and the facilitation of intrinsic
motivation, social development, and well-being. American Psychologist,
55(1), 68-78.
Ryan, R. M., Stiller, J. D., & Lynch, J. H. (1994). Representations of relationships to
teachers, parents, and friends as predictors of academic motivation and self-
esteem. The Journal of Early Adolescence, 14(2), 226-249.
Schulting, A. B., Malone, P. S., & Dodge, K. A. (2005). The effect of school-based
kindergarten transition policies and practices on child academic outcomes.
Developmental psychology, 41(6), 860.
Skinner, E., Furrer, C., Marchand, G., & Kindermann, T. (2008). Engagement and
disaffection in the classroom: Part of a larger motivational dynamic?. Journal of
Educational Psychology, 100(4), 765.
Skinner, E. A., Kindermann, T. A., & Furrer, C. J. (2009). A Motivational Perspective on
Engagement and Disaffection Conceptualization and Assessment of Children's
Behavioral and Emotional Participation in Academic Activities in the Classroom.
Educational and Psychological Measurement, 69(3), 493-525.
Stroet, K., Opdenakker, M. C., & Minnaert, A. (2012). Effects of Need Supportive
Teaching on Early Adolescents’ Motivation and Engagement: A Review of the

122
Literature. Educational Research Review.
U.S. Bureau of the Census. (2011). Income, poverty, and health insurance coverage in the
United States: 2010. Retrieved from http://www.census.gov/prod/2011pubs/p60-
239.pdf.
Wentzel, K. R. (1997). Student motivation in middle school: The role of perceived
pedagogical caring. Journal of Educational Psychology, 89(3), 411.
Wentzel, K. R. (1998). Social relationships and motivation in middle school: The role of
parents, teachers, and peers. Journal of educational Psychology, 90, 202-209.
Worrell, F. C., Vandiver, B. J., & Watkins, M. W. (2001). Construct validity of the
learning behavior scale with an independent sample of students. Psychology in
the Schools, 38(3), 207-215.
Xue, Y., & Meisels, S. J. (2004). Early literacy instruction and learning in kindergarten:
Evidence from the early childhood longitudinal study—kindergarten class of
1998–1999. American Educational Research Journal, 41(1), 191-229.
Zill, N., & West, J. (2001). Entering Kindergarten: A Portrait of American Children When
They Begin School. Findings from the Condition of Education, 2000.
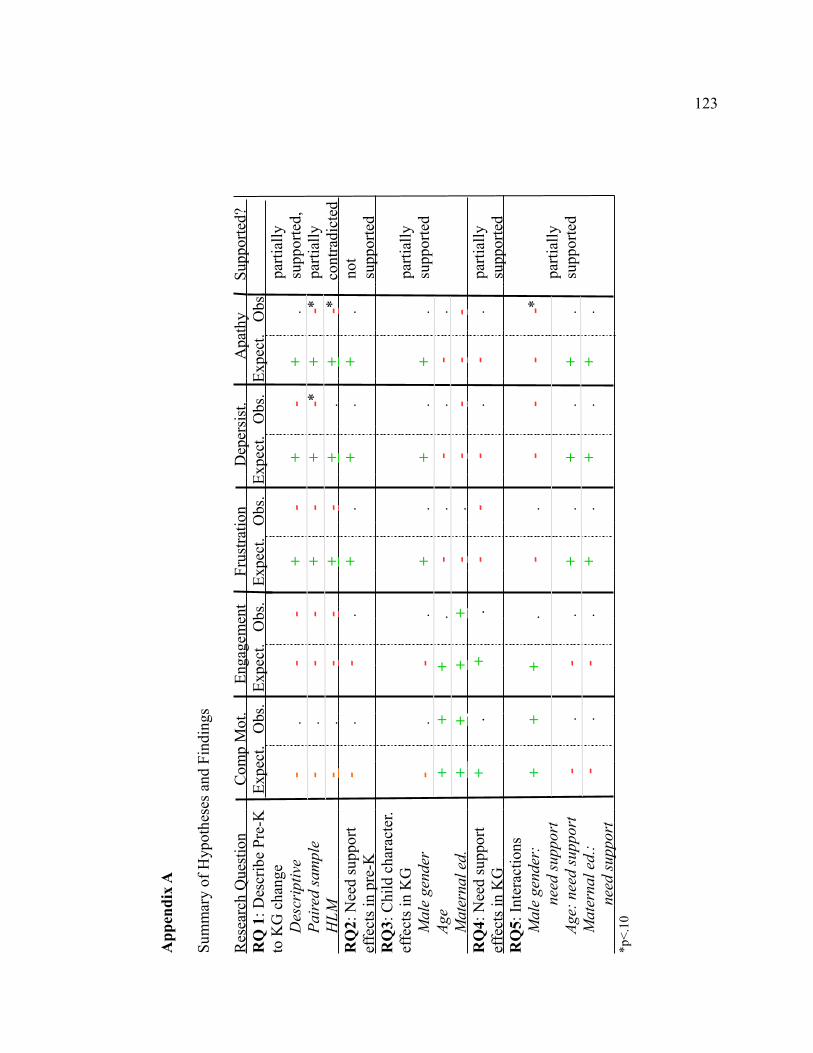
App
end
ix A
Sum
mar
y of
Hyp
othe
ses
and
Fin
ding
s
Res
earc
h Q
uest
ion
C
omp
Mot
.
Eng
agem
ent
F
rust
rati
on
D
eper
sist
.
Apa
thy
Sup
port
ed?
R
Q 1
: Des
crib
e P
re-K
E
xpec
t. O
bs.
Exp
ect.
Obs
. E
xpec
t. O
bs.
Exp
ect.
Obs
. E
xpec
t. O
bs.
to
KG
cha
nge
par
tial
ly
Des
crip
tive
-
.
-
-
+
-
+
-
+
. s
uppo
rted
,
Pai
red
sam
ple
-
.
-
-
+
-
+
-*
+
-
* p
arti
ally
H
LM
-
.
-
-
+
-
+
.
+
-
*
con
trad
icte
d R
Q2:
Nee
d su
ppor
t
-
.-
.
+
.
+
.
+
. n
otef
fect
s in
pre
-K
su
ppor
ted
RQ
3: C
hild
cha
ract
er.
ef
fect
s in
KG
par
tial
ly
Mal
e ge
nder
-
.
-
. +
.
+
.
+
.
sup
port
ed
Age
+
+
+
.
-
.
-
.
-
.
Mat
erna
l ed.
+
+
+
+
-
.
-
-
-
-
RQ
4: N
eed
supp
ort
+
.+
. -
-
-
.
-
.
par
tial
lyef
fect
s in
KG
supp
orte
d
R
Q5:
Int
erac
tions
M
ale
gend
er:
+
+
+
.
-
.
-
-
-
-*
need
sup
port
par
tial
ly
Age
: ne
ed s
uppo
rt
-
.-
.
+
.
+
.
+
.
sup
port
ed
Mat
erna
l ed.
:
-
.-
.
+
.
+
.
+
.
n
eed
supp
ort
*p<
.10
123