Embed Size (px)
Citation preview
Copyright © 2010 SunPower Corporation. All rights reserved.
Motivation and approach for predictable high performance of PV systems
International Solar Energy Technology Conference
Doug Rose, SunPower Corporation
October 20, 2010

© 2010 SunPower Corp.
Acknowledgments
Many people at SunPower, with particular recognition of Dave DeGraaff and Ben Bourne.
This material is based in part upon work supported by the Department of Energy under Award Number DE-FC36-07GO17043
2
For additional related information see:
Doug Rose, Oliver Koehler, Ben Bourne, David Kavulak, Lauren Nelson, High-confidence prediction of energy production FROM High-efficiency photovoltaic systems, 25th European Photovoltaic Solar Energy Conference, Valencia, Spain, Sept. 7, 2010
D. DeGraaff, S. Caldwell, R. Lacerda, G. Bunea, A. Terao, D. Rose, “Qualification, Manufacturing, and Reliability Testing Methodologies for Deploying High-Reliability Solar Modules,” 25th European Photovoltaic Solar Energy Conference, Valencia, Spain, Sept. 7, 2010
© 2010 SunPower Corp.
Safe Harbor Statement
3
This presentation contains forward-looking statements within the meaning of the Private Securities Litigation Reform Act of 1995.
Forward-looking statements are statements that do not represent historical facts and may be based on underlying assumptions.
SunPower uses words and phrases such as “may,” “will,” “should,” “could,” “would,” “expect,” “plan,” “anticipate,” “believe,” “estimate,”
“predict,” “potential,” “continue” and similar words and phrases to identify forward-looking statements in this presentation, including
forward-looking statements regarding: (a) plans and expectations regarding future financial results, operating results, liquidity, capital
expenditure and business strategies, (b) management’s plans and objectives for future operations, (c) the company’s projected costs
and cost reduction roadmap, (d) forecasted demand growth, and projected bookings and pipelines, (e) construction, completion,
ability to obtain financing and revenue recognition timing, (f) growth in dealer partners, (g) product development and competitive
position, (h) manufacturing ramp plan and scalability, (i) future government award funding, (j) future solar and traditional electricity
rates and cost savings of our systems, (k) trends and growth in the solar industry, and (l) the success and benefits of our joint ventures
and partnerships. Such forward-looking statements are based on information available to the company as of the date of this
presentation and involve a number of risks and uncertainties, some beyond the company’s control, that could cause actual results to
differ materially from those anticipated by these forward-looking statements, including risks and uncertainties such as: (i) potential
difficulties associated with operating the joint venture with AUO and integrating the SunRay business, and the company’s ability to
achieve the anticipated synergies and benefits from these transactions; (ii) the company’s ability to obtain and maintain an adequate
supply of raw materials, components, and solar panels, as well as the price it pays for such items; (iii) general business and economic
conditions, including seasonality of the industry; (iv) growth trends in the solar power industry; (v) the continuation of governmental
and related economic incentives promoting the use of solar power; (vi) the significant investment required to construct power plants
and the company’s ability to sell or otherwise monetize power plants; (vii) the improved availability of financing arrangements for the
company’s customers; (viii) construction difficulties or potential delays, including permitting and transmission access and upgrades;
(ix) Increasing competition in the industry and lower ASPs; (x) the joint venture’s ability to ramp new production lines in Fab 3 and the
company’s ability to realize expected manufacturing efficiencies; (xi) manufacturing difficulties that could arise; (xii) the success of the
company’s ongoing R&D efforts and the acceptance of the company’s new products and services; (xiii) the company’s international
operations; (xiv) the company’s liquidity, substantial indebtedness, and its ability to obtain additional financing; (xv) the company’s
ability to protect its intellectual property; (xvi) evolving regional permitting, financing, grid interconnection, technical, and other customer
or regulatory requirements; (xvii) possible impairment of goodwill; (xviii) possible consolidation of AUO SunPower; and (xix) other risks
described in the company’s Annual Report on Form 10-K for the year ended January 3, 2010 and Quarterly Report on Form 10-Q for
the quarter ended July 4, 2010, and other filings with the Securities and Exchange Commission. These forward-looking statements
should not be relied upon as representing the company's views as of any subsequent date, and the company is under no obligation to,
and expressly disclaims any responsibility to, update or alter its forward-looking statements, whether as a result of new information,
future events or otherwise.

SunPower
>1 GW solar PV deployed 2009 revenue of $1.5B
4
Commercial Power PlantsResidential
5,000+ Employees; 100% solar
Current production capacity > 600MW
> 1000 dealers and growing rapidly
4+ GW power plant pipeline
© 2010 SunPower Corp.
5
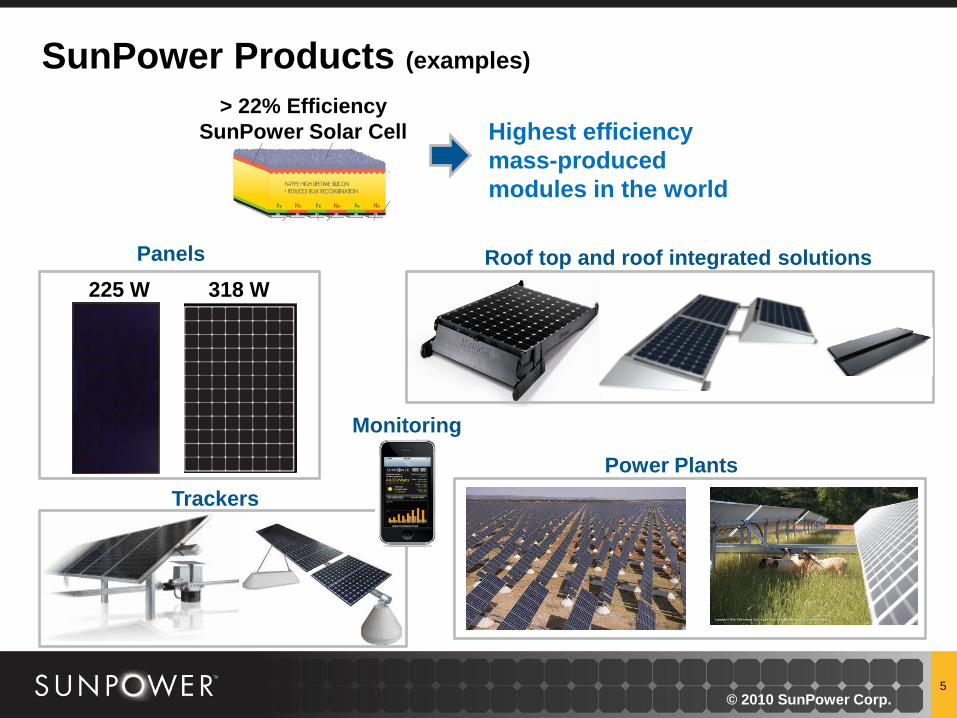
Trackers
SunPower Products (examples)
Roof top and roof integrated solutions
225 W 318 W
Panels
> 22% Efficiency
SunPower Solar Cell
© 2010 SunPower Corp.
Highest efficiency
mass-produced
modules in the world
Power Plants
Monitoring

6
Solar PV Power Plants Are Cost Competitive
0 50 75 100 150 200 250 300 350 400
Levelized Cost ($/MWh)
Renewables
Conventional
$86 - 192
$119 - 194
$65 - 110
$231- 254
$67-96
Gas Peaking
Gas Combined
Cycle
Wind
Solar Thermal
Solar PV
LCOE by Resource $/MWh: 2010 - 2013
Prices include federal incentives
Source: Lazard Capital Markets 6/2010

© 2010 SunPower Corp.
Learning Curves
Silicon is keeping up (Trina, a leading Chinese Si company, selected due to readily-available cost data)
– c-Si market share in 2010 is ~84%
Note: Value of typical c-Si module is > value of typical thin film module and value of high efficiency cSi value > value of standard efficiency c-Si modules
7
0.70
7.00
70.00
10 100 1000 10000 100000
$/W
Cumulative Volume (MW)
Industry PRICE
Trina c-Si Price
Trina c-Si Cost
First Solar Price
First Solar cost
1.00
Poly-silicon
shortage

© 2010 SunPower Corp.
Higher Efficiency → Lower System Costs
8
ConventionalSunPower
PanelPanel
BOSBOS
InstallationInstallation
Fixed Costs
Fixed Costs
Co
sts
/Wa
tt

Value of efficiency
9
© 2010 SunPower Corp.
- Lowers area-related costs
Reduced materials costs– Less module and system area
Reduced installation costs
- Lowers $/W projects costs
For area-constrained projects, it allows more Watts for the project
– Reduces $/W fixed costs (e.g., sales, design, permitting, connection, etc.)
across more watts
For non-area-constrained, it can still give lower fixed costs by allowing optimum selection of mounting location and reduced site preparation
- Gives more W (and additional kWh with tracking), so higher project NPV
- Provides higher return with simple tracking
Reduced shipping costs (module and BOS)

10
Tracking
Mid-to-high-efficiency modules
enable cost-effective 1-axis tracking
Captures up to 30% more sunlight
than fixed tilt systems with only one
low-power actuator per ~200kW
Reduces the $/kwh costs of the
modules, mechanical and electrical
BOS, and O&M costs
Better match of energy production
with summer load (time of day & seasonal)
0%
20%
40%
60%
80%
100%
120%
12
:00
:00
AM
1:0
0:0
0 A
M
2:0
0:0
0 A
M
3:0
0:0
0 A
M
4:0
0:0
0 A
M
5:0
0:0
0 A
M
6:0
0:0
0 A
M
7:0
0:0
0 A
M
8:0
0:0
0 A
M
9:0
0:0
0 A
M
10
:00
:00
AM
11
:00
:00
AM
12
:00
:00
PM
1:0
0:0
0 P
M
2:0
0:0
0 P
M
3:0
0:0
0 P
M
4:0
0:0
0 P
M
5:0
0:0
0 P
M
6:0
0:0
0 P
M
7:0
0:0
0 P
M
8:0
0:0
0 P
M
9:0
0:0
0 P
M
10
:00
:00
PM
11
:00
:00
PM
Fixed Tilt CF - Mojave
T0 Tracker - Mojave
Cal ISO Load 7/15/08
Peak CA Summer
Load
PV Power Plant Output vs.
Summer Utility Demand
Curve
Load
T0 tracker
Fixed tilt
© 2010 SunPower Corp.
0%
20%
40%
60%
80%
100%
120%
12
:00
:00
AM
1:0
0:0
0 A
M
2:0
0:0
0 A
M
3:0
0:0
0 A
M
4:0
0:0
0 A
M
5:0
0:0
0 A
M
6:0
0:0
0 A
M
7:0
0:0
0 A
M
8:0
0:0
0 A
M
9:0
0:0
0 A
M
10
:00
:00
AM
11
:00
:00
AM
12
:00
:00
PM
1:0
0:0
0 P
M
2:0
0:0
0 P
M
3:0
0:0
0 P
M
4:0
0:0
0 P
M
5:0
0:0
0 P
M
6:0
0:0
0 P
M
7:0
0:0
0 P
M
8:0
0:0
0 P
M
9:0
0:0
0 P
M
10
:00
:00
PM
11
:00
:00
PM
Fixed Tilt CF - Mojave
T0 Tracker - Mojave
Cal ISO Load 7/15/08
Peak CA Summer
Load
20.0%
22.0%
24.0%
26.0%
28.0%
30.0%
32.0%
34.0%
36.0%
38.0%
40.0%
Fixed Tilt T20 Tracker T0 Tracker
Annual CF
Summer CF
Summertime capacity factor with SunPower
modules and T0 tracker in Las Vegas is 38%

© 2010 SunPower Corp.
Performance
11
LCOE = Energy produced
Total System Installed Costs + O&M CostsNPV [ ]
LCOE ≡ Levelized Cost of Energy
NPV ≡ Net Present Value
Total system costs includes cash flow impact of financing
O&M ≡ Operation and Maintenance
Energy / rated W Environmental conditions
Mounting (tracking, tilt,…)
System design
Module type
System availability(uptime)
System Quality and Reliability System Lifetime
Degradation rates
Failure rates
Confidence in the energy production and O&M estimates very strongly affects selling price and financing rates
High Efficiency
]NPV [

The importance of performance (and accurate, confident prediction of that performance)
© 2010 SunPower Corp.12
Degradation rate, system life, O&M, and discount rate can have a
tremendous impact on LCOE:
Case 1 Case 2 Case 3
System Price 100% 100% 100%
kWh/kWp 100% 100% 100%
Annual Degradation 1.0% 0.5% 0.3%
System Life 15 25 40
Annual O&M $/kWh 0.030$ 0.010$ 0.005$
Discount Rate 9% 7% 5%
LCOE $/kWh 0.23$ 0.13$ 0.09$
31% decrease
in LCOE
77% increase
in LCOE
Assume same installed
price and first year
energy performance
Varied as shown

© 2010 SunPower Corp.
Performance and performance prediction
Analysis of technology attributes (physics of energy production)
13
Goals:
• High performance
• Accurate prediction of
that performance
Analysis of field data
SunPower simulation tool:
– Description
– Validation
– Performance
Understanding of 3rd-party simulation tools

© 2010 SunPower Corp.
Physics of energy production
#1 factor: Nominal Efficiency = 12% 67% (i.e., 4-20% efficiency modules)
#2 factor: Climate and mounting (e.g. trackers give up to 35% increase vs. fixed tilt)
kWh/kWp for a given location/mounting is normally within 5%, but still valuable to customer and is a tool for understanding and optimization
– < 1 sun irradiance
– Temperature coefficient
– Temperature of operation
– Spectral effects
– Light-induced degradation
– Yearly degradation
14

© 2010 SunPower Corp.
Irradiance level
Standard Test Condition: 1000 W/m2 irradiance. Average irradiance outdoors is <1000 W/m2
All else being equal:
– High series resistance (Rs) reduces energy produced but increases kWh/kWp
– Low shunt resistance (Rsh) reduces energy produced and kWh/kWp
SunPower modules have low Rs and high Rsh
Note: If a manufacturer with high Rs raises module efficiency by reducing Rs, their kWh/kWp will go down, so previous field data of kWh/kWp should not be used without adjustment
15
Low series resistance
High series
resistance
SunPower 318W module

© 2010 SunPower Corp.
Temperature coefficient
Main influence on Tcoef is Voc relative to band gap (higher Voc/Eg is good)
Traditional c-Si ‡ and mc-Si ‡ Voc=0.625 Tcoef, power = -0.47%/C
SunPower back-contact Voc=0.691 Tcoef, power = -0.38%/C
For a warm location with an energy-weighted average T of 45⁰C:
– Loss of energy from temperature for traditional Si: 9.4%
– Loss of energy from temperature for SunPower: 7.6% (1.8% lower than std)
– Loss of energy from a thin film with Tcoef = -0.25%/C: 5.0% (4.4% lower than std)
16
‡Data for 10 largest producers of traditional silicon modules as reported by Photon International

© 2010 SunPower Corp.
Operating temperature
Operating temperature differences comes from:
Mounting (e.g., air-gap to roof) - is the largest factor
Differences in temperature at open-circuit from module type
– NOCT = Normal Operating Cell Temperature, but NOCT measured at open circuit
– Module packaging (especially module transparency) can affect NOCT
– SunPower NOCT measured to be ~1⁰C lower than standard c-Si
Measurements show one factor is higher reflection and transmission of far infrared wavelengths, which is only partially offset by higher absorbance of visible wavelengths
Reduced temperature from higher efficiency
– Cells are cooler in operation than at open circuit because some energy is sent out as electricity instead of dissipated as heat.
– A SunPower 19.4% module vs. a standard c-Si 14.4% module means ~5% less heat to dissipate, and ~1.4⁰C lower operating temperature (beyond NOCT differences)
17

© 2010 SunPower Corp.
Spectral effects
Single junction with c-Si bandgap gives high tolerance to spectral variation:
– Gives higher efficiency at air-mass > STC condition of AM1.5. Average AM is
> 1.5, so this increases kWh/kWp of SunPower and other c-Si relative to most thin films
18
c-Si
CdTe
2j a-Si
3j a-Si
Response curves of selected modules in Sandia module database; other modules within a technology type can have a different response.

© 2010 SunPower Corp.
Degradation
Light-induced degradation (LID)
– SunPower uses n-type Si, so no LID
– “Average” c-Si LID is ~1.5% (previously, some low-quality modules had LID > 10%)
Yearly degradation
– 0.3% vs. 0.7% gives 4.5% difference in energy production over 25 years
– Field testing from NREL and other locations is showing a lower-than-average degradation of SunPower modules
19

© 2010 SunPower Corp.
Attribute impact on kWh/kWp
Rough estimations of kWh/kWp of SunPower compared to:
20
Lower-than-average yearly degradation and failure probability for SunPower
modules is expected to increase this kWh/kWp advantage
vs. “average c-Si” vs. CdTe vs. “avg” a-Si
Climate: hot cool “average” “average”
Irradiance level - 0.4% - 0.7% -2% -4%
Temp. coefficient 2.4% 1.2% -1.9% -4%
Operating Temp. 1.3% 1.0% 2% 1.5%
LID 1.5% 1.5% 0 3%
Spectrum 0 0 2% 8%
Angle of incidence 0.1% 0.3% 1% 1%
Total ~5% ~3% ~0.5% ~5%
Due to the large range of “average c-Si”, and the large range of mounting types and climates, the estimates are only offered as a benchmark for
analysis of field test results. The values for the “average” CdTe and a-Si have even greater uncertainty, due to both the variation within each of
those technologies and the amount of technical data we have available

© 2010 SunPower Corp.
Meta-analysis of field tests with SunPower modules
10 independent field tests including SunPower PV were reviewed to evaluate the relative performance among PV Technologies.
The 10 field test represent all the independent tests known to SunPower where data was available for analysis
Institute/ Test Site Location Start End Years Technologies
HE c-Si c-Si TF
SunTechnics Study Landshut, DE Apr '05 Apr '06 1.0 1 1
CREST Leicestershire, UK Apr '07 Apr '08 1.0 1 2
ISAAC-TISO Lugano, CH Mar '06 Jul '07 1.3 2 9 3
IPE, Uni Stuttgart Stutgartt, DE June '06 on-going 4.1 2 7 4
IPE, Uni Cyprus Nicosia, Cyprus June '06 on-going 4.1 2 7 4
IPE, Egypt Alexandria, Egypt Aug '08 Jun '09 0.9 2 7 4
Hokaido Electric (NEDO) Wakanai, Japan Apr'07 Sep'07 0.5 2 4 2
Landwirtschafliche
Lerhanstalten, Bayreuth Bayreuth, DE Jan '09 Dec '09 1.0 2 1 3
Gelsenkirchen FHS Bocholt, DE Jun '09 Oct '09 0.4 3 1
Desert Knowledge Alice Springs, AU Oct '08 on-going 1.8 1 4 1
21

© 2010 SunPower Corp.
Field Test Issues
Test with side-by-side 2.6kW arrays‡ showed mc-Si had 63% higher kWh/kWp compared to CdTe! Is that real?
22
‡ R. Eke, S. Oktik, “Comparison of 18 Month kWh/kWp Energy Output of Four Photovoltaic Systems with Four Different Module
Technologies, Proceedings of the 22nd European Photovoltaic Solar Energy Conference, 3-7 September 2007, Milan, Italy.
– No! The CdTe array was shaded part of the day and had inverter issues.
Degradation– Initial degradation / stabilization
– Different yearly degradation rates
Defining kWh/kWp baseline– Mfg flash or independent measurements better for c-Si, but would be unfair to thin films
which degrade then stabilize (best is to use stabilized value as the “kWp” baseline)
Non-Representative Results
– Results vary for PV technologies within single tests and between different tests (i.e., a single test should not be assumed to be representative)
– Non-representative results can skew kWh/kWp estimates if included in averages. Non-representative modules in tests and test set-up problems occur often.
Year 1 Year 2 Year 5
a-Si Single junction +23% +3% -7%
a-Si Triple junction +7% -3% -10%
Example: Energy per rated W vs. mc-Si module
Source: Rodziewicz, et. al, “Long-Term Analysis of Energy
Gained by Different PV Modules in 2001-2006”,

© 2010 SunPower Corp.
Field Test Results
Analysis results show higher kWh/kWp performance of SunPower vs. other technologies, similar to the results from attribute analysis
23
-3.0%
-2.0%
-1.0%
0.0%
1.0%
2.0%
3.0%
4.0%
5.0%
6.0%
7.0%
HIT c-Si CdTe a-Si CIS
kWh/kWp of SunPower vs. other types
Approach 1
Approach 2
Approach 1:(Broad # of Sites)
Approach 2:(Minimize Test Issues)
# Tests 9 3
Duration 14.3 yrs 9.4 yrs
Field Test issues
Degradation - Use all data - Tests > 1 yr data
- Weight results by
duration of tests
kWh/kWp
Baseline
- Rated power - Mfg flash for c-Si
- Rated power for
thin films
Sample Size - 9 tests;
2-13 per tests
3 tests; 10 or more
per test; min 2 per PV
Technology
Non-
representati
ve Data
- Omit irregular
data (DKA test
omitted)
Omit irregular data
(DKA test omitted)
Two analysis approaches

© 2010 SunPower Corp.
Performance Prediction - PVSim
PVSim Engine
Balance of
System Losses
External Loss
FactorsPVSim
Web UI
PV Model:Cell Temperature
Energy Conversion
Inverter
Site
Location
Weather
Data
System
Design
Geometry:Solar Position
Module Orientation
Incidence Angle
Shading
Irradiance:Beam/DNI
Diffuse
Plane-of-Array
System Power &
Energy Yield
24
PVSim is SunPower’s web-based software tool used to predict PV system energy production
Loss factor assumptions based on 12 years of experience
Component specs updated by industry experts and validated by in-house and 3rd-party testing
Validation includes both model behavior and total performance

© 2010 SunPower Corp.
Performance Prediction – Model Validation
25

© 2010 SunPower Corp.
SunPower simulation tool
PVSim provides accurate prediction across a range of applications.
– Standard deviation of error is 1.3%
– Actual energy delivery is 1.2% higher than predicted
26
Powerguard = flat fixed mount
T0 = horizontal 1-axis tracked
T10 = 10° fixed tilt
T20 = 20° tilt 1-axis tracked
© 2010 SunPower Corp.
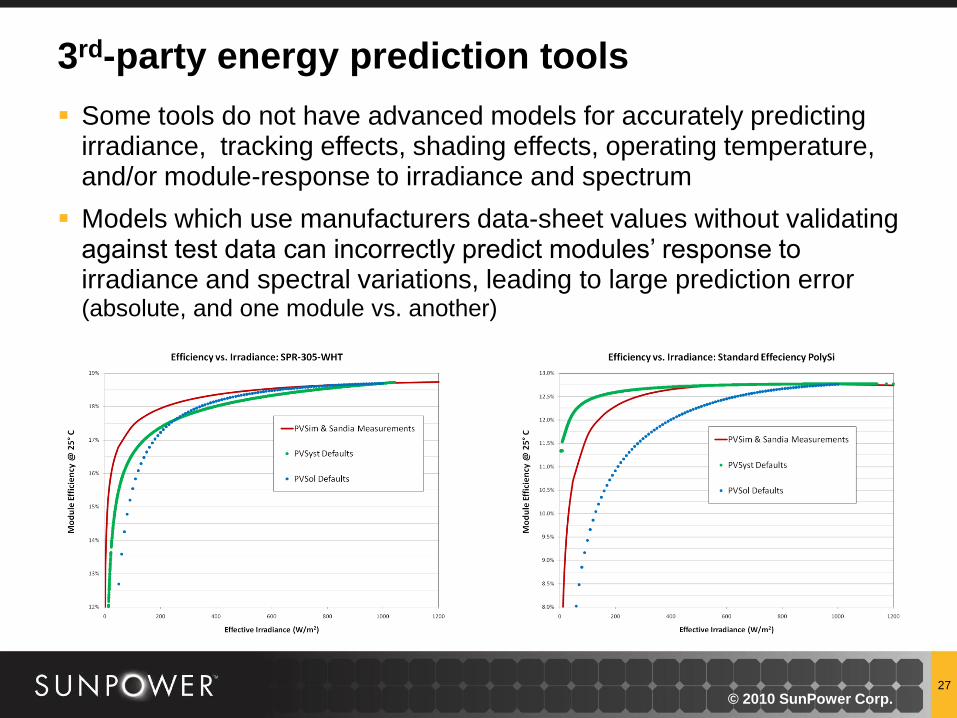
3rd-party energy prediction tools
Some tools do not have advanced models for accurately predicting irradiance, tracking effects, shading effects, operating temperature, and/or module-response to irradiance and spectrum
Models which use manufacturers data-sheet values without validating against test data can incorrectly predict modules’ response to irradiance and spectral variations, leading to large prediction error (absolute, and one module vs. another)
27

© 2010 SunPower Corp.
Performance analysis conclusions
28
• High kWh/kWp performance of SunPower modules and systems
• High-confidence prediction of energy production using advanced
simulation tool, aided by consistency and understanding of products
Attribute analysis: Predicts ~3-5% kWh/kWp advantage of SunPower vs. standard c-Si, and ~1-5% vs. thin films
Meta-analysis of 10 independent field tests:
– Average kWh/kWp: +5% vs. standard c-Si and +3% vs. thin films
SunPower advanced energy simulation tool:
– Standard deviation of error in actual vs. predicted for 17 large systems across broad range of locations and mounting approaches = 1.3%.
Lower-than-average yearly degradation and failures rates would increase this kWh/kW advantage

QUALITY AND RELIABILITY

SunPower’s unique perspective
30
>1 GW solar PV deployed
550 MW 2010 production
Diversified portfolio: roofs to power plants
1. Broad view from deployments
built with a wide variety of PV
modules from more than a
dozen different manufacturers
over more than 10 years.
2. Fully-vertical enables closed-
loop learning from the roofs and
power plants back to whatever
the root cause, from wafering to
cell and module mfg, to systems.
3. Manufacturing heritage from IC
chips
SunPower brings a unique perspective to
the challenge of deploying high-reliability
PV modules …
… we are sharing this information in the
belief that the entire industry benefits from
a high prevalence of robust PV modules.
© 2010 SunPower Corp.

Deploying high-reliability PV Modules: Overall Process
31
CustomerStatistical Process Control
Cert.testing
Qualification Testing
• Testing-to-failure
• Long-term testing
• Field testing Cont. Mfg. Testing
• ORT
• HASA
FMEA
• Field Experience
• HALT
• Theoretical under-standing
Supplier Quality Control
• PSC Audit
• STARS score
• Inc. Mat’l Audit
Out-of-box Audit
• Reliability Req’ts,
• Design Concepts
Manufacturing QualityDesign for Reliability
Closed-loop learning
© 2010 SunPower Corp.

Deploying high-reliability PV Modules: Overall Process
32
CustomerStatistical Process Control
Cert.testing
Qualification Testing
• Testing-to-failure
• Long-term testing
• Field testing Cont. Mfg. Testing
• ORT
• HASA
FMEA
• Field Experience
• HALT
• Theoretical under-standing
Supplier Quality Control
• PSC Audit
• STARS score
• Inc. Mat’l Audit
Out-of-box Audit
• Reliability Req’ts,
• Design Concepts
Manufacturing QualityDesign for Reliability
Closed-loop learning
© 2010 SunPower Corp.

Failure Modes and Effects Analysis (FMEA)
FMEA is the foundation of Design for Reliability – it’s list of all known failure modes, and their relative importance
The FMEA is typically built from 3 primary areas:
– Field Experience
– Tests-to-failure, e.g. HALT, long-term-testing
– Theoretical understanding / modeling
Examples of FMEAs given by SunPower in papers presented at EUPVSEC 2010 (D. DeGraaff et al., and G. Bunea et al.)
33
The FMEA lists all the possible failure modes, and therefore it drives the
Qualification Testing, as well as the Continuous Manufacturing Testing.
© 2010 SunPower Corp.

Highly Accelerated Life Testing (HALT)
HALT is a method of discovering product weaknesses by applying stress combinations which are relevant, but considerably exaggerated.
Goal is to rapidly activate the same failure modes that would take years in the field. (It is not a pass/fail test.)
SunPower’s module HALT includes:
– Solar Simulator
– Oven test
– Damp Heat with voltage bias
– Dynamic load
34
It is difficult or impossible to obtain information about how things fail in the
absence of actual failures: TEST TO FAILURE!
© 2010 SunPower Corp.

Solar simulator HALT
35
The Solar Simulator explores melting of certain encapsulants, breakdown of
adhesives, corrosion, discoloration, out-gassing, local hot spots, and behavior
of extremely hot cells (sometimes exceeding 170C)
1%
0
-1%
-2%
-3%
-4%
-5%
Before After
Bubbled backsheet
likely from layup-tape
out-gassing
Delamination
along
interconnect-
ribbon likely from
flux residue
SunPower back-contact-cell modules
Power Output Change
© 2010 SunPower Corp.
(short-circuit, 1sun plus 150W/m2 UV,
55%RH, 60⁰C ambient)

Damp heat with bias HALT
36
Power Output Change
SunPower back-contact-cell modules
0%
-2%
-4%
-6%
-8%
-10%0 600
Time (hrs)
Damp Heat with bias (1000V) significantly accelerates failure modes relative to
Damp Heat without bias.
© 2010 SunPower Corp.
Front-contact
metal corrosion
(1000V, 85%RH, 85⁰C ambient)
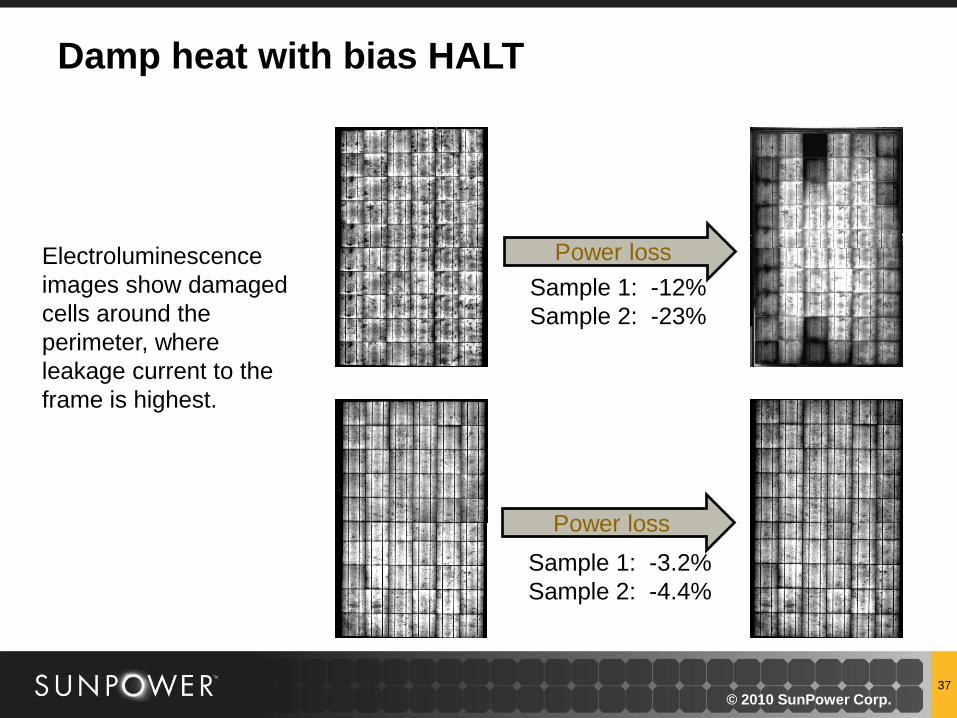
Damp heat with bias HALT
37
Power loss
Sample 1: -3.2%
Sample 2: -4.4%
Power loss
Sample 1: -12%
Sample 2: -23%
Electroluminescence
images show damaged
cells around the
perimeter, where
leakage current to the
frame is highest.
© 2010 SunPower Corp.

Dynamic Load HALT
1,000 alternating cycles of +/-2400 Pa (standard wind load), then 4 temp. cycles -40 to 60C
< 1% loss in power for SunPower modules with all-back-contact cells:
38
© 2010 SunPower Corp.
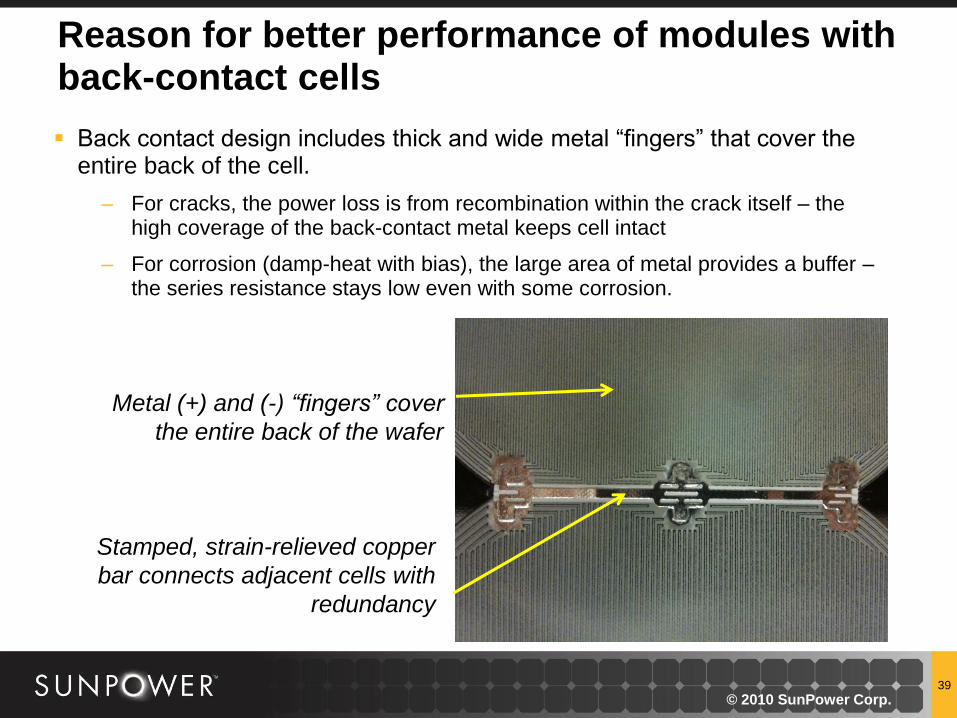
Reason for better performance of modules with back-contact cells
Back contact design includes thick and wide metal “fingers” that cover the entire back of the cell.
– For cracks, the power loss is from recombination within the crack itself – the high coverage of the back-contact metal keeps cell intact
– For corrosion (damp-heat with bias), the large area of metal provides a buffer –the series resistance stays low even with some corrosion.
39
Metal (+) and (-) “fingers” cover
the entire back of the wafer
Stamped, strain-relieved copper
bar connects adjacent cells with
redundancy
© 2010 SunPower Corp.

Deploying high-reliability PV Modules: Overall Process
40
CustomerStatistical Process Control
Cert. testing
Qualification Testing
• Testing-to-failure
• Long-term testing
• Field testing Cont. Mfg. Testing
• ORT
• HASA
FMEA
• Field Experience
• HALT
• Theoretical under-standing
Supplier Quality Control
• PSC Audit
• STARS score
• Inc. Mat’l Audit
Out-of-box Audit
• Reliability Req’ts,
• Design Concepts
Manufacturing QualityDesign for Reliability
Closed-loop learningThe Qualification Test Plan should address all moderate and high RPN
failure modes in the FMEA.
© 2010 SunPower Corp.

SunPower back-contact-cell modules: long-term testing example
41
© 2010 SunPower Corp.

Deploying high-reliability PV Modules: Overall Process
42
CustomerStatistical Process Control
Cert.testing
Qualification Testing
• Testing-to-failure
• Long-term testing
• Field testing Cont. Mfg. Testing
• ORT
• HASA
FMEA
• Field Experience
• HALT
• Theoretical under-standing
Supplier Quality Control
• PSC Audit
• STARS score
• Inc. Mat’l Audit
Out-of-box Audit
• Reliability Req’ts,
• Design Concepts
Manufacturing QualityDesign for Reliability
Closed-loop learning
© 2010 SunPower Corp.
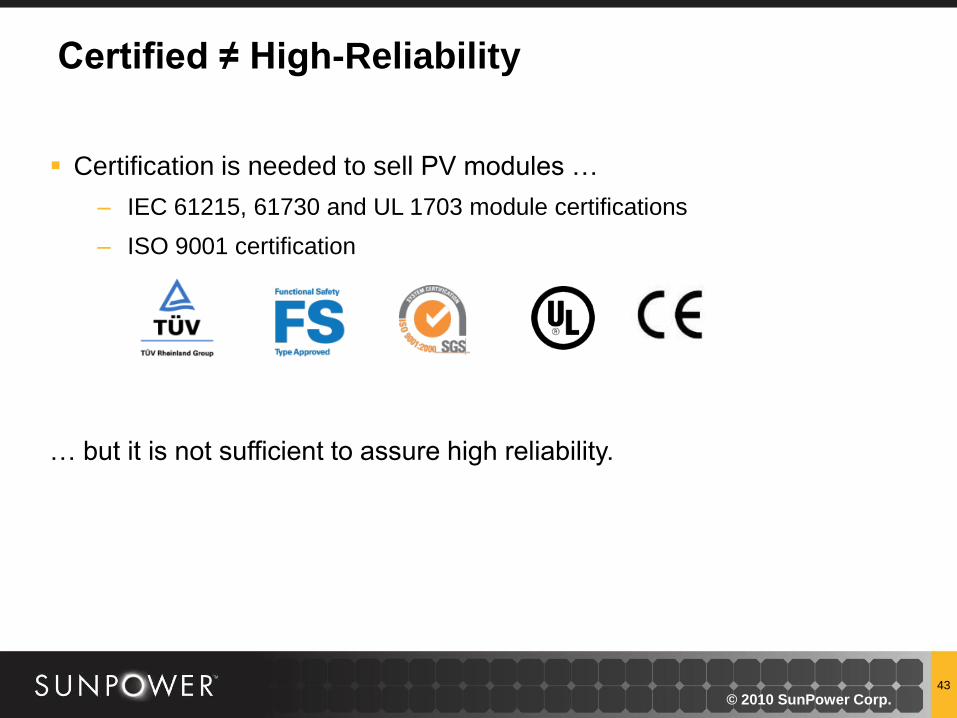
Certified ≠ High-Reliability
… but it is not sufficient to assure high reliability.
43
Certification is needed to sell PV modules …
– IEC 61215, 61730 and UL 1703 module certifications
– ISO 9001 certification
© 2010 SunPower Corp.

Deploying high-reliability PV Modules: Overall Process
44
CustomerStatistical Process Control
Cert.testing
Qualification Testing
• Testing-to-failure
• Long-term testing
• Field testing Cont. Mfg. Testing
• ORT
• HASA
FMEA
• Field Experience
• HALT
• Theoretical under-standing
Supplier Quality Control
• PSC Audit
• STARS score
• Inc. Mat’l Audit
Out-of-box Audit
• Reliability Req’ts,
• Design Concepts
Manufacturing QualityDesign for Reliability
Closed-loop learning
© 2010 SunPower Corp.

Supplier Quality Control: 4 stages
1. Early engagement
• Understand internal requirements, determine sourcing strategy
2. Planning and Preparation
• Set expectations with supplier, develop a roadmap
3. Qualification
• Align expectations, data collection and analysis, conformance
• Change Notification process
• PSC audit (Prevention / Standardize / Customer Satisfaction
• STARS (Supplier Total Achievement Rating System) score
4. Ongoing oversight
Improvement plan, periodic review
Self-assessment with validation (incoming materials inspection)
45
© 2010 SunPower Corp.
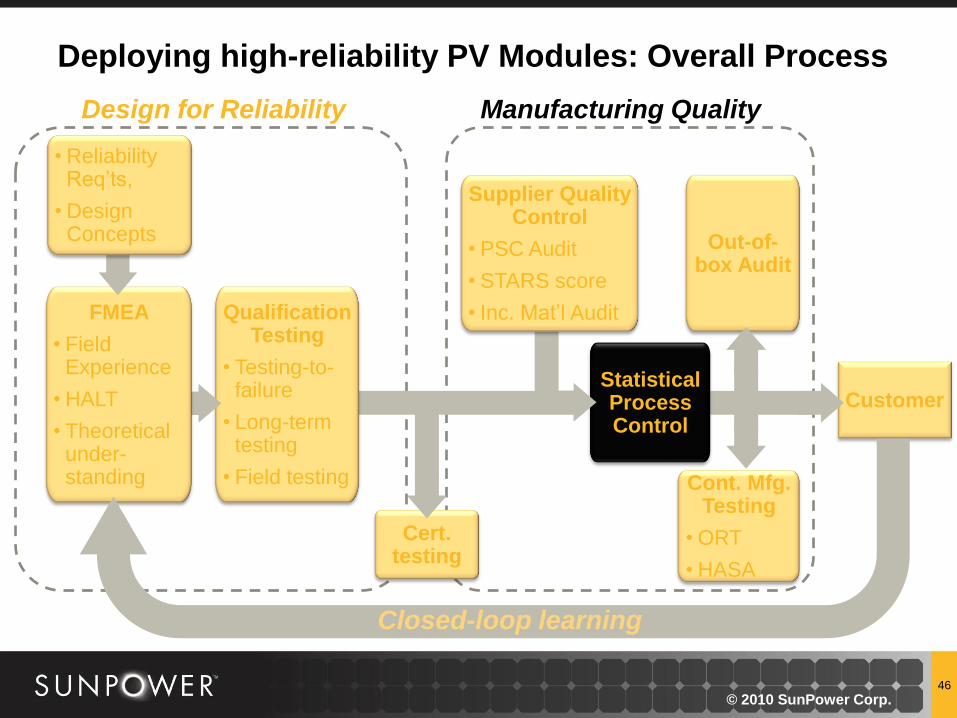
Deploying high-reliability PV Modules: Overall Process
46
CustomerStatistical Process Control
Cert.testing
Qualification Testing
• Testing-to-failure
• Long-term testing
• Field testing Cont. Mfg. Testing
• ORT
• HASA
FMEA
• Field Experience
• HALT
• Theoretical under-standing
Supplier Quality Control
• PSC Audit
• STARS score
• Inc. Mat’l Audit
Out-of-box Audit
• Reliability Req’ts,
• Design Concepts
Manufacturing QualityDesign for Reliability
Closed-loop learning
© 2010 SunPower Corp.

Statistical Process Control (SPC)
From semiconductor fab heritage
Mindset: know the effects of every change for each process step (including interactions).
– Response Surface Mapping defines the Process Windows, limits determined by “running the corners”
SunPower uses a 6-level approach, starting with “What to Control,” and ending with “Continuous Improvement”
47
© 2010 SunPower Corp.

Deploying high-reliability PV Modules: Overall Process
48
CustomerStatistical Process Control
Cert.testing
Qualification Testing
• Testing-to-failure
• Long-term testing
• Field testing Cont. Mfg. Testing
• ORT
• HASA
FMEA
• Field Experience
• HALT
• Theoretical under-standing
Supplier Quality Control
• PSC Audit
• STARS score
• Inc. Mat’l Audit
Out-of-box Audit
• Reliability Req’ts,
• Design Concepts
Manufacturing QualityDesign for Reliability
Closed-loop learning
© 2010 SunPower Corp.

Continuous Manufacturing Reliability Testing
Tests are a final insurance against defects.
Highly Accelerated Stress Audit (HASA) – detect any material defects or manufacturing problems that escaped the supplier quality and manufacturing SPC hurdles.
– Address the key degradation mechanisms from the FMEA
Ongoing Reliability Testing (ORT) - to continue to validate the baseline reliability of the product.
– These are longer-duration tests with milder stress levels.
49
© 2010 SunPower Corp.

Deploying high-reliability PV Modules: Overall Process
50
CustomerStatistical Process Control
Cert.testing
Qualification Testing
• Testing-to-failure
• Long-term testing
• Field testing Cont. Mfg. Testing
• ORT
• HASA
FMEA
• Field Experience
• HALT
• Theoretical under-standing
Supplier Quality Control
• PSC Audit
• STARS score
• Inc. Mat’l Audit
Out-of-box Audit
• Reliability Req’ts,
• Design Concepts
Manufacturing QualityDesign for Reliability
Closed-loop learning
© 2010 SunPower Corp.

© 2010 SunPower Corp.
Reliability essential for non-module components too
Just the waterproof validation testing included:
TAS-100 Wind Driven Rain Test
– Tests for ability to resist rain infiltration in hurricane conditions.
– Wind Speed 35 to 120 mph in segments, with time between segments to allow water to infiltrate, 8.8 in/hr rainfall
Aging & Flood Test
– Accelerated aging, followed by 96 hour immersion test (up to screw heads), adhesion testing.
On-roof flood test by Aquatech consulting
– 4-8 gallons/ft2/hour, performed for one hour.
51
SunPower Smart Mount®
- Reduces materials and installation costs
- No rails, so low profile but cool operation

SUNPOWER CONFIDENTIAL
© 2010 SunPower Corp.
Thank You