Embed Size (px)
Citation preview

Proceedings of the ASME28th International Conference on Ocean, Offshore and Arctic Engineering
May 31-June 05, 2009, Honolulu, USA
OMAE2009-79391
MOTION BEHAVIOUR OF A NEW OFFSHORE LNG TRANSFER SYSTEM AT HARSHOPERATIONAL CONDITIONS
Gunther F. ClaussNaval Architecture & Ocean Engineering
Technical University of BerlinGermany
Email: [email protected]
Florian Sprenger∗Naval Architecture & Ocean Eng.
Technical University of BerlinGermany
Email: [email protected]
Daniel Testa∗Naval Architecture & Ocean Eng.
Technical University of BerlinGermany
Email: [email protected]
Sven HoogIMPaC Offshore Engineering
Hamburg, GermanyEmail: [email protected]
Roland HuhnIMPaC Offshore Engineering
Hamburg, GermanyEmail: [email protected]
ABSTRACTToday, the demand of natural gas from offshore fields is on
a high level and still increasing. Floating turret moored termi-nals receive gas directly from the field via risers and liquefactionis achieved by on-board processing plants. The LNG (liquefiednatural gas) is transferred to periodically operating shuttle car-riers for onshore supply.
This paper presents an innovative offshore LNG transfer sys-tem, based on newly developed flexible cryogenic pipes of 16” in-ner diameter, which allow fast loading/offloading procedures intandem configuration (see Fig. 1), even in harsh environmentalconditions.
The motion characteristics of the proposed concept are in-vestigated in detail by the potential theory programmes WAMITand ANSYS AQWA, respectively, with the focus on the dynamicbehaviour of the multi-body system in waves. Each vessel is gen-erating its own radiation and diffraction wave field affecting themotions of the adjacent vessels and vice versa. Results from cal-culations in the frequency and time domain are compared andshow good agreement. Tolerable relative motions between ter-minal and carrier are limited by maximum torsion and bendingof the flexible transfer pipe.
∗Address all correspondence to these authors.
Figure 1. IMPRESSION OF THE NEW OFFSHORE LNG TRANSFERSYSTEM WITH A CARRIER COUPLED TO THE TERMINAL FOR LOAD-ING
Based on given limiting parameters, the operational rangeof the system and the annual expected downtime is exemplarilycalculated for a location in the north sea. Finally, second-orderforces — induced by drift motions — on the mooring lines be-tween carrier and terminal are presented as time series for athree-hour sea state.
1 Copyright c© 2009 by ASME

INTRODUCTIONFor several decades, natural gas was merely a byproduct of
oil production. Today, its importance as energy source is stillgrowing. Most natural gas is produced from offshore fields, withassociated problems of transportation to further onshore process-ing. The deployment of LNG tank ships (Liquefied Natural Gas)is an alternative to pipelines with increasing significance [1]. Inorder to achieve economically reasonable transportation, the nat-ural gas (mostly methane) is cooled down to -160◦ C, whereby itis liquefied and reduced to 1/600th of its original volume.
For safe storage of LNG, specially insulated loading pipesand tanks are required. It has to be distinguished between twotypes of tanks: octahedral membrane tanks (see Fig. 2, top left)and spherical ’MOSS’ tanks (see Fig. 2, top right). Until to-
source: http://www.globalsecurity.orgsource: http://www.lngoneworld.com
source: http://www.singlebuoy.comsource: http://www.beg.utexas.edu/energyecon/lng/
Figure 2. LNG-CARRIER WITH MEMBRANE TANKS (TOP LEFT), ANDSPHERICAL ’MOSS’ TANKS (TOP RIGHT), IMPRESSIONS OF OFF-SHORE LOADING IN SIDE-BY-SIDE (BOTTOM LEFT) AND TANDEMCONFIGURATION (BOTTOM RIGHT)
day, only one offshore LNG transfer system — based on theemergency unloading technology — was tested in calm waterconditions and side-by-side configuration using 8” non-insulatedcomposite hoses [2]. However, the increasing loading capacityof currently built LNG carriers (up to 260.000 m3) creates a newmarket for fast and safe loading/offloading concepts — i.e. largerpipe diameters and transfer operations in rough seas [3].
Offshore terminal designs for production and processing ofnatural gas are typically fixed at a certain location by turret moor-ing and transfer the liquefied gas to periodically operating shuttletankers in side-by-side configuration (see Fig. 2, bottom left) [4],[5].
In the framework of the joint research project Maritime PipeLoading System 20” (MPLS20), an innovative offshore transfersystem between a turret moored terminal barge and a shuttle car-
rier in tandem configuration is developed [6]. Brugg Pipe Sys-tems is designing a corrugated transfer pipe of 16” inner diameterfor LNG loading/offloading — which is significantly exceedingcurrently existing pipe diameters and hence transfer rates. Thework of Nexans Industries focusses on connection techniques,IMPaC Offshore Engineering GmbH is in authority of the ap-proaching and handling system and Technical University Berlinis conducting model tests as well as numerical simulations in or-der to analyse the hydrodynamical characteristics of the coupledsystem.
In the following sections, the system is analysed in tan-dem configuration (see Fig. 2, bottom right) at a water depth ofd = 100 m. The shuttle carrier is towed between special mooringwings of 40 m length at the stern of the terminal, and is mooredby six hawsers at a distance of 10 m. A loading frame is moveddirectly above the connectors on board of the tanker and fourspecially developed 16” transfer pipes are connected — three toload the tanks of the carrier and one additional pipe for vaporreturn.
MOTION ANALYSISFor ensuring save loading and offloading procedures, de-
tailed knowledge on the motion characteristics of the carrier andthe terminal in tandem configuration is required. Due to the tur-ret mooring of the terminal, the entire system is weathervan-ing according to the angle of attack β of the superimposed en-vironmental loads from waves, current and wind (see Fig. 3).As an idealized case, head waves (β = 180◦) are exclusively
waves
windcurrent
turret mooring
������
Figure 3. WEATHERVANING EFFECTS DUE TO THE TURRETMOORING OF THE SYSTEM
considered in the following investigations. The focus lies onthe transfer configuration with completely filled cargo tanks andthe respective distance of 10 m between terminal stern and car-rier bow is applied for all computations. The main dimensionsof the terminal and the carrier are shown in Tab. 1. The car-rier features four tanks of equal size with a total loading ca-
2 Copyright c© 2009 by ASME
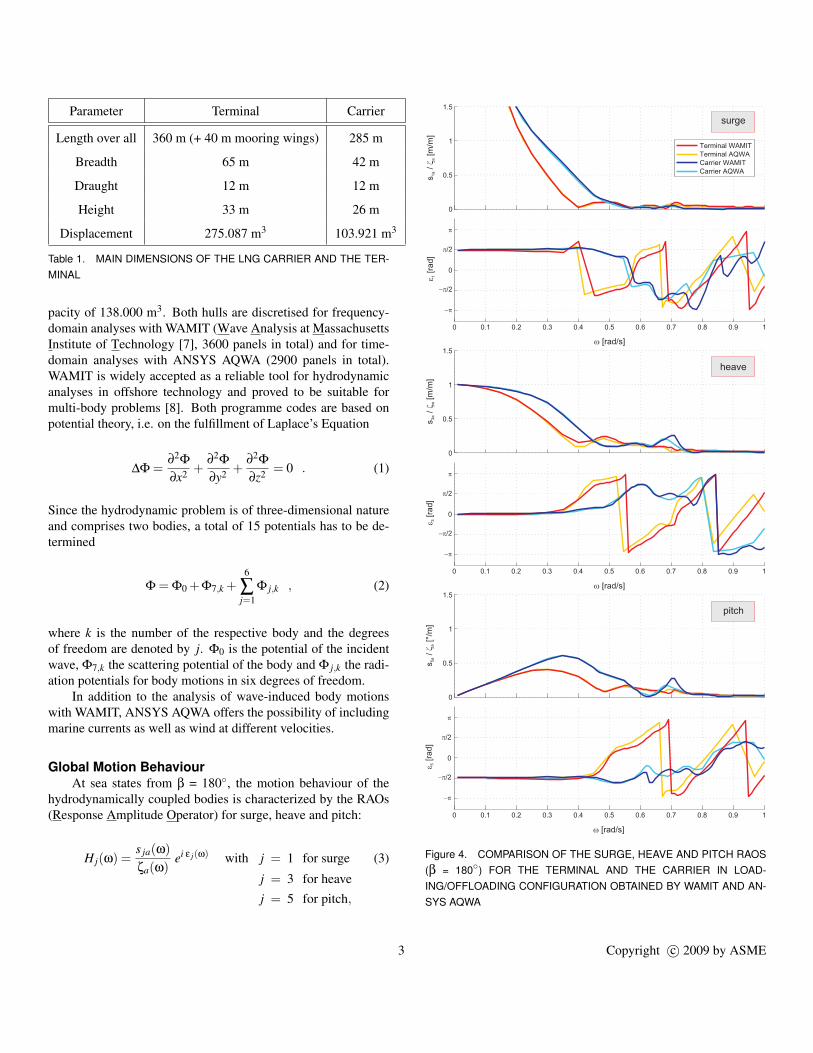
Parameter Terminal Carrier
Length over all 360 m (+ 40 m mooring wings) 285 m
Breadth 65 m 42 m
Draught 12 m 12 m
Height 33 m 26 m
Displacement 275.087 m3 103.921 m3
Table 1. MAIN DIMENSIONS OF THE LNG CARRIER AND THE TER-MINAL
pacity of 138.000 m3. Both hulls are discretised for frequency-domain analyses with WAMIT (Wave Analysis at MassachusettsInstitute of Technology [7], 3600 panels in total) and for time-domain analyses with ANSYS AQWA (2900 panels in total).WAMIT is widely accepted as a reliable tool for hydrodynamicanalyses in offshore technology and proved to be suitable formulti-body problems [8]. Both programme codes are based onpotential theory, i.e. on the fulfillment of Laplace’s Equation
∆Φ =∂2Φ
∂x2 +∂2Φ
∂y2 +∂2Φ
∂z2 = 0 . (1)
Since the hydrodynamic problem is of three-dimensional natureand comprises two bodies, a total of 15 potentials has to be de-termined
Φ = Φ0 +Φ7,k +6
∑j=1
Φ j,k , (2)
where k is the number of the respective body and the degreesof freedom are denoted by j. Φ0 is the potential of the incidentwave, Φ7,k the scattering potential of the body and Φ j,k the radi-ation potentials for body motions in six degrees of freedom.
In addition to the analysis of wave-induced body motionswith WAMIT, ANSYS AQWA offers the possibility of includingmarine currents as well as wind at different velocities.
Global Motion BehaviourAt sea states from β = 180◦, the motion behaviour of the
hydrodynamically coupled bodies is characterized by the RAOs(Response Amplitude Operator) for surge, heave and pitch:
H j(ω) =s ja(ω)ζa(ω)
ei ε j(ω) with j = 1 for surge (3)
j = 3 for heavej = 5 for pitch,
� [rad/s]
� 5[r
ad
]
�
�/2
��/2
��
s/
[°/m
]5
aa
�
pitch
s/
[m/m
]3
aa
�� 3
[ra
d]
�
�/2
��/2
��
� [rad/s]
heave
s/
[m/m
]1
aa
�� 1
[ra
d]
�
�/2
��/2
��
� [rad/s]
surge
Figure 4. COMPARISON OF THE SURGE, HEAVE AND PITCH RAOS(β = 180◦) FOR THE TERMINAL AND THE CARRIER IN LOAD-ING/OFFLOADING CONFIGURATION OBTAINED BY WAMIT AND AN-SYS AQWA
3 Copyright c© 2009 by ASME

where ω is the angular wave frequency, ζa is the wave amplitude,s ja is the amplitude of the respective body motion and ε j is thecorresponding phase angle. The absolute value of this complexnumber is obtained by |H j(ω)| whereas the phase shift is calcu-lated by
ε j(ω) = tan−1(
ℑ(H j(ω))ℜ(H j(ω))
). (4)
Fig. 4 shows the absolute values and phase angles of surge, heaveand pitch RAOs for the carrier and the terminal. The comparisonof results from WAMIT and ANSYS AQWA shows a good over-all agreement, especially concerning the absolute values. Thesame applies for the phase angles, with some slight deviationsoccurring for high frequencies — i.e. short waves. Both, the car-rier and the terminal follow the wave contour in very long wavesand perform large surge motions with 90◦ phase shift (largest de-flections at the zero crossings of the waves) until the wave lengthbecomes smaller than their hull length. Due to the restrictedwater depth (d = 100 m), the surge RAOs converge to infinityin very long waves since the horizontal semi-major axis of theparticle orbital paths ζa cosh(k(z+d))/sinh(kd) is growing withdecreasing wave numbers k. The absolute value of the heave mo-tion converges to one meter heave amplitude per meter wave am-plitude without phase shift for very long waves, where both bod-ies follow the surface elevation like a floating cork. For shorterwaves, heave motions are continuously decreasing. However, alocal maximum for the carrier motions of 0.26 m per meter waveamplitude can be observed at ω ≈ 0.7 rad/s. The pitch motionsconverge to zero in very long waves and increase with -90◦ phaseshift (largest pitch angles at zero crossings of the waves — i.e.on the wave slope) to a global maximum of 0.6◦ per meter waveamplitude at ω = 0.35 rad/s for the carrier and 0.41◦ per meterwave amplitude at ω = 0.3 rad/s for the terminal. Also, a localmaximum of 0.27◦ per meter wave amplitude at ω ≈ 0.7 rad/scan be observed for the carrier pitch motions.
Relative MotionsFor the design of the offshore transfer concept, the most criti-
cal property that has to be assessed in detail is the relative motionbetween the LNG carrier and the terminal barge in dependency ofthe environmental conditions. Considering head seas (β = 180◦)exclusively, one point per body is chosen to investigate the rela-tive motion characteristics. First, two new complex RAOs (Hx, jand Hz, j) for each point have to be calculated by the followingprocedure
Hx, j(ω)0
Hz, j(ω)
=
H1, j(ω)0
H3, j(ω)
+
0H5, j(ω)
0
×dx, j
dy, jdz, j
(5)
0
1
2
3
� 1,r
el[r
ad]
�
�/2
��/2
��
s/
[m/m
]1
a,r
el
a�
� [rad/s]
� [rad/s]
� 3,r
el[r
ad]
�
�/2
��/2
��
s/
[m/m
]3
a,r
el
a�
� = 0.3 rad/s
� = 0.71 rad/s
0
0.5
1
1.5
0 0.1 0.2 0.3 0.4 0.5 0.6 0.7 0.8 0.9 1
0 0.1 0.2 0.3 0.4 0.5 0.6 0.7 0.8 0.9 1
relative x-motionsmooring point on terminal
mooring point on carrier
relative z-motions
Figure 5. ABSOLUTE VALUES AND PHASES OF RAOS OF RELATIVEX- AND Z-MOTIONS FOR THE MOORING POINTS OF THE FORELINE
where the original translatory RAOs of each body are denotedby H1, j and H3, j, the rotatory RAOs by H5, j and the distancebetween the body fixed coordinate systems and the points of in-terest by dx, j, dy, j and dz, j. In order to obtain the relative motionsbetween the two points, the difference of the RAOs for x-motionsand z-motions is calculated
Hx,rel(ω) = Hx,1(ω) − Hx,2(ω)Hz,rel(ω) = Hz,1(ω) − Hz,2(ω) . (6)
For the subsequent calculations, the mooring points of thenose line between carrier and terminal are chosen. Since theseare the points of greatest distance to the centres of rotation (bowof the tanker, stern of the terminal), they will experience the high-est motions. Fig. 5 shows the RAOs of the relative motions inx- and z-direction. The relative x-motions converge to zero forvery long waves, i.e. both bodies follow the surface elevationwith large absolute surge motions but no relative x-motions. The
4 Copyright c© 2009 by ASME

-2
0
2
-2
0
2
-2
0
2
z [m
]
-2
0
2
-800 -600 -400 -200 0 200 400 600-2
0
2
x [m]
LNG
LNG
LNG
LNG
LNG
w = 0.30 rad/s
-2
0
2
-2
0
2
-2
0
2
-2
0
2
-800 -600 -400 -200 0 200 400 600-2
0
2
x [m]
z [m
]
w = 0.71 rad/s
LNG
LNG
LNG
LNG
LNG
Figure 6. VISUALIZATION OF THE HEAVE AND PITCH MOTIONOF THE LNG CARRIER AND THE TERMINAL BARGE IN REGULARWAVES WITH ω = 0.30 RAD/S (TOP) AND ω = 0.71 RAD/S (BOTTOM)
global maximum of the relative x-motions is 0.45 m per meterwave amplitude at ω = 0.3 rad/s with ≈ 90◦ phase shift. Forshorter waves, the relative motions are decreasing with a verysmall local maximum occurring at ω ≈ 0.7 rad/s.
In the z-direction, relative motions also converge to zero forvery long waves. At ω = 0.30 rad/s, the global maximum reaches2.73 m relative motion per meter wave amplitude with a phaseshift of 90◦. At ω = 0.71 rad/s, a local maximum of 0.99 m rel-ative motion per meter wave amplitude is observed. The red andcyan markers indicate angular wave frequencies (ω = 0.30 rad/sand ω = 0.71 rad/s, respectively), for which the calculated heaveand pitch motions of the carrier and the barge are exemplarilyvisualized at four different instances in Fig. 6.
7
8
9
10
11
12
13
rela
tive
x-m
otion
[m]
0 1000 2000 3000 4000 5000 6000 7000 8000 9000 100000
2
4
6
8
10
12
t [s]
rela
tive
z-m
otion
[m]
ANSYS AQWA
7
8
9
10
11
12
13
rela
tive
x-m
otio
n[m
] WAMIT
0 1000 2000 3000 4000 5000 6000 7000 8000 9000 100000
2
4
6
8
10
12
t [s]
rela
tive
z-m
otion
[m]
Figure 7. COMPARISON OF TIME SERIES OF RELATIVE X- AND Z-MOTIONS OBTAINED BY ANSYS AQWA (CYAN) AND WAMIT (DARKBLUE)
Please note that the impression of the terminal barge and thecarrier is scaled correctly with respect to the wave length (x-axis)but not to the wave height (y-axis). In both regular sea states(each with ζa = 1 m), the highest relative z-motions occur at thezero-crossing of the waves, visualizing the phase shift of 90◦ be-tween relative motions and the surface elevation. For the longerwave with ω = 0.30 rad/s, higher motions are observed — 2.73 mper meter wave amplitude compared to 0.99 m per meter waveamplitude for the short wave (ω = 0.71 rad/s).
In order to compare the results of the frequency-domain anal-yses conducted with WAMIT to the time-domain results of AN-SYS AQWA, inverse Fast-Fourier-Transformations (IFFT) withrandom phases are applied. In Fig. 7, the respective time se-ries for an irregular sea state (JONSWAP, γ = 3.3, Hs = 5.5 m,ωp = 0.5 rad/s) of approx. 3 hours are shown. The motions inboth directions feature an offset due to the horizontal and verticaldistances of the mooring points of the nose line on the terminaland the carrier (∆x = 10 m, ∆z = 6.4 m). The maximum tolerablerelative motion amplitudes are indicated by red lines (± 2 m inx-direction and± 5 m in z-direction). Green lines show the max-imum occurring motion amplitudes, which are within the toler-able limits for all cases. Since the irregular sea states generatedby both programme codes feature random phases, maximum mo-tion values of the time series are compared. The agreement forthe maximum positive relative x- and z-motion as well as the
5 Copyright c© 2009 by ASME

maximum negative relative x- and z-motion is very good, with amaximum deviation of 9.79 % (see Tab. 2).
Parameter WAMIT ANSYS AQWA
(sxa,rel)max +0.71 m / -0.78 m +0.66 m / -0.70 m
(sza,rel)max +4.40 m / -4.39 m +4.49 m / -4.50 m
Table 2. COMPARISON OF MAXIMUM RELATIVE MOTION AMPLI-TUDES
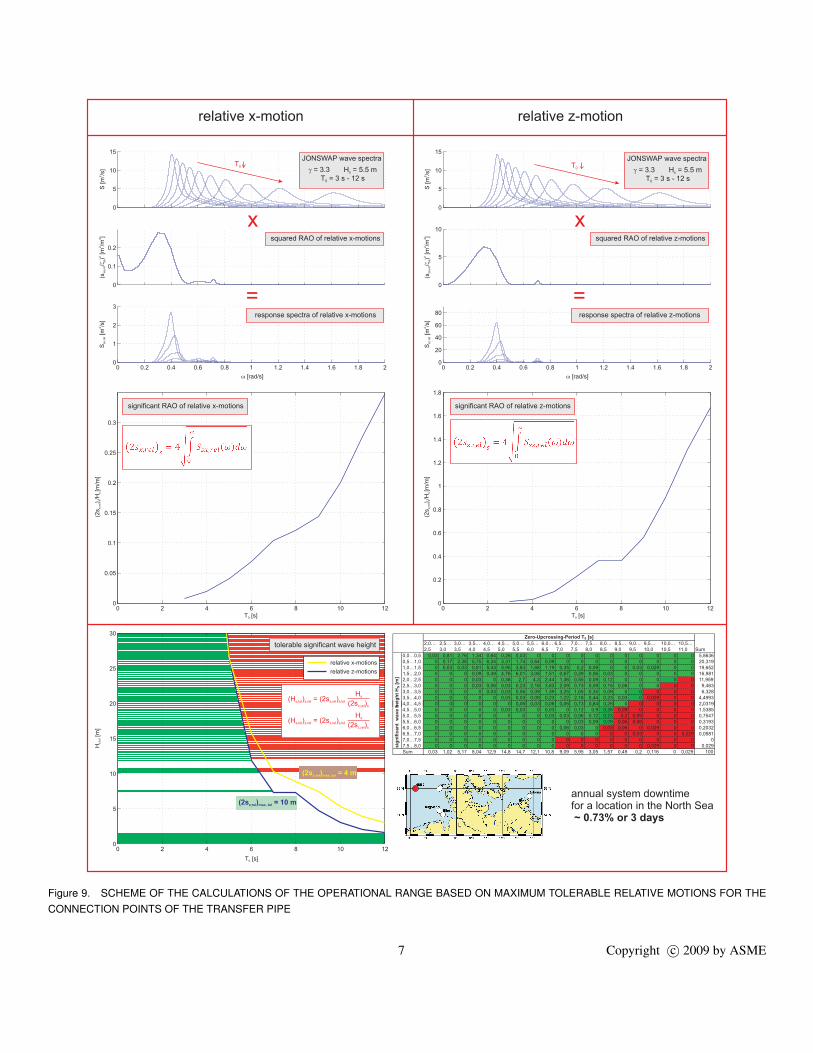
Operational Range of the Proposed ConceptOn basis of the relative motion RAOs for the connection
points of the transfer pipe, the operational range of the system— i.e. terminal and carrier in tandem configuration at a distanceof 10 m (loading condition) — is determined. The location cho-sen for this exemplary investigation is a position in the North Sea(55◦ 0.00 N, 6◦ 20.00 E).
At first, a range of JONSWAP spectra with varying zero-upcrossing-periods (3 s ≤ T0 ≤ 12 s) is multiplied with thesquared absolute value of the relative motion RAOs to obtain theresponse spectra of the relative motions
Ss j,rel(ω,T0) = S(ω,T0) |H j,rel(ω)|2 . (7)
Calculating the significant double amplitudes
(2s j,rel)s(T0) = 4
√√√√ ∞∫0
Ss j,rel(ω,T0) dω , (8)
and dividing them by the significant wave height, gives the sig-nificant RAOs for the relative motions. For predefined maximumtolerable relative motions (limited by the maximum bending ra-dius of the loading pipe), tolerable significant wave heights arecalculated in dependency of the zero-upcrossing-periods
(Hs,tol) j,rel(T0) = (2s j,rel)s,tolHs
(2s j,rel)s(T0), (9)
where the tolerable significant relative motion double amplitudesare given with (2sx,rel)s,tol = 2.15 m and (2sz,rel)s,tol = 5.38 m (as-suming a statistical value of 1.86 for the ratio of tolerable max-imum relative motions to tolerable significant relative motions).The data obtained can now be combined with a scatter diagram
for the chosen location in the North Sea [9] in order to determinethe expected annual downtime. The entire calculation process isillustrated in Fig. 9 on page 7 and the result is an annual down-time of 0.73 % or 3 days.
Determination of Mooring ForcesThe LNG carrier is towed between the mooring wings at the
stern of the terminal and is moored in a symmetrical arrangementof six hawsers — two nose lines, two fore lines and two foresprings. The mooring lines are dimensioned to absorb second-order forces, resulting from non-linear drift motions of the sys-tem. First-order forces due to linear sea state-induced body mo-tions are significantly higher and cannot be absorbed. The lineshave to be veered and hauled up in order not to be damaged.
In Fig. 8, time series of the second-order forces on the forespring (red), fore line (green) and the nose line (blue) are shownfor irregular head seas (β = 180◦) based on a JONSWAP spec-trum with Hs = 5.5 m, ωp = 0.5 rad/s and γ = 3.3 calculated withANSYS AQWA. Additionally, a constant current (vc = 1 m/s,
0
500
1000
1500
2000
2500
3000
fore
sp
rin
gfo
rce
[kN
]
0
500
1000
1500
2000
2500
3000
fore
line
forc
e[k
N]
0 1000 2000 3000 4000 5000 6000 7000 8000 9000 100000
500
1000
1500
2000
2500
3000
t [s]
no
se
line
forc
e[k
N]
fore line
nose line
fore spring line stiffness 2000 kN/m
line length 35 m
line stiffness 2400 kN/m
line length 20 m
line stiffness 1140 kN/m
line length 13 m
Figure 8. TIME SERIES OF THE SECOND-ORDER FORCES ON THENOSE LINE (BLUE), FORE LINE (GREEN) AND FORE SPRING (RED)CALCULATED WITH ANSYS AQWA FOR AN IRREGULAR SEA STATE(JONSWAP, Hs = 5.5 m, ωp = 0.5 rad/s) AND β = 180◦
βc = 180◦) and wind (vw = 30 m/s, βw = 180◦) is assumed for theenvironmental conditions of the simulation. At the fore spring(length 35 m, stiffness 2000 kN/m), a maximum tensile forceof 2511 kN is observed. The fore line (length 20 m, stiffness2400 kN/m) has to absorb a maximum tensile force of 1861 kN,whereas the second-order loads on the nose line (length 13 m,stiffness 1140 kN/m) reach a peak value of 2821 kN for the cho-sen conditions.
6 Copyright c© 2009 by ASME
0 2 4 6 8 10 120
0.2
0.4
0.6
0.8
1
1.2
1.4
1.6
1.8
T0
JONSWAP wave spectra
� = 3.3 H = 5.5 m
T = 3 s - 12 ss
0
S[m
/s]
2(s
/)
[m/m
]xa,r
el
a�
22
2
x
=
S[m
/s]
sx,r
el
2
� [rad/s]
squared RAO of relative x-motions
response spectra of relative x-motions
0 2 4 6 8 10 120
0.05
0.1
0.15
0.2
0.25
0.3
T [s]0
(2s
)/H
[m/m
]x,r
el
ss
significant RAO of relative x-motions
T [s]0
T0
JONSWAP wave spectra
� = 3.3 H = 5.5 m
T = 3 s - 12 ss
0
x
=
squared RAO of relative z-motions
response spectra of relative z-motions
S[m
/s]
2(s
/)
[m/m
]za,r
el
a�
22
2S
[m/s
]sz,r
el
2
� [rad/s]
significant RAO of relative z-motions
H[m
]s,tol
relative x-motions
relative z-motions
tolerable significant wave height
(H ) = (2s )s,tol x,rel x,rel s,tol
Hs
(2s )x,rel s
(H ) = (2s )s,tol z,rel z,rel s,tol
Hs
(2s )z,rel s
(2s
)/H
[m/m
]z,r
el
ss
T [s]0
(2s ) = 4 mx,rel max, tol
(2s ) = 10 mz,rel max, tol
annual systemfor a location in the North Sea
downtime
~ 0.73% or 3 days
relative x-motion relative z-motion
0
h
, , , ,
0
0
h
Zero-Upcrossing-Period T0 [s]
2,
2,
0…
5
2,5…
3,0
3,0
3,5
… 3
4
,5…
,0
4,0…
4,5
4,5
5,0
… 5
5
,0…
,5
5,5…
6,0
6,0
6,5
… 6,5…
7,0
7,0…
7,5
7,5
8,0
… 8,0
8,5
… 8
9
,5…
,0
9,0…
9,5
9,5…
10,0
10,0…
10,5
10,5…
11,0 Sum
eig
ht
HS
[m]
sig
nif
ican
tw
ave
0,0…0,5 0,03 0,81 2,76 1,34 0,64 0,26 0,03 0 0 0 0 0 0 0 0 0 0 0 5,8636
0,5…1,0 0 0,17 2,38 5,75 6,24 3,31 1,74 0,64 0,09 0 0 0 0 0 0 0 0 0 20,319
1,0…1,5 0 0,03 0,03 0,81 5,43 5,95 3,83 1,68 1,19 0,35 0,2 0,09 0 0 0,03 0,029 0 0 19,652
1,5…2,0 0 0 0 0,09 0,49 4,76 6,01 3,08 1,51 0,67 0,29 0,06 0,03 0 0 0 0 0 16,981
2,0…2,5 0 0 0 0,03 0 0,38 2,7 4,3 2,44 1,36 0,55 0,09 0,12 0 0 0 0 0 11,959
2,5…3,0 0 0 0 0,03 0,06 0,03 0,23 2,18 3,83 2,09 0,73 0,09 0,15 0,06 0 0 0 0 9,463
3,0…3,5 0 0 0 0 0,03 0,03 0,06 0,09 1,39 3,25 1,05 0,35 0,09 0 0 0 0 0 6,328
3,5…4,0 0 0 0 0 0 ,03 0,03 0,09 0,23 1,22 2,18 0,44 0,23 0,03 0 0,029 0 0 4,4993
4,0…4, ,,5 0 0 0 0 0 0 0,06, 0,03 0,06 0,06, 0,73 0,84 0,26, 0 0 0 0 0 2,0319,
4,5…5,0 0 0 0 0 0 ,03 0,03 0 0,03 0 0,12 0,9 0,35 0,09 0 0 0 0 1,5385
5,0…5,5 0 0 0 0 0 0 0 0 ,03 0,03 0,06 0,12 0,23 0,2 0,09 0 0 0 0,7547
5,5…6,0 0 0 0 0 0 0 0 0 0 0 0,03 0,09 0,09 0,06 0,06 0 0 0 0,3193
6,0…6,5 0 0 0 0 0 0 0 0 0 0,06 0,03 0 0,03 0,06 0 0,029 0 0 0,2032
6,5…7,0 0 0 0 0 0 0 0 0 0 0 0 0 0 0 0,03 0 0 0,029 0,0581
7,0…7,5 0 0 0 0 0 0 0 0 0 0 0 0 0 0 0 0 0 0 0
7,5…8,0 0 0 0 0 0 0 0 0 0 0 0 0 0 0 0 0,029 0 0 0,029
Sum 0,03 1,02 5,17 8,04 12,9 14,8 14,7 12,1 10,8 9,09 5,95 3,05 1,57 0,49 0,2 0,116 0 0,029 100
Figure 9. SCHEME OF THE CALCULATIONS OF THE OPERATIONAL RANGE BASED ON MAXIMUM TOLERABLE RELATIVE MOTIONS FOR THECONNECTION POINTS OF THE TRANSFER PIPE
7 Copyright c© 2009 by ASME
CONCLUSIONSAn innovative offshore LNG transfer system is introduced,
where the shuttle carrier is towed between the the mooring wingsof a turret moored terminal to a distance of 10 m in tandemconfiguration. The liquefied gas is simultaneously transferredinto four membrane tanks through three specially developed 16”pipes with one additional pipe for vapor return.
Various numerical analyses with the potential theory solversWAMIT and ANSYS AQWA have been performed, where theinteraction of the multi-body system due to diffraction and radi-ation effects is taken into account. Since the system takes ad-vantage of the weathervaning effect, the results are presentedfor head seas exclusively (JONSWAP, γ = 3.3, Hs = 5.5 m,ωp = 0.5 rad/s, β = 180◦).
The surge, heave and pitch RAOs calculated for both bodiesshow good agreement of absolute values and phase angles. Amaximum value of 0.6◦ per meter wave amplitude is observedfor the carrier at ω = 0.35 rad/s and of 0.41◦ per meter waveamplitude at ω = 0.3 rad/s for the terminal. The graphs of allabsolute values feature minor local maxima at ω ≈ 0.7 rad/s.
These local peaks are also existing in the RAOs of the rela-tive x- and z-motions. The relative motions have been calculatedwith respect to the mooring points for the nose line on carrier andterminal. The calcualtions yield maximum values of 2.73 m permeter wave amplitude for the z-direction and 0.45 m per meterwave amplitude for the x-direction. The validation of time se-ries from ANSYS AQWA simulations with results from WAMITtransferred into time-domain via IFFT show very good agree-ment with a maximum deviation of 9.79 %.
The investigation of relative motion RAOs for the connect-ing points of the transfer pipe are extended by spectral analyses,leading to an operational range for a location in the North Sea.For maximum tolerable relative x-motion amplitudes of ± 2 mand z-motion amplitudes of ± 5 m (limited by the maximumbending radius of the pipe), a downtime of 3 days per year isexpected.
Finally, the second-order tensile forces on the mooring linesof the carrier are determined with ANSYS AQWA for the layoutof nose lines, fore lines and fore springs.
The results presented emphasize that the proposed systemwith tandem configuration for offshore LNG transfer shows ex-cellent seakeeping behaviour and the relative motions do not ex-ceed tolerable values for the chosen sea states. Assuming a lo-cation in the North Sea, a marginal downtime of 3 days per yearcan be expected.
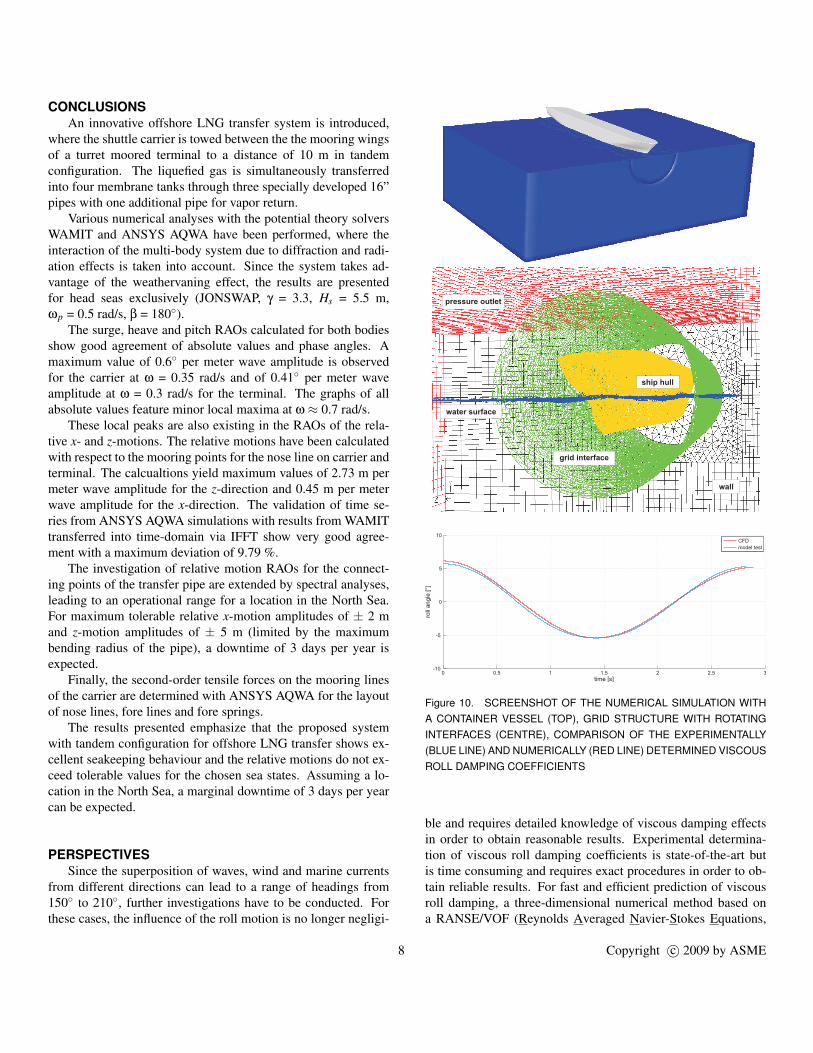
PERSPECTIVESSince the superposition of waves, wind and marine currents
from different directions can lead to a range of headings from150◦ to 210◦, further investigations have to be conducted. Forthese cases, the influence of the roll motion is no longer negligi-
CFD
model test
0 0.5 1 1.5 2 2.5 3-10
-5
0
5
10
time [s]
roll
an
gle
[°]
ship hull
pressure outlet
grid interface
wall
water surface
Figure 10. SCREENSHOT OF THE NUMERICAL SIMULATION WITHA CONTAINER VESSEL (TOP), GRID STRUCTURE WITH ROTATINGINTERFACES (CENTRE), COMPARISON OF THE EXPERIMENTALLY(BLUE LINE) AND NUMERICALLY (RED LINE) DETERMINED VISCOUSROLL DAMPING COEFFICIENTS
ble and requires detailed knowledge of viscous damping effectsin order to obtain reasonable results. Experimental determina-tion of viscous roll damping coefficients is state-of-the-art butis time consuming and requires exact procedures in order to ob-tain reliable results. For fast and efficient prediction of viscousroll damping, a three-dimensional numerical method based ona RANSE/VOF (Reynolds Averaged Navier-Stokes Equations,
8 Copyright c© 2009 by ASME
GZ
[m]
� [°]
�dyn = 42.1°
�dyn = 39.4°
�stat = 61.3° �stat = 78.5°
GM0 = 3.86 m
GM0 = 1.13 m
with free surfaces
without free surfaces
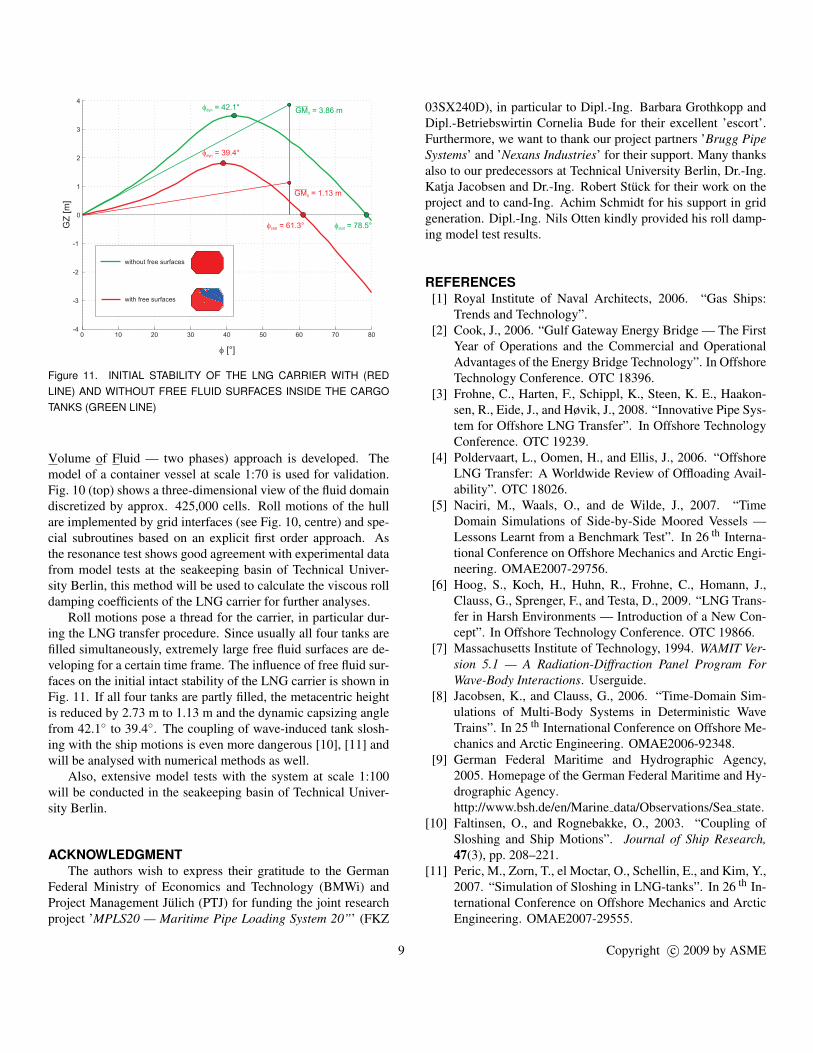
Figure 11. INITIAL STABILITY OF THE LNG CARRIER WITH (REDLINE) AND WITHOUT FREE FLUID SURFACES INSIDE THE CARGOTANKS (GREEN LINE)
Volume of Fluid — two phases) approach is developed. Themodel of a container vessel at scale 1:70 is used for validation.Fig. 10 (top) shows a three-dimensional view of the fluid domaindiscretized by approx. 425,000 cells. Roll motions of the hullare implemented by grid interfaces (see Fig. 10, centre) and spe-cial subroutines based on an explicit first order approach. Asthe resonance test shows good agreement with experimental datafrom model tests at the seakeeping basin of Technical Univer-sity Berlin, this method will be used to calculate the viscous rolldamping coefficients of the LNG carrier for further analyses.
Roll motions pose a thread for the carrier, in particular dur-ing the LNG transfer procedure. Since usually all four tanks arefilled simultaneously, extremely large free fluid surfaces are de-veloping for a certain time frame. The influence of free fluid sur-faces on the initial intact stability of the LNG carrier is shown inFig. 11. If all four tanks are partly filled, the metacentric heightis reduced by 2.73 m to 1.13 m and the dynamic capsizing anglefrom 42.1◦ to 39.4◦. The coupling of wave-induced tank slosh-ing with the ship motions is even more dangerous [10], [11] andwill be analysed with numerical methods as well.
Also, extensive model tests with the system at scale 1:100will be conducted in the seakeeping basin of Technical Univer-sity Berlin.
ACKNOWLEDGMENTThe authors wish to express their gratitude to the German
Federal Ministry of Economics and Technology (BMWi) andProject Management Julich (PTJ) for funding the joint researchproject ’MPLS20 — Maritime Pipe Loading System 20”’ (FKZ
03SX240D), in particular to Dipl.-Ing. Barbara Grothkopp andDipl.-Betriebswirtin Cornelia Bude for their excellent ’escort’.Furthermore, we want to thank our project partners ’Brugg PipeSystems’ and ’Nexans Industries’ for their support. Many thanksalso to our predecessors at Technical University Berlin, Dr.-Ing.Katja Jacobsen and Dr.-Ing. Robert Stuck for their work on theproject and to cand-Ing. Achim Schmidt for his support in gridgeneration. Dipl.-Ing. Nils Otten kindly provided his roll damp-ing model test results.
REFERENCES[1] Royal Institute of Naval Architects, 2006. “Gas Ships:
Trends and Technology”.[2] Cook, J., 2006. “Gulf Gateway Energy Bridge — The First
Year of Operations and the Commercial and OperationalAdvantages of the Energy Bridge Technology”. In OffshoreTechnology Conference. OTC 18396.
[3] Frohne, C., Harten, F., Schippl, K., Steen, K. E., Haakon-sen, R., Eide, J., and Høvik, J., 2008. “Innovative Pipe Sys-tem for Offshore LNG Transfer”. In Offshore TechnologyConference. OTC 19239.
[4] Poldervaart, L., Oomen, H., and Ellis, J., 2006. “OffshoreLNG Transfer: A Worldwide Review of Offloading Avail-ability”. OTC 18026.
[5] Naciri, M., Waals, O., and de Wilde, J., 2007. “TimeDomain Simulations of Side-by-Side Moored Vessels —Lessons Learnt from a Benchmark Test”. In 26 th Interna-tional Conference on Offshore Mechanics and Arctic Engi-neering. OMAE2007-29756.
[6] Hoog, S., Koch, H., Huhn, R., Frohne, C., Homann, J.,Clauss, G., Sprenger, F., and Testa, D., 2009. “LNG Trans-fer in Harsh Environments — Introduction of a New Con-cept”. In Offshore Technology Conference. OTC 19866.
[7] Massachusetts Institute of Technology, 1994. WAMIT Ver-sion 5.1 — A Radiation-Diffraction Panel Program ForWave-Body Interactions. Userguide.
[8] Jacobsen, K., and Clauss, G., 2006. “Time-Domain Sim-ulations of Multi-Body Systems in Deterministic WaveTrains”. In 25 th International Conference on Offshore Me-chanics and Arctic Engineering. OMAE2006-92348.
[9] German Federal Maritime and Hydrographic Agency,2005. Homepage of the German Federal Maritime and Hy-drographic Agency.http://www.bsh.de/en/Marine data/Observations/Sea state.
[10] Faltinsen, O., and Rognebakke, O., 2003. “Coupling ofSloshing and Ship Motions”. Journal of Ship Research,47(3), pp. 208–221.
[11] Peric, M., Zorn, T., el Moctar, O., Schellin, E., and Kim, Y.,2007. “Simulation of Sloshing in LNG-tanks”. In 26 th In-ternational Conference on Offshore Mechanics and ArcticEngineering. OMAE2007-29555.
9 Copyright c© 2009 by ASME