Embed Size (px)
Citation preview

Morris GelbChief Operating Officer
Morgan StanleyFebruary 13, 2002

Statements in this presentation relating to matters that are not historical facts are forward-looking statements. These forward-looking statements are just predictions or expectations and are subject to risks and uncertainties. Actual results could differ materially, based on factors including but not limited to future global economic conditions, availability of capital markets, industry production capacity and operating rates, technological developments, the supply demand balance for the products produced by the Company and its joint ventures, competitive products and pricing pressures, increases in raw material and/or energy costs, changes in governmental regulations and other risk factors. For more detailed information about the factors that could cause our actual results to differ materially, please refer to Lyondell Chemical Company's Annual Report on Form 10-K for the year ended December 31, 2000, Lyondell’s Quarterly Report on Form 10-Q for the quarter ended September 30, 2001, as well as Lyondell’s Annual Report on Form 10-K for the year ended December 31, 2001 and Lyondell’s 2002 proxy statement, which will be filed with the SEC. Page 2
Safe Harbor Language

Page 3
Lyondell Chemical Company - Intermediate Chemicals and
Derivatives
– World’s leading producer of PO and derivatives
– 100% Ownership
Equistar - Petrochemicals and Polymers
– A leading North American producer of ethylene, propylene and
polyethylene
– Low cost position based on feedstock flexibility and scale
– 41% Ownership
LCR - Refining
– Unique capability to refine heavy crude oils
– Contractually stable business; strong cash flow generator
– 58.75% Ownership
Lyondell Operates in 3 Major Businesses

Page 4
Roadmap to Success
Executing our Strategic Plan
Prudently Managing Quality Assets
Delivering Results in Difficult Environment
Positioned for Significant Returns in Up-Turn

Page 5
Our Beliefs in the Drivers of Success Remain Constant
Sustainable Competitive Advantages Technology Market Position
Low Cost Production Scale Breadth and Depth of Product Offering Global Reach Capital Market Liquidity

Page 6
Strategy for Value Creation

Page 7
Leading Positions in All Key Products
* Source: CMAI, LYO capacities as of 1/1/01
Product Annual Capacity* Capacity Position
1st in North America
1st in the world
1st in North America
3rd in the world
1st in North America
1st in the world
2nd in North America
3rd in the world
2nd in North America
6th in the world
3rd in North America
3rd in the world
Ethylene (lbs) 11.6 billion
Propylene Oxide (lbs)
Styrene Monomer (lbs)
MTBE (bbl/day)
3.9 billion
3.7 billion
58,500
Propylene (lbs) 5.0 billion
Polyethylene (lbs) 5.7 billion
Eq
uis
tar
IC&
D

Page 8
Products Serve Key Durable & Non-Durable Markets
EthylenePropylene
Antifreeze / deicers
Food Packaging
ToysAutomotive Components
Consumer Products
Home Construction
Pharmaceuticals
Apparel
Automotive Seating
Home Furnishings
Grocery Sacks

Page 9
Sustainable Advantages in Key Businesses
Petrochemicals – Low Cost Advantage Feedstock flexibility historically provides 4 cpp
variable cost advantage
Refining – Strong Cash Generation Heavy Crude Processing Capability Unique “Deemed Margin” Contract Improved Operational Reliability
IC&D – PO Cost and Technology Leadership Proprietary Process Technology Leader Global Production Base Important Derivative Positions

Page 10
Large Asset Base Provides Opportunities to Optimize the Portfolio
Polymers• Shut-Down Port Arthur• Expanded Matagorda & Victoria
IC&D• Exited ADI• Sold Polyols
Petrochemicals• Idled Lake Charles
Page 11
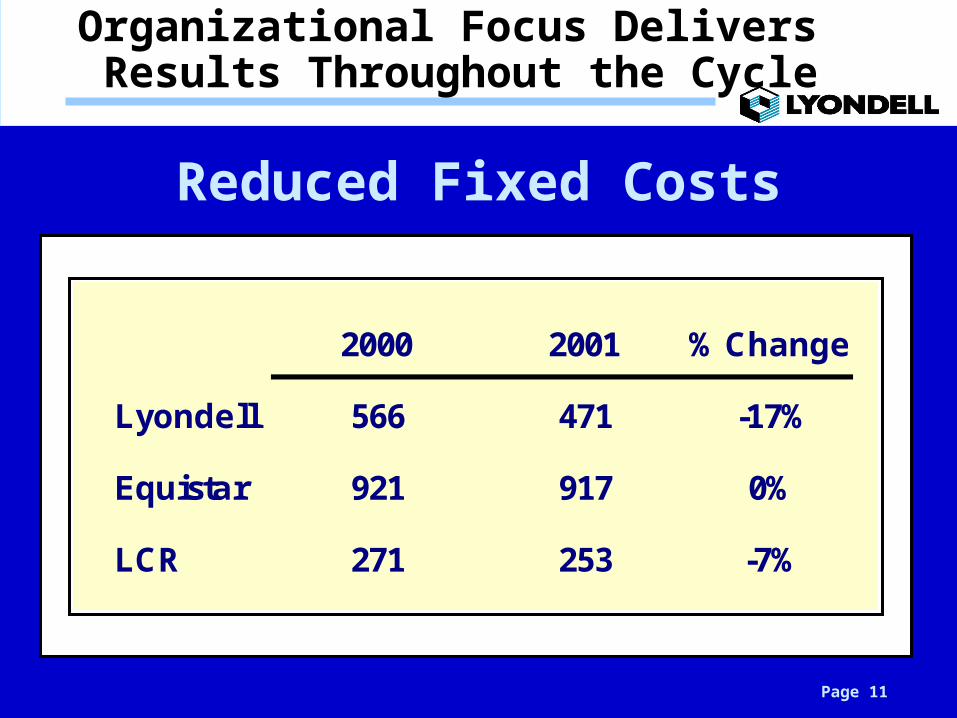
Organizational Focus Delivers Results Throughout the Cycle
2000 2001 % Change
Lyondell 566 471 -17%
Equistar 921 917 0%
LCR 271 253 -7%
Reduced Fixed Costs

Page 12
Day
s o
f W
ork
i ng
Cap
i tal
Reduced Working Capital
2001 Cash fromWorking Capital: LYO $128MM Equistar $282MM*
0102030405060708090
1998 1999 2000 2001
Lyondell Equistar
* Includes elimination $130 million AR securitization

Page 13
Prudently Managing Assets($
,MM
)
0
50
100
150
200
1999 2000 2001 2002 LE
Equistar Lyondell
($M
M)
Disciplined Capital Expenditures
PO11 Spending

Page 14
Minimal Near Term Debt Maturities
0
500
1,000
1,500
2,000
2002 2003 2004 2005 2006 2007 2008 2009
$MM
Lyondell Equistar
Debt Maturity Schedule
1 – LYO Revolver Expires
1

Page 15
Significant Liquidity
Lyondell Equistar
Cash Balance 12/31/01 $146MM $202MM
Revolver 12/31/01 $500MM $500MM
Total Liquidity $646MM $702MM
1 2
1 – excludes approximately $4.5 million committed against letters of credit2 – excludes approximately $0.7 million committed against letters of credit
Page 16
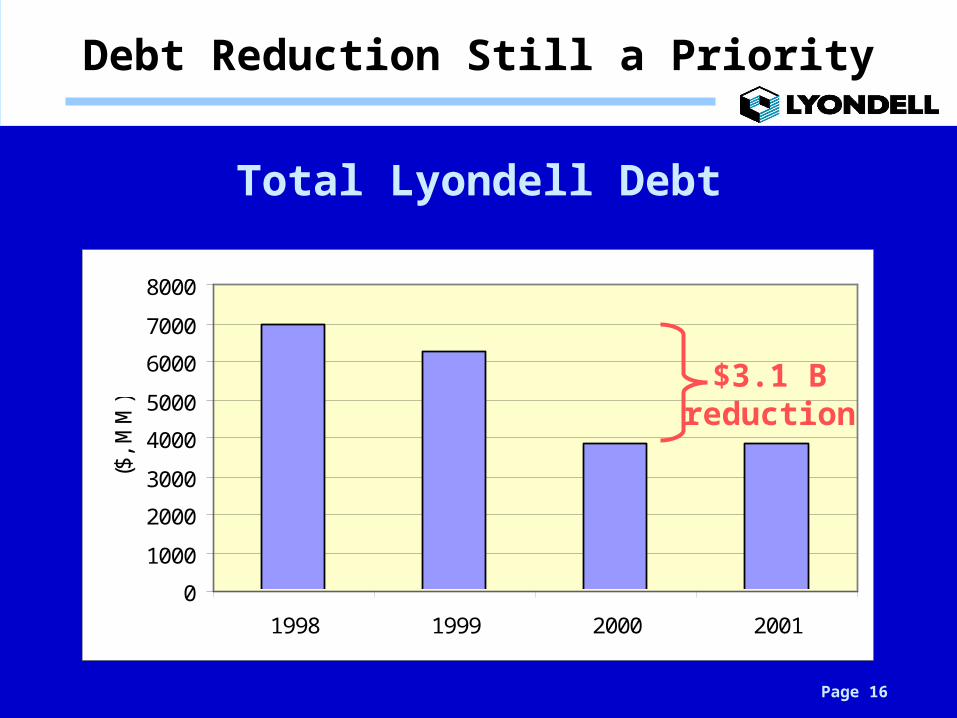
Debt Reduction Still a Priority
Total Lyondell Debt
0
1000
2000
3000
4000
5000
6000
7000
8000
1998 1999 2000 2001
($,
MM
)
$3.1 B reduction

Page 17
Equistar Transactions
Lyondell Sells Package of Securities Lyondell Sells Package of Securities
to Occidentalto Occidental– 30 – 34 million shares of Series B stock30 – 34 million shares of Series B stock
– 5 million, 5 year $25 warrants5 million, 5 year $25 warrants
– Payments equivalent to 7.38% of ’02 & ’03 Payments equivalent to 7.38% of ’02 & ’03
Equistar distributions up to $35 millionEquistar distributions up to $35 million
Lyondell buys Occidental’s 29.5% Lyondell buys Occidental’s 29.5%
share of Equistarshare of Equistar

Page 18
Normalized Equistar EBITDA1 = $1.0 billion
Increase in proportional Equistar EBITDA $300 millionImpact of $300 million of Lyondell debt reduction $0.12/share
Impact of Occidental Transaction on Cash Generation and Earnings Potential
Impact of $0.01/lb margin increase on EPS
Before AfterEthylene 0.24 0.32Polymers 0.14 0.19
Impact of accelerated debt reduction . . .
1 - Pro forma assuming 1993 (trough) and 1995 (cyclical upturn) CMAI cash margins, Equistar product capacities as of 2000 and up to $280 million of cost savings resulting from Equistar formation.

Page 19
Ethylene Demand 1970-2002United States
5000
15000
25000
35000
45000
55000
1971
1973
1975
1977
1979
1981
1983
1985
1987
1989
1991
1993
1995
1997
1999
2001
2003
Mn
Lb
s
-5%
0%
5%
10%
15%
20%
25%
30%
% C
hg
GD
P
GDP %AGR Ethylene consumption
?
Past Demand Contractions Were Followed by Periods of Strong Growth
Source: DRI & ChemData

Page 20
Executing our strategy
Accumulated leading positions in all key
products
Established low cost producer positions
Delivering results in difficult environment
Preserving our liquidity
Committed to debt reduction and our dividend
Investment Highlights

Morgan Stanley
February 13, 2002