Embed Size (px)
Citation preview

ORIGINAL ARTICLE
Morphological characterization of electrophysiologically andimmunohistochemically identified basal forebrain cholinergicand neuropeptide Y-containing neurons
Alvaro Duque Æ James M. Tepper Æ Laszlo Detari ÆGiorgio A. Ascoli Æ Laszlo Zaborszky
Received: 22 March 2007 / Accepted: 2 May 2007 / Published online: 2 June 2007
� Springer-Verlag 2007
Abstract The basal forebrain (BF) contains cholinergic
as well as different types of non-cholinergic corticopetal
neurons and interneurons, including neuropeptide Y (NPY)
containing cells. BF corticopetal neurons constitute an
extrathalamic route to the cortex and their activity is
associated with an increase in cortical release of the neu-
rotransmitter acetylcholine, concomitant with low voltage
fast cortical EEG activity. It has been shown in previous
studies (Duque et al. in J Neurophysiol 84:1627–1635,
2000) that in anesthetized rats BF cholinergic neurons fire
mostly during low voltage fast cortical EEG epochs, while
increased NPY neuronal firing is accompanied by cortical
slow waves. In this paper, electrophysiologically and
neurochemically characterized cholinergic and NPY-con-
taining neurons were 3D reconstructed from serial sections
and morphometrically analyzed. Cholinergic and NPY-
containing neurons, although having roughly the same
dendritic surface areas and lengths, were found to differ in
dendritic thickness and branching structure. They also have
distinct patterns of dendritic endings. The subtle differ-
ences in dendritic arborization pattern may have an impact
on how synaptic integration takes place in these function-
ally distinct neuronal populations. Cholinergic neurons
exhibited cortically projecting axons and extensive local
axon collaterals. Elaborate local axonal arbors confined to
the BF also originated from NPY-containing neurons. The
presence of local axon collaterals in both cholinergic and
NPY neurons indicates that the BF is not a mere conduit for
various brainstem inputs to the cortex, but a site where
substantial local processing must take place.
Keywords Dendritic morphometry � Three-dimensional
reconstruction � Axon collaterals � Rat
Introduction
The basal forebrain (BF) consists of a heterogeneous group
of telencephalic structures including the septum, the ver-
tical (VDB) and horizontal limbs (HDB) of the diagonal
band of Broca, the substantia innominata (SI) and the
ventral pallidum. This brain area is of wide clinical interest
because some of its cell populations have been found to be
severely affected in a number of neurological maladies
such as Alzheimer’s disease, Parkinson’s disease and
schizophrenia (Davies and Maloney 1976; Whitehouse
et al. 1982; Bartus et al. 1986; Heimer et al. 1991; Geula
and Mesulam 1994; Sarter and Parikh 2005).
Neurons in the rat BF areas are heterogeneous in
terms of neurochemical content, electrophysiology, and
morphology. Neurochemically two major groups are usu-
ally distinguished, cholinergic and non-cholinergic. The
Electronic supplementary material The online version of thisarticle (doi:10.1007/s00429-007-0143-3) contains supplementarymaterial, which is available to authorized users.
A. Duque
Department of Neurobiology, Yale University School of
Medicine, New Haven, CT 06510, USA
J. M. Tepper � L. Zaborszky (&)
Center for Molecular and Behavioral Neuroscience, Rutgers,
The State University of New Jersey, Newark, NJ 07102, USA
e-mail: [email protected]
L. Detari
Department of Physiology and Neurobiology,
Lorand Eotvos University, Budapest 1117, Hungary
G. A. Ascoli
Krasnow Institute for Advanced Study and Psychology
Department, George Mason University, Fairfax, VA 22030, USA
123
Brain Struct Funct (2007) 212:55–73
DOI 10.1007/s00429-007-0143-3

non-cholinergic neurons are mainly GABAergic and have
been shown to contain various calcium-binding proteins,
including parvalbumin, calbindin and calretinin and vari-
ous neuropeptides, including substance P, neuropeptide Y
(NPY), somatostatin, enkephalin, neurotensin and galanin
(Walker et al. 1989a, b; Pang et al. 1998; Zaborszky et al.
1999; Gritti et al. 2003). A considerable proportion of
neurons (approx. 5–30%) is believed to be glutamatergic
(Gritti et al. 2003; Hur and Zaborszky 2005). Less than 1%
of the BF neurons have been reported to co-localize GABA
and choline acetyltransferase (ChAT), the enzyme that
synthesizes acetylcholine (Brashear et al. 1986; Fisher and
Levine 1989).
In terms of electrophysiology, various behavioral states
are associated with different cortical electroencephalo-
graphic (EEG) patterns. In anesthetized rats, BF neurons
that have a higher firing rate during low voltage fast
electrical EEG states are termed F cells, and cells whose
firing rate increases during high amplitude, slow cortical
EEG activity are termed S cells (Detari and Vanderwolf
1987; Dringenberg and Vanderwolf 1998). However, it is
important to note that there is great diversity among F and
S cells in terms of conduction velocity, spontaneous and
evoked neural activity and correlation between EEG and
unit activities, indicating that F and S cells are far from
being homogeneous cell populations (Detari 2000). In
addition, there are some BF neurons whose activities are
unrelated to EEG cortical changes (Nunez 1996).
Morphologically, most cholinergic cells are large and
multipolar with extensive dendritic fields. Non-cholinergic
neurons vary extensively in soma shape, and dendritic and
axonal characteristics. Of the several neurochemically
distinct non-cholinergic populations the NPY neurons were
selected to be compared morphologically to the cholinergic
neurons because they not only have a very different neu-
rochemical make-up but also represent cell types with
clearly different electrophysiological properties: choliner-
gic cells are ‘‘F’’ type; NPY-neurons are ‘‘S’’ type (Duque
et al. 2000). Similar to the ChAT cells, parvalbumin po-
sitive, putatively GABAergic neurons are also classified as
‘‘F’’ cells (Duque et al. 2000; Duque and Zaborszky 2006).
Acetylcholine and NPY have both been implicated in
Alzheimer’s disease therefore making BF cholinergic and
NPY-containing neurons very attractive cellular popula-
tions for investigation and morphological analysis. BF
cholinergic neurons have been implicated in a number of
important cognitive processes such as learning, memory,
attention and arousal and it has been hypothesized that
dysfunction of the cholinergic neurons is responsible for
the cognitive deficits associated with the aforementioned
illnesses (Heimer et al. 1991; Voytko et al. 1994; Sarter
and Bruno 1999). NPY is among the most abundant neu-
ropeptides in mammalian brain (Allen et al. 1983; Chron-
wall et al. 1985; de Quidt and Emson 1986a, b) and it has
been shown that NPY levels in the CSF are significantly
reduced in Alzheimer’s dementia (Edvinsson et al. 1993;
Minthon et al. 1996). NPY neurons have been detected in
BF areas where several NPY receptor subtypes are abun-
dantly expressed (Wolak et al. 2003; Zaborszky and Duque
2003). NPY local injection into the BF resulted in a sig-
nificant increase in relative delta power of the EEG and a
decrease in theta, alpha and beta frequency bands (Toth
et al. 2005).
Because of their distinct neurochemical make up, their
opposite spontaneous activity in reference to cortical
activity, and because morphology can affect cellular
properties and function, we were interested in investigating
if there are morphometric differences between cholinergic
and NPY-containing BF neurons. In particular, since
computational studies suggest that dendritic morphology
can robustly affect neuronal electrophysiological properties
(Carnevale et al. 1997; Schaefer et al. 2003), we studied
dendritic numerical and topological features.
Materials and methods
Experimental animals
Male Sprague Dawley rats (n = 92; 250–350 g; Zivic
Miller Laboratories, Inc, Portersville, PA) were housed two
to a cage and allowed food and water ad libitum. All
procedures described here were carried out in strict
accordance with guidelines set forth in the PHS manual
‘‘Guide for the Care and Use of Laboratory Animals’’,
conform to NIH guidelines and were approved by the
Rutgers University Institutional Review Board. The elec-
trophysiological and neurochemical identification of the
neurons presented here has been previously published
(Duque et al. 2000) hence, these aspects are only briefly
mentioned here.
Anesthetics, surgical procedures and recordings
Rats were anesthetized with urethane (1.2 g/kg i.p. sup-
plemented as necessary) and placed in a stereotaxic appa-
ratus, skull adjusted to have lambda and bregma on the same
horizontal plane. All wound margins and points of contact
between the animal and the stereotaxic apparatus were
infiltrated with lidocaine solution (2%) and xylocaine
ointment (5%), respectively. Body temperature was kept at
37�C with an electric heating pad. The scalp and overlying
fascia were reflected from the skull and small burr holes
were drilled, in both hemispheres, over the pre-frontal/
frontal cortex for EEG recordings. Simultaneous cortical
EEG and single cell extracellular recordings from different
56 Brain Struct Funct (2007) 212:55–73
123
BF areas including the HDB, the SI or the ventral globus
pallidus, were obtained. Following extracellular recordings,
neurons were juxtacellularly labeled with 5% biocytin as
described elsewhere (Pinault 1996; Pang et al. 1998; Duque
et al. 2000; Duque and Zaborszky 2006). In 51 rats two cells
were labeled, one cell per hemisphere. In 37 rats a single cell
was labeled. In one case we had three cells in one hemi-
sphere and one in the other hemisphere and in two cases we
had one cell in one hemisphere and two in the other. Finally
we had one case in which only two cells were labeled and
they were in the same hemisphere. In all cases in which
more than one cell was labeled in one hemisphere all the
cells were F type and all were more than 800 l apart in the
rostrocaudal axis. Every neuron presented in this paper was
the sole neuron juxtacellularly labeled in a hemisphere.
Perfusion, tissue processing and immunocytochemistry
At the completion of the experiment, rats were deeply
anesthetized with urethane and perfused with 150–200 ml
saline followed by 200 ml of 4% paraformaldehyde, 15%
picric acid and 0.5% glutaraldehyde and then by 200 ml of
the same fixative without glutaraldehyde. Brains were left
overnight in the second fixative. Coronal 50 lm sections
were cut through the forebrain with a Vibratome�1000
Classic (Warner Instruments, Hamden, CT). For visuali-
zation of juxtacellularly labeled single cells, sections were
incubated overnight in avidin conjugated lissamine rhoda-
mine (LR) (1:500; Jackson ImmunoResearch Labs, West
Grove, PA). Biocytin filled neurons were identified with a
Zeiss Axioplan microscope equipped with epifluorescence
setup. If a cell was electrophysiologically identified as F
type, the section containing its soma was tested for the
presence of ChAT. On the other hand, if it was S type, the
section containing its soma was tested for NPY. For ChAT
a monoclonal rat anti-ChAT antibody was used (1:10;
2 days at 4�C; Boehringer Mannheim, Germany). For NPY
a rabbit polyclonal antibody was used (Rabbit anti-NPY;
1:500; 2 days at 4�C; Peninsula Laboratories, Inc, Bel-
mont, CA). Visualization of ChAT or NPY was done with a
secondary antibody conjugated to fluorescein isothiocya-
nate [FITC conjugated goat anti rat/rabbit; 1:100; 4 h at
room temperature (RT); Jackson ImmunoResearch Labs,
West Grove, PA]. Finally, all the sections containing a
biocytin-stained cell were developed using 3,-3¢-diam-
inobenzidine tetrahydrochloride (DAB) as a chromogen
intensified with nickel (Ni) with a modification of the
protocol described by Horikawa and Armstrong (1988).
Sections were first incubated in biotinylated peroxidase
(1:200, ‘‘B’’ component of the standard Avidin–Biotin
Peroxidase complex (ABC) kit, Vector Laboratories Inc,
Burlingame, CA) for 2 h at RT and then for 20 min in
0.05% DAB with 0.038% nickel ammonium sulfate. H2O2
was added to the DAB/nickel solution to a final concen-
tration of 0.01%, and the tissue was agitated for another
10 min. After Ni–DAB developing of series of sections
containing single juxtacellularly labeled identified NPY or
cholinergic neurons those sections were immunostained
against ChAT using the same procedure as for single cell
visualization but the series of sections were developed
using DAB as chromogen. Triton was omitted from the
incubation solutions.
After being reacted with the second DAB, sections were
thoroughly rinsed in PB and osmicated in a solution con-
taining 1% osmium tetroxide (Electron Microscopy Sci-
ences, Fort Washington, PA) in phosphate buffered saline
(PBS), for approximately 30–40 min. The tissue was
dehydrated in an ascending series of ethanol (30–50–70–
90–100%). Contrasting was done by treating the tissue with
1% uranyl acetate (Electron Microscopy Sciences, Fort
Washington, PA) in 70% ethanol, for 30 min. Afterwards,
the tissue was dehydrated with 1% propylene oxide
(Electron Microscopy Sciences, Fort Washington, PA).
Finally, the sections were infiltrated in durcupan (Fluka
Chemie AG, Buchs, Switzerland) overnight and then flat
embedded between liquid release agent-coated (Electron
Microscopy Sciences, Fort Washington, PA) microscope
glass slides and coverslips. Embedding for electron
microscopy enhances the optical quality of the tissue, al-
lows very clear morphological reconstruction of the single
juxtacellularly labeled cell at the light microscopic level
and will permit future EM studies of the material.
Data acquisition
Biocytin-stained neurons were reconstructed using Neu-
rolucida� (Microbrightfield Inc, Williston, VT) interfaced
to a Zeiss Axioplan microscope. Selected single labeled
neurons were reconstructed from 50 lm serial sections.
Bulk labeling of ChAT neurons (light brown, DAB
developed) in the vicinity of single juxtacellularly labeled
ChAT or NPY neurons (pitch black, Ni–DAB developed)
did not interfere in any way with our ability to visualize
and morphologically reconstruct single cells. The number
of sections containing individual neurons varied from 22 to
140. Outlines of the sections, contours of structures and
fiducial markers were drawn with a 5· Plan-NEOFLUAR
objective lens. Somata, dendritic and axonal branches were
traced with a 100·, oil immersion ACHROPLAN objective
lens. For serial reconstructions each section was aligned to
a common reference, e.g., the lowest midline point of the
corpus callosum. Additional alignment was applied using
the 2–4 point matching function of the Neurolucida�
software. Shrinkage corrections were applied using Neu-
rolucida�. Morphometric data were extracted using the
Neurolucida� companion software, NeuroExplorer (Mi-
Brain Struct Funct (2007) 212:55–73 57
123

crobrightfield Inc, Williston, VT) and the freely available
program L-Measure (Scorcioni and Ascoli 2001; http://
www.krasnow.gmu.edu/L-Neuron).
NeuroExplorer formulae and definitions
Soma perimeter and area were taken at their maximum by
plotting the soma surrounding at the focus level at which it
appeared to be the largest.
Tree: branched structures such as dendrites are orga-
nized in a form known as a tree. A tree consists of all
dendritic processes originating from the same dendritic
stem that is connected to the soma. The starting point of a
tree is called stem or root. Segments or branches are the
parts of the tree that connect endings (terminations) or
nodes.
Dendrogram is a stylized drawing of a branched struc-
ture, e.g., axon or dendrite. For dendrograms the origin of
the tree in the dendrogram is plotted at the left and different
branch orders extend to the right. Dendrograms such as
those shown in Figs. 4 and 7 clearly demonstrate the
number of trees that originate from the soma and their
branching pattern.
Branch order. We used the centripedal (also known as
centrifugal) ordering system in our analysis because this
ordering system is particularly good at providing infor-
mation about both topological distance and amount of
branching in a tree. Order was defined in such a way that
the proximal segment of an unbranched dendrite is order 1
(primary dendrite or dendritic stem). The daughter bran-
ches split off the order 1 branch at a point called a node
and they are of order 2, and that way successively to the
end of a structure. Alternate branch order schemes are
compared in a supplementary figure.
Dendritic length. The actual lengths of the different
branches were measured, and the total length (from the
start of the process to each ending) and the length of each
segment per dendritic order were calculated. The length
from any point to any other point can be obtained and the
program calculates length using vector summations in 3D.
Total dendritic length was defined as the sum of the length
values for all the branches of each order belonging to each
process and the mean length was then the total length di-
vided by quantity, where quantity is the number of bran-
ches belonging to each process at each branch order.
Surface area and volume. The start and end point of
each line segment has a radius value determined by the size
of the circular inset of the cross-hair cursor used when
tracing. The surface area of each line segment was com-
puted using these radii values and the length of each line
segment in the mathematical formulae for the surface area
of a shape known as a right frustrum. For instance, if R1 is
the radius at the start of a line segment and R2 is the radius
at the end of the line segment and L is the length of line
segment. Then, the lateral surface area (LSA) and the
volume (V) of the right frustrum are defined as:
LSA ¼ p R1 þ R2ð Þffiffiffiffiffiffiffiffiffiffiffiffiffiffiffiffiffiffiffiffiffiffiffiffiffiffiffiffiffiffiffiffi
ðR1 � R2Þ2 þ L2
q
V ¼ 1
3pLðR2
1 þ R1R2 þ R22Þ
The planar angle was defined as the angle between a
daughter branch and the parent branch. This angle is
computed using rays drawn from the beginning of a branch
to its node or ending. This angle is computed in the plane
defined by the two rays and its value can extend from 0 to
180 degrees, with 0 degrees indicating the branch is a
straight-line continuation of its parent.
Definitions used from L-measure
Power ratio is the sum of the two daughter diameters
elevated to 1.5 divided by the parent diameter elevated to
1.5. The value, computed over all bifurcating branches,
would be one for ideal electrotonic structures (Rall’s power
formula).
Bifurcation angle is the angle between the two daughters
of a bifurcation, calculated based on their first tracing
points.
Daughter diameter ratio is the ratio between the initial
diameters of the two daughters of a bifurcation.
Partition (topological) asymmetry is the absolute dif-
ference between the numbers of terminals of the two sub-
trees of a bifurcation, divided by the number of terminals
of the parent minus two. This value is zero for perfectly
symmetric topological trees, and one for perfectly asym-
metric ones.
Taper rate is defined as the difference between the
branch ending and starting diameter, divided by the starting
diameter, and is calculated separately for bifurcating and
terminating branches.
Branch contraction measures the tortuosity or meander
of the branches, defined as the ratio between the Euclidian
and the path distances between the starting and ending
points of each branch. Branch length and diameter are
calculated separately for bifurcating and terminating
branches.
Statistics, documentation
Statistical analyses were performed in Microsoft� Excel
(1998 edition) or in Origin 6.0 (Microcal Software, Inc,
Northampton, MA). Morphometric data were statistically
characterized using neuron-, tree- or branch-based analysis.
When appropriate, group measures were compared using
non-parametric testing (Mann–Whitney) or ANOVA and
58 Brain Struct Funct (2007) 212:55–73
123

Bonferroni corrected as appropriate. Significance was de-
clared at P < 0.05. Digital photographs were taken with an
Olympus BX60F epifluorescence microscope equipped
with a DCS-420 digital camera or with a Zeiss Axioskop
epifluorescence microscope equipped with an AxioCam.
The contrast of digital images was enhanced with Adobe�
PhotoShop.
Results
From 151 biocytin filled neurons that were also electro-
physiologically identified, 35 neurons were immunotested
of which six were positive for ChAT and four were positive
for NPY. Positive dual immunolabeling was only accepted
in cases in which the biocytin-filled neuron was clearly and
without doubt immunopositive for ChAT or NPY, and
other immunopositive neurons in the neighborhood showed
the known pattern of distribution. Three cells from each
category were selected for morphometric analysis based on
the quality of the material and the completeness of the
staining. All cholinergic cells were electrophysiologically
classified as F type and all NPY neurons as S type. For a
complete electrophysiological description see Duque et al.
(2000).
3D reconstruction of cholinergic neurons: general
characteristics
Figures 1, 2, 3 illustrate projected images of 3D recon-
structions of two cholinergic neurons and Fig. 4 displays
the dendrograms of three selected cholinergic neurons.
Figure 1a illustrates the stacked images projected in frontal
plane of the reconstructed cholinergic neuron 062R. This
neuron was located in the ventral part of the SI. Its cell
body measured 19.9 · 17.3 lm (longest and shortest
diameter) and had a surface area of 248.4 lm2. The two
primary dendrites (13 and 16 lm; see Fig. 4) each divide
into two secondary branches of unequal length (18/54 lm;
8.5/43 lm). The secondary branches divide into short and
long tertiary branches (51/143; 75/200 lm), which further
divide into long fourth and fifth order branches. Higher
order divisions gave rise to further unequal branches that
are shorter than the tertiary or quaternary branches. While
the primary and secondary branches are smooth, higher
order branches are varicose. Spine-like appendages can be
seen on some of the distal dendrites.
Figure 1d shows the same cholinergic neuron, rotated in
space in order to best illustrate the trajectory of its main
axon. The thick axon emerges from the dorso-lateral aspect
of the cell body and bifurcates within 20 lm from it (filled
arrowhead in Fig. 1). The main axon shaft gives rise to
several thin axon collaterals. It first travels laterally and
then returns to the level of the cell body to then continue
towards the septum. The other branch also gives rise to a
few thin axon collaterals and continues to the piriform
cortex. An additional thin axon emerging from a more
medial location of the cell body (open arrowhead in Fig. 1)
gives rise to a massive network of axon collaterals occu-
pying mostly a medial position from the cell body. The
axon collateral network was visible only with the 100·objective and was clearly studded with many varicosities.
In Fig. 1d only four representative hemicoronal sections
are shown from 140 sections through which the neuron was
traced. Figure 2 illustrates the two main axonal branches of
the same neuron giving rise to terminal fields in the rostral
part of the piriform cortex, mostly in layer 2 although some
boutons are also seen in layer 3 (Fig. 2a), and in the medial
septum (Fig. 2b), respectively. Although many varicosities
can be observed in the terminal fields (panels 2A1¢, 2A2¢2B1¢), varicosities were not seen en route to these terminal
fields (panel 2C¢).Figure 3 shows the reconstruction of cholinergic neuron
116R, located in the ventral part of the SI. The cell body
measured 25.4 · 17.1 lm and had a surface area of
287.0 lm2. This neuron had four primary dendrites, and
their secondary and tertiary branches are somewhat longer
than in the case of cholinergic neuron 062R, resulting in a
larger total dendritic length (Fig. 4). Also, there seem to be
fewer varicosities along the dendrites. The axon emanated
from the dorsal aspect of the cell body and was traced for
2 mm in the dorsal direction. Along the way several col-
laterals were issued that terminated in and around the
dendritic arbor of this neuron. Cholinergic neuron 004R
(Fig. 4c) was localized within the fibers of the internal
capsule adjacent to the ventral part of the globus pallidus.
Its soma measured 39.2 · 17.2 lm and had a surface area
of 379.5 lm2. It had three primary dendrites that divided in
the usual short–long fashion, but altogether the neuron had
fewer long secondary dendrites than the other two cholin-
ergic neurons. On the other hand, there were more higher
order small branches. Interestingly, the dendrites of this
neuron stretch the longest up to 800 lm. Its local axonal
arbor was obscured by fibers of the internal capsule; nev-
ertheless the total length of local axon collaterals measured
an astonishing 4.2 mm. For comparison of the dendritic
arborizations of these three neurons, Fig. 4 depicts the
dendrograms next to the schematic drawings of the corre-
sponding neuron.
The three cholinergic neurons analyzed had a total of
nine dendritic trees with an average total dendritic length
per cell of 4,183 ± 620 lm and an average total dendritic
surface area per cell of 12,809 ± 1,748 lm2. Cholinergic
neurons had an average of 37 ± 12 dendritic nodes and
41 ± 12 dendritic endings and occupied an average volume
Brain Struct Funct (2007) 212:55–73 59
123

of 3,753 ± 504 lm3 per cell. Overall, dendritic endings
had a tendency to terminate with a varicosity or bulge al-
though sometimes from the varicose ending a short thin
filopodium emanates.
As described, cholinergic axons gave rise to several
collaterals bearing very fine en passant varicosities within a
0.2–0.3 mm3 volume around the cell body. Although it was
not possible to trace every single piece of axon due to lack
of staining or other technical difficulties, the total lengths
of cholinergic axon collaterals reconstructed were
3,260 lm (neuron 116R), 4,252 lm (neuron 004R) and
27,482 lm (neuron 062R).
3D reconstruction of NPY neurons: general
characteristics
Figure 5a shows the reconstruction of NPY neuron 059R.
This cell was located in the HDB. Its soma diameter
measured 15.4 · 12.3 lm and it had a surface area of
D
V
LM
EEG 2 mV
unit
5 s
2.5 s
TPEEG 2 mV
unit
50 µ m
2 mm
A
B
C
D
Fig. 1 a Neurolucida reconstruction of juxtacellularly labeled basal
forebrain cholinergic neuron 062R. In this and all subsequent figures
unless otherwise stated, the soma and dendrites are shown in blackand the axon is shown in red. The distal main projection axon (filledarrowhead) was removed for better visualization of the extensive
local axon collaterals (open arrow-heads). Abbreviations for topo-
graphical cross for this and all subsequent figures: L, lateral; M,
medial; V, ventral; D, dorsal. b Concomitant unit and cortical EEG,
spontaneous and tail pinch (TP) induced activity, demonstrating this
cell is ‘‘F’’ type. See full electrophysiological analysis and
neurochemical identification of all ChAT neurons presented here in
Duque et al. (2000). c Some illustrative coronal section outlines
(approximately 70 out of 140 serial sections) used in the reconstruc-
tion of this neuron. The removal of outlines is necessary to facilitate
visualization of the neuron. d Schematic drawing showing this neuron
slightly rotated in space to facilitate visualization of two axonal
branches traveling rostrally. One of the branches travels medialwards
and ends at the level of the septum. The other branch travels laterally
and ends at the level of the rostral piriform cortex. For simplification
only four hemicoronal outlines are shown. For illustration the axon
terminals have been collapsed onto the corresponding representative
hemicoronal outlines
60 Brain Struct Funct (2007) 212:55–73
123

129.8 lm2. This neuron had five primary dendrites, four
of which divided into ten relatively long dendrites (200–
500 lm) that had several short side branches. The den-
drites were somewhat wavy and moderately spiny. This
neuron had a sizable local axon collateral arbor with 615
irregularly spaced small bouton-like varicosities that
distributed mostly lateroventral to the position of the
soma.
Figure 6a shows the reconstruction of NPY neuron
134R. The cell body measured 34.1 · 16.7 lm and had a
surface area 307 lm2. In this neuron, in addition to local
collaterals, we found a thick projection axon that divided
into two main branches one of which was lost from sight in
the dorsal thalamus; the other branch was traced to near the
stria terminalis at the edge of the lateral ventricle. Fig-
ure 6c shows this NPY neuron slightly rotated in space
allowing a better angle that facilitates visualization of its
projection axon. This neuron had five, relatively long pri-
mary dendrites (up to 300 lm) that divided into secondary
and tertiary dendrites of various lengths. The primary and
secondary dendrites were smooth with occasional spines.
Most of the tertiary dendrites terminated in complex end-
ings, often consisting of more than ten small spiny
branchlets.
A1A2
A B
A1'
A2'
B1'
C'
C
B1
2.0 mm
25.0 µ m
Fig. 2 Detailed view of cholinergic neuron 062R axon terminal field.
a Details of the terminal field at the level of the rostral piriform
cortex. For illustration some of the axon terminals in the area (up to
the dashed line) have been collapsed into a single hemicoronal
section. The arrows pointing out of the hemicoronal section indicate a
magnified version of the axon. Boxes A1 and A2 enclosed axon areas
that are again magnified at the lower left of the figure (A1¢ and A2¢).At this final level of magnification boutons are visible. b Details of
the terminal field at the level of the medial septum. Here also the
terminal field is not from a single coronal section but rather from
several coronal sections collapsed into one for illustrative purposes.
The axon in box B1 is magnified to the right of the figure so that
boutons are visible (B1¢). c illustrates axon en route to the rostral
piriform cortex, hence it is continues with that shown in a. The
magnification of the axon enclosed in c, shown immediately up and to
the right of the box, indicates the absence of boutons (C¢). Two
millimeters scale bar applies to the hemicoronal sections shown in aand b. Twenty-five micrometers scale bar applies to the larger
magnifications of the axon (A1¢, A2¢, B1¢, C¢)
Brain Struct Funct (2007) 212:55–73 61
123

Figure 7 depicts the dendrograms next to the schematic
drawing of the corresponding NPY-containing neurons.
These three neurons had a total of 13 primary dendrites and
two short (25–30 lm long) dendritic-like appendages
emanating from the soma. The average total dendritic
length per cell was 5,328 ± 2,285 lm and the average total
dendritic surface area per cell was 14,468 ± 10,495 lm2.
NPY neurons had an average of 106 ± 93 dendritic nodes,
125 ± 112 dendritic endings and occupied an average
volume of 4,061 ± 4183 lm3.
Overall, dendritic endings had a tendency to terminate
with a thin filopodial structure. However, it was noticed
that most of the ventral sided dendritic terminals of NPY
neuron 134R had racemose appendages, that is, twig-like
branched dendritic appendages that contain varicosities,
spines and some bulbous tips.
The axons of the NPY neurons also gave rise to several
collaterals and although it was not possible to trace every
single piece of axon due to lack of staining or technical
difficulties, the total lengths of the axon collaterals from
the NPY-containing neurons reconstructed were 1,796 lm
(neuron 090R), 13,040 lm (neuron 059R) and 15,431 lm
(neuron 134R).
Analysis of dendritic trees in cholinergic versus
NPY-containing neurons
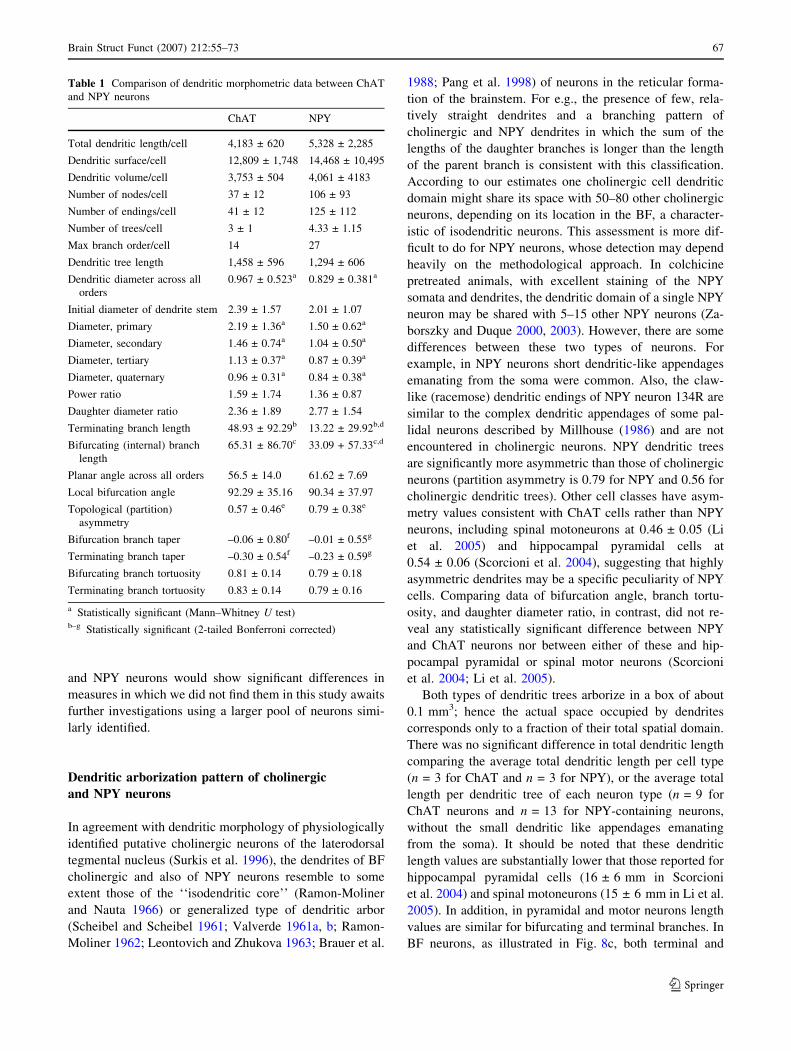
Table 1 lists and panels a–c in Fig. 8 display size- and
topology related dendritic parameters. Panels d–f in Fig. 8
illustrate distribution morphometrics.
Dendritic thickness and length
There is no statistical difference in tree length
(LChAT = 1,458 ± 596 mm; LNPY = 1,294 ± 606 mm; P >
0.5, 2-tailed t test) or stem diameter (DChAT = 2.39 ±
1.57 mm; DNPY = 2.01 ± 1.07 mm; P > 0.5) between the
two groups (Table 1). Figure 8a illustrates that there is a
difference in the mean dendritic diameter or thickness per
branch order between the two populations. Across all
dendritic orders, the mean diameter of the cholinergic
L
V
M
D
50 µ m
A
B2 mm
CA3
f
ic
mfb
Fig. 3 a Neurolucida
reconstruction of juxtacellularly
labeled basal forebrain
cholinergic neuron 116R. Not
all the axonal arbor is shown.
The gray profile indicated by
the arrow represents another
cholinergic neuron in close
proximity to the reconstructed
neuron’s axon. Inset (b)
indicates the location of this
neuron in the ventral substantia
innominata. CA3, hippocampus;
f, fornix; ic, internal capsule;
mfb, medial forebrain bundle
62 Brain Struct Funct (2007) 212:55–73
123

dendrites is 0.967 ± 0.523 lm (n = 232 dendritic seg-
ments) while that of the NPY dendrites is 0.829 ±
0.381 lm (n = 691 dendritic segments). The difference
between these means is statistically significant
(P < 0.0001, 2-tailed Mann–Whitney test). If higher order
branches are disregarded with the argument that they may
simply be the result of small branchlets that should not be
consider dendrites on their own right, and only the average
diameter of primary, secondary, tertiary and quaternary
dendrites was analyzed, the difference in average dendritic
thickness is still statistically significant (n = 212 dendritic
branches, P < 0.0001, 2-tailed Mann–Whitney test; see
Table 1). Figure 8c shows the analysis of terminal and
internal dendritic branch lengths in cholinergic and NPY
neurons. Both terminal and internal branches are signifi-
cantly longer in cholinergic than in NPY neurons. In
addition, terminal branches are significantly shorter than
internal branches in NPY (but not cholinergic) neurons (all
P values are 2-tailed t tests).
Topology-related parameters
The number of dendritic orders was vastly different be-
tween the two chemically distinct neuronal populations as
shown in Fig. 8a, b which indicates that while cholinergic
dendrites run up to order 14, NPY dendrites run up to order
27. This simply means that NPY dendrites branch much
more than cholinergic ones. This results from the fact that
many small dendritic branchlets come out of main dendritic
shafts especially towards the end field of dendrites (see
dendrograms). These branchlets are morphologically dis-
tinct from spines and are in general longer than 5 l. Hence,
overall, the amount of branching of the NPY neurons
roughly doubles the amount of branching of cholinergic
neurons, and the main difference in branching is found
towards the ends of dendrites. Dendrites of NPY positive
neurons branch more than cholinergic dendrites at every
order. This difference was statistically significant
(P < 0.05, 2-tailed Mann–Whitney test). This indicates that
even in the case of the most proximal dendrites, NPY
dendritic trees branch more than cholinergic trees. This is
not surprising since we noticed that at the root (soma) it-
self, the three cholinergic cells had nine primary dendrites
and the three NPY neurons had 13 primary dendrites and
two short (25–30 lm long) dendritic-like appendages.
Analysis of the planar angle of the branching dendrites,
per dendritic order indicated that across all orders the
mean branching angle of cholinergic dendrites was
100.0 200.0 300.0 400.0 500.0 600.0
100.0 200.0 300.0 400.0 500.0 600.0 700.0 800.0
100.0 200.0 300.0 400.0 500.0
A
B
C
µ m
µ m
µ m
062R
116R
004R
Fig. 4 Dendrograms of three
cholinergic neurons. Neurons
(not to scale) are shown on the
right and the corresponding
dendrograms on the left. The
different dendrites in each
neuron have been drawn in a
different color, which
corresponds to the branch color
in the dendrogram. Somata are
black and axons are red.
a Cholinergic neuron 062R,
b cholinergic neuron 116R.
c Cholinergic neuron 004R.
Note that as compared to
Fig. 1a, the distal portion of the
projection axon of the
cholinergic cell 062R is
included
Brain Struct Funct (2007) 212:55–73 63
123

56.5 ± 14.0 degrees while the average branching angle of
NPY dendrites was 61.62 ± 7.69 degrees, this difference
was not statistically significant. Similarly, there was no
difference in the local bifurcation angle between the two
daughter branches of a bifurcation. There was no difference
in the measure of branch tortuosity between cholinergic
and NPY neurons; however, NPY neurons show signifi-
cantly larger topological (partition) asymmetry than cho-
linergic neurons. In the taper rate a substantial difference
was found between bifurcating and terminating branches,
but not between cholinergic and NPY neurons (Table 1).
Distribution morphometrics were obtained by looking at
the distributions of scalar morphometrics as a function of
dendritic path distance from the cell body. The distribution
of membrane surface as a function of the distance from the
soma along the dendritic path is illustrated in Fig. 8d.
Accordingly, the distribution of surface area is concen-
trated closer to the soma in cholinergic than in NPY neu-
rons. Figure 8e shows that if each of the six neurons were
‘‘scaled’’ to the same size, the dendritic surface area would
have very similar distribution along the dendritic path in
both ChAT and NPY neurons, thus the shift of the curve for
NPY neurons in Fig. 8d reflects simple scaling rather than
difference in the intrinsic structure of the dendrites.
The relationship between total dendritic tree length and
stem diameter (the start diameter of the primary dendrite)
in cholinergic (n = 9 trees, black symbols and lines) and
NPY (n = 13 trees, red symbols and lines) neurons was
also investigated as illustrated in Fig. 8f. A strong linear
correlation is observed between the two measures in both
groups (RChAT = 7.2, RNPY = 7.6). However, the linear
relationship between length and diameter has different
characteristics in the two cell groups (the intercept is twice
as big in cholinergic vs. NPY neurons). For example, an
NPY tree with a stem of 4 lm is expected to be 250%
longer than an NPY tree with a stem of 1 lm. In contrast, a
ChAT tree with a 4 lm stem would only be expected to be
less than 50% longer than a ChAT tree with a 1 lm stem.
Discussion
The main findings of this study are: (1) cholinergic and
NPY-containing BF neurons have roughly the same den-
dritic surface areas and lengths but differ in dendritic
branching, dendritic thickness and pattern of dendritic
endings; (2) both cholinergic and NPY-containing neurons
emit local axon collaterals.
Technical considerations
Juxtacellular labeling, neuron reconstruction. The six
neurons morphologically analyzed in detail for this study
were all juxtacellularly labeled and reconstructed by the
D
V
LM
A
EEG 1 mV
unit
10 s
EEG
TP
1 mV
unit
2.5 s
50 µ m
B
GPsm
f
C
Fig. 5 a Neurolucida
reconstruction of juxtacellularly
labeled basal forebrain NPY
positive neuron 059R. Greenprofiles are cholinergic neurons
in close proximity to NPY
axons. Inset shows possible
contact site between NPY axon
and cholinergic dendrite. bConcomitant unit and cortical
EEG spontaneous and tail pinch
(TP) induced activity
demonstrating this cell is ‘‘S’’
type. See full
electrophysiological analysis
and neurochemical
identification of all NPY
neurons presented here in
Duque et al. (2000). cHemicoronal section indicating
the position of this neuron in the
horizontal limb of the diagonal
band of Broca. f, fornix; GP,
globus pallidus; sm, stria
medullaris
64 Brain Struct Funct (2007) 212:55–73
123

same person using the same Neurolucida� system. Except
for different immunoreagents, all material was essentially
treated in the same way. Thus, the detected morphological
variability between NPY and cholinergic neurons is more
likely to reflect true differences instead of treatment or
operator artifacts. This is important in view of the fact that
significant morphometric differences have been found be-
tween reconstructions of the same material by two different
operators using the same system (Jaeger 2001) and even by
the same person when using two different reconstruction
systems (Kaspirzhny et al. 2002). In a quantitative study of
hippocampal pyramidal cells statistically significant dif-
ferences were not only found between anatomical classes
(CA3 vs. CA1 pyramidal cells), but also in the same
morphological class when neurons were reconstructed in
different laboratories (Scorcioni et al. 2004). Although
juxtacellular labeling can produce ‘‘Golgi like’’ staining
(Pinault 1994), the recording and labeling technique has
some limitations, most importantly, that the quality of the
fill depends on the length of time the cell is entrained for
and might not be as complete as the filling with intracel-
lular techniques if the cell is not labeled long enough.
However, this is a limiting factor that affects mostly, in our
experience, axonal labeling but does not affect in any
significant way the high quality dendritic labeling that was
required for this study.
Branch ordering. The high numbers for dendritic orders
may appear artificial but they are a direct consequence of
the centrifugal (or centripedal) ordering scheme that was
chosen precisely because of its ability to detect amount of
branching (see Supplementary Fig. 1). According to this
method the program counts the distance from the root in
terms of the segments traversed. Any missing portion of the
tree does not result in incorrect numbering of known seg-
ments. The method is independent of the distribution of
branches (whether or not a tree is balanced) and provides
general topological parameters. The centripete (retrograde
maximal ordering, diameter or Horsfield order), terminal
D
V
M L
50 µ m
A
B
enalplanorocsagittal plane
lasrod
laduaclateral
2.0 mm
C
Fig. 6 a Neurolucida
reconstruction of juxtacellularly
labeled basal forebrain NPY
positive neuron 134R. Not all of
the axonal arbor is seen here
since the main projection axon
was removed for better
visualization of the local axon
collaterals. Notice that most of
the dendritic endings are very
complex. b Illustrative coronal
sections from the serial
reconstruction of this neuron.
Several outlines have been
either removed or made thinner
to allow visualization of the
neuron. The projection axon
was artificially made thicker for
easier viewing. c View of this
neuron slightly rotated in space
showing the axon traveling
dorsally, rostrally and then
caudally
Brain Struct Funct (2007) 212:55–73 65
123

distance (retrograde minimal ordering) and Strahler
ordering methods begin labeling at the terminals and work
the ordering towards the root. For our interests the Strahler
system has the drawback of not counting a topological
distance property and is affected by balance. The terminal
distance method has the drawback of missing information
on the amount of branching (see Supplementary Fig. 1).
Obviously, the method of choice affects the number of
branch orders. For example, using the Strahler method, all
three cholinergic neurons have four dendritic orders, while
the number of orders in case of the NPY neurons varies
between three and five. If instead of the Strahler method,
one would apply the centripete ordering scheme then the
average number of dendritic orders for the three choliner-
gic neurons is ten and that for the three NPY cells is 17.6.
Using the terminal distance type of ordering ChAT cell
#062 has six orders but NPY neuron #134 runs only to
order 2 giving a totally wrong impression of the extent of
branching. However, one has to bear in mind that the
extraction of measures like terminal versus internal branch
length, partition asymmetry, diameter of dendrite stem is
independent of the branch ordering scheme used.
Statistical considerations. Since we have detailed mor-
phological parameters for only three neurons per group, we
cannot perform statistics on cell body measures (perikar-
yon volume, surface, etc.) and no statistical differences
were found if we applied tree-based analysis (see first 8
values in Table 1 and Fig. 8e) though we found significant
differences in comparing the number of dendritic branches
per dendritic order between ‘‘average’’ NPY and cholin-
ergic neurons using the centripedal branch order scheme
(Fig. 8b). Since each neuron provides a large number of
dendritic segments, branch-based analysis as opposed to
tree-based or neuron-based allows very reassuring statisti-
cal power and, indeed, we found significant differences in
measures, including terminating versus bifurcating branch
length, topological asymmetry and dendritic diameter be-
tween NPY and cholinergic neurons (lines 17–18, 21 and 9
in Table 1). Even if dendritic branches are not absolutely
independent observations, the results of this analysis reflect
a trend that does have biological meaning. An important
limitation of the present study is that it is based on only six
fully reconstructed electrophysiologically and neurochem-
ically identified cells. Therefore whether or not cholinergic
100.0 200.0 300.0 400.0 500.0
A
100.0 200.0 300.0 400.0 500.0 600.0
B
C
100.0 200.0 300.0 400.0 500.0 600.0 700.0 800.0
µ m
µ m
µ m
059R
134R
090R
Fig. 7 Dendrograms of three
NPY positive neurons. Neurons
(not to scale) are shown on the
right and the corresponding
dendrograms on the left. The
different dendrites in each
neuron have been drawn in a
different color, which
corresponds to the branch color
in the dendrogram. In all cases
somata are black and axons are
red. a NPY neuron 059R. bNPY neuron 090R. The greenprofile at the bottom represents
a cholinergic cell body in close
proximity to the reconstructed
neuron. c NPY neuron 134R.
The two short dendritic like
appendages originating from the
cell body of neuron 090R and
neuron 134R (short yellowlines) in b and c are included in
the dendrogram
66 Brain Struct Funct (2007) 212:55–73
123
and NPY neurons would show significant differences in
measures in which we did not find them in this study awaits
further investigations using a larger pool of neurons simi-
larly identified.
Dendritic arborization pattern of cholinergic
and NPY neurons
In agreement with dendritic morphology of physiologically
identified putative cholinergic neurons of the laterodorsal
tegmental nucleus (Surkis et al. 1996), the dendrites of BF
cholinergic and also of NPY neurons resemble to some
extent those of the ‘‘isodendritic core’’ (Ramon-Moliner
and Nauta 1966) or generalized type of dendritic arbor
(Scheibel and Scheibel 1961; Valverde 1961a, b; Ramon-
Moliner 1962; Leontovich and Zhukova 1963; Brauer et al.
1988; Pang et al. 1998) of neurons in the reticular forma-
tion of the brainstem. For e.g., the presence of few, rela-
tively straight dendrites and a branching pattern of
cholinergic and NPY dendrites in which the sum of the
lengths of the daughter branches is longer than the length
of the parent branch is consistent with this classification.
According to our estimates one cholinergic cell dendritic
domain might share its space with 50–80 other cholinergic
neurons, depending on its location in the BF, a character-
istic of isodendritic neurons. This assessment is more dif-
ficult to do for NPY neurons, whose detection may depend
heavily on the methodological approach. In colchicine
pretreated animals, with excellent staining of the NPY
somata and dendrites, the dendritic domain of a single NPY
neuron may be shared with 5–15 other NPY neurons (Za-
borszky and Duque 2000, 2003). However, there are some
differences between these two types of neurons. For
example, in NPY neurons short dendritic-like appendages
emanating from the soma were common. Also, the claw-
like (racemose) dendritic endings of NPY neuron 134R are
similar to the complex dendritic appendages of some pal-
lidal neurons described by Millhouse (1986) and are not
encountered in cholinergic neurons. NPY dendritic trees
are significantly more asymmetric than those of cholinergic
neurons (partition asymmetry is 0.79 for NPY and 0.56 for
cholinergic dendritic trees). Other cell classes have asym-
metry values consistent with ChAT cells rather than NPY
neurons, including spinal motoneurons at 0.46 ± 0.05 (Li
et al. 2005) and hippocampal pyramidal cells at
0.54 ± 0.06 (Scorcioni et al. 2004), suggesting that highly
asymmetric dendrites may be a specific peculiarity of NPY
cells. Comparing data of bifurcation angle, branch tortu-
osity, and daughter diameter ratio, in contrast, did not re-
veal any statistically significant difference between NPY
and ChAT neurons nor between either of these and hip-
pocampal pyramidal or spinal motor neurons (Scorcioni
et al. 2004; Li et al. 2005).
Both types of dendritic trees arborize in a box of about
0.1 mm3; hence the actual space occupied by dendrites
corresponds only to a fraction of their total spatial domain.
There was no significant difference in total dendritic length
comparing the average total dendritic length per cell type
(n = 3 for ChAT and n = 3 for NPY), or the average total
length per dendritic tree of each neuron type (n = 9 for
ChAT neurons and n = 13 for NPY-containing neurons,
without the small dendritic like appendages emanating
from the soma). It should be noted that these dendritic
length values are substantially lower that those reported for
hippocampal pyramidal cells (16 ± 6 mm in Scorcioni
et al. 2004) and spinal motoneurons (15 ± 6 mm in Li et al.
2005). In addition, in pyramidal and motor neurons length
values are similar for bifurcating and terminal branches. In
BF neurons, as illustrated in Fig. 8c, both terminal and
Table 1 Comparison of dendritic morphometric data between ChAT
and NPY neurons
ChAT NPY
Total dendritic length/cell 4,183 ± 620 5,328 ± 2,285
Dendritic surface/cell 12,809 ± 1,748 14,468 ± 10,495
Dendritic volume/cell 3,753 ± 504 4,061 ± 4183
Number of nodes/cell 37 ± 12 106 ± 93
Number of endings/cell 41 ± 12 125 ± 112
Number of trees/cell 3 ± 1 4.33 ± 1.15
Max branch order/cell 14 27
Dendritic tree length 1,458 ± 596 1,294 ± 606
Dendritic diameter across all
orders
0.967 ± 0.523a 0.829 ± 0.381a
Initial diameter of dendrite stem 2.39 ± 1.57 2.01 ± 1.07
Diameter, primary 2.19 ± 1.36a 1.50 ± 0.62a
Diameter, secondary 1.46 ± 0.74a 1.04 ± 0.50a
Diameter, tertiary 1.13 ± 0.37a 0.87 ± 0.39a
Diameter, quaternary 0.96 ± 0.31a 0.84 ± 0.38a
Power ratio 1.59 ± 1.74 1.36 ± 0.87
Daughter diameter ratio 2.36 ± 1.89 2.77 ± 1.54
Terminating branch length 48.93 ± 92.29b 13.22 ± 29.92b,d
Bifurcating (internal) branch
length
65.31 ± 86.70c 33.09 + 57.33c,d
Planar angle across all orders 56.5 ± 14.0 61.62 ± 7.69
Local bifurcation angle 92.29 ± 35.16 90.34 ± 37.97
Topological (partition)
asymmetry
0.57 ± 0.46e 0.79 ± 0.38e
Bifurcation branch taper –0.06 ± 0.80f –0.01 ± 0.55g
Terminating branch taper –0.30 ± 0.54f –0.23 ± 0.59g
Bifurcating branch tortuosity 0.81 ± 0.14 0.79 ± 0.18
Terminating branch tortuosity 0.83 ± 0.14 0.79 ± 0.16
a Statistically significant (Mann–Whitney U test)b–g Statistically significant (2-tailed Bonferroni corrected)
Brain Struct Funct (2007) 212:55–73 67
123

internal branches are significantly longer in cholinergic
than in NPY neurons and terminal branches are signifi-
cantly shorter than internal branches in NPY (but not
ChAT) neurons. Interestingly, the initial (stem) diameter of
the tree is a stronger predictor of dendritic length in NPY
than in ChAT neurons (Fig. 8f).
Dendritic morphology and structure–function
relationship
A major function of dendrites, assuming only passive
behavior, is to collect synaptic input and deliver an elec-
trotonically integrated version to the soma and down the
axon initial segment where output action potentials are
generated. Mounting evidence from computational studies
suggests that dendritic morphology can robustly affect
electrotonic properties (Carnevale et al. 1997), firing pat-
terns (Krichmar et al. 2002), synaptic integration (Poirazi
et al. 2003) and coincidence detection (Schaefer et al.
2003). The electrotonic structure of dendrites has been
shown to play a critical role in neuronal computation and
plasticity and some effort has been made to construct
morphoelectrotonic transforms (a graphical mapping from
morphological into electrotonic space) that would provide
a way for rapidly obtaining information on the functional
properties of dendritic trees (Zador et al. 1995; Carnevale
et al. 1997). Propagation of action potentials in dendrites
has also been shown to depend on dendritic morphology;
simulations performed with reconstructions of different
neuronal types demonstrated that the range of action po-
tential back-propagation efficacies observed experimen-
0.0
0.5
1.0
1.5
2.0
2.5
1 3 5 7 9 11 13 15 17 19 21 23 25 27
(ssenkciht
egarevA
µ)
m
Dendritic order
ChAT
NPY
*
***
Mann-Whitney2-tailed p < 0.0001
Thickness of ChAT and NPY dendrites
Dendritic order
sehcnarbforeb
muN ChAT
NPY
0
5
10
15
20
25
1 3 5 7 9 11 13 15 17 19 21 23 25 27
Mann-Whitney2-tailed p < 0.0001
Number of branches of ChAT and NPY dendrites
0
20
40
60
80
100
120
140
160
ChAT NPY
internal
terminalN=111
N=120N=360
p>0.1
p<10-7
p<10-8
p<10-5
Terminal and internal branch length in ChAT and NPY dendrites
(htgnel
hcnarB
µ)
m
N=373
0
500
1000
1500
2000
2500
0 200 400 600 800 1000
ChAT neuron average
NPY neuron average
ChAT normal fit (185±261)
NPY normal fit (247±274)
(aera
ecafruS
µm2 )
Path Distance ( µ m)
00.10.20.30.40.50.60.70.80.9
1
0 20 40 60 80 100
ChAT neuron average
NPY neuron average
Cum
ulat
ive
Sur
face
Frac
tion
Normalized Path Distance (%)
y = 436.16x + 415.35
R2 = 0.5775
y = 273.06x + 805.64
R2 = 0.5137
0
500
1000
1500
2000
2500
3000
0 1 2 3 4 5 6 7
ChAT
NPY
Linear (NPY)Linear (ChAT)
(htgneL
µ)
m
Stem Diameter ( µ m)
A
B
C
D
E
F
68 Brain Struct Funct (2007) 212:55–73
123

tally could be reproduced by variations in dendritic mor-
phology alone (Vetter et al. 2001). Computational models
of neuronal firing using 3D reconstructions of dendritic
morphology (of hippocampal cells) found that differences
between anatomical classes and within the same morpho-
logical class can have a dramatic influence on firing rate
and mode (Krichmar et al. 2002; Scorcioni et al. 2004).
There is no significant difference in the ‘‘power ratio’’
between the two classes of BF neurons examined here, as
well as between either NPY or ChAT (Table 1) and either
hippocampal pyramidal cells (at 1.7 ± 0.1 in Scorcioni
et al. 2004) or spinal motoneurons (at 1.4 ± 0.2 in Li et al.
2005). Since the power ratio measures the deviation from
‘‘ideal’’ cable behavior, it is inviting to speculate that, in
the assumption of similar electrotonic characteristics, the
passive integrative/coincidence detection properties of
ChAT and NPY cells may be comparable. However, the
differences in branching patterns and branch-level mor-
phometry (Fig. 8c, f; Table 1) combined with potential
differences of active properties could enable and imple-
ment distinct dynamics and functions between the two
neuronal types (Vetter et al. 2001; Krichmar et al. 2002;
Schaefer et al. 2003). Some of the active dendritic con-
ductances of cholinergic neurons in BF slices have been
characterized (Khateb et al. 1992; Alonso et al. 1996), but
no such data are available for NPY neurons in the BF.
If the length and surface area of the dendrites are an
indication of the possible number of incoming inputs, then
based on the results presented here, both cholinergic and
NPY-containing BF neurons may receive roughly the same
overall number of synapses. However, cholinergic neurons
with more surface area in the very proximal dendrites
might receive more inputs there than NPY neurons. Al-
though some distal portions of cholinergic dendrites are
thicker than distal endings of NPY dendrites, the complex
endings of NPY dendrites with their increased surface area
may compensate for their thinner proximal dendrites.
Increase in dendritic branching and length in BF neurons
has been described in Alzheimer’s disease using the Golgi
method that non-specifically labels all types of neurons
(Arendt et al. 1986). Our study is the first attempt at cre-
ating a basic set of dendritic parameters for specific neu-
ronal types in the BF against which alterations can be
measured in pathological conditions.
Local axonal collaterals of cholinergic
and NPY-containing BF neurons
Using Golgi impregnation or ChAT immunostaining
(Brauer et al. 1988), only the initial portions (up to 50 lm)
of the axons can be observed and hence these methods are
not useful in observing axon collaterals.
Searching for contacts from putative cholinergic col-
laterals onto GABAergic parvalbumin-immunoreactive rat
medial septum neurons, Brauer et al. (1998) injected the
immunotoxin 192IgG-saporin into the septal diagonal band
region and reported, at the EM level, degenerating termi-
nals in contact with both parvalbumin positive and negative
cells. Since the immunotoxin is supposed to affect only
cholinergic cells (Book et al. 1994), it was deduced that
local cholinergic collaterals must be present in the region, a
suggestion in agreement with previous presumptions to the
effect (Bialowas and Frotscher 1987). However, choliner-
gic collaterals were not directly demonstrated.
A study using intracellular injection of HRP for
staining of antidromically identified neurons revealed that
Fig. 8 a Dendritic diameter versus branch order. Cholinergic
dendrites, in black, run up to order 14. NPY dendrites are in grayand run up to order 27. The y axis corresponds to the average of the
average diameter of dendrites for each order and is given in lm.
There is a difference in the mean dendritic diameter or thickness per
branch order between the two populations. Across all dendritic orders,
the mean diameter of the cholinergic dendrites is 0.967 ± 0.523 lm
(n = 232 dendritic segments) while that of the NPY dendrites is
0.829 ± 0.381 lm (n = 691 dendritic segments). The difference
between these means is statistically significant (P < 0.0001, 2-tailed
Mann–Whitney test). b Average number of branches per dendritic
order for cholinergic and NPY basal forebrain neurons. The plot
indicates that in general, cholinergic neurons have fewer branches
than NPY neurons at every dendritic order. Data were normalized by
the number of neurons, so that the data correspond to an ‘‘average’’
neuron of a particular type, i.e., cholinergic or NPY. Cholinergic data
are in black and NPY data in gray. The number of dendritic orders
was vastly different between the two chemically distinct neuronal
populations. Overall, dendrites of NPY positive neurons branch more
than cholinergic dendrites at every order. This difference was
statistically significant (P < 0.05, 2-tailed Mann–Whitney test). cTerminal and internal branch lengths in ChAT and NPY neurons.
Both terminal and internal branches are significantly longer in ChAT
than in NPY neurons. In addition, terminal branches are significantly
shorter than internal branches in NPY (but not ChAT) neurons (all Pvalues are 2-tailed t tests). d Distribution of membrane surface along
the dendritic path. In absolute terms, the distribution of surface area is
concentrated closer to the soma in ChAT than in NPY neurons,
although the total amount of surface is approximately the same in the
two neuronal groups. e Cumulative surface fraction as a function of
normalized path distance indicates that if each of the six neurons was
‘‘scaled’’ to the same size, then, the dendritic surface area would have
very similar distribution along the dendritic path in both ChAT (N = 9
trees, black symbols and lines) and NPY (N = 13 trees, red symbolsand lines) cells. f Plotting dendritic length as a function of stem
diameter indicates a strong linear correlation (dashed lines) between
the two measures in both groups (RChAT = 7.2, RNPY = 7.6), and there
is no statistical difference in tree length (LChAT = 1,458 ± 596 lm;
LNPY = 1,294 ± 606 lm; P > 0.5, 2-tailed t test) or stem diameter
(DChAT = 2.39 ± 1.57 lm; DNPY = 2.01 ± 1.07 lm; P > 0.5) be-
tween the two groups. However, the linear relationship between
length and diameter has opposite characteristics in the two groups: the
intercept is nearly twice as large for ChAT than for NPY neurons (In
ChAT = 806 lm vs. In NPY = 415 lm), while the slope follows the
opposite inequality (SlChAT = 273 vs. SlNPY = 436), indicating a
stronger dependence of total length on stem diameter for NPY than
for ChAT dendritic trees
b
Brain Struct Funct (2007) 212:55–73 69
123

corticopetal neurons in the BF had local axon collaterals
displaying numerous boutons en passant (Reiner et al.
1987; Semba et al. 1987). However, due to the lack of
transmitter identification, the classification of the recon-
structed neurons remained open to speculation (Detari et al.
1999). A patch clamp study by Bengtson and Osborne
(2000) shows a reconstructed cholinergic neuron in the
ventral pallidum, which does not seem to have axon col-
laterals (although a small daughter branch is reported).
However, this was an in vitro study where truncation of
axons and dendrites is very common. A study of juxta-
cellularly labeled cholinergic neurons in the BF by Manns
et al. (2000) did not describe the axons of the labeled
neurons. In our study all cholinergic neurons reconstructed
possessed axon collaterals. To our knowledge this is,
therefore the first time that local axon collaterals of BF
cholinergic neurons have been demonstrated.
Several studies in brain slices containing the septum and
diagonal band have documented that cholinergic neurons
are capable of releasing acetylcholine locally in an impulse
dependent manner (Metcalf et al. 1988; Metcalf and Bo-
egman 1989; Nishimura and Boegman 1990), a finding that
is in agreement with the presence of abundant local axonal
collaterals of cholinergic neurons shown in this study.
Moreover, both nicotinic and muscarinic receptors are
found in the BF (Yu et al. 1993; Vilaro et al. 1994; Gotti
et al. 1997; Khateb et al. 1997, 1998; Csillik et al. 1998;
Jones and Muhlethaler 1999; Smiley et al. 1999a, b; Pic-
ciotto et al. 2000; Dani 2001). Muscarinic inhibition of
glutamatergic transmission onto rat magnocellular BF
neurons has been seen in slice preparations (Sim and
Griffith 1996). Cholinergic neurons have been shown to be
hyperpolarized by muscarine (Khateb et al. 1997) and
muscarinic receptor agonists strongly excite non-choliner-
gic, presumably GABAergic neurons in BF slices (Wu
et al. 2000), findings that are compatible with the idea that
cholinergic neurons may influence other local cholinergic,
glutamatergic and GABAergic neurons.
Although NPY axons have been shown to synapse with
cholinergic neurons in the BF using bulk-immunostained
material (Zaborszky and Duque 2000), due to the fact that
NPY is expressed in most of the brainstem catecholam-
inergic neurons with ascending projections to BF cholin-
ergic neurons (Zaborszky and Cullinan 1996; Hajszan and
Zaborszky 2002), the local origin of NPY synapses on
cholinergic neurons cannot be ascertained by these stud-
ies. On the other hand, reconstruction of the local axon-
collaterals of NPY neuron #059 from ultrathin sections,
indeed confirmed, in preliminary studies, that NPY vari-
cosities establish synapses with cholinergic dendrites
(Mosca et al. 2005). Since in the axonal arborization
space of a single NPY neuron, in addition to cholinergic
neurons a large number of other types of neurons exists,
including various calcium-binding protein containing
neurons (Zaborszky et al. 2002), the local postsynaptic
targets of the NPY axons remain to be established in
future electron microscopic studies. NPY is colocalized
with GABA (Aoki and Pickel 1989) and/or somatostatin
(Kohler et al. 1986) in many forebrain neurons. NPY has
been shown to inhibit GABA release presynaptically in
isolated self-innervating suprachiasmatic neurons (Chen
and Van den Pol 1996) and mediate postsynaptic dendritic
hyperpolarization in the thalamus (Sun et al. 2001, 2003).
Also, NPY was shown to inhibit glutamate release onto
hippocampal pyramidal cells in slice preparations from
human epileptic foci (Vezzani et al. 1999). In lack of
in vitro studies, it is unclear how NPY neurons may affect
the firing properties of cholinergic neurons. However,
considering their opposite firing relation to EEG activa-
tion as compared to that of cholinergic neurons (Duque
et al. 2000), the possibility that they contain GABA, and/
or somatostatin, and the conditions required for release of
neuropeptides (Hokfelt 1991), it is likely that during
synchronized EEG epochs, when NPY neurons show burst
firing (Duque et al. 2000), an increased release of NPY
could result in a pronounced modulation of GABAergic-
cholinergic transmission at least in the ventral pallidum
where cholinergic cell bodies are richly innervated by
GABAergic terminals (Zaborszky et al. 1986). A similar
scenario has been postulated for the action of somatostatin
that has recently been shown to inhibit presynaptically
both GABA and glutamate release onto rat BF cholinergic
neurons (Momiyama and Zaborszky 2006).
Concluding remarks
The 3D reconstruction of electrophysiologically and neu-
rochemically identified neurons in the BF is an important
step towards understanding the functional circuitry of this
brain area. Future modeling studies should incorporate the
morphological details described along with the specific
active dendritic conductances for analyzing their role in
synaptic integration. Knowledge of precise synaptic dis-
tributions and recordings of both the pre- and postsynaptic
neurons would further our understanding of the computa-
tional roles of NPY and cholinergic neurons within their
functional neural circuits and how the outputs of NPY
neurons affect action potential generation in principal BF
cells including cholinergic and GABAergic projection
neurons.
Acknowledgments This work was supported by: NIH NS23945,
NS34865, NS39600, R25 GM60826, and NSF 9413198. The authors
wish to acknowledge that some of the neurons analyzed in this study
were juxtacellularly labeled in cooperation with Dr. B. Balatoni.
Plastic embedding of sections was done by Mrs. Erzsebet Rommer.
70 Brain Struct Funct (2007) 212:55–73
123

References
Allen YS, Adrian TE, Allen JM, Tatemoto K, Crow TJ, Bloom SR,
Polak JM (1983) Neuropeptide Y distribution in the rat brain.
Science 221:877–879
Alonso A, Khateb A, Fort P, Jones BE, Muhlethaler M (1996)
Differential oscillatory properties of cholinergic and noncholin-
ergic nucleus basalis neurons in guinea pig brain slice. Eur J
Neurosci 8:169–182
Aoki C, Pickel VM (1989) Neuropeptide Y in the cerebral cortex and
the caudate-putamen nuclei: ultrastructural basis for interactions
with GABAergic and non-GABAergic neurons. J Neurosci
9:4333–4354
Arendt T, Zvegintseva HG, Leontovich TA (1986) Dendritic changes
in the basal nucleus of Meynert and in the diagonal band nucleus
in Alzheimer’s disease—a quantitative Golgi investigation.
Neuroscience 19:1265–1278
Bartus RT, Flicker C, Dean RL, Fisher S, Pontecorvo M, Figueiredo J
(1986) Behavioral and biochemical effects of nucleus basalis
magnocellularis lesions: implications and possible relevance to
understanding or treating Alzheimer’s disease. Prog Brain Res
70:345–361
Bengtson CP, Osborne PB (2000) Electrophysiological properties of
cholinergic and noncholinergic neurons in the ventral pallidal
region of the nucleus basalis in rat brain slices. J Neurophysiol
83:2649–2660
Bialowas J, Frotscher M, (1987) Choline acetyltransferase-immuno-
reactive neurons and terminals in the rat septal complex: a
combined light and electron microscopic study. J Comp Neurol
259:298–307
Book AA, Wiley RG, Schweitzer JB (1994) 192 IgG-saporin: I.
Specific lethality for cholinergic neurons in the basal forebrain of
the rat. J Neuropathol Exp Neurol 53:95–102
Brashear HR, Zaborszky L, Heimer L (1986) Distribution of
GABAergic and cholinergic neurons in the rat diagonal band.
Neuroscience 17:439–451
Brauer K, Schober W, Werner L, Winkelmann E, Lungwitz W, Hajdu
F (1988) Neurons in the basal forebrain complex of the rat: a
Golgi study. J Hirnforsch 29:43–71
Brauer K, Seeger G, Hartig W, Rossner S, Poethke R, Kacza J,
Schliebs R, Bruckner G, Bigl V (1998) Electron microscopic
evidence for a cholinergic innervation of GABAergic parvalbu-
min-immunoreactive neurons in the rat medial septum. J
Neurosci Res 54:248–253
Carnevale NT, Tsai KY, Claiborne BJ, Brown TH (1997) Compar-
ative electrotonic analysis of three classes of rat hippocampal
neurons. J Neurophysiol 78:703–720
Chen G, van den Pol AN (1996) Multiple NPY receptors coexist in
pre- and postsynaptic sites: inhibition of GABA release in
isolated self-innervating SCN neurons. J Neurosci 16:7711–7724
Chronwall BM, DiMaggio DA, Massari VJ, Pickel VM, Ruggiero
DA, O’Donohue TL (1985) The anatomy of neuropeptide-
Y-containing neurons in rat brain. Neuroscience 15:1159–1181
Csillik B, Rakic P, Knyihar-Csillik E (1998) Peptidergic innervation
and the nicotinic acetylcholine receptor in the primate basal
nucleus. Eur J Neurosci 10:573–585
Dani JA (2001) Overview of nicotinic receptors and their roles in the
central nervous system. Biol Psychiatry 49:166–174
Davies P, Maloney AJ (1976) Selective loss of central cholinergic
neurons in Alzheimer’s disease [letter]. Lancet 2:1403
de Quidt ME, Emson PC (1986a) Distribution of neuropeptide Y-like
immunoreactivity in the rat central nervous system-II. Immuno-
histochemical analysis. Neuroscience 18:545–618
de Quidt ME, Emson PC (1986b) Distribution of neuropeptide Y-like
immunoreactivity in the rat central nervous system-I. Radioim-
munoassay and chromatographic characterisation. Neuroscience
18:527–543
Detari L (2000) Tonic and phasic influence of basal forebrain unit
activity on the cortical EEG. Behav Brain Res 115:159–170
Detari L, Vanderwolf CH (1987) Activity of identified cortically
projecting and other basal forebrain neurones during large slow
waves and cortical activation in anaesthetized rats. Brain Res
437:1–8
Detari L, Rasmusson DD, Semba K (1999) The role of basal forebrain
neurons in tonic and phasic activation of the cerebral cortex.
Prog Neurobiol 58:249–277
Dringenberg HC, Vanderwolf CH (1998) Involvement of direct and
indirect pathways in electrocorticographic activation. Neurosci
Biobehav Rev 22:243–257
Duque A, Zaborszky L (2006) Juxtacellular labeling of individual
neurons in vivo: from electrophysiology to synaptology. In:
Zaborszky L, Wouterlood FG, Lanciego JL (eds) Neuroanatom-
ical tract-tracing 3 molecules, neurons, and systems. Springer,
New York, pp 197–236
Duque A, Balatoni B, Detari L, Zaborszky L (2000) EEG correlation
of the discharge properties of identified neurons in the basal
forebrain. J Neurophysiol 84:1627–1635
Edvinsson L, Minthon L, Ekman R, Gustafson L (1993) Neuropep-
tides in cerebrospinal fluid of patients with Alzheimer’s disease
and dementia with frontotemporal lobe degeneration. Dementia
4:167–171
Fisher RS, Levine MS (1989) Transmitter cosynthesis by corticopetal
basal forebrain neurons. Brain Res 491:163–168
Geula C, Mesulam MM (1994) Cholinergic systems and related
neuropathological predilection patterns in Alzheimer disease. In:
Terry RD, Katzman R, Bick KL (eds) Alzheimer disease. Raven,
New York, pp 263–291
Gotti C, Fornasari D, Clementi F (1997) Human neuronal nicotinic
receptors. Prog Neurobiol 53:199–237
Gritti I, Manns ID, Mainville L, Jones BE (2003) Parvalbumin,
calbindin, or calretinin in cortically projecting and GABAergic,
cholinergic, or glutamatergic basal forebrain neurons of the rat. J
Comp Neurol 458:11–31
Hajszan T, Zaborszky L (2002) Direct catecholaminergic-cholinergic
interactions in the basal forebrain. III. Adrenergic innervation of
choline acetyltransferase-containing neurons in the rat. J Comp
Neurol 449:141–157
Heimer L, de Olmos J, Alheid GF, Zaborszky L (1991) ‘‘Perestroika’’
in the basal forebrain: opening the border between neurology and
psychiatry. Prog Brain Res 87:109–165
Hokfelt T (1991) Neuropeptides in perspective: the last ten years.
Neuron 7:867–879
Horikawa K, Armstrong WE (1988) A versatile means of intracellular
labeling: injection of biocytin and its detection with avidin
conjugates. J Neurosci Methods 25:1–11
Hur EE, Zaborszky L (2005) Vglut2 afferents to the medial prefrontal
and primary somatosensory cortices: a combined retrograde
tracing in situ hybridization. J Comp Neurol 483(3):351–73
Jaeger D (2001) Accurate reconstruction of neuronal morphology. In:
De Schutter E (ed) Computational neuroscience: realistic
modeling for experimentalists. Lewis, Boca Raton, pp 159–178
Jones BE, Muhlethaler M (1999) Cholinergic and GABAergic
neurons of the basal forebrain: role in cortical activation. In:
Lydic R, Baghdoyan HA (eds) Handbook of behavioral state
control—cellular and molecular mechanisms. CRC, Boca Raton,
pp 213–234
Brain Struct Funct (2007) 212:55–73 71
123

Kaspirzhny AV, Gogan P, Horcholle-Bossavit G, Tyc-Dumont S
(2002) Neuronal morphology data bases: morphological noise
and assessment of data quality. Network 13:357–380
Khateb A, Muhlethaler M, Alonso A, Serafin M, Mainville L, Jones
BE (1992) Cholinergic nucleus basalis neurons display the
capacity for rhythmic bursting activity mediated by low-thresh-
old calcium spikes. Neuroscience 51:489–494
Khateb A, Fort P, Williams S, Serafin M, Jones BE, Muhlethaler M
(1997) Modulation of cholinergic nucleus basalis neurons by
acetylcholine and N-methyl-D-aspartate. Neuroscience 81:47–55
Khateb A, Fort P, Williams S, Serafin M, Muhlethaler M, Jones BE
(1998) GABAergic input to cholinergic nucleus basalis neurons.
Neuroscience 86:937–947
Kohler C, Eriksson L, Davies S, Chan-Palay V (1986) Neuropeptide
Y innervation of the hippocampal region in the rat and monkey
brain. J Comp Neurol 244:384–400
Krichmar JL, Nasuto SJ, Scorcioni R, Washington SD, Ascoli GA
(2002) Effects of dendritic morphology on CA3 pyramidal cell
electrophysiology: a simulation study. Brain Res 941:11–28
Leontovich TA, Zhukova GP (1963) The specificity of the neuronal
structure and topography of the reticular formation in the brain
and spinal cord of carnivora. J Comp Neurol 121:347–379
Li Y, Brewer D, Burke RE, Ascoli GA (2005) Developmental
changes in spinal motoneuron dendrites in neonatal mice. J
Comp Neurol 483:304–317
Manns ID, Alonso A, Jones BE (2000) Discharge properties of
juxtacellularly labeled and immunohistochemically identified
cholinergic basal forebrain neurons recorded in association with
the electroencephalogram in anesthetized rats. J Neurosci
20:1505–1518
Metcalf RH, Boegman RJ (1989) Release of acetylcholine from tissue
slices of the rat nucleus basalis magnocellularis. J Neurochem
52:1143–1148
Metcalf RH, Boegman RJ, Riopelle RJ, Ludwin SK (1988) The
release of endogenous acetylcholine from the medial septum/
diagonal band of rat brain. Neurosci Lett 93:85–90
Millhouse OE (1986) Pallidal neurons in the rat. J Comp Neurol
254:209–227
Minthon L, Edvinsson L, Gustafson L (1996) Correlation between
clinical characteristics and cerebrospinal fluid neuropeptide Y
levels in dementia of the Alzheimer type and frontotemporal
dementia. Alzheimer Dis Assoc Disord 10:197–203
Momiyama T, Zaborszky L (2006) Somatostatin presynaptically
inhibits both GABA and glutamate release onto rat basal
forebrain cholinergic neurons. J Neurophysiol 96:686–694
Mosca KF, Duque A, Detari L, Noszek A, Rommer E, Zaborszky L
(2005) Postsynaptic target of electrophysiologically identified
NPY axons in the rat basal forebrain. Program No. 936.1. SFN
Abstracts. Washington DC, Online
Nishimura LM, Boegman RJ (1990) N-methyl-D-aspartate-evoked
release of acetylcholine from the medial septum/diagonal band
of rat brain. Neurosci Lett 115:259–264
Nunez A (1996) Unit activity of rat basal forebrain neurons:
relationship to cortical activity. Neuroscience 72:757–766
Pang K, Tepper JM, Zaborszky L (1998) Morphological and
electrophysiological characteristics of noncholinergic basal
forebrain neurons. J Comp Neurol 394:186–204
Picciotto MR, Caldarone BJ, King SL, Zachariou V (2000) Nicotinic
receptors in the brain. Links between molecular biology and
behavior. Neuropsychopharmacology 22:451–465
Pinault D (1994) Golgi-like labeling of a single neuron recorded
extracellularly. Neurosci Lett 170:255–260
Pinault D (1996) A novel single-cell staining procedure performed
in vivo under electrophysiological control: morpho-functional
features of juxtacellularly labeled thalamic cells and other
central neurons with biocytin or neurobiotin. J Neurosci Methods
65:113–136
Poirazi P, Brannon T, Mel BW (2003) Arithmetic of subthreshold
synaptic summation in a model CA1 pyramidal cell. Neuron
37:977–987
Ramon-Moliner E (1962) An attempt at classifying nerve cells on the
basis of their dendritic patterns. J Comp Neurol 119:211–227
Ramon-Moliner E, Nauta WJ (1966) The isodendritic core of the
brain stem. J Comp Neurol 126:311–336
Reiner PB, Semba K, Fibiger HC, McGeer EG (1987) Physiological
evidence for subpopulations of cortically projecting basal
forebrain neurons in the anesthetized rat. Neuroscience
20:629–636
Sarter M, Bruno JP (1999) Abnormal regulation of corticopetal
cholinergic neurons and impaired information processing in
neuropsychiatric disorders. Trends Neurosci 22:67–74
Sarter M, Parikh V (2005) Choline transporters, cholinergic trans-
mission and cognition. Nat Rev Neurosci 6:48–56
Schaefer AT, Larkum ME, Sakmann B, Roth A (2003) Coincidence
detection in pyramidal neurons is tuned by their dendritic
branching pattern. J Neurophysiol 89:3143–3154
Scheibel ME, Scheibel AB (1961) On circuit patterns of the brain
stem reticular core. Ann N Y Acad Sci 89:857–865
Scorcioni RE, Ascoli GA (2001) Algorithmic extraction of morpho-
logical statistics from electronic archives of neuroanatomy. Lect
Notes Comp Sci 2084:30–37
Scorcioni R, Lazarewicz MT, Ascoli GA (2004) Quantitative
morphometry of hippocampal pyramidal cells: differences
between anatomical classes and reconstructing laboratories. J
Comp Neurol 473:177–193
Semba K, Reiner PB, McGeer EG, Fibiger HC (1987) Morphology of
cortically projecting basal forebrain neurons in the rat as
revealed by intracellular iontophoresis of horseradish peroxi-
dase. Neuroscience 20:637–651
Sim JA, Griffith WH (1996) Muscarinic inhibition of glutamatergic
transmissions onto rat magnocellular basal forebrain neurons in a
thin-slice preparation. Eur J Neurosci 8:880–891
Smiley JF, Levey AI, Mesulam MM (1999a) m2 muscarinic receptor
immunolocalization in cholinergic cells of the monkey basal
forebrain and striatum. Neuroscience 90:803–814
Smiley JF, Subramanian M, Mesulam MM (1999b) Monoaminergic-
cholinergic interactions in the primate basal forebrain. Neuro-
science 93:817–829
Sun QQ, Akk G, Huguenard JR, Prince DA (2001) Differential
regulation of GABA release and neuronal excitability mediated
by neuropeptide Y1 and Y2 receptors in rat thalamic neurons. J
Physiol 531:81–94
Sun QQ, Baraban SC, Prince DA, Huguenard JR (2003) Target-
specific neuropeptide Y-ergic synaptic inhibition and its network
consequences within the mammalian thalamus. J Neurosci
23:9639–9649
Surkis A, Taylor B, Peskin CS, Leonard CS (1996) Quantitative
morphology of physiologically identified and intracellularly
labeled neurons from the guinea-pig laterodorsal tegmental
nucleus in vitro. Neuroscience 74:375–392
Toth A, Zaborszky L, Detari L (2005) EEG effect of basal forebrain
neuropeptide Y administration in urethane anaesthetized rats.
Brain Res Bull 66:37–42
Valverde F (1961a) A new type of cell in the lateral reticular
formation of the brain stem. J Comp Neurol 117:189–195
Valverde F (1961b) Reticular formation of the pons and medulla
oblongata. A Golgi study. J Comp Neurol 116:71–99
Vetter P, Roth A, Hausser M (2001) Propagation of action potentials
in dendrites depends on dendritic morphology. J Neurophysiol
85:926–937
72 Brain Struct Funct (2007) 212:55–73
123

Vezzani A, Sperk G, Colmers WF (1999) Neuropeptide Y: emerging
evidence for a functional role in seizure modulation. Trends
Neurosci 22:25–30
Vilaro MT, Palacios JM, Mengod G (1994) Multiplicity of muscarinic
autoreceptor subtypes? Comparison of the distribution of
cholinergic cells and cells containing mRNA for five subtypes
of muscarinic receptors in the rat brain. Brain Res Mol Brain Res
21:30–46
Voytko ML, Olton DS, Richardson RT, Gorman LK, Tobin JR, Price
DL (1994) Basal forebrain lesions in monkeys disrupt attention
but not learning and memory [published erratum appears in J
Neurosci 1995 Mar;15(3 Pt 2):following table of contents]. J
Neurosci 14:167–186
Walker LC, Koliatsos VE, Kitt CA, Richardson RT, Rokaeus A, Price
DL (1989a) Peptidergic neurons in the basal forebrain magno-
cellular complex of the rhesus monkey. J Comp Neurol 280:272–
282
Walker LC, Price DL, Young WS (1989b) GABAergic neurons in the
primate basal forebrain magnocellular complex. Brain Res
499:188–192
Whitehouse PJ, Price DL, Struble RG, Clark AW, Coyle JT, Delon
MR (1982) Alzheimer’s disease and senile dementia: loss of
neurons in the basal forebrain. Science 215:1237–1239
Wolak ML, DeJoseph MR, Cator AD, Mokashi AS, Brownfield MS,
Urban JH (2003) Comparative distribution of neuropeptide Y Y1
and Y5 receptors in the rat brain by using immunohistochem-
istry. J Comp Neurol 464:285–311
Wu M, Shanabrough M, Leranth C, Alreja M (2000) Cholinergic
excitation of septohippocampal GABA but not cholinergic
neurons: implications for learning and memory. J Neurosci
20:3900–3908
Yu MC, Luo CB, Long L, Yew DT (1993) An immunohistochemical
study of neuropeptide Y positive sites in the developing human
hippocampal formation. Brain Res Dev Brain Res 72:277–281
Zaborszky L, Cullinan WE (1996) Direct catecholaminergic-cholin-
ergic interactions in the basal forebrain. I. Dopamine-beta-
hydroxylase- and tyrosine hydroxylase input to cholinergic
neurons. J Comp Neurol 374:535–554
Zaborszky L, Duque A (2000) Local synaptic connections of basal
forebrain neurons. Behav Brain Res 115:143–158
Zaborszky L, Duque A (2003) Sleep–wake mechanisms and basal
forebrain circuitry. Front Biosci 8:d1146–d1169. [Pub-
Med#:12957822] http://www.bioscience.org/
Zaborszky L, Heimer L, Eckenstein F, Leranth C (1986) GABAergic
input to cholinergic forebrain neurons: an ultrastructural study
using retrograde tracing of HRP and double immunolabeling. J
Comp Neurol 250:282–295
Zaborszky L, Pang K, Somogyi J, Nadasdy Z, Kallo I (1999) The
basal forebrain corticopetal system revisited. Ann N Y Acad Sci
877:339–367
Zaborszky L, Csordas A, Duque A, Somogy J, Nadasdy Z (2002)
Computational anatomical analysis of the basal forebrain
corticopetal system. In: Ascoli G (ed) Computational neuroanat-
omy: principles and methods. Humana, Totowa, pp 171–197
Zador AM, Agmon-Snir H, Segev I (1995) The morphoelectrotonic
transform: a graphical approach to dendritic function. J Neurosci
15:1669–1682
Brain Struct Funct (2007) 212:55–73 73
123