Embed Size (px)
Citation preview

Mormon Cricket Control in Utah’s West Desert—Evaluation of Impacts of the Pesticide Diflubenzuron on Nontarget Arthropod Communities
Open–File Report 2008–1305
U.S. Department of the InteriorU.S. Geological Survey

This page intentionally left blank
Mormon Cricket Control in Utah’s West Desert—Evaluation of Impacts of the Pesticide Diflubenzuron on Nontarget Arthropod Communities
By Tim B. Graham, Anne M.D. Brasher, and Rebecca N. Close
Open–File Report 2008–1305
U.S. Department of the InteriorU.S. Geological Survey

U.S. Department of the InteriorDIRK KEMPTHORNE, Secretary
U.S. Geological SurveyMark D. Myers, Director
U.S. Geological Survey, Reston, Virginia: 2008
For product and ordering information: World Wide Web: http://www.usgs.gov/pubprod Telephone: 1-888-ASK-USGS
For more information on the USGS--the Federal source for science about the Earth, its natural and living resources, natural hazards, and the environment: World Wide Web: http://www.usgs.gov Telephone: 1-888-ASK-USGS
Any use of trade, product, or firm names is for descriptive purposes only and does not imply endorsement by the U.S. Government.
Although this report is in the public domain, permission must be secured from the individual copyright owners to reproduce any copyrighted materials contained within this report.
Suggested citation:Graham, T.B., Brasher, A.M.D., and Close, R.N., 2008, Mormon cricket control in Utah's west desert; evaluation of impacts of the pesticide diflubenzuron on nontarget arthropod communities: U.S. Geological Survey Open-File Report 2008–1305, 82 p. [http://pubs.usgs.gov/of/2008/1305/].
Cover: Female Mormon cricket (Anabrus simplex); U.S. Geological Survey photograph by Tim Graham.

iii
Contents
Executive Summary .......................................................................................................................................1Introduction ....................................................................................................................................................2
Objectives...............................................................................................................................................2Scope ....................................................................................................................................................2
Study Area.......................................................................................................................................................3Terrestrial Sampling .....................................................................................................................................4
Study Sites .............................................................................................................................................4Sampling Design ...................................................................................................................................5Sample Collection and Processing ....................................................................................................8Sample Sorting and Identification .....................................................................................................9Data Analysis .........................................................................................................................................9
Terrestrial Results ........................................................................................................................................10Comparison of Proportional Abundance ........................................................................................10
Grouse Creek ..............................................................................................................................10Ibapah .........................................................................................................................................12Vernon .........................................................................................................................................12
Comparisons of Abundance by Orders in Treated and Untreated Zones..................................13Grouse Creek ..............................................................................................................................14
Pre- versus Post-Treatment Changes in Untreated Zone ..........................................14Pre- versus Post-Treatment Changes in Treated Zone ..............................................17Pre-Treatment Changes in Untreated versus Treated Zones ....................................17Post-Treatment Changes in Untreated versus Treated Zones ..................................17
Ibapah .........................................................................................................................................17Vernon .........................................................................................................................................17
Terrestrial Community Structure ......................................................................................................17Grouse Creek ..............................................................................................................................18Ibapah .........................................................................................................................................19Vernon .........................................................................................................................................19
Formicidae............................................................................................................................................19Grouse Creek ..............................................................................................................................19Ibapah .........................................................................................................................................20Vernon .........................................................................................................................................20Comparisons Among Study Sites ............................................................................................20Ant Community Structure .........................................................................................................21
Hemiptera .............................................................................................................................................23Grouse Creek ..............................................................................................................................24
Pre- versus Post-Treatment Changes in Untreated Zone ..........................................24Pre- versus Post-Treatment Changes in the Treated Zone ........................................24
Ibapah .........................................................................................................................................24Zones Treated in 2004 versus Untreated Zones ..........................................................24
Vernon .........................................................................................................................................25Sites Treated in 2004 versus Untreated Sites ...............................................................25

iv
Community Structure of Hemiptera ........................................................................................25Solifugae and Scorpiones .................................................................................................................27
Aquatic Sampling ........................................................................................................................................27Study Sites ...........................................................................................................................................27Sampling Design .................................................................................................................................32Sample Collection and Processing ..................................................................................................32Sample Sorting and Identification ...................................................................................................32Data Analysis .......................................................................................................................................33
Aquatic Results ............................................................................................................................................33Aquatic Macrofauna by Study Area ................................................................................................33Richness, Abundance, and Diversity at Sampling Sites in the Three Study Areas .................40
Grouse Creek ..............................................................................................................................40Ibapah .........................................................................................................................................41Vernon .........................................................................................................................................42
Macroinvertebrates in the Grouse Creek Treatment Zone ..........................................................43Aquatic Community Structure ..........................................................................................................43
Discussion .....................................................................................................................................................44Terrestrial Study ..................................................................................................................................44Aquatic Study ......................................................................................................................................49
Conclusions...................................................................................................................................................49Acknowledgments .......................................................................................................................................50References ....................................................................................................................................................50Appendix A: Terrestrial Taxa Collected—Total Number of Arthropods Caught During Each
Sampling Event at Each Site .........................................................................................................53Appendix B: Aquatic Taxa Collected ........................................................................................................61
Figures 1. Mormon crickets on the road at Grouse Creek study site in May 2005 ..............................2 2. Grouse Creek study area .............................................................................................................3 3. Ibapah study area .........................................................................................................................4 4. Vernon study area ........................................................................................................................5 5. Typical terrestrial site at Grouse Creek study site, Utah, showing pitfall traps .................7 6. Typical terrestrial site at Ibapah study site, Utah ....................................................................8 7. Typical terrestrial site at Vernon study site, Utah, showing pitfall traps .............................8 8. Arrangement of pitfall traps at each terrestrial arthropod sampling site of the study .....9 9. Putting in pitfall traps ...................................................................................................................9 10. Processing terrestrial arthropods from pitfall trap in the field ...........................................10 11. Sorting pitfall trap samples, removing debris, and identifying specimens to order ........10 12. Proportional representation of taxa at the four sites in the Grouse Creek .......................11 13. Proportional representation of taxa at the four sites in the Grouse Creek .......................12 14. Proportional representation of taxa at the eight Ibapah sites ............................................13 15. Proportional representation of taxa at the eight Vernon sites ............................................14

v
16. Average number of individuals (by taxon) at the three study areas. .................................15 17. Nonmetric multidimensional scaling ordination for all sites ...............................................18 18. Relative abundance of ant genera at Grouse Creek ............................................................21 19. Relative abundance of ant genera at Ibapah untreated and treated zones .....................22 20. Relative abundance of ant genera at Vernon untreated and treated zones ....................22 21. Nonmetric multidimensional scaling joint plot of ant genera as number of ants per day
at Grouse Creek, Ibapah, and Vernon .....................................................................................23 22. Relative abundances of Hemiptera families at Grouse Creek untreated and treated
zones before and after treatment with diflubenzuron. .........................................................25 23. Relative abundances of Hemiptera families at Ibapah treated and untreated sites ......26 24. Relative abundances of Hemiptera families at Vernon untreated and treated sites ......26 25. Nonmetric multidimensional scaling ordination of Hemiptera families at the three study
areas .............................................................................................................................................27 26. Number of wind scorpions per day versus number of scorpions per day at Ibapah study
site ................................................................................................................................................28 27. Aquatic site at Grouse Creek ....................................................................................................28 28. Aquatic site at Ibapah ................................................................................................................30 29. Aquatic site at Vernon ...............................................................................................................30 30. Collecting an aquatic macroinvertebrate sample using a D-frame net ............................32 31. Cluster Spring 2 at Grouse Creek, within the treated zone .................................................33 32. Aquatic macroinvertebrate sampling at one of the study streams ....................................33 33. Relative abundances of aquatic taxa in springs and streams at the Grouse Creek
study area ....................................................................................................................................40 34. Relative abundances of aquatic taxa in springs and streams at the Ibapah study
area. ..............................................................................................................................................41 35. Relative abundances of aquatic taxa in streams at the Vernon study area .....................41 36. Taxa abundance and richness and diversity inside and outside diflubenzuron treatment
zones at Grouse Creek, only after treatment .........................................................................42 37. Taxa abundance and richness and diversity inside and outside diflubenzuron treatment
zones at Grouse Creek, all sampling dates included ............................................................43 38. Taxa abundance and richness and diversity inside and outside diflubenzuron treatment
zones at Ibapah ...........................................................................................................................44 39. Taxa abundance and richness and diversity inside and outside diflubenzuron treatment
zones at Vernon ...........................................................................................................................45 40. Taxa abundance and richness before diflubenzuron treatment, 2 weeks after treat-
ment, and 4 months after treatment, at the Grouse Creek study area ...............................46 41. Nonmetric multidimensional scaling joint plot with aquatic macroinvertebrate relative
taxa abundances ........................................................................................................................47
Tables 1. Terrestrial site and sampling information .................................................................................6 2. Ant genera found in each west desert treatment zone and during each sampling
period ..................................................................................................................................... 20

vi
3. Total number of ants collected in treated and untreated zones at Grouse Creek after treatment with diflubenzuron ....................................................................................................24
4. Aquatic site information ............................................................................................................29 5. Aquatic site characteristics and sampling information .......................................................31 6. Aquatic taxa collected at the three west desert study areas .............................................34

Mormon Cricket Control in Utah’s West Desert—Evaluation of Impacts of the Pesticide Diflubenzuron on Nontarget Arthropod Communities
By Tim B. Graham1, Anne M.D. Brasher2, and Rebecca N. Close3
Executive SummaryGrasshopper and Mormon cricket (Orthoptera) popula-
tions periodically build to extremely high numbers and can cause significant economic damage in rangelands and agri-cultural fields of the Great Plains and Intermountain West. A variety of insecticides have been applied to control population outbreaks, with recent efforts directed at minimizing impacts to nontarget fauna in treated ecosystems. A relatively new insecticide for control of Orthoptera is diflubenzuron, which acts to inhibit chitin production, ultimately causing death during the molt following ingestion of the insecticide. All arthropods, including insects, mites, and crustaceans, use chi-tin to build their exoskeletons and will die if they are unable to produce it during the next molt. Diflubenzuron is not taxon specific—it affects all arthropods that ingest it, except adult insects, which do not molt. Consequently, application of this pesticide has the potential to significantly reduce not only target populations but all terrestrial and aquatic arthropods within treatment zones.
Some research has been done in the Great Plains on the impact of diflubenzuron on nontarget arthropods in the context of grasshopper-control programs, but no work has been done in the Great Basin in Mormon cricket-control areas. This study was instigated in anticipation of the need for extensive control of Orthoptera outbreaks in Utah’s west desert during 2005, and it was designed to sample terrestrial and aquatic arthro-pod communities in both treated and untreated zones. Three areas were sampled: Grouse Creek, Ibapah, and Vernon. High mortality of Mormon cricket eggs in the wet, cool spring of 2005 restricted the need to control Mormon crickets to Grouse Creek. Diflubenzuron was applied (aerial reduced agent-area treatment) in May 2005. Terrestrial and aquatic arthropod
communities were sampled before and after application of diflubenzuron in the Grouse Creek area of northwestern Utah in May and June of 2005. In July 2005, U.S. Geological Survey scientists sampled areas in Ibapah and Vernon that had been treated with diflubenzuron in 2004, along with adjacent untreated areas. Pitfall traps at four treated and four untreated sites were used to collect ground-dwelling terrestrial arthro-pods. Semiquantitative sweep surveys of aquatic habitats were made before treatment, 2 weeks after treatment, and 4 months after treatment (after leaf fall) at Grouse Creek. One-year post-treatment samples were collected by using the same methods for terrestrial and aquatic arthropods at Ibapah and Vernon in July 2005 (treatments applied in June 2004).
More than 124,000 terrestrial arthropods were collected from the three study areas, and more than 200,000 aquatic invertebrates were collected in the aquatic samples. Direct effects of diflubenzuron on aquatic and terrestrial arthropod communities were not apparent in our data from Grouse Creek. The treatment was designed to avoid spraying pesticide on water bodies, and no measurable effects on aquatic commu-nities from either springs or streams were observed, with the exception of the reduction of taxa richness at Vernon (a result confounded by elevational differences in the treatment and nontreatment zones). Some trends indicate diflubenzuron may affect some terrestrial taxa. Ant communities showed some differences, with possible lag effects at Ibapah and Vernon. Forelius was more abundant, while Tapinoma and, perhaps, Formica declined in treated zones in these two study areas. Solenopsis also was more numerous at treated Ibapah sites but varied without pattern at Vernon. Scorpions were abundant at Grouse Creek and Ibapah but rare at Vernon. Numbers did not change during several weeks at Grouse Creek, but at Ibapah, numbers at treated sites were much lower than at untreated sites. The Lygaeidae (in the order Hemiptera) were more abun-dant in the untreated zones at Ibapah and Vernon, although significantly so only at Ibapah. Lygaeidae were absent from the treated zone at Grouse Creek (before and after treatment) but were present after treatment in the untreated zone. Addi-tional research is recommended to determine more explicitly whether these taxa are sensitive to diflubenzuron applications in the Great Basin.
1 U.S. Geological Survey, Southwest Biological Science Center, Canyon-lands Research Station, Moab, Utah
2 U.S. Geological Survey, Utah Water Science Center, Moab, Utah
3 U.S. Geological Survey, Utah Water Science Center, Salt Lake City, Utah

2 Mormon Cricket Control in Utah’s West Desert—Evaluation of Impacts of the Pesticide Diflubenzuron
Introduction In rangeland ecosystems of the United States, populations
of Orthoptera (including grasshoppers and Mormon crick-ets) can rapidly build to levels that cause economic damage. Despite efforts to prevent outbreaks, grasshopper (multiple species) and Mormon cricket (Anabrus simplex) populations (fig. 1) were at large levels for 5 to 6 years preceding this study in the west desert of northern Utah (U.S. Department of Agriculture, 2002). Although much of the area of outbreak was outside of cultivated lands, State and Federal agencies and private landowners were concerned about consumption of crops and range forage during these infestations. The need for rapid and effective suppression of Orthoptera when an outbreak occurs limits the control options available, and the application of an insecticide within all or part of the outbreak area has been the primary response for rapid suppression or reduction of Orthoptera populations to effectively protect rangeland. Control efforts have been implemented in Utah’s west desert since 2002 in areas of particularly large Orthoptera populations.
The primary chemicals used for control of grasshoppers and crickets are carbaryl, applied as bran bait, and difluben-zuron, applied as an aerial spray. However, because the use of carbaryl in Utah’s west desert has been greatly curtailed and is more localized, we focused on diflubenzuron treatments. Diflubenzuron is a chitin-inhibiting agent, causing arthropods to die during the molting process. Arthropods (including insects, arachnids, and crustaceans) have a hard exoskeleton made of chitin. Since diflubenzuron is a chitin-inhibitor, it affects nontarget arthropods, as well as grasshoppers and crickets. Previous studies have shown that although difluben-zuron is not directly toxic to vertebrates, birds can be indi-rectly affected when this pesticide reduces availability of key prey items (Sample and others, 1993). Consequently, a major concern in the west desert is that by killing nontarget arthro-
pods, the food base for sensitive, rare, or threatened verte-brates, such as sage grouse and spotted frogs, will be depleted.
Studies on the Great Plains have shown diflubenzuron to have minimal impacts on nontarget arthropods and their vertebrate predators (Wilcox and Coffey, 1978; McEwen and others, 1996), reinforcing the decision to use diflubenzuron in a reduced agent-area treatment design (using less pesticide in alternating swaths) instead of carbaryl or malathion. Some nontarget arthropods were affected by diflubenzuron, at least in the short term, in some studies (Catangui and others, 2000; Smith and others, 2006). The generality of previous work has not been established. Information directly applicable to the environment of Utah’s west desert is required for assessing potential impacts of diflubenzuron on nontarget arthropods in the Great Basin.
Objectives
This study was designed to help managers improve Orthoptera-control programs by increasing the understand-ing of how diflubenzuron affects both target and nontarget arthropods. The specific objectives of this study were to (1) compare aquatic and terrestrial arthropod community structure (abundance and species composition) in treated and untreated sites in the west desert to determine whether there were changes in either target or nontarget arthropod popula-tions, (2) compare responses at three study areas to deter-mine whether response was similar across the landscape, and (3) compare terrestrial and aquatic arthropod community structure over time at each study area following insecticide treatment. The study also yields valuable baseline data on both aquatic and terrestrial arthropod communities in west desert rangeland ecosystems.
Scope
Three areas of Utah’s west desertGrouse Creek, Ibapah, and Vernonwere chosen for 2005 sampling based on Orthoptera outbreaks in preceding years. However, in 2005, the only area significantly infested, and therefore sprayed with diflubenzuron, was Grouse Creek. We modified our objec-tives to account for the reduced control effort. We sampled for short-term effects of diflubenzuron at Grouse Creek; at the other two study areas, we tested for lag effects of difluben-zuron application by sampling in untreated zones and zones treated in 2004. Without prespray data or several years of postspray data, our analysis was limited. In addition, water bodies are rare in this semiarid environment; consequently, it was difficult to locate a large number of comparable types of aquatic systems within and outside the treated zone in a given study area. Topography also proved to be an issue, particu-larly at Vernon, for both terrestrial and aquatic sampling because the treatment zone was on the valley floor and sites outside of the treatment zone were approximately 60−65 m higher in elevation.
Figure 1. Mormon crickets on the road at Grouse Creek study site in May 2005, Utah (U.S. Geological Survey photograph by Tim Graham).

Study AreaGrouse Creek (fig. 2), Ibapah (fig. 3), and Vernon (fig.
4) in Utah’s west desert were chosen for sampling due to large Mormon cricket populations in previous years and large expected populations for 2005. Ibapah and Vernon had large Mormon cricket populations for a number of years but were not treated with diflubenzuron prior to 2004 (G. Abbott, Ani-mal and Plant Health Service, written commun., 2007). Grouse Creek had not been treated before 2005. Patchy application of carbaryl bran bait in previous years was done in all three areas (G. Abbott, Animal and Plant Health Service, written com-
mun., 2007), including some areas we considered untreated relative to diflubenzuron application for this study. Difluben-zuron was applied to the Grouse Creek treatment zone in May 2005. Grouse Creek is in the extreme northwestern part of the State. We sampled terrestrial sites in four vegetation associations (table 1) according to the Southwest Regional Gap analysis (Prior-Magee and others, 2007). Ibapah sites, near the Utah-Nevada border, were all in the same vegeta-tion association, although there was some variability on the ground in abundance of different vegetation components. The Vernon study area, south of Vernon, Utah, was more diverse, encompassing five vegetation communities.
GC U05
GC U01
GC U11
GC U06
GC T06
GC T04
GC T03
GC T05
RBTSTNFRSTRBNST
CLSP1 CMSP
LRSP
KGSP
CLSP2
Figure 2. Grouse Creek study area with treated zone shaded; terrestrial (red) and aquatic (blue) sampling sites are shown within treated and untreated zones.
Study Area 3

4 Mormon Cricket Control in Utah’s West Desert—Evaluation of Impacts of the Pesticide Diflubenzuron
Terrestrial Sampling
Study Sites
Terms for the different spatial scales of this study were defined as follows: study area is defined as one of the three major geographic areas studied [that is, Grouse Creek (GC), Ibapah (IB) or Vernon (VE)]; treatment zone refers to the area within a study area that was treated (T) or untreated (U) with diflubenzuron (that is, treated zone, untreated zone); site refers
to the individual locations sampled using pitfall traps within a treatment zone in a study area (for example, GC U06, IB T22, and VE U09). In 2005, Mormon cricket-control efforts were concentrated in the mountains east and west of Grouse Creek valley. We established four sites in the eastern Grouse Creek treatment zone; four untreated sites also were estab-lished to the west and south of this treated zone (fig. 5). At the other two study areas, Ibapah (fig. 6) and Vernon (fig. 7), we sampled both zones that had been treated with diflubenzuron in 2004 and adjacent untreated zones. Here we also estab-lished four pitfall sites in each of the treated and untreated zones. All pitfall sites were established at locations randomly
IB U08
IB U06IB U03
IB U09
IB T22
IB T21
IB T19 SDSTIB T13
IJCST JCST
ICST MCST
BCST
SOXSPNOXSPDCST
SKSP
Figure 3. Ibapah study area with treated zone shaded; terrestrial and aquatic sampling sites are shown within treated zone and untreated zones.

selected with a geographic information system. General site characteristics, site-code designations, and sampling dates are shown in table 1.
Sampling Design
Terrestrial arthropods were sampled by using pitfall traps arranged in a pattern that allowed capture data to be used with DISTANCE software (Buckland and others, 2001) to estimate density of total arthropods and of individual taxa (Lukacs and
others, 2004). Pitfall traps at each site were arranged to meet the assumptions of DISTANCE sampling, which are that all invertebrates on the center line are detected (that is, caught) and that distances from the center line are accurately measured. We used 60 traps at each site in the arrangement shown in figure 8. This pattern was generated by using WebSim (Lukacs, 2001, 2002) to simulate a hazard-rate model of invertebrate captures that resulted in estimates with small confidence intervals, and matched trapping results in a pilot study of invertebrate pitfall trapping in Colorado (Lukacs, oral commun., 2005).
VE T03
VE T01
VE T08
VE T06 VD6ST
RCST
VD3ST
VCST
VE U19 VE U08
VE U20 VE U09 CCST
PCST ULVST LVST
LFST
Terrestrial Sampling 5
Figure 4. Vernon study area with treated zone shaded; terrestrial and aquatic sampling sites shown within treated zone and untreated zones.

6 Mormon Cricket Control in Utah’s West Desert—Evaluation of Impacts of the Pesticide Diflubenzuron
Site code Treatment zone
Elevation, in meters
GAP vegetation classification Sample dates Sample period Number of days traps were open
Grouse Creek
GC U01 Untreated 1,549 Inter-Mountain Basin Mixed Salt Desert Scrub
6/3/2005 pre-treatment 2
6/20/2005 post-treatment 4
GC U05 Untreated 1,542 Invasive Perennial Grassland 6/3/2005 pre-treatment 2
6/22/2005 post-treatment 2
GC U06 Untreated 1,573 Inter-Mountain Basin Semi-Desert Grassland
6/6/2005 pre-treatment 3
6/21/2005 post-treatment 4
GC U11 Untreated 1,669 Inter-Mountain Basin Big Sagebrush Shrubland
5/27/2005 pre-treatment 2
6/22/2005 post-treatment 5
GC T03 Treated 1,705 Inter-Mountain Basin Big Sagebrush Shrubland
5/26/2005 pre-treatment 2
6/23/2005 post-treatment 2
GC T04 Treated 1,701 Inter-Mountain Basin Big Sagebrush Shrubland
5/27/2005 pre-treatment 3
6/21/2005 post-treatment 4
GC T05 Treated 1,665 Inter-Mountain Basin Big Sagebrush Shrubland
5/30/2005 pre-treatment 4
6/23/2005 post-treatment 2
GC T06 Treated 1,665 Inter-Mountain Basin Big Sagebrush Shrubland
5/26/2005 pre-treatment 2
6/20/2005 post-treatment 4
Ibapah
IB U03 Untreated 1,734 Inter-Mountain Basin Big Sagebrush Shrubland
7/14/2005 1 year post-treatment
3
IB U06 Untreated 1,707 Inter-Mountain Basin Big Sagebrush Shrubland
7/15/2005 1 year post-treatment
3
IB U08 Untreated 1,670 Inter-Mountain Basin Big Sagebrush Shrubland
7/14/2005 1 year post-treatment
3
IB U09 Untreated 1,747 Inter-Mountain Basin Big Sagebrush Shrubland
7/15/2005 1 year post-treatment
3
IB T13 Treated 1,756 Inter-Mountain Basin Big Sagebrush Shrubland
7/15/2005 1 year post-treatment
3
IB T19 Treated 1,769 Inter-Mountain Basin Big Sagebrush Shrubland
7/15/2005 1 year post-treatment
3
IB T21 Treated 1,784 Inter-Mountain Basin Big Sagebrush Shrubland
7/14/2005 1 year post-treatment
3
IB T22 Treated 1,826 Inter-Mountain Basin Big Sagebrush Shrubland
7/15/2005 1 year post-treatment
3
Table 1. Terrestrial site and sampling information, west desert study sites, Utah.

Site code Treatment zone
Elevation, in meters
GAP vegetation classification Sample dates Sample period Number of days traps were open
Vernon
VE U08 Untreated 2,082 Southern Rocky Mountain Montane-Subalpine Grassland
7/23/2005 1 year post-treatment
3
VE U09 Untreated 1,998 Great Basin Foothill and Lower Montane Riparian Woodland and Shrubland
7/22/2005 1 year post-treatment
3
VE U19 Untreated 1,879 Great Basin Piñon-Juniper Woodland 7/22/2005 1 year post-treatment
3
VE U20 Untreated 2,117 Inter-Mountain Basin Montane Sagebrush Steppe
7/22/2005 1 year post-treatment
3
VE T01 Treated 1,829 Great Basin Piñon-Juniper Woodland 7/21/2005 1 year post-treatment
3
VE T03 Treated 1,771 Inter-Mountain Basin Big Sagebrush Shrubland
7/23/2005 1 year post-treatment
3
VE T06 Treated 1,801 Inter-Mountain Basin Big Sagebrush Shrubland
7/22/2005 1 year post-treatment
3
VE T08 Treated 1,829 Great Basin Piñon-Juniper Woodland 7/21/2005 1 year post-treatment
3
Table 1. Terrestrial site and sampling information, west desert study sites, Utah—Continued.
Figure 5. Typical terrestrial site at Grouse Creek study site, Utah, showing pitfall traps (U.S. Geological Survey photograph by Tim Graham).
Terrestrial Sampling 7
8 Mormon Cricket Control in Utah’s West Desert—Evaluation of Impacts of the Pesticide Diflubenzuron
Sample Collection and Processing
Pitfall traps were placed by carefully measuring and marking correct locations with flags, then digging in the traps (fig. 9). Pitfall traps were constructed as described by New (1998). For each trap, a 1.5-L plastic jar was buried below ground level and a 500-mL cup containing 125 mL of soapy water was placed in the jar. A 15-cm-diam funnel was placed over the jar, centered over the cup, with the top of the funnel at ground level.
At Grouse Creek, we sampled in late May/early June, just prior to application of diflubenzuron in both the zone to be treated and in the zone to remain untreated (pre-treatment samples). Traps at all sites in both treated and untreated zones were opened again in late June, about 3 weeks after difluben-zuron application (post-treatment samples). By comparing treated and untreated zones before and after treatment, differ-ences between pre- and post-treatment communities associated with the phenology of the arthropods can be separated from those changes that may be due to exposure to diflubenzuron.
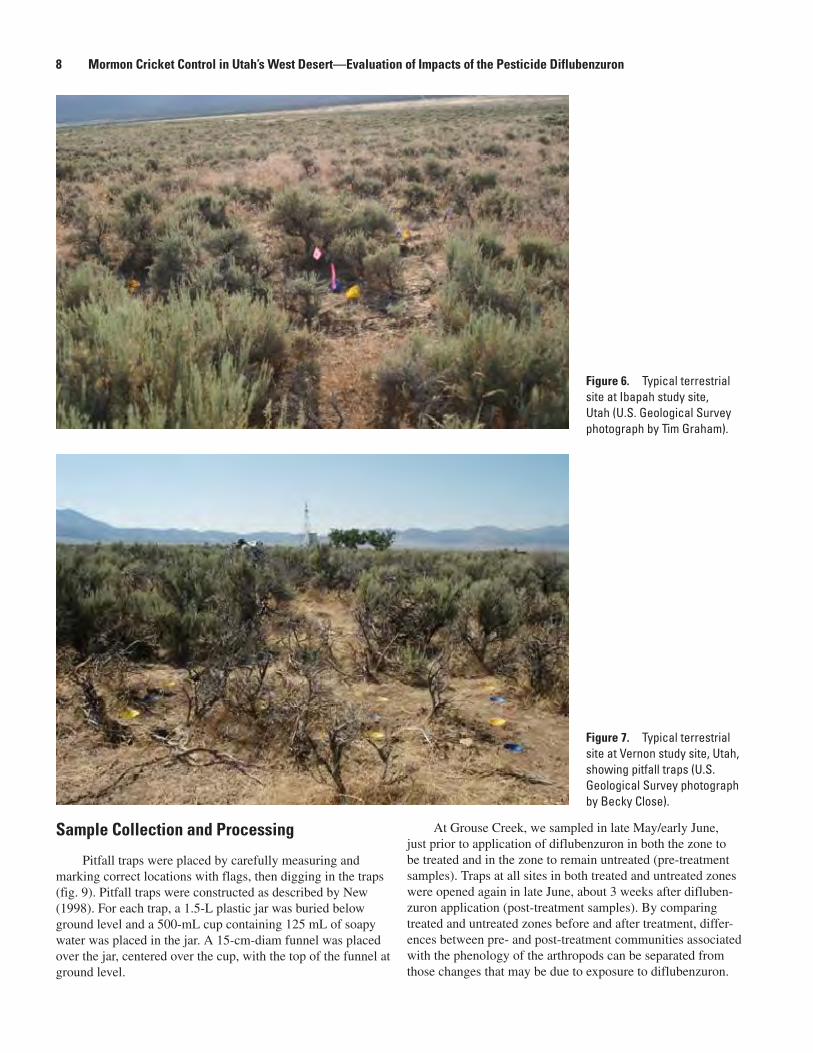
Figure 6. Typical terrestrial site at Ibapah study site, Utah (U.S. Geological Survey photograph by Tim Graham).
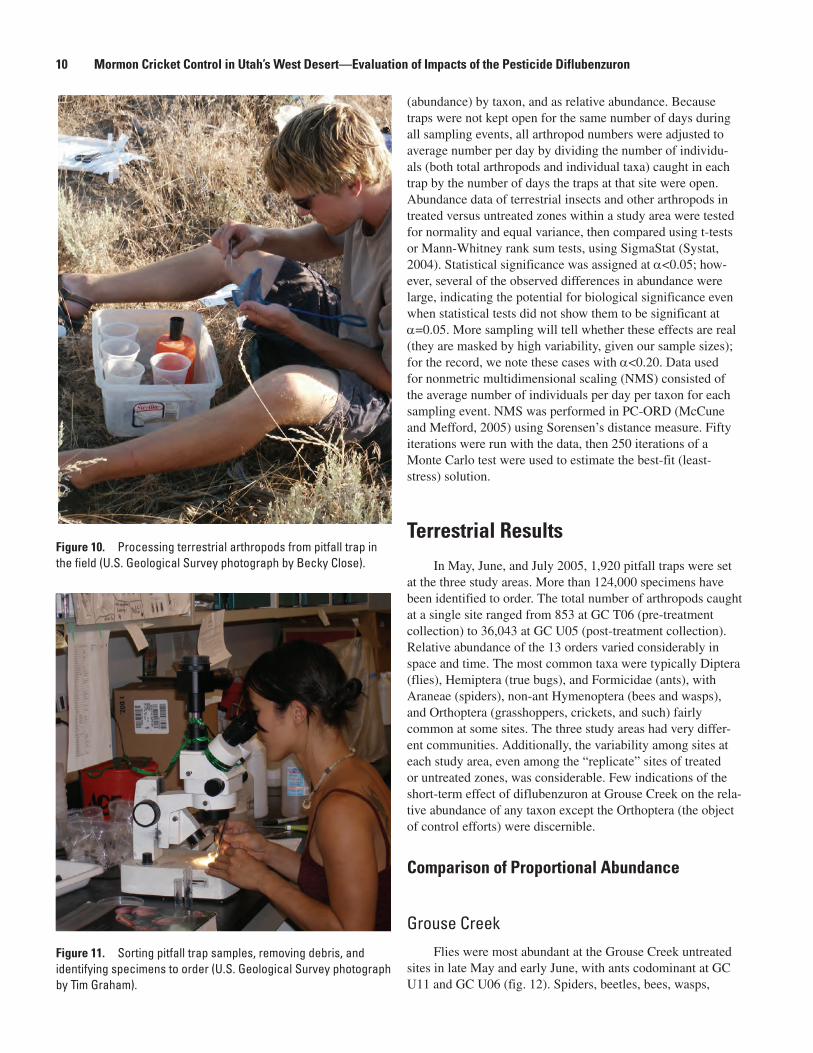
Figure 7. Typical terrestrial site at Vernon study site, Utah, showing pitfall traps (U.S. Geological Survey photograph by Becky Close).

Distance along transect (m)
-0.5 0.0
0.5
1.0
1.5
2.0
2.5
3.0
3.5
4.0
4.5
5.0
5.5
6.0
6.5
7.0
7.5
8.0
8.5
9.0
9.5
10.0
10.5
-0.5 0.0
0.5
1.0
1.5
2.0
2.5
3.0
3.5
4.0
4.5
5.0
5.5
6.0
6.5
7.0
7.5
8.0
8.5
9.0
9.5
10.0
10.5
Dist
ance
from
tran
sect
(m)
-10.0-9.5-9.0-8.5-8.0-7.5-7.0-6.5-6.0-5.5-5.0-4.5-4.0-3.5-3.0-2.5-2.0-1.5-1.0-0.50.00.51.01.52.02.53.03.54.04.55.05.56.06.57.07.58.08.59.09.5
10.0
-10.0-9.5-9.0-8.5-8.0-7.5-7.0-6.5-6.0-5.5-5.0-4.5-4.0-3.5-3.0-2.5-2.0-1.5-1.0-0.50.00.51.01.52.02.53.03.54.04.55.05.56.06.57.07.58.08.59.09.510.0
Figure 8. Arrangement of pitfall traps at each terrestrial arthropod sampling site of the study.
Figure 9. Putting in pitfall traps (U.S. Geological Survey photograph by Tim Graham).
Ibapah and Vernon sampling occurred in July 2005, roughly a year following treatment of the treated zones; there was no temporal component to the study in these two areas.
Traps were kept open from 2 to 5 days (table 1); the time period eventually was standardized at 3 days, but different timeframes were used in early sampling periods due to logisti-cal constraints.
Each trap’s contents were washed in the field through a 0.5-mm mesh net three times; everything remaining in the net was placed in a 35-mL vial containing about 25 mL isopropyl alcohol (fig. 10). A paper label with site, date, and trap number was placed inside each vial, and a stick-on label with the same information was affixed to the outside of each vial. Vials were kept in the shade in the field, as cool as possible, and stored at room temperature once they were returned to the lab.
Sample Sorting and Identification
All terrestrial invertebrates were sorted to order. Speci-mens in the orders Hemiptera and Orthoptera were identified to family; ants (Formicidae) were identified to genus (fig. 11). Taxa were identified following Triplehorn and Johnson (2005), and we followed the taxonomic nomenclature of this source (that is, the order Hemiptera includes Heteroptera and the Homoptera; Thysanura has been split into Microcoryphia and Thysanura). Differences in abundance, or presence/absence of particular taxa that correlated with treatment patterns, were used to identify potential indicator species.
Data Analysis
To allow comparisons among individual sites, treatment-zones, and study-areas, data are reported as numbers per day
Terrestrial Sampling 9
10 Mormon Cricket Control in Utah’s West Desert—Evaluation of Impacts of the Pesticide Diflubenzuron
(abundance) by taxon, and as relative abundance. Because traps were not kept open for the same number of days during all sampling events, all arthropod numbers were adjusted to average number per day by dividing the number of individu-als (both total arthropods and individual taxa) caught in each trap by the number of days the traps at that site were open. Abundance data of terrestrial insects and other arthropods in treated versus untreated zones within a study area were tested for normality and equal variance, then compared using t-tests or Mann-Whitney rank sum tests, using SigmaStat (Systat, 2004). Statistical significance was assigned at α<0.05; how-ever, several of the observed differences in abundance were large, indicating the potential for biological significance even when statistical tests did not show them to be significant at α=0.05. More sampling will tell whether these effects are real (they are masked by high variability, given our sample sizes); for the record, we note these cases with α<0.20. Data used for nonmetric multidimensional scaling (NMS) consisted of the average number of individuals per day per taxon for each sampling event. NMS was performed in PC-ORD (McCune and Mefford, 2005) using Sorensen’s distance measure. Fifty iterations were run with the data, then 250 iterations of a Monte Carlo test were used to estimate the best-fit (least-stress) solution.
Terrestrial ResultsIn May, June, and July 2005, 1,920 pitfall traps were set
at the three study areas. More than 124,000 specimens have been identified to order. The total number of arthropods caught at a single site ranged from 853 at GC T06 (pre-treatment collection) to 36,043 at GC U05 (post-treatment collection). Relative abundance of the 13 orders varied considerably in space and time. The most common taxa were typically Diptera (flies), Hemiptera (true bugs), and Formicidae (ants), with Araneae (spiders), non-ant Hymenoptera (bees and wasps), and Orthoptera (grasshoppers, crickets, and such) fairly common at some sites. The three study areas had very differ-ent communities. Additionally, the variability among sites at each study area, even among the “replicate” sites of treated or untreated zones, was considerable. Few indications of the short-term effect of diflubenzuron at Grouse Creek on the rela-tive abundance of any taxon except the Orthoptera (the object of control efforts) were discernible.
Comparison of Proportional Abundance
Grouse Creek
Flies were most abundant at the Grouse Creek untreated sites in late May and early June, with ants codominant at GC U11 and GC U06 (fig. 12). Spiders, beetles, bees, wasps,
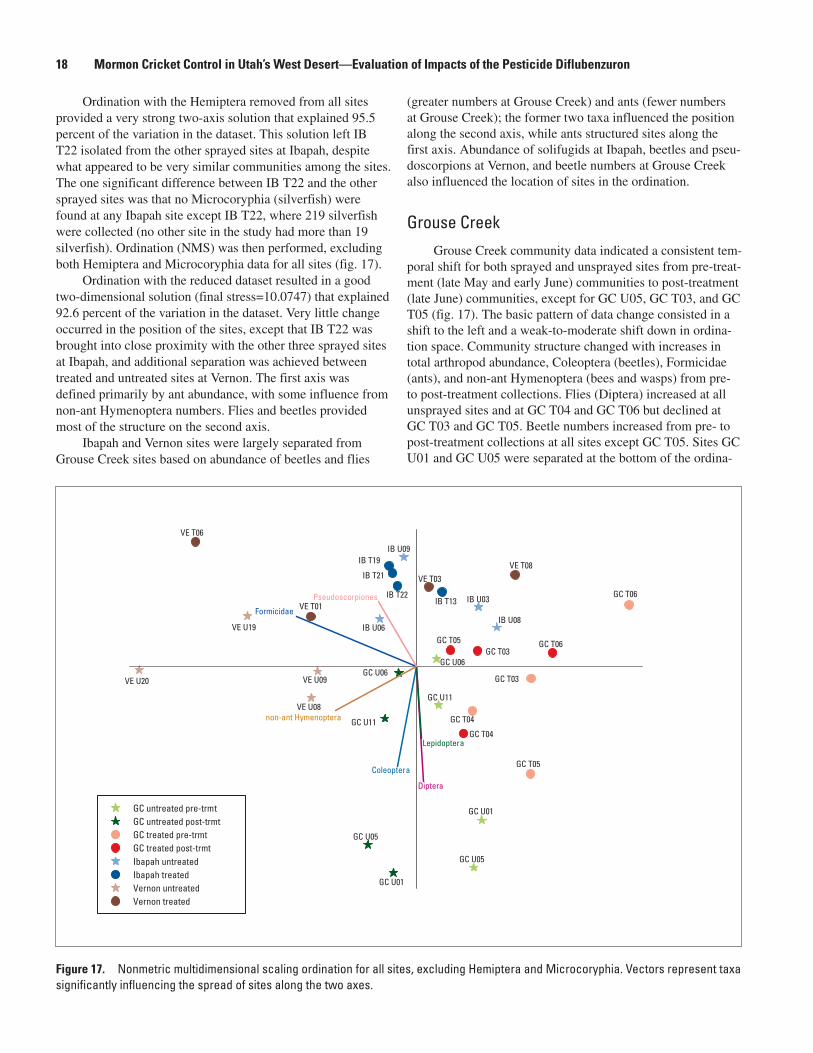
Figure 10. Processing terrestrial arthropods from pitfall trap in the field (U.S. Geological Survey photograph by Becky Close).
Figure 11. Sorting pitfall trap samples, removing debris, and identifying specimens to order (U.S. Geological Survey photograph by Tim Graham).

Hemiptera, and Lepidoptera also were common at one or more sites. By late June, communities at all sites had changed dramatically. At three sites, Hemiptera were by far the most abundant taxon. Ants and flies were still common at most sites but proportionately less abundant given the increase in numbers of Hemiptera. Spiders and Orthoptera increased at GC U11.
Hemiptera, Diptera, and ants were the most abundant groups at treated sites of Grouse Creek prior to treatment. The three groups accounted for more than 70 percent of all the arthropods caught at the four sites (fig. 13). GC T04 had the lowest proportion of Hemiptera, the highest proportion of ants, and larger numbers of beetles and Orthoptera than
at the other sprayed sites prior to treatment. GC T04 had the most Mormon crickets during sampling in late May and early June.
After treatment, Hemiptera were much more abundant at the treated sites, showing a pattern similar to that of untreated sites. Ants and flies accounted for most of the other captures. Numbers of Orthoptera declined following treatment, as expected, showing the largest decline at GC T04. Most dif-ferences between pre- and post-treatment communities at the treated sites were similar to the changes observed among the untreated sites, indicating that the differences were likely due to seasonal changes, not treatment effects.
A
B
GC U01 pre GC U05 pre
GC U06 pre GC U11 pre
AraneaeColeopteraDipteraHemipteraFormicidaenon-ant HymenopteraLepidopteraNeuropteraOrthopteraPseudoscorpionesScorpionesSolifugaeThysanura
GC U01 post
AraneaeColeopteraDipteraHemipteraFormicidaenon-ant HymenopteraLepidopteraNeuropteraOrthopteraPseudoscorpionesScorpionesSolifugaeThysanura
GC U05 post
GC U11 postGC U06 post
Figure 12. Proportional representation of taxa at the four sites in the Grouse Creek untreated zone. A, Pretreatment communities in late May or early June. B, Post-treatment communities in late June.
Terrestrial Results 11

12 Mormon Cricket Control in Utah’s West Desert—Evaluation of Impacts of the Pesticide Diflubenzuron
IbapahIbapah sites were sampled only once, in mid-July 2005
(table 1). All communities had large Hemipteran components (fig. 14). Two sites, one treated (IB T13, 68 percent) and one untreated (IB U08, 92 percent), were heavily dominated by Hemiptera. Ants and flies also were abundant at all Ibapah sites; spiders were more prevalent than flies in traps at IB T19 and IB T22 (both treated in 2004). Flies were less common at Ibapah than at Grouse Creek, both in treated and untreated sites. Ants dominated all sites if Hemiptera were excluded from the dataset, constituting more than half the individuals at each site. Spider abundance also became more apparent if Hemiptera were excluded.
VernonVernon was sampled only once in July 2005. At three
of four untreated sites and three of four treated sites, about 25−40 percent of all the arthropods caught were Hemiptera; fewer than 15 percent of the arthropods caught at the other two sites (VE U20 and VE T01) were Hemiptera (fig. 15). Compared to Ibapah and Grouse Creek, Hemiptera and flies at Vernon were proportionately less abundant, and the Hymenoptera were relatively more abundant. Specifi-cally, ants and the combined bee and wasp fractions of the Hymenoptera were better represented at Vernon. The non-ant Hymenoptera were more abundant at the untreated sites than
Figure 13. Proportional representation of taxa at the four sites in the Grouse Creek treated zone. A, pretreatment communities in late May and early June. B, Post-treatment communities in late June.
A
B
GC T03 pre
AraneaeColeopteraDipteraHemipteraFormicidaenon-ant HymenopteraLepidopteraNeuropteraOrthopteraPseudoscorpionesScorpionesSolifugaeThysanura
GC T04 pre
GC T06 preGC T05 pre
GC T03 post
AraneaeColeopteraDipteraHemipteraFormicidaenon-ant HymenopteraLepidopteraNeuropteraOrthopteraPseudoscorpionesScorpionesSolifugaeThysanura
GC T04 post
GC T06 postGC T05 post

at the treated sites, although there was no statistical differ-ence in proportional abundance.
Comparisons of Abundance by Orders in Treated and Untreated Zones
Average abundance (numbers per day) for each taxon was calculated for the four sites within a treatment zone in each study area (fig. 16). A t test was used if the data passed nor-mality and equal variance tests; the test statistic is represented as a t. If data failed normality or equal variance tests, compari-
sons were made with the Mann-Whitney rank sum test; the test statistic is represented as T.
Within each study area, abundance for each taxon in the treated zone was compared to abundance in the untreated zone. Data from different study areas were not compared to each other. At Grouse Creek, we also tested whether changes in arthropod abundance following application of difluben-zuron were related to the insecticide, or merely to phenology (seasonal changes in species composition) of the arthropod community. This test was conducted in two ways; the first approach was to compare average abundance before and after treatment within each treatment zone (for example, GC U pre-
Figure 14. Proportional representation of taxa at the eight Ibapah sites. Communities in the untreated (A) and treated (B) zones.
Terrestrial Results 13
A
B
IB U03
AraneaeColeopteraDipteraHemipteraFormicidaenon-ant HymenopteraLepidopteraNeuropteraaOrthopteraPseudoscorpionesScorpionesSolifugaeThysanura
IB U06
IB U09IB U08
IB T13
AraneaeColeopteraDipteraHemipteraFormicidaenon-ant HymenopteraLepidopteraNeuropteraOrthopteraPseudoscorpionesScorpionesSolifugaeThysanura
IB T19
IB T22IB T 21

14 Mormon Cricket Control in Utah’s West Desert—Evaluation of Impacts of the Pesticide Diflubenzuron
treatment compared to GC U post-treatment, and GC T pre-treatment compared to GC T post-treatment). Significant dif-ferences for a given taxon in pre- and post-treatment numbers in the treated zone were interpreted as indicating a possible effect of diflubenzuron application. The second approach was to compare taxon abundance in the sprayed and unsprayed zones prior to treatment and again with the data collected 3 weeks after treatment. If there were no differences prior to treatment but treated and untreated average taxon abundance differed follow-ing treatment, we assumed diflubenzuron affected that taxon.
Grouse Creek
Pre- versus Post-Treatment Changes in Untreated ZoneMost taxa exhibited an increase in abundance from pre-
to post-treatment sampling in the unsprayed zone at Grouse Creek (fig. 16 A–L). Spiders (T
d.f. 6=10; P=0.029), non-ant
Hymenoptera (Td.f. 6
=10; P=0.029), and total arthropods (T
d.f. 6=10; P=0.029) were significantly more abundant in
A
B
VE U08
AraneaeColeopteraDipter aHemipteraFormicidaenon-ant HymenopteraLepidopteraNeuropteraOrthopteraPseudoscorpionesScorpionesSolifugaeThysanura
VE U09
VE U20VE U19
VE T01
AraneaeColeopteraDipteraHemipteraFormicidaenon-ant HymenopteraLepidopteraNeuropteraOrthopteraPseudoscorpionesScorpionesSolifugaeThysanura
VE T03
VE T08VE T06
Figure 15. Proportional representation of taxa at the eight Vernon sites. Communities in the untreated (A) and treated (B) zones.

A
B
C
D
E
FHemiptera
Treatment zonesGC U pr
e
GC U po
st
GC T pre
GC T post
IB U IB
TVE U
VE T
Num
ber o
f ind
ivid
uals
0
5,000
10,000
15,000
20,000
25,000
30,000Grouse Creek untreated pre-treatmentGrouse Creek untreated post-treatmentGrouse Creek treated pre-treatmentGrouse Creek treated post-treatmentIbapah untreatedIbapah treatedVernon untreatedVernon treated
Beetles
Treatment zonesGC U pr
e
GC U po
st
GC T pre
GC T post
IB U IB
TVE U
VE T
Num
ber o
f ind
ivid
uals
0
20
40
60
80
100
120
140
160
180Grouse Creek untreated pre-treatmentGrouse Creek untreated post-treatmentGrouse Creek treated pre-treatmentGrouse Creek treated post-treatmentIbapah untreatedIbapah treatedVernon untreatedVernon treated
Ants
Treatment zonesGC U pr
e
GC U po
st
GC T pre
GC T post
IB U IB
TVE U
VE T
Num
ber o
f ind
ivid
uals
0
200
400
600
Grouse Creek untreated pre-treatmentGrouse Creek untreated post-treatmentGrouse Creek treated pre-treatmentGrouse Creek treated post-treatmentIbapah untreatedIbapah treatedVernon untreatedVernon treated
Flies
Treatment zonesGC U pr
e
GC U po
st
GC T pre
GC T post
IB U IB
TVE U
VE T
Num
ber o
f ind
ivid
uals
0
100
200
300
Grouse Creek untreated pre-treatmentGrouse Creek untreated post-treatmentGrouse Creek treated pre-treatmentGrouse Creek treated post-treatmentIbapah untreatedIbapah treatedVernon untreatedVernon treated
Non-ant Hymenoptera
Treatment zonesGC U pr
e
GC U po
st
GC T pre
GC T post
IB U IB
TVE U
VE T
Num
ber o
f ind
ivid
uals
0
50
100
150
200Grouse Creek untreated pre-treatmentGrouse Creek untreated post-treatmentGrouse Creek treated pre-treatmentGrouse Creek treated post-treatmentIbapah untreatedIbapah treatedVernon untreatedVernon treated
Lepidoptera
Treatment zonesGC U pr
e
GC U po
st
GC T pre
GC T post
IB U IB
TVE U
VE T
Num
ber o
f ind
ivid
uals
0
5
10
15
20
25
30Grouse Creek untreated pre-treatmentGrouse Creek untreated post-treatmentGrouse Creek treated pre-treatmentGrouse Creek treated post-treatmentIbapah untreatedIbapah treatedVernon untreatedVernon treated
Figure 16 A–L. Average number of individuals (by taxon) in untreated (GC U pre- and post-treated, IB U, VE U) and treated (GC T pre- and post-treated, IB T, VE T) zones at the three study areas.
Terrestrial Results 15

16 Mormon Cricket Control in Utah’s West Desert—Evaluation of Impacts of the Pesticide Diflubenzuron
G
H
I
J
K
L
Neuroptera
Treatment zonesGC U pr
e
GC U po
st
GC T pre
GC T post
IB U IB
TVE U
VE T
Num
ber o
f ind
ivid
uals
0
1
2
3
Neuroptera: 1.1670 Grouse Creek untreated post-treatmentGrouse Creek treated pre-treatmentGrouse Creek treated post-treatmentIbapah untreatedIbapah treatedVernon untreatedVernon treated
Pseudoscorpions
Treatment zonesGC U pr
e
GC U po
st
GC T pre
GC T post
IB U IB
TVE U
VE T
Num
ber o
f ind
ivid
uals
0.0
0.2
0.4
0.6
0.8
1.0
1.2Grouse Creek untreated pre-treatmentGrouse Creek untreated post-treatmentGrouse Creek treated pre-treatmentGrouse Creek treated post-treatmentIbapah untreatedIbapah treatedVernon untreatedVernon treated
Orthoptera
Treatment zonesGC U pr
e
GC U po
st
GC T pre
GC T post
IB U IB
TVE U
VE T
Num
ber o
f ind
ivid
uals
0
20
40
60
Grouse Creek untreated pre-treatmentGrouse Creek untreated post-treatmentGrouse Creek treated pre-treatmentGrouse Creek treated post-treatmentIbapah untreatedIbapah treatedVernon untreatedVernon treated
Scorpions
Treatment zonesGC U pr
e
GC U po
st
GC T pre
GC T post
IB U IB
TVE U
VE T
Num
ber o
f ind
ivid
uals
0
1
2
3
4
5
6Grouse Creek untreated pre-treatmentGrouse Creek untreated post-treatmentGrouse Creek treated pre-treatmentGrouse Creek treated post-treatmentIbapah untreatedIbapah treatedVernon untreatedVernon treated
Spiders
Treatment zonesGC U pr
e
GC U po
st
GC T pre
GC T post
IB U IB
TVE U
VE T
Num
ber o
f ind
ivid
uals
0
20
40
60
80Grouse Creek untreated pre-treatmentGrouse Creek untreated post-treatmentGrouse Creek treated pre-treatmentGrouse Creek treated post-treatmentIbapah untreatedIbapah treatedVernon untreatedVernon treatedPlot 2
Wind scorpions
Treatment zonesGC U pr
e
GC U po
st
GC T pre
GC T post
IB U IB
TVE U
VE T
Num
ber o
f ind
ivid
uals
0
1
2
3
4
5Grouse Creek untreated pre-treatmentGrouse Creek untreated post-treatmentGrouse Creek treated pre-treatmentGrouse Creek treated post-treatmentIbapah untreatedIbapah treatedVernon untreatedVernon treated
Figure 16 A–L. Average number of individuals (by taxon) in untreated (GC U pre- and post-treated, IB U, VE U) and treated (GC T pre- and post-treated, IB T, VE T) zones at the three study areas—Continued.

the post-treatment collections at unsprayed sites. Coleoptera (t
d.f. 6=−2.053; P=0.086), Hemiptera (T
d.f. 6=12; P=0.114),
and Scorpiones (td.f. 6
=−1.926; P=0.102) also showed large increases in average abundance from pre- to post-treatment collections but the differences were not statistically significant.
Pre- versus Post-Treatment Changes in Treated ZoneNo significant differences in pre- and post-treatment
numbers occurred within the sprayed zone, although Hemiptera (t
d.f. 6=−1.992; P=0.093), non-ant Hymenoptera
(td.f. 6
=−1.482; P=0.189), Orthoptera (td.f. 6
=2.419; P=0.052) and Scorpiones (T
d.f. 6=12.5; P=0.114) all had average abundance
differences that were almost significant statistically. Total arthropods did not differ in the sprayed zone. Only Orthoptera showed a decrease from pre- to post-treatment numbers in the sprayed zone, indicating that diflubenzuron did accomplish the management goal of decreasing Orthoptera numbers in the sprayed zone.
Pre-Treatment Changes in Untreated versus Treated Zones
Most taxa did not differ between unsprayed and sprayed zones prior to application of diflubenzuron. There were statistically significant differences in average abundance for the Hemiptera (t
d.f. 6=−2.726; P=0.034), non-ant Hymenoptera
(Td.f. 6
=24.5; P=0.035), and Orthoptera (td.f. 6
=−2.455; P=0.049). Lepidoptera numbers (T
d.f. 6=23.5; P=0.114) also differed
between zones but not to the point of being statistically significant. Hemiptera and Orthoptera were more abundant in the sprayed zone prior to treatment; non-ant Hymenoptera and Lepidoptera were more numerous in the unsprayed zone at the same time.
Post-Treatment Changes in Untreated versus Treated Zones
Post-treatment comparisons of unsprayed and sprayed zones showed that spiders (t
d.f. 6=4.042; P=0.007) and non-ant
Hymenoptera (Td.f. 6
=26; P=0.029) were significantly more abundant in the unsprayed zone following application of diflubenzuron. Average numbers of Lepidoptera (t
d.f. 6=2.425;
P=0.052), Scorpiones (td.f. 6
=2.077; P=0.083), and total arthropods (T
d.f. 6=25; P=0.057) also differed markedly in the
sprayed and unsprayed zones but not to the point of statistical significance. In all cases, post-treatment numbers were greater in the unsprayed zone. The Lepidoptera decreased somewhat from pre-treatment levels in the unsprayed zone and increased slightly during the same timeframe in the sprayed zone, but Lepidoptera still were more abundant in the unsprayed zone. This post-treatment difference is likely the result of inherent differences in the Lepidoptera communities of the two zones.
IbapahNumbers of Orthoptera (t
d.f. 6=2.569; P=0.042) and
Scorpiones (Td.f. 6
=25; P=0.029) were significantly lower in the sprayed zone at Ibapah compared to the unsprayed zone. Differences in average abundance that were almost signifi-cant were recorded for other taxa, including Coleoptera (t
d.f. 6=1.880; P=0.109), Diptera (t
d.f. 6=1.701; P=0.140), non-ant
Hymenoptera (t=−2.432; P=0.051), and Lepidoptera (t
d.f. 6=0.801; P=0.122). For all taxa showing large differences,
more individuals were caught at the unsprayed sites than at sprayed sites.
VernonVernon data from this study provided the strongest indica-
tion of diflubenzuron effects on nontarget arthropods. Beetles (T
d.f. 6=26; P=0.029), flies (t
d.f. 6=3.274; P=0.017), Hemiptera
(td.f. 6
=2.458; P=0.049), non-ant Hymenoptera (td.f. 6
=2.790; P=0.032), and total arthropods (t
d.f. 6=2.650; P=0.038) were
all significantly more abundant in the unsprayed zone than in the sprayed zone. Lepidoptera (t
d.f. 6=2.380; P=0.055) and
Orthoptera (td.f. 6
=1.485; P=0.188) also had greater average num-bers in the unsprayed zone than in the sprayed sone, although the differences were not quite significant.
Terrestrial Community Structure
Multivariate analysis (NMS) showed no useful ordination solution using either raw data (average numbers caught per day), or log-transformed data. There was no apparent structure in the data; most of the sites were in a single, large cluster with a few (primarily those with very high or very low numbers of Hemiptera) separated individually from the main grouping. Final stress values for the dataset did not differ from analysis with randomized data, indicating that community structure was weak (McCune and Grace, 2002). This result may have been due to the influence of particular taxa (for example, Hemiptera) at individual sites. Examination of the data indi-cated that GC U05 post-treatment and IB U08 were outliers in the raw-numbers dataset, and VE U08 and VE T01 were outliers after the data were transformed, based on the PC-ORD outlier test (McCune and Grace, 2002). GC U05 post-treat-ment and IB U08 were heavily dominated by Hemiptera, with more than 90 percent of all specimens in this order (figs. 12B and 14A). It is not clear why VE U08 was identified as an outlier because no group seemed particularly over- or under-represented. VE T01 had fewer Hemiptera than any other site, with the exception of the GC U11 pre-treatment collection, and was dominated by ants but not by a higher proportion than at other sites. Removing these outliers did not improve ordina-tion results using either raw numbers or transformed data.
Terrestrial Results 17
18 Mormon Cricket Control in Utah’s West Desert—Evaluation of Impacts of the Pesticide Diflubenzuron
Ordination with the Hemiptera removed from all sites provided a very strong two-axis solution that explained 95.5 percent of the variation in the dataset. This solution left IB T22 isolated from the other sprayed sites at Ibapah, despite what appeared to be very similar communities among the sites. The one significant difference between IB T22 and the other sprayed sites was that no Microcoryphia (silverfish) were found at any Ibapah site except IB T22, where 219 silverfish were collected (no other site in the study had more than 19 silverfish). Ordination (NMS) was then performed, excluding both Hemiptera and Microcoryphia data for all sites (fig. 17).
Ordination with the reduced dataset resulted in a good two-dimensional solution (final stress=10.0747) that explained 92.6 percent of the variation in the dataset. Very little change occurred in the position of the sites, except that IB T22 was brought into close proximity with the other three sprayed sites at Ibapah, and additional separation was achieved between treated and untreated sites at Vernon. The first axis was defined primarily by ant abundance, with some influence from non-ant Hymenoptera numbers. Flies and beetles provided most of the structure on the second axis.
Ibapah and Vernon sites were largely separated from Grouse Creek sites based on abundance of beetles and flies
(greater numbers at Grouse Creek) and ants (fewer numbers at Grouse Creek); the former two taxa influenced the position along the second axis, while ants structured sites along the first axis. Abundance of solifugids at Ibapah, beetles and pseu-doscorpions at Vernon, and beetle numbers at Grouse Creek also influenced the location of sites in the ordination.
Grouse CreekGrouse Creek community data indicated a consistent tem-
poral shift for both sprayed and unsprayed sites from pre-treat-ment (late May and early June) communities to post-treatment (late June) communities, except for GC U05, GC T03, and GC T05 (fig. 17). The basic pattern of data change consisted in a shift to the left and a weak-to-moderate shift down in ordina-tion space. Community structure changed with increases in total arthropod abundance, Coleoptera (beetles), Formicidae (ants), and non-ant Hymenoptera (bees and wasps) from pre- to post-treatment collections. Flies (Diptera) increased at all unsprayed sites and at GC T04 and GC T06 but declined at GC T03 and GC T05. Beetle numbers increased from pre- to post-treatment collections at all sites except GC T05. Sites GC U01 and GC U05 were separated at the bottom of the ordina-
GC untreated pre-trmtGC untreated post-trmtGC treated pre-trmtGC treated post-trmtIbapah untreatedIbapah treatedVernon untreatedVernon treated
VE U20
VE U19
VE U08
VE U09
VE T08
VE T01
VE T03
VE T06
IB U03
IB U08IB U06
IB T22
IB T21
IB T13
IB T19
GC T03
GC T05
GC U11
GC U06
GC U01
GC U05
GC T04
GC T06
GC U05
GC U01
GC U06
GC T04
GC T06
GC T05
GC U11
GC T03
Diptera
Lepidoptera
Coleoptera
Formicidae
IB U09
non-ant Hymenoptera
Pseudoscorpiones
Figure 17. Nonmetric multidimensional scaling ordination for all sites, excluding Hemiptera and Microcoryphia. Vectors represent taxa significantly influencing the spread of sites along the two axes.

tion space and changed primarily along the first axis from pre- to post-treatment collections; these two sites had more beetles than any other site, especially in pre-treatment collections.
The magnitude of increase in abundance differed between sprayed and unsprayed sites, with many more arthropods being caught at unsprayed sites after treatment than at sprayed sites (appendix A1a and A1b). The variation among sites, even within a treatment zone or collection period, kept many of these differences from being statistically significant, but the trend is evident when all 16 sampling events are examined (appendix A1a and A1b). Additional work is needed to deter-mine whether application of diflubenzuron reduces arthropod abundance, or whether observed differences are related to inherent site differences.
Ibapah
Community structure of Ibapah sites was based primarily upon ant abundance. Without Hemiptera (true bugs and leafhop-pers) and Microcoryphia (silverfish), the four sprayed sites at Ibapah formed a tight cluster along the second axis, along with IB U09; these five Ibapah sites had similar numbers of ants. The IB U09 ant community resembled communities at the sprayed sites as well, though genus-level data were not included in the dataset used in this ordination. Similarities between IB U09 and the sprayed sites at Ibapah underscore the influence of inherent site properties in structuring arthropod communities. Two of the unsprayed sites (IB U03 and IB U08) were shifted to the right relative to the sprayed sites; these two sites had fewer ants than any other Ibapah site. IB U06, the fourth unsprayed site, had ant numbers similar to the sprayed sites but had more flies, separat-ing it from the sprayed cluster along the second axis. There was little variation along the second axis among the eight Ibapah sites, but what differences did occur were due essentially to dif-ferences in abundance of Diptera at each site.
Vernon
As was the case at Ibapah, ant abundance structured the Vernon sites, with more ants at the unsprayed sites than at most of the sprayed sites. Proximity in the multivariate plot to other sites from any study area appeared to be dictated by similar ant numbers. The sprayed sites were scattered across ordination space on the first axis but within a narrow belt on the second axis; large variation in ant abundance at sprayed sites (418 to 2,306 total ants) caused this spread on the first axis. The range of ants collected at unsprayed sites overlapped sprayed sites (870 to 2,826 ants), but the trend was for more ants at unsprayed sites, which accounts for their shift to the left along the first axis (fig. 17). Unsprayed sites also had more beetles and flies than did sprayed sites, and a greater varia-tion in these taxa. The increased numbers of beetles and flies and their greater variation in taxa is reflected in the spread in unsprayed site locations along the second axis and in the small variation in second axis ordination scores for the sprayed sites,
which showed less variation in numbers of flies or beetles (appendix A1d).
Range in ordination space was greater for Vernon sites than for Ibapah or Grouse Creek sites, due at least in part to the greater spatial and elevational spread among the sites of the Vernon study area. For example, VE T06 was isolated from all other sites on the ground, being farther west, and was identified as an outlier by using the PC-ORD outlier analysis routine. VE T06 had more beetles and ants, but fewer flies, than the other treated sites. The other outlier identified (of all 32 communities included in the analysis) was VE U20, which was higher in elevation and slightly farther south than the other unsprayed Vernon sites (fig. 4, table 1). More ants were collected at VE U20 than at any other site in the study (2,826 ants); flies also were more abundant, and spiders were less common than at other unsprayed sites. Although data on Hemiptera were not included in the ordination analysis, these two sites also differed from the other Vernon sites in numbers of Hemiptera; VE T06 had more Hemiptera than any other sprayed site, and VE U20 had only about half as many Hemiptera as the other unsprayed sites.
Formicidae
Eighteen genera of ants were collected across the three study areas (table 2). Untreated sites at Grouse Creek had 15 genera; 16 genera were found at sites in the treated zone. Ibapah untreated sites had 11 genera; 14 genera were found at sites in the treated zone. This trend was reversed at Vernon, where 13 genera were found at sites in the untreated zone, and 10 genera were found at sites in the treated zone. Vernon ant communities were slightly less genera rich, but ants were more abundant at Vernon (10,711 ants total) than at the other two study areas. At the eight Ibapah sites, 4,968 ants were col-lected. Grouse Creek unsprayed sites accounted for 3,622 ants from both collection periods, while 2,887 ants were collected from sprayed sites during the two sampling periods.
Grouse Creek
Ant communities differed in composition among sam-pling events and sites in the treated and untreated zones at Grouse Creek (fig. 18). Differences appeared to be due to ant phenology and intrinsic site differences, not the application of diflubenzuron. Formica were particularly abundant at Grouse Creek, except at GC T03 and GC T05. These two sites were the rockiest sites; GC T03 was on a hillside, GC T05 was at the nose of a small ridge. There were more Pogonomyrmex at untreated sites and more Pheidole at treated sites, but these differences, which existed prior to treatment, were not related to the insecticide. Seed-harvester numbers increased at nearly every Grouse Creek site from pre- to post-treatment collections. Forelius was found only at GC U11 and GC T03; Forelius increased at GC U11 from late May to late June but declined over the same period at GC T03.
Terrestrial Results 19

20 Mormon Cricket Control in Utah’s West Desert—Evaluation of Impacts of the Pesticide Diflubenzuron
Ant genera Functional group
Grouse Creek
untreated pre-treat-ment zone
Grouse Creek
untreated post-treat-ment zone
Grouse Creek
treated pre-treat-ment zone
Grouse Creek
treated post-treat-ment zone
Ibapah untreated
zone
Ibapah treated
zone
Vernon untreated
zone
Vernon treated
zone
Aphaenogaster G X X X X X X X
Camponotus G X X X X X X X X
Cardiocondyla P X X
Crematogaster G X X X
Forelius HT X X X X X X X X
Formica HT X X X X X X X X
Lasius HT X X X X X X
Leptothorax G X X X X X X X X
Messor SH X X
Monomorium SH X X
Myrmecocystus LF X X X X X X
Myrmica P X X X X X X X X
Pheidole SH X X X X X X X X
Pogonomyrmex SH X X X X X X X X
Polyergus SM X X X X
Prionopelta P X
Solenopsis G X X X X X X X X
Tapinoma G X X X X X X X
Table 2. Ant genera found in each west desert treatment zone and during each sampling period, Utah.
[Functional group designations assigned from Nash and others (2001, 2004). G, generalist; P, predator; HT, Homoptera tender; SH, seed harvester; LF, liquid feeder; SM, slave maker.]
Ibapah
Ants at Ibapah differed from site to site, but there were some patterns correlated with whether or not the sites had been treated with diflubenzuron in 2004. Untreated sites showed a large proportion of the community composed of ants in the genera Formica, Leptothorax, and Tapinoma, while Forelius, Pheidole, and Pogonomyrmex dominated collections from treated sites (fig. 19). IB U09 was unusual for an untreated site because of the high numbers of Forelius found there. It is not clear what features of IB U09 were more similar to the treated sites than to the other untreated sites, except that IB U09 was closer to the treatment zone than the others. Numbers of Tapi-noma and Leptothorax at IB U09 were comparable to the other untreated sites but Formica was rare.
Vernon
Community composition of ants at Vernon also was different at each site, but structure again appeared to be cor-related with treatment history (fig. 20). Tapinoma was found at three of the four untreated sites but not at any treated sites.
Forelius was present at all four treated sites; one ant found at VE U20 was the only Forelius found at any untreated site. Pogonomyrmex was rare at Vernon, occurring at only two sites (one treated and one untreated). Pheidole, an important seed harvester, also was relatively uncommon at Vernon sites. Monomorium, another seed-harvesting ant, was found only at Vernon, occurring at all eight sites. On average, Formica was more abundant at untreated sites, although numbers varied considerably; it occurred at only two treated sites and ranged from common to uncommon at those sites.
Comparisons Among Study Sites
Most Grouse Creek ant communities were dominated by Formica or Pogonomyrmex (fig. 18). Ibapah ant communities were characterized by Tapinoma and Formica at untreated sites and Forelius at treated sites (fig. 19). The ant communi-ties at Vernon were distinguished by the presence of Monomo-rium at all eight sites (fig. 20). There were some similarities between Vernon and Ibapah communities that were consistent with treated and untreated zones at both study areas. Formica and Tapinoma were common to abundant at untreated sites at

A
B
Sites
GC U
01 p
re
GC U
01 p
ost
GC U
05 p
re
GC U
05 p
ost
GC U
06 p
re
GC U
06 p
ost
GC U
11 p
re
GC U
11 p
ost
Prop
ortio
n of
tota
l num
ber o
f ant
s
0.0
0.2
0.4
0.6
0.8
1.0
Aphaenogaster Camponotus CrematogasterLeptothoraxSolenopsisTapinomaForeliusFormicaLasius MessorMonomoriumPheidolePogonomyrmexMyrmica CardiocondylaPrionopelta MyrmecocystusPolyergus
Sites
GC T
03 p
re
GC T
03 p
ost
GC T
04 p
re
GC T
04 p
ost
GC T
05 p
re
GC T
05 p
ost
GC T
06 p
re
GC T
06 p
ost
Prop
ortio
n of
tota
l num
ber o
f ant
s
0.0
0.2
0.4
0.6
0.8
1.0
Aphaenogaster Camponotus CrematogasterLeptothoraxSolenopsisTapinomaForeliu sFormicaLasius MessorMonomoriumPheidolePogonomyrmexMyrmica CardiocondylaPrionopeltaMyrmecocystusPolyergus
Figure 18. Relative abundance of ant genera at Grouse Creek. Untreated (A) and treated (B) zones before and after treatment.
Vernon and Ibapah, and ants of the genus Forelius were very common at most of the treated sites at both study areas.
Ant Community StructureOrdination (NMS) resulted in a three-dimensional
solution providing the best fit and lowest stress (final stress=10.762) and explaining approximately 87 percent of the variation within the dataset. For the sake of graphic simplicity, we present the two-dimensional depiction of axes two and three, which explain about 67 percent of the variation (fig. 21). Axis one was defined primarily by the
inverse relationship between Pogonomyrmex and Monomo-rium, with some influence from Solenopsis. Monomorium was found only at the eight sites of the Vernon study area, while Pogonomyrmex was common at Grouse Creek and Ibapah but was present at Vernon in small numbers at only two sites. The second axis was structured by the abundance of Formica, with Tapinoma and Leptothorax influencing structure as well. The presence of Crematogaster, which occurred at only three sites (GC T03 before and after treatment, IB T19, and IB T22), also influenced scores for NMS axis two and helped separate the latter sites to the left side of the ordination space. Abundance of Forelius defined the third axis, with the Vernon and Ibapah
Terrestrial Results 21

22 Mormon Cricket Control in Utah’s West Desert—Evaluation of Impacts of the Pesticide Diflubenzuron
IB U
03
IB U
06
IB U
08
IB U
09
IB T
13
IB T
19
IB T
21
IB T
22
Prop
ortio
n of
tota
l num
ber o
f ant
s
0.0
0.2
0.4
0.6
0.8
1.0
Aphaenogaster Camponotus CrematogasterLeptothoraxSolenopsisTapinomaForeliusFormicaLasiusMessorMonomoriumPheidolePogonomyrmexMyrmicaCardiocondylaPrionopeltaMyrmecocystusPolyergus
Untreated sites Treated sitesFigure 19. Relative abundance of ant genera at Ibapah untreated and treated zones.
VE U
08
VE U
09
VE U
19
VE U
20
VE T
01
VE T
03
VE T
06
VE T
08
Prop
ortio
n of
tota
l num
ber o
f ant
s
0.0
0.2
0.4
0.6
0.8
1.0
Aphaenogaster Camponotus CrematogasterLeptothoraxSolenopsisTapinomaForeliusFormicaLasiusMessorMonomoriumPheidolePogonomyrmexMyrmicaCardiocondylaPrionopeltaMyrmecocystusPolyergus
Untreated sites Treated sites Figure 20. Relative abundance of ant genera at Vernon untreated and treated zones.

treated sites stretched along the third axis primarily according to abundance of Forelius. This genus was largely absent from Grouse Creek, being found at only three sites (and rare at two of the three sites) (appendix A2). Forelius was abundant only at GC T03, and this Grouse Creek site was the only site with positive axis-three scores. Most Grouse Creek unsprayed-zone ant communities were defined by relatively high numbers of Formica, Pogonomyrmex, and Leptothorax and the absence of Tapinoma, Monomorium, and Forelius. Temporal shifts for the Grouse Creek sites did not show any pattern relative to difluben-zuron application, or any other factor that was examined.
Ibapah ant communities separated into sprayed and unsprayed communities primarily on the abundance of Fore-lius at the sprayed sites. IB U09 was near the sprayed-zone sites because it also had a high abundance of Forelius (appen-dix A2). The unsprayed sites at Ibapah were scattered through-out the ordination space; each of the four sites had a different ant genus as the most abundant taxon.
The sprayed Vernon sites showed almost no variation along the second axis; their locations were almost entirely based on abundance of Forelius. The unsprayed sites had essentially no Forelius (one individual at VE U20) and were separated from the sprayed sites on this basis. Abundance of Formica, Tapinoma, and Leptothorax influenced the location of the unsprayed sites at Vernon. All the unsprayed Vernon sites were in the upper right quadrat due to the presence of Monomorium, which was found only at Vernon.
The ordination was strongly influenced by the presence of Forelius; the location of IB U9 and GC T03 in the same
region of ordination space as Ibapah and Vernon sprayed sites strengthens this conclusion. Other than dominance by Forelius, there was considerable variation among sites; however, some other genera appear to exhibit trends.
Total numbers of ants differed somewhat between sprayed and unsprayed sites at all three study areas, but the average number of ants in each treatment zone at a study area were not significantly different. However, the abundance of the various genera that made up the “ant” category in the statisti-cal analyses was sometimes quite different among sites and between sprayed and unsprayed zones (table 3).
Hemiptera
Immature Hemiptera are difficult to identify, even to fam-ily, especially by nonexperts. Because most individuals were nymphs, we had large numbers of unidentified Hemiptera in some samples. To address this problem, we estimated total numbers of Hemiptera in each family. The total number of Hemiptera identified in each family and the total of all Hemiptera excluding unknowns were calculated, and the total for each family was divided by the grand total to generate the proportion of identified Hemiptera in each family. The propor-tion of Hemiptera in each family was multiplied by the total number of unknown Hemiptera caught to estimate the number of nymphs in each family. This value was added to the number of adults to estimate the total number in each family. We recognize that this approach has inherent problems, especially based on the phenology of the different taxa, and that some
Figure 21. Nonmetric multidimensional scaling joint plot of ant genera as number of ants per day at Grouse Creek, Ibapah, and Vernon. Includes data from before and after treatment at Grouse Creek and the treated and untreated sites of all three areas. Lines indicate genera strongly influencing separation of sites along one or both axes.
Grouse Creek unsprayed pre-trmtGrouse Creek unsprayed post-trmtGrouse Creek sprayed pre-trmtGrouse Creek sprayed post-trmtIbapah unsprayedIbapah sprayedVernon unsprayedVernon sprayed
VE U20
VE U19VE U08
VE U09
VE T08
VE T01
VE T03
VE T06
IB U09
IB U03
IB U08
IB U06
IB T22
IB T21
IB T13
IB T19
GC T03
GC T05
GC U11
GC U06
GC U01
GC U05
GC T04
GC T06GC U05GC U01
GC U06
GC T04
GC T06
GC T05
GC U11
GC T03
Axis
3
Axis 2Tapinoma
Forelius
Crematogaster
FormicaLeptothorax
Terrestrial Results 23

24 Mormon Cricket Control in Utah’s West Desert—Evaluation of Impacts of the Pesticide Diflubenzuron
Table 3. Total number of ants of the nine most common genera collected in treated and untreated zones at Grouse Creek, Ibapah, and Vernon study sites after treatment with diflubenzuron.
[*IB U9 accounted for 541 of the Forelius in untreated traps].
Genus Grouse Creek after treatment Ibapah after treatment Vernon after treatment
Untreated Treated Untreated Treated Untreated Treated
Forelius 127 442 544 1,396 1 2,239
Formica 963 101 536 158 2,700 396
Leptothorax 197 251 273 101 581 181
Monomorium 0 0 0 0 1,055 1,043
Myrmica 7 24 92 103 497 29
Pheidole 122 238 57 257 314 297
Pogonomyrmex 535 300 19 256 29 14
Solenopsis 109 95 44 42 198 102
Tapinoma 3 5 647 24 597 0
Totals 2,063 1,456 2,212 2,337 5,972 4,301
families might have been represented only by adults, or only by nymphs, at the time of collections. Because the samples at each study area were collected at the same time, we believe any inaccuracies will be consistent across that sampling period.
Grouse Creek
Pre- versus Post-Treatment Changes in Untreated ZoneCommunity composition of Hemiptera varied from site to
site and over time at Grouse Creek (figs. 22A and B). Cicadel-lidae were the most abundant Hemiptera at most sites, but GC U01 and GC U05 sites were dominated by the Alydidae in late June (post-treatment period), representing a dramatic increase in this family from the early June sampling event. Most other families were relatively rare at Grouse Creek sites; Miridae were uncommon to abundant at some untreated sites and increased from pre- to post-treatment collections. The only other family that occurred with any frequency was the Aphididae. The GC U11 Hemipteran community appeared to differ from communities at the other untreated sites.
Pre- versus Post-Treatment Changes in the Treated ZoneThe treated sites at Grouse Creek also were dominated
by the Cicadellidae, even more strongly than in the untreated zone, during both sampling periods (fig. 22B). The Alydidae were absent from all treated sites prior to treatment; they were captured in post-treatment samples but in much lower numbers than at post-treatment unsprayed sites. Aphids were again present in all collections and increased across the two col-lection periods. The Miridae were less frequent in the treated zone and showed only a slight increase from pre- to post-
treatment collections, while the increase in Miridae abundance in the untreated zone was large.
The Lygaeidae were absent from both untreated and treated zones prior to treatment at Grouse Creek. No Lygaeids were detected in the treated zone 3 weeks after treatment, but low numbers (averaging 1.9 individuals per day) were detected at each untreated site in the post-treatment collection period. Although there was no difference in numbers of Lygaeidae in the treated zone before and after treatment (no individuals were detected), the comparison between post-treatment untreated and treated zones was significantly different (T
d.f. 6=26; P=0.029).
The phenology of the Lygaeidae may account for the lack of any individuals being detected in pre-treatment samples from either treatment zone; they may emerge later in the season and were not active during the early sampling period.
Ibapah
Zones Treated in 2004 versus Untreated Zones Cicadellidae dominated six of eight Ibapah sites, with
the Alydidae most numerous at IB U08 and IB T13 (fig. 23). The Alydidae were present at all eight Ibapah sites, but each treatment zone had one site where the Alydidae dominated the collection of Hemiptera. IB U08 and IB T13 appeared to have finer soils; greasewood, saltbush, and other shrubby Chenopo-deaceae made up a significant portion of the shrub component of the vegetation at these two sites. Sagebrush was relatively scarce at IB U08 but common at IB T13. The Lygaeidae had significantly more individuals in untreated sites than treated sites (T
d.f. 6=26; P=0.029).

Vernon
Sites Treated in 2004 versus Untreated SitesVernon hemipteran communities differed among sites
and were more diverse than Ibapah or Grouse Creek com-munities (fig. 24), with Cicadellidae dominating some sites; other families, such as the Lygaeidae, Miridae, Nabidae, and Psyllidae, were common. As at Ibapah and Grouse Creek, no pattern in the community structure appeared to be associated with the treatment history at Vernon. The Lygaeidae, which showed indications of sensitivity to diflubenzuron at Grouse Creek and Ibapah, were highly variable at Vernon, but total
numbers hinted at sensitivity to diflubenzuron (63 caught in the untreated zone, 32 caught in the treated zone).
Community Structure of Hemiptera
Ordination of numbers per day for hemipteran families did not provide a good solution because the Cicadellidae (at most sites) and the Alydidae (at a few sites) overwhelmed the variation among other families. Data were adjusted by adding 0.01 to each value to eliminate zeros and then log transformed in PC-ORD (McCune and Mefford, 2005) to compress high values (as suggested by McCune and Grace, 2002) of the Cicadellidae and Alydidae; the Euclidean distance measure
Figure 22. Relative abundances of Hemiptera families at Grouse Creek untreated (A) and treated (B) zones before and after treatment with diflubenzuron.
A
BSites
GC U
01pr
e
GC U
01po
st
GC U
05pr
e
GC U
05po
st
GC U
06pr
e
GC U
06po
st
GC U
11pr
e
GC U
11po
st
Prop
ortio
nal a
bund
ance
0.0
0.1
0.2
0.3
0.4
0.5
0.6
0.7
0.8
0.9
1.0
Alydidae Aphididae Berytidae Cercopidae Cicadellidae Cydnidae Delphacidae Dictyopharidae Fulgoridae Geocoridae Lygaeidae Miridae Nabidae Pentatomidae Phylloxeridae Piesmatidae Psyllidae Reduviidae Rhopalidae Tingidae
Sites
GC T
03 p
re
GC T
03 p
ost
GC T
04 p
re
GC T
04 p
ost
GC T
05 p
re
GC T
05 p
ost
GC T
06 p
re
GC T
06 p
ost
Prop
ortio
nal a
bund
ance
0.0
0.1
0.2
0.3
0.4
0.5
0.6
0.7
0.8
0.9
1.0
Alydidae Aphididae Berytidae Cercopidae Cicadellidae Cydnidae Delphacidae Dictyopharidae Fulgoridae Geocoridae Lygaeidae Miridae Nabidae Pentatomidae Phylloxeridae Piesmatidae Psyllidae Reduviidae Rhopalidae Tingidae
Terrestrial Results 25

26 Mormon Cricket Control in Utah’s West Desert—Evaluation of Impacts of the Pesticide Diflubenzuron
was used. Ordination of transformed data resulted in a three-axis solution that explained 89.2 percent of the dataset variation; we present the first two axes, which explain 69.9 percent of the variation, for graphic simplicity (fig. 25). The Alydidade, Cer-copidae, Miridae, and Nabidae influenced the first axis structure; the second axis was structured by the Aphididae and Psyllidae (negative values) and the Alydidae (positive values). Grouse Creek sites were spread across ordination space with no differ-ences correlated with insecticide application. Seven of the eight Grouse Creek sites showed similar shifts in pre- to post-treatment
community structure that were correlated with large increases in Miridae and Cicadellidae. GC U11 had only modest increases in these families (appendix A3), and it moved in ordination space differently than the other seven sites (fig. 25). The Ibapah sites were relatively isolated from most Vernon and Grouse Creek sites by the abundance of the Cicadellidae. Within the Ibapah cluster, three treated sites and two untreated sites formed a tight group. IB T13 and IB U08 were somewhat isolated on the basis of abundant Alydidae. The Vernon sites were scattered throughout ordination space with no apparent pattern (fig. 25).
IB U
03
IB U
06
IB U
08
IB U
09
IB T
13
IB T
19
IB T
21
IB T
22
Prop
ortio
nal a
bund
ance
0.0
0.1
0.2
0.3
0.4
0.5
0.6
0.7
0.8
0.9
1.0
Alydidae Aphididae Berytidae Cercopidae Cicadellidae Cydnidae Delphacidae Dictyopharidae Fulgoridae Geocoridae Lygaeidae Miridae Nabidae Pentatomidae Phylloxeridae Piesmatidae Psyllidae Reduviidae Rhopalidae Tingidae
Untreated sites Treated sites
Figure 23. Relative abundances of Hemiptera families at Ibapah treated and untreated sites.
VE U
08
VE U
09
VE U
19
VE U
20
VE T
01
VE T
03
VE T
06
VE T
08
Prop
ortio
nal a
bund
ance
0.0
0.1
0.2
0.3
0.4
0.5
0.6
0.7
0.8
0.9
1.0
Alydidae Aphididae Berytidae Cercopidae Cicadellidae Cydnidae Delphacidae Dictyopharidae
Fulgoridae Geocoridae Lygaeidae Miridae Nabidae Pentatomidae Phylloxeridae Piesmatidae Psyllidae Reduviidae Rhopalidae Tingidae
Untreated sites Treated sites
Figure 24. Relative abundances of Hemiptera families at Vernon untreated and treated sites.
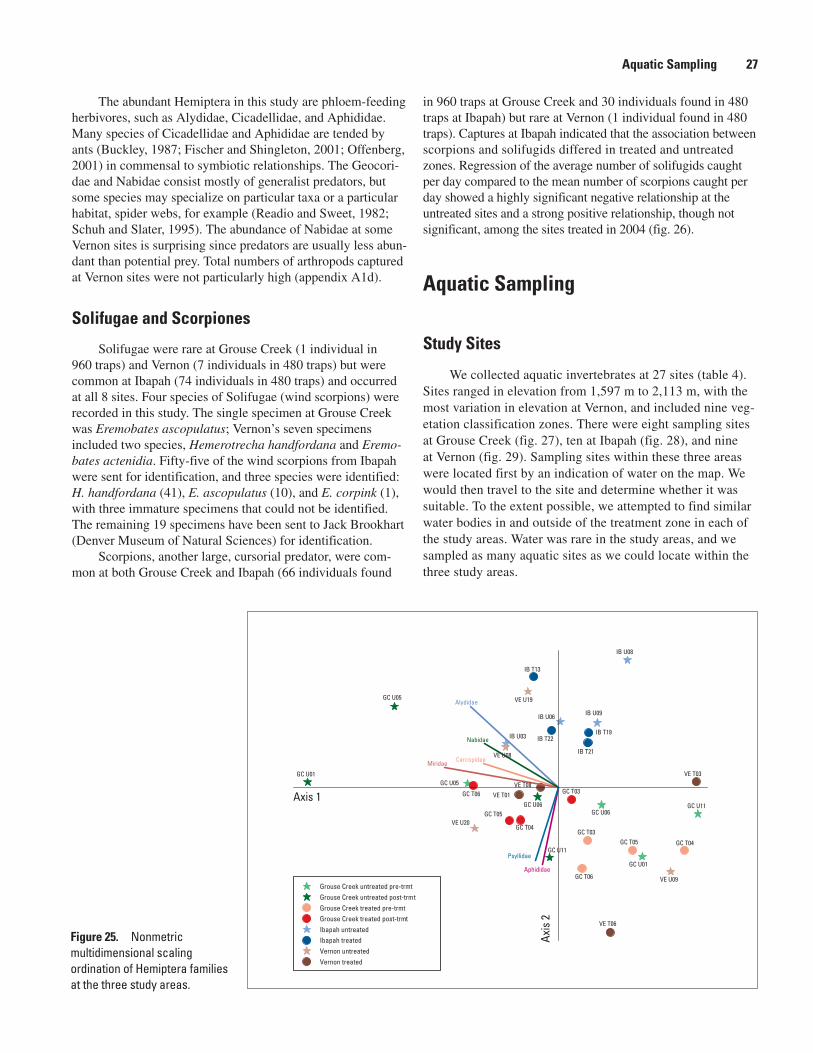
The abundant Hemiptera in this study are phloem-feeding herbivores, such as Alydidae, Cicadellidae, and Aphididae. Many species of Cicadellidae and Aphididae are tended by ants (Buckley, 1987; Fischer and Shingleton, 2001; Offenberg, 2001) in commensal to symbiotic relationships. The Geocori-dae and Nabidae consist mostly of generalist predators, but some species may specialize on particular taxa or a particular habitat, spider webs, for example (Readio and Sweet, 1982; Schuh and Slater, 1995). The abundance of Nabidae at some Vernon sites is surprising since predators are usually less abun-dant than potential prey. Total numbers of arthropods captured at Vernon sites were not particularly high (appendix A1d).
Solifugae and Scorpiones
Solifugae were rare at Grouse Creek (1 individual in 960 traps) and Vernon (7 individuals in 480 traps) but were common at Ibapah (74 individuals in 480 traps) and occurred at all 8 sites. Four species of Solifugae (wind scorpions) were recorded in this study. The single specimen at Grouse Creek was Eremobates ascopulatus; Vernon’s seven specimens included two species, Hemerotrecha handfordana and Eremo-bates actenidia. Fifty-five of the wind scorpions from Ibapah were sent for identification, and three species were identified: H. handfordana (41), E. ascopulatus (10), and E. corpink (1), with three immature specimens that could not be identified. The remaining 19 specimens have been sent to Jack Brookhart (Denver Museum of Natural Sciences) for identification.
Scorpions, another large, cursorial predator, were com-mon at both Grouse Creek and Ibapah (66 individuals found
in 960 traps at Grouse Creek and 30 individuals found in 480 traps at Ibapah) but rare at Vernon (1 individual found in 480 traps). Captures at Ibapah indicated that the association between scorpions and solifugids differed in treated and untreated zones. Regression of the average number of solifugids caught per day compared to the mean number of scorpions caught per day showed a highly significant negative relationship at the untreated sites and a strong positive relationship, though not significant, among the sites treated in 2004 (fig. 26).
Aquatic Sampling
Study Sites
We collected aquatic invertebrates at 27 sites (table 4). Sites ranged in elevation from 1,597 m to 2,113 m, with the most variation in elevation at Vernon, and included nine veg-etation classification zones. There were eight sampling sites at Grouse Creek (fig. 27), ten at Ibapah (fig. 28), and nine at Vernon (fig. 29). Sampling sites within these three areas were located first by an indication of water on the map. We would then travel to the site and determine whether it was suitable. To the extent possible, we attempted to find similar water bodies in and outside of the treatment zone in each of the study areas. Water was rare in the study areas, and we sampled as many aquatic sites as we could locate within the three study areas.
Figure 25. Nonmetric multidimensional scaling ordination of Hemiptera families at the three study areas.
Grouse Creek untreated pre-trmtGrouse Creek untreated post-trmtGrouse Creek treated pre-trmtGrouse Creek treated post-trmtIbapah untreatedIbapah treatedVernon untreatedVernon treated
GC U05
GC U01
GC T04GC T05
GC T03
GC T05
GC T06
GC U11
GC U06
GC T04
GC U01
GC T06
GC T03
GC U06
GC U05
GC U11
IB U08
IB T13
IB T21
IB U03
IB U09
IB T19IB T22
IB U06
VE T03
VE U20
VE U08
VE U09
VE U19
VE T06
VE T08
Axis 1
Axis
2
VE T01
Psyllidae
Cercopidae
Alydidae
Nabidae
Miridae
Aphididae
Aquatic Sampling 27

28 Mormon Cricket Control in Utah’s West Desert—Evaluation of Impacts of the Pesticide Diflubenzuron
Average number of scorpions per day0.0 0.5 1.0 1.5 2.0 2.5
Aver
age
num
ber o
f w
ind
scor
pion
s pe
r day
0
1
2
3
4
5Ibapah untreated sitesIbapah treated sites
Number of wind scorpions = 1.45 + 2.8(number of scorpions)r2 =0.5138; P=0.1779
Number of wind scorpions = 6.16 - 2.6923(number of scorpions)r2 =0.8926; P=0.0365
Figure 26. Number of wind scorpions per day versus number of scorpions per day at Ibapah study site.
Figure 27. Aquatic site at Grouse Creek (U.S. Geological Survey photograph by Anne Brasher).

Table 4. Aquatic site information, west desert study area, Utah.
Site Spray zone Code Elevation, in meters
GAP vegetation classification
Grouse Creek
Coal Mine Spring In CMSP 1,742 Great Basin Pinyon-Juniper Woodland
Cluster Spring no. 1 In CLSP1 1,661 Inter-Mountain Basins Big Sagebrush Shrubland
Cluster Spring no. 2 In CLSP2 1,661 Inter-Mountain Basins Big Sagebrush Shrubland
Red Butte Creek—inside treatment
In RBTST 1,633 Inter-Mountain Basins Big Sagebrush Shrubland
N. Fork Red Butte Creek In NFRST 1,629 Inter-Mountain Basins Big Sagebrush Shrubland
Keg Spring Out KGSP 1,839 Great Basin Foothill and Lower Montane Riparian Woodland and Shrubland
Lower Rocky Pass Spring Out LRSP 1,692 Inter-Mountain Basins Big Sagebrush Shrubland
Red Butte Creek—outside treatment
Out RBNST 1,597 Inter-Mountain Basins Big Sagebrush Shrubland
Ibapah
Mike’s Crossing In MCST 1,796 Inter-Mountain Basins Big Sagebrush Shrubland
Spray Ditch In SDST 1,757 Inter-Mountain Basins Big Sagebrush Shrubland
Jason’s Crossing In JCST 1,780 Inter-Mountain Basins Big Sagebrush Shrubland
Irrigation Ditch at Jason’s Crossing
In IJCST 1,781 Inter-Mountain Basins Big Sagebrush Shrubland
Indian Crossing In ICST 1,803 Inter-Mountain Basins Big Sagebrush Shrubland
Oxbow N. End Out NOXSP 1,689 Inter-Mountain Basins Big Sagebrush Shrubland
Oxbow S. End Out SOXSP 1,689 Inter-Mountain Basins Big Sagebrush Shrubland
Skinner Springs Out SKSP 1,653 Great Basin Foothill and Lower Montane Riparian Woodland and Shrubland
Bobcat Crossing Out BCST 1,720 Inter-Mountain Basins Big Sagebrush Shrubland
East Deep Creek Out DCST 1,691 Agriculture
Vernon
VE T03 Ditch In VD3ST 1,744 Inter-Mountain Basins Big Sagebrush Shrubland
Roger’s Crossing In RCST 1,836 Inter-Mountain Basins Big Sagebrush Shrubland
Vernon Creek In VCST 1,888 Great Basin Pinyon-Juniper Woodland
VE T06 Ditch In VD6ST 1,787 Inter-Mountain Basins Big Sagebrush Shrubland
Chokecherry Stream Out CCST 2,002 Inter-Mountain Basins Montane Sagebrush Steppe
Left Fork Bennion Creek Out LFST 2,113 Inter-Mountain Basins Montane Sagebrush Steppe
Little Valley Creek Out LVST 1,956 Great Basin Foothill and Lower Montane Riparian Woodland and Shrubland
Upper Little Valley Creek Out ULVST 1,983 Rocky Mountain Gambel Oak-Mixed Montane Shrubland
Private Creek Out PCST 2,023 Inter-Mountain Basins Montane Sagebrush Steppe
Aquatic Sampling 29

30 Mormon Cricket Control in Utah’s West Desert—Evaluation of Impacts of the Pesticide Diflubenzuron
Figure 28. Aquatic site at Ibapah (U.S. Geological Survey photograph by Anne Brasher).
Figure 29. Aquatic site at Vernon (U.S. Geological Survey photograph by Becky Close).

Table 5. Aquatic site characteristics and sampling information, west desert study areas, Utah.
[m, mud; sl, silt; sa, sand; smr, small rocks; g, gravel; c, cobble; r, rocks; b, boulder]
Code Sample dates Spray zone Stream/spring Temperature, in degrees
Celsius
Depth, in meters
Width, in meters
Substrate
CMSP 5/25/056/24/0510/7/05
In Spring 23.51412
NA1NA
30 by 3430 by 3543 by 30
sa,m,slNAm,sl
CLSP1 5/26/0510/7/05
In Spring 1810
NANA
5 by 510 by 6
NANA
CLSP2 6/23/0510/7/05
In Spring 18.59
NANA
15 by 54 by 5
MNA
RBTST 5/27/056/22/05
In Stream 714
NANA
2.3NA
SaNA
NFRST 10/7/05 In Stream 4 NA NA sl to c
KGSP 5/25/056/23/0510/7/05
Out Spring NA911.5
.45
.15
.45
21 by 1615 by 1018 by 12
m,sslSl
LRSP 6/2/056/22/0510/7/05
Out Spring 17NA15
.13NA.6
15 by 9NA20 by 10
sa,sl,mslSl
RBNST 6/2/056/22/05
Out Stream 15NA
.75NA
2.5NA
GNA
MCST 7/12/05 In Stream 18 .15 4 g,c,r
SDST 7/13/05 In Irrigation ditch 16 .3 1.5 G
JCST 7/13/05 In Stream 19 .2 5 sa,g,c
IJCST 7/13/05 In Irrigation ditch 14.5 .15 1.75 c,g,smr
ICST 7/14/05 In Irrigation ditch 15 .15 1.5 sa,g,c
NOXSP 7/13/05 Out Spring 15 .3 90 by 20 NA
SOXSP 7/13/05 Out Spring 15 .3 90 by 20 NA
SKSP 7/13/05 Out Spring 9 .45 15 by 10 NA
BCST 7/13/05 Out Stream 18 .2 3 sa,g,c
DCST 7/14/05 Out Stream 20.5 .3 2.5 sa,m,g
VD3ST 7/20/05 In Irrigation ditch 19 .05 .3 m,sl
RCST 7/21/05 In Stream 27 .1 1 c,g,smr
VCST 7/21/05 In Stream NA .5 2 NA
VD6ST 7/21/05 In Irrigation ditch 23 .1 1.75 g,c
CCST 7/20/05 Out Stream 11 .4 2.5 g,m,sa
LFST 7/20/05 Out Stream 11 .1 1 c,b,g
LVST 7/20/05 Out Stream 15 .3 2.5 c,g
ULVST 7/20/05 Out Stream 15 .5 2.5 c,g
PCST 7/21/05 Out Stream 11 .1 2 sl,sa
Aquatic Sampling 31

32 Mormon Cricket Control in Utah’s West Desert—Evaluation of Impacts of the Pesticide Diflubenzuron
Aquatic sites consisted of both streams (including actual streams and irrigation ditches) and springs (table 5). There were five sites in the treatment zone at Grouse Creek and three sites outside of the treatment zone. At one of the sites in the treatment zone, Cluster Springs, there were two different springs (CLSP1 and CLSP2). CLSP1 was sampled during the first sampling event. During the second sampling event, CLSP1 was inadvertently overlooked, and CLSP2 was sampled. During the third sampling event, both CLSP1 and CLSP2 were sampled. At Ibapah, there were five sites inside and five sites outside of the treatment zone. At Vernon, there were four sites inside and five sites outside of the treatment zone. The sites in pesticide treatment zones were surrounded by a buffer zone extending 150 m from both sides of the water body. Some sites at Ibapah (ICST, IJCST, SDST) and Vernon (VD6ST, RCST) were not buffered because they are irrigation ditches and, therefore, were directly in the spray zone. The sites at Grouse Creek and Ibapah consisted of both springs and streams. All the sites at Vernon were classified as streams. Because the lower elevation sites at Vernon were areas that are ranched or farmed, these lower elevation areas also were the sites that were sprayed. Upper elevation sites at Vernon were not sprayed, potentially confounding the effects of spraying versus elevation on aquatic communities. Basic habitat characteristics were recorded at most sites. Water temperatures ranged from 4°C to 27°C. Spring pools ranged in size from small (20 m2) to relatively large (1,800 m2). Streams were generally similar in size to each other, with wetted widths of 0.3 to 2.5 m.
Sampling Design
We collected samples in three timeframes at Grouse Creek—before treatment, 2 weeks after treatment, and 4 months after treatment. Grouse Creek was the only area treated with diflubenzuron in 2005. Samples were collected only once, 1 year after treatment, at both Ibapah and Vernon.
Sample Collection and Processing
We collected macroinvertebrate samples by using a D-frame net (fig. 30). We targeted as many different habitat types as possible within each water body. These samples are semiquantitative, based on sampling effort. We recorded the amount of time spent sampling at each location and tailored the time to the size of the water body (that is, at the larger springs, such as Coal Mine Springs, we sampled for 10 min-utes; but at Cluster Springs no. 1, which is much smaller, we sampled for 3 minutes). The samples were presorted in the field and preserved in ethanol.
Sample Sorting and Identification
All samples were sent to Rhithron Associates for identi-fication and enumeration. Subsamples of a minimum of 300 organisms were obtained by using Caton subsampling devices, divided into 30 grids (each approximately 5 by 6 cm). The organisms were identified to the lowest practical level con-
Figure 30. Collecting an aquatic macroinvertebrate sample using a D-frame net (U.S. Geological Survey photograph by Anne Brasher).
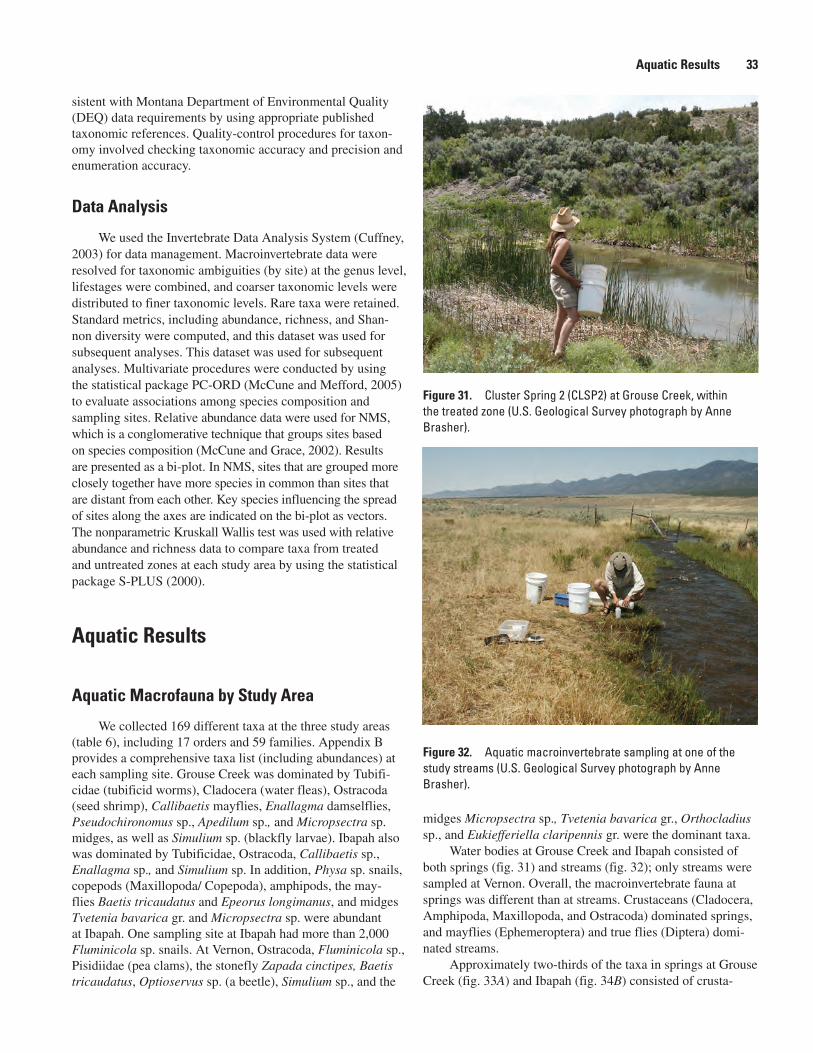
sistent with Montana Department of Environmental Quality (DEQ) data requirements by using appropriate published taxonomic references. Quality-control procedures for taxon-omy involved checking taxonomic accuracy and precision and enumeration accuracy.
Data Analysis
We used the Invertebrate Data Analysis System (Cuffney, 2003) for data management. Macroinvertebrate data were resolved for taxonomic ambiguities (by site) at the genus level, lifestages were combined, and coarser taxonomic levels were distributed to finer taxonomic levels. Rare taxa were retained. Standard metrics, including abundance, richness, and Shan-non diversity were computed, and this dataset was used for subsequent analyses. This dataset was used for subsequent analyses. Multivariate procedures were conducted by using the statistical package PC-ORD (McCune and Mefford, 2005) to evaluate associations among species composition and sampling sites. Relative abundance data were used for NMS, which is a conglomerative technique that groups sites based on species composition (McCune and Grace, 2002). Results are presented as a bi-plot. In NMS, sites that are grouped more closely together have more species in common than sites that are distant from each other. Key species influencing the spread of sites along the axes are indicated on the bi-plot as vectors. The nonparametric Kruskall Wallis test was used with relative abundance and richness data to compare taxa from treated and untreated zones at each study area by using the statistical package S-PLUS (2000).
Aquatic Results
Aquatic Macrofauna by Study Area
We collected 169 different taxa at the three study areas (table 6), including 17 orders and 59 families. Appendix B provides a comprehensive taxa list (including abundances) at each sampling site. Grouse Creek was dominated by Tubifi-cidae (tubificid worms), Cladocera (water fleas), Ostracoda (seed shrimp), Callibaetis mayflies, Enallagma damselflies, Pseudochironomus sp., Apedilum sp., and Micropsectra sp. midges, as well as Simulium sp. (blackfly larvae). Ibapah also was dominated by Tubificidae, Ostracoda, Callibaetis sp., Enallagma sp., and Simulium sp. In addition, Physa sp. snails, copepods (Maxillopoda/ Copepoda), amphipods, the may-flies Baetis tricaudatus and Epeorus longimanus, and midges Tvetenia bavarica gr. and Micropsectra sp. were abundant at Ibapah. One sampling site at Ibapah had more than 2,000 Fluminicola sp. snails. At Vernon, Ostracoda, Fluminicola sp., Pisidiidae (pea clams), the stonefly Zapada cinctipes, Baetis tricaudatus, Optioservus sp. (a beetle), Simulium sp., and the
midges Micropsectra sp., Tvetenia bavarica gr., Orthocladius sp., and Eukiefferiella claripennis gr. were the dominant taxa.
Water bodies at Grouse Creek and Ibapah consisted of both springs (fig. 31) and streams (fig. 32); only streams were sampled at Vernon. Overall, the macroinvertebrate fauna at springs was different than at streams. Crustaceans (Cladocera, Amphipoda, Maxillopoda, and Ostracoda) dominated springs, and mayflies (Ephemeroptera) and true flies (Diptera) domi-nated streams.
Approximately two-thirds of the taxa in springs at Grouse Creek (fig. 33A) and Ibapah (fig. 34B) consisted of crusta-
Figure 31. Cluster Spring 2 (CLSP2) at Grouse Creek, within the treated zone (U.S. Geological Survey photograph by Anne Brasher).
Figure 32. Aquatic macroinvertebrate sampling at one of the study streams (U.S. Geological Survey photograph by Anne Brasher).
Aquatic Results 33

34
Morm
on Cricket Control in Utah’s West Desert—
Evaluation of Impacts of the Pesticide Diflubenzuron
Phylum Class Order Suborder Family Subfamily/Tribe Genus/Species Code Grouse Creek
Ibapah Vernon
Annelida Clitellata Arhynchobdellida Erpobdelliformes Erpobdellidae Mooreobdella sp. MOORE X X
Erpobdellinae Erpobdella sp. ERPOB X
Haplotaxida Enchytraeidae ENCHY X X X
Naididae NAIDI X X
Tubificidae TUBIF X X X
Rhynchobdellida Glossiphoniidae Haementeriinae Helobdella stagnalis HELOB X
Mollusca Bivalvia Veneroida Pisidiidae PISID X X X
Gastropoda Basommatophora Lymnaeidae LYMNA X
Fossaria sp. FOSSA X X
Stagnicola sp. STAGN X X X
Physidae Physa sp. PHYSA X X
Planorbidae Gyraulus sp. GYRAU X X
Neotaenioglossa Hydrobiidae Fluminicola sp. FLUMI X X X
Nematoda NEMAT X X X
Platyhelminthes Turbellaria TURBE X X
Tricladida Planariidae Polycelis coronata POLYC X
Arthropoda Arachnida Trombidiformes TROMB X X X
Branchio-poda
Diplostraca Cladocera CLADOC X X
Malacostraca Amphipoda Gammaridae Gammarus sp. GAMMA X X
Hyalellidae Hyalella sp. HYALE X X X
Maxillopoda/Copepoda
COPEP X X X
Copepoda Ostracoda OSTRA X X X
Insecta Ephemeroptera Furcatergalia Caenidae Caenis sp. CAENI X
Ephemerellidae Drunella sp. DRUNE X
Drunella grandis DRUGR X X
Ephemerella inermis INERM X X
Ephemerellinae Serratella tibialis SERRAT X
Table 6. Aquatic taxa collected at the three west desert study areas, Utah.

Phylum Class Order Suborder Family Subfamily/Tribe Genus/Species Code Grouse Creek
Ibapah Vernon
Schistonota Leptophlebiidae Paraleptophlebia sp. PARAL X
Siphlonuridae SIPHLO X
Pisciforma Ameletidae Ameletus sp. AMELE X X
Baetidae Acentrella sp. ACENT X
Baetis tricaudatus BAETI X X X
Callibaetis sp. CALLI X X X
Centroptilum sp. CENTR X X
Diphetor hageni DIPHE X X
Setisura Heptageniidae Cinygmula sp. CINYG X
Epeorus grandis EGRAND X
Epeorus deceptivus EDECEPT X
Epeorus longimanus ELONGIM X X
Odonata Anisoptera Aeshnidae AESHN X
Aeshna sp. AESHNSP X
Anax sp. ANAXSP X
Libellulidae LIBEL X
Erythemis sp. ERYTHEM X
Libellula sp. LIBELSP X
Sympetrum sp. SYMPE X X
Zygoptera Calopterygidae Hetaerina sp. HETAER X
Coenagrionidae COENAGR X
Amphiagrion sp. AMPHIAG X
Enallagma sp. ENALLAG X X
Lestidae Lestes sp. LESTES X
Plecoptera Euholognatha Capniidae CAPNII X
Nemouridae NEMOU X
Amphinemurinae Malenka sp. MALENKA X
Nemourinae Zapada sp. ZAPAD X
Table 6. Aquatic taxa collected at the three west desert study areas, Utah—Continued.Aquatic Results
35

36
Morm
on Cricket Control in Utah’s West Desert—
Evaluation of Impacts of the Pesticide Diflubenzuron
Phylum Class Order Suborder Family Subfamily/Tribe Genus/Species Code Grouse Creek
Ibapah Vernon
Ochrotrichia sp. OCHROT X X X
Rhyacophilidae Rhyacophila sp. RHYACO X
Coleoptera Adephaga Dytiscidae DYTISCI X X X
Agabus sp. AGABU X X
Colymbetes sp. COLYMB X
Rhantus sp. RHANTU X
Liodessus sp. LIODESS X
Hygrotus sp. HYGROTU X
Stictotarsus sp. STICTOT X X X
Laccophilus sp. LACCOPH X
Haliplidae Peltodytes sp. PELTODY X
Polyphaga Elmidae Cleptelmis sp. CLEPTEL X
Optioservus sp. OPTIOSE X X X
Hydraenidae Ochthebius sp. OCHTHEB X
Hydrophilidae HPHILID X X
Hydrobius sp. HYBIUS X
Laccobius sp. LACCOB X
Tropisternus sp. TROPIST X
Diptera Nematocera Blephariceridae Blepharicerinae Agathon sp. AGATH X
Ceratopogonidae Ceratopogoninae CERATOP X X X
Chironomidae Chironomini Apedilum sp. APEDILU X X
Chironomus sp. CHIRONO X
Chironomus sp. CHIRONO X
Parachironomus sp. PARACHI X
Paracladopelma sp. PARACLA X
Paratendipes sp. PARATEN X X
Phaenopsectra sp. PHAENOP X X X
Polypedilum sp. POLYPED X X X
Table 6. Aquatic taxa collected at the three west desert study areas, Utah—Continued.

Aquatic Results
37
Phylum Class Order Suborder Family Subfamily/Tribe Genus/Species Code Grouse Creek
Ibapah Vernon
Pseudochirono-mini
Pseudochironomus sp.
PSEUDOC X X
Tanytarsini TARSINI X
Cladotanytarsus sp. CLADOT X
Micropsectra sp. MICROPS X X X
Rheotanytarsus sp. RHEOTAN X
Stempellinella sp. STEMPEL X
Tanytarsus sp. TANYTAR X X
Diamesinae Pagastia sp. PAGAS X X X
Pseudodiamesa sp. IAMESA X
Diamesa sp. DIAMES X
Orthocladiinae Acricotopus sp. ACRICOT X
Brillia sp. BRILLIA X X
Chaetocladius sp. CHAETOC X X
Corynoneura sp. CORYNON X X X
Cricotopus (Cricotopus)
CRICOTO X X X
Cricotopus (Isocladius)
ISOCLAD X
Eukiefferiella brehmi gr.
EUKBREH X X X
Eukiefferiella devonica gr.
EUKDEVO X X
Eukiefferiella gracei gr.
EUKGRAC X X
Eukiefferiella clarip-ennis gr.
EUKCLAR X X
Limnophyes sp. LIMNOP X X X
Orthocladius sp. ORTHOC X X X
Parakiefferiella sp. PARAKI X
Parametriocnemus sp.
PARAME X X
Table 6. Aquatic taxa collected at the three west desert study areas, Utah—Continued.

38
Morm
on Cricket Control in Utah’s West Desert—
Evaluation of Impacts of the Pesticide Diflubenzuron
Phylum Class Order Suborder Family Subfamily/Tribe Genus/Species Code Grouse Creek
Ibapah Vernon
Paraphaenocladius sp.
PARAPH X
Psectrocladius sp. PSECTRC X X
Pseudosmittia sp. PSEUDOS X
Rheocricotopus sp. RHEOCRI X
Thienemanniella sp. THIENEM X
Tvetenia bavarica gr.
TVETE X X X
Metriocnemus sp. METRIOC X X X
Podonominae Parochlus sp. PAROC X
Prodiamesinae Odontomesa sp. ODONTO X X
Prodiamesa sp. PRODIA X
Tanypodinae TANYPOD X
Apsectrotanypus sp. APSECTR X X
Psectrotanypus sp. PSECTRT X
Radotanypus sp. RADOTA X X
Pentaneura sp. PENTA X X
Thienemannimyia gr.
NIMYIA X X X
Zavrelimyia sp. ZAVRELI X X
Tanypus sp. TANYPUS X
Culicidae CULICI X X X
Dixidae DIXID X
Dixa sp. DIXASP X
Meringodixa sp. MERINGO X
Psychodidae PSYCHOD X X
Simuliidae Prosimulium sp. PROSIMU X X
Simulium sp. SIMULIU X X X
Tipulidae Limoniinae Molophilus sp. MOLOPH X
Pedicia sp. PEDICI X
Dicranota sp. DICRAN X
Table 6. Aquatic taxa collected at the three west desert study areas, Utah—Continued.

Aquatic Results
39
Phylum Class Order Suborder Family Subfamily/Tribe Genus/Species Code Grouse Creek
Ibapah Vernon
Tipulinae Tipula sp. TIPULA X
Brachycera Dolichopodidae DOLICHO X
Empididae EMPIDI X
Neoplasta sp. NEOPLAS X
Clinocera sp. CLINOCE X X X
Ephydridae EPHYDR X
Muscidae MUSCIDA X X X
Sciomyzidae SCIOMYZ X X
Table 6. Aquatic taxa collected at the three west desert study areas, Utah—Continued.

40 Mormon Cricket Control in Utah’s West Desert—Evaluation of Impacts of the Pesticide Diflubenzuron
ceans. Diptera and noninsect taxa (mites, nematodes, and oligochaetes) made up about one quarter of the noncrustacean taxa in springs at Grouse Creek. Insects (Ephemeroptera, Diptera, and other insects) made up a little more than one-fifth of the taxa in springs at Ibapah, with molluscs accounting for an additional tenth. Diptera in springs at Grouse Creek and Ibapah were almost entirely Chironomidae.
Streams at Grouse Creek (fig. 33B), Ibapah (fig. 34B), and Vernon (35) had fairly similar relative abundances of different taxa at the order level. Diptera was the most abun-dant, followed by Ephemeroptera. Together, these two orders accounted for 95 percent, 82 percent, and 80 percent of the taxa in streams at Grouse Creek, Ibapah, and Vernon, respec-tively. More than three-quarters of the Diptera in streams at Grouse Creek were Simulidae; most of the remaining Diptera were Chironomidae. The opposite pattern was observed at Ibapah and Vernon, with approximately three-quarters of the Diptera consisting of Chironomidae. Crustaceans and molluscs contributed little to the overall abundance at Grouse Creek and Ibapah streams (less than 5 percent), while 12 percent of the abundance in Vernon streams consisted of crustaceans and molluscs. Vernon streams had half as many mayflies as streams in Grouse Creek and Ibapah.
Richness, Abundance, and Diversity at Sampling Sites in the Three Study Areas
Grouse Creek
Grouse Creek was the only study area sprayed in 2005. There was no significant difference in abundance (Kruskall Wallis chi-square=0.4176; P=0.5181) or richness (Kruskall Wallis chi-square=1.5578; P=0.212) between sites inside and outside the treatment zones after treatment. Because water bodies were buffered (no pesticide was sprayed closer than about 150 m from a water body), the lack of difference between sprayed and unsprayed sites was not unexpected. At Grouse Creek, abundance (number of individuals) was highly variable among sites, with no clear pattern between the treated and untreated zones (fig. 36). Richness (number of taxa) was less variable among sites. The diversity index mirrors the rich-ness values. Since there was no statistically significant differ-ence in macroinvertebrate abundance or richness between the treated and untreated zones after treatment, all sampling dates (before and after treatment) were plotted for further commu-
Other Non-Insecta
1%
Diptera57%
Ephemeroptera38%
Crustacea1%
OtherInsecta
3%
Simulidae85%
Other Diptera1%
Chironomidae14%
Chironomidae99.7%
Other Diptera.3%
Other Non-Insecta
10%
Diptera13%
Ephemeroptera4%
Crustacea65%
Mollusca3%
Other Insecta
5%
Streams
Springs
A
B
Figure 33. Relative abundances of aquatic taxa in springs (A) and streams (B) at the Grouse Creek study area.

Aquatic Results 41
OtherNon-Insecta
3%Diptera
8%Ephemeroptera
7%
Crustacea66%
Mollusca9%
Other Insecta7%
Chironomidae91%
Other Diptera9%
Other Insecta
7%Mollusca2%
Crustacea1%
Ephemeroptera39% Diptera
43%
OtherNon-Insecta
8%
Simulidae24%
Other Diptera2% Chironomidae
74%
Springs
Streams
A
B
Figure 34. Relative abundances of aquatic taxa in springs (A) and streams (B) at the Ibapah study area.
OtherNon-Insecta
3%
Diptera59%
Ephemeroptera19%
Crustacea4%
Mollusca8%
OtherInsecta
7%
Chironomidae63%
Simulidae35%
Other Diptera2%
Figure 35. Relative abundances of aquatic taxa in streams at the Vernon study area.
nity analysis (fig. 37). The lowest abundance in the untreated zone was at Keg Springs, which was sampled in May 2005; and the highest abundance in the untreated zone was at this same sampling site in October 2005. This high abundance was in large part due to the presence of 7,306 individual Cladocera in the sample. Seasonal changes in species composition and abundance are further addressed in the section discussing pre- and post-treatment aquatic communities.
IbapahIbapah was sprayed in 2004 but not 2005 (the year we
sampled). There was no significant difference in abundance
(Kruskall Wallis chi-square=0.5345; P=0.4647) or richness (Kruskall Wallis chi-square=1.866; P=0.1719) between sites inside and outside of the treatment zone. Richness was fairly consistent across all sites (fig. 38). Sites outside the treatment zone at Ibapah included two streams and three springs; inside the treatment zone, we were able to locate and sample streams but no springs. The difference in habitat type may confound the analysis of pesticide effect on abundance because the three springs (all outside of the treatment zone) had substantially higher abundance than any of the streams. One spring site (SKSP) had more than 27,000 individuals (of these, 21,086 were Ostracoda), a second spring site (SOXSP) had almost 10,000 individuals (with no taxa particularly dominant), and

42 Mormon Cricket Control in Utah’s West Desert—Evaluation of Impacts of the Pesticide Diflubenzuron
a third spring site (NOXSP) had more than 5,000 individuals (with no taxa particularly dominant). The next most abundant sample was 2,550 individuals at a stream site within the treat-ment zone. The remaining stream sites had less than 1,700 individuals.
VernonVernon also was sprayed in 2004 but not in 2005. All
sampling sites at Vernon were classified as streams for this study. However, some sites were streams (and, thus, were buffered from spraying) and some were ditches (and were not buffered from spraying). There was no significant difference in abundance (Kruskall Wallis chi-square=1.5; P=0.2207) between sites inside and outside of the treatment zone, even considering ditches versus streams. Again, abundance was highly variable among sites in both the treated and untreated
zones (fig. 39). Two sites outside the treatment zone each had approximately 20,000 individuals. More than half of the individuals at LFST (11,743) were Micropsectra sp. midges. Abundance was fairly evenly distributed among taxa at PCST, with the two most dominant taxa being Simulium sp. and Micropsectra sp. The next largest abundances were approxi-mately 10,000 individuals each at one treated site and one untreated site.
Richness was significantly higher (Kruskall Wallis chi-square=6.0504; P=0.0139) in the untreated zone than in the treated zone, and higher in the actual streams than in the ditches. This may indicate an effect of pesticide spraying, but the dif-ference in elevation again confounds this interpretation. Sites in untreated zones at Vernon had elevations ranging from 597 to 644 m, and sites in treatment zones ranged in elevation from 532 to 576 m. This elevation gradient also represents a gradient in habitat quality that would influence community composition.
0
5
10
15
20
25
30
35
40
0
0.2
0.4
0.6
0.8
1
1.2
1.4
RBN
ST 6
/22
NFR
ST 1
0/7
LRSP
6/2
2
LRSP
10/
7
KGSP
6/2
3
KG
SP
10/7
RB
TST
6/22
CLS
P1 1
0/7
CLS
P2 6
/23
CLS
P2
10/7
CM
SP1
6/2
4
CM
SP1
10/
7
CM
SP2
6/2
4
CM
SP2
10/
7
Diversity
Ric
hnes
s
0
2000
4000
6000
8000
10000
12000
14000Untreated ZoneTreated Zone
RB
NST
6/2
2
NFR
ST
10/7
LRS
P 6/
22
LRS
P 10
/7
KGSP
6/2
3
KGSP
10/
7
RBT
ST 6
/22
CLS
P1 1
0/7
CLS
P2
6/23
CLS
P2 1
0/7
CM
SP1
6/2
4
CM
SP
1 10
/7
CM
SP
2 6/
24
CM
SP2
10/
7
Abu
ndan
ce
Div
ersi
ty
A
B
Figure 36. Taxa abundance (A) and richness and diversity (B) inside and outside diflubenzuron treatment zones at Grouse Creek, only after treatment.

Aquatic Results 43
Macroinvertebrates in the Grouse Creek Treatment Zone
Grouse Creek, the only study area treated in 2005, was sampled three times during this study. We sampled before treatment, 2 weeks after treatment, and 4 months after treat-ment. Sampling site RBTST was dried up 3 months after treatment, so we were unable to sample there. We also did not sample at CLSP1 2 weeks after treatment. Generally, abun-dance and richness increased from pre-treatment samples to 2-week post-treatment samples, and decreased from 2-week post-treatment samples to 3-month post-treatment samples (fig. 40). This pattern of changing abundance and richness is most likely due to natural temporal variation, whereby aquatic invertebrate populations peak in the month of June and their populations decrease again with colder weather in October. Consequently, evaluation of any effects of diflubenzuron application is confounded by temporal phenology (change dur-ing the season) in aquatic communities.
Aquatic Community Structure
We used NMS to evaluate community structure at the three study areas. The NMS was run on relative abundance data using the Sorensen distance measure, allowing a maxi-mum number of 6 axes (dimensions). A two-dimensional solu-tion was selected as the best-fit model.
In an NMS plot, sites with similar taxa plot close to each other. Results of the NMS analysis generated two major groupings, stream communities and spring communities (fig. 41). Cladocera, Callibaetis sp., Enallagma sp., Sympetrum sp., Notonecta sp., Erythemis sp., and Ostracoda are charac-teristic of springs. Baetis tricaudatus, Pagastia sp., Ameletus sp., Micropsectra sp., and Simulium sp. are characteristic of streams. Ostracoda grouped the Grouse Creek spring samples taken in May and June with one Ibapah spring (SKSP), while the other spring-driven species listed above grouped the Grouse Creek springs collected in October with the other two Ibapah springs, NOXSP and SOXSP. Ibapah streams grouped separately from Grouse Creek and Vernon streams.
0
5
10
15
20
25
30
35
40
0
0.2
0.4
0.6
0.8
1
1.2
1.4
RBN
ST 6
/2
RBN
ST 6
/22
NFR
ST 1
0/7
LRSP
6/2
LRSP
6/2
2
LRSP
10/
7
KGSP
5/2
5
KGSP
6/2
3
KGSP
10/
7
RBT
ST 5
/27
RBT
ST 6
/22
CLS
P1 5
/26
CLS
P1 1
0/7
CLS
P2 6
/23
CLS
P2 1
0/7
CM
SP1
5/2
4
CM
SP1
6/2
4
CM
SP1
10/
7
CM
SP2
5/2
4
CM
SP2
6/2
4
CM
SP2
10/
7Diversity
Ric
hnes
s
0
2000
4000
6000
8000
10000
12000
14000
RBN
ST 6
/2
RBN
ST 6
/22
NFR
ST 1
0/7LR
SP 6
/2
LRSP
6/2
2
LRSP
10/
7
KGSP
5/2
5 KGSP
6/2
3
KGSP
10/
7
RBT
ST 5
/27
RBT
ST 6
/22
CLS
P1 5
/26
CLS
P1 1
0/7
CLS
P2 6
/23
CLS
P2 1
0/7 C
MS
P1 5
/24
CM
SP1
6/2
4
CM
SP1
10/
7
CM
SP2
5/2
4
CM
SP2
6/2
4
CM
SP2
10/
7
Abu
ndan
ce
Untreated ZoneTreated Zone
Div
ersi
ty
A
B
Figure 37. Taxa abundance (A) and richness and diversity (B) inside and outside diflubenzuron treatment zones at Grouse Creek, all sampling dates included.

44 Mormon Cricket Control in Utah’s West Desert—Evaluation of Impacts of the Pesticide Diflubenzuron
Discussion
Terrestrial Study
Our results indicate that nontarget arthropods vary considerably in susceptibility to diflubenzuron when used to control Mormon cricket populations in the Great Basin. Sensitivity to diflubenzuron is not necessarily predictable on a taxonomic basis or on an assessment of life history traits. Our data indicate that some taxa assumed not to be susceptible did have population differences that correlated with treat-ment zones. The importance of identifying specimens to the lowest possible taxonomic level in analyzing results should be emphasized, as conclusions may be very different depend-ing on how the arthropods are classified (for example, counts
at family versus genus level). A total of 42 comparisons of untreated abundance versus treated abundance were possible for the three study areas. Nine of these comparisons showed significant differences between treatment zones; another nine comparisons indicated large, but not statistically significant, differences. In all 18 instances, more individuals were col-lected in the untreated zone.
At the order level, no consistent patterns of difference in proportional representation between treated and untreated sites at any of the three study areas indicate that treatment with diflubenzuron affects nontarget arthropods. Our results are not conclusive, however, because there is tremendous varia-tion between individual sites within each treatment type, and because order-level resolution may mask changes in commu-nities at lower taxonomic levels. For example, shifts between genera or from one family to another may not be detected if one taxon replaces another with a similar number of individu-als. In addition, there may have been confounding effects from
0
5
10
15
20
25
30
35
0
0.2
0.4
0.6
0.8
1
1.2
BCS
T 7/
13
SKSP
7/1
3
NO
XS
P 7/
13
SOX
SP
7/13
DC
ST
7/14
MC
ST
7/12
IJC
ST 7
/13
JCST
7/1
3
SDST
7/1
3
ICST
7/1
4
Diversity
Ric
hnes
s
0
5000
10000
15000
20000
25000
30000
BCS
T 7/
13
SKS
P 7/
13
NO
XS
P 7/
13
SOX
SP 7
/13
DC
ST 7
/14
MC
ST 7
/12
IJC
ST
7/13
JCST
7/1
3
SDS
T 7/
13
ICST
7/1
4
Untreated ZoneTreated Zone
Abu
ndan
ce
Div
ersi
ty
A
B
Figure 38. Taxa abundance (A) and richness and diversity (B) inside and outside diflubenzuron treatment zones at Ibapah.
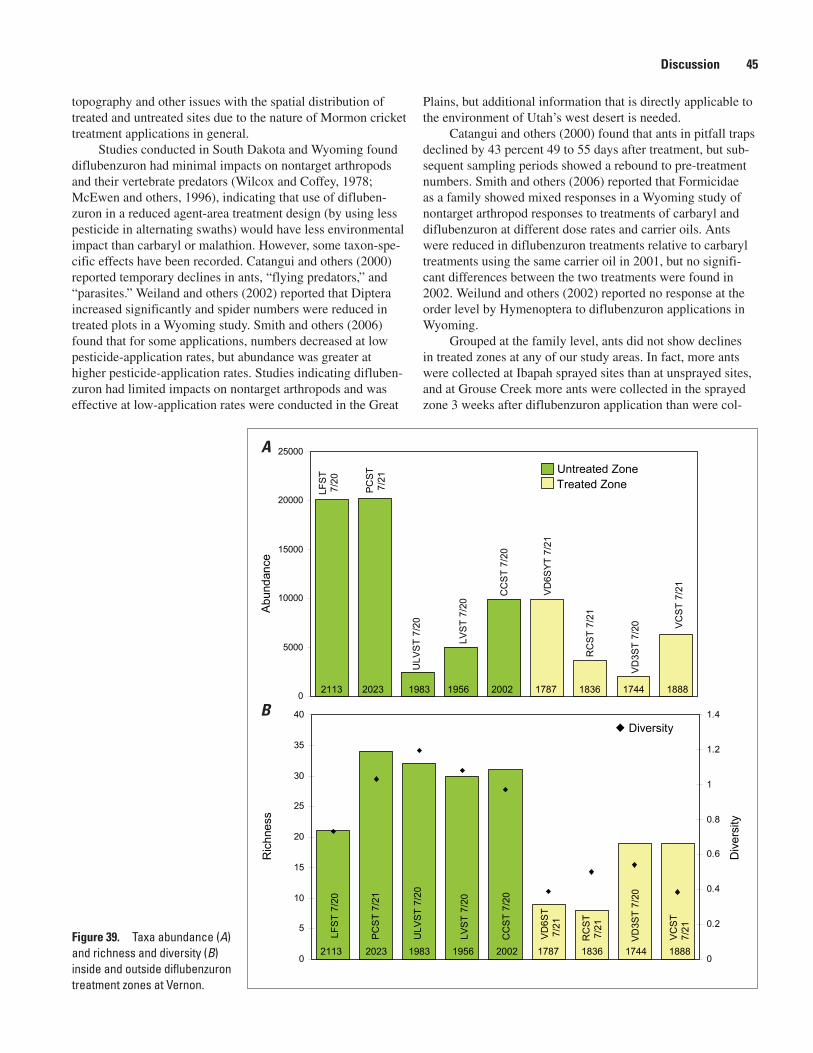
Discussion 45
topography and other issues with the spatial distribution of treated and untreated sites due to the nature of Mormon cricket treatment applications in general.
Studies conducted in South Dakota and Wyoming found diflubenzuron had minimal impacts on nontarget arthropods and their vertebrate predators (Wilcox and Coffey, 1978; McEwen and others, 1996), indicating that use of difluben-zuron in a reduced agent-area treatment design (by using less pesticide in alternating swaths) would have less environmental impact than carbaryl or malathion. However, some taxon-spe-cific effects have been recorded. Catangui and others (2000) reported temporary declines in ants, “flying predators,” and “parasites.” Weiland and others (2002) reported that Diptera increased significantly and spider numbers were reduced in treated plots in a Wyoming study. Smith and others (2006) found that for some applications, numbers decreased at low pesticide-application rates, but abundance was greater at higher pesticide-application rates. Studies indicating difluben-zuron had limited impacts on nontarget arthropods and was effective at low-application rates were conducted in the Great
Plains, but additional information that is directly applicable to the environment of Utah’s west desert is needed.
Catangui and others (2000) found that ants in pitfall traps declined by 43 percent 49 to 55 days after treatment, but sub-sequent sampling periods showed a rebound to pre-treatment numbers. Smith and others (2006) reported that Formicidae as a family showed mixed responses in a Wyoming study of nontarget arthropod responses to treatments of carbaryl and diflubenzuron at different dose rates and carrier oils. Ants were reduced in diflubenzuron treatments relative to carbaryl treatments using the same carrier oil in 2001, but no signifi-cant differences between the two treatments were found in 2002. Weilund and others (2002) reported no response at the order level by Hymenoptera to diflubenzuron applications in Wyoming.
Grouped at the family level, ants did not show declines in treated zones at any of our study areas. In fact, more ants were collected at Ibapah sprayed sites than at unsprayed sites, and at Grouse Creek more ants were collected in the sprayed zone 3 weeks after diflubenzuron application than were col-
0
5
10
15
20
25
30
35
40
0
0.2
0.4
0.6
0.8
1
1.2
1.4
LFST
7/2
0
PC
ST
7/21
ULV
ST 7
/20
LVS
T 7/
20
CC
ST 7
/20
VD
6ST
7/21
RC
ST7/
21
VD3S
T 7/
20
VC
ST
7/21
Diversity
Ric
hnes
s
0
5000
10000
15000
20000
25000
2113 2023 1983 1956 2002 1787 1836 1744 1888
LFST
7/20
PCST
7/21
ULV
ST
7/20
LVST
7/2
0
CC
ST
7/20
VD
6SYT
7/2
1
RC
ST 7
/21
VD
3ST
7/20 VC
ST 7
/21
Untreated ZoneTreated Zone
Abu
ndan
ce
2113 2023 1983 1956 2002 1787 1836 1744 1888
Div
ersi
ty
A
B
Figure 39. Taxa abundance (A) and richness and diversity (B) inside and outside diflubenzuron treatment zones at Vernon.

46 Mormon Cricket Control in Utah’s West Desert—Evaluation of Impacts of the Pesticide Diflubenzuron
lected prior to treatment. However, when examined at the genus level, differences in abundance were correlated with diflubenzuron treatment. Some genera (for example, Forelius) had higher numbers in sprayed zones, while the abundance of other genera (for example, Tapinoma) was lower in sprayed zones. Potential indicators in the ant communities we sampled include genera that appear to decrease in response to difluben-zuron treatment and those that increase. Formica and Tapi-noma tended to have lower numbers in treated zones, while Forelius and perhaps Pheidole tended to increase in treated zones.
Ants perform a number of important ecological func-tions, especially in arid and semiarid ecosystems (Greenslade, 1976; Risch and Carroll, 1982; Lobry de Bruyn and Conacher, 1990; Lobry de Bruyn and Conacher, 1994; Nash and others, 1998; Whitford and others, 1999). Predictions of the sensitiv-ity of ants to environmental perturbations and restorations and, thus, their value as bioindicators have not been consistently supported (Bestelmeyer and Wiens, 1996; Whitford and oth-ers, 1999; Read and Andersen, 2000; Nash and others, 2001; Andersen and others, 2002; Andersen and Majer, 2004; Nash and others, 2004). Because ants perform significant functions
in ecosystems, it is important to understand how individual species and collective units at functional group and commu-nity levels respond to disturbance, and how they recover from perturbation in the short and long term.
Diflubenzuron may be a factor in developing ant com-munity structure at Ibapah and Vernon. However, pesticide treatments could be correlated with other environmental factors we did not measure that made these sites favorable for Forelius and, perhaps, less favorable for Formica and Tapi-noma. There are potential confounding effects of topography based on where and how diflubenzuron was applied. Ibapah treated sites were all south of untreated sites, and most were a little higher in elevation. These conditions were reversed at Vernon, however, where untreated sites were higher and south of the treated area; elevation differences were greater at Ver-non than at Ibapah. Similarities among ant communities from treated zones at Ibapah and Vernon, despite environmental differences between them, suggest a role for diflubenzuron in structuring ant communities in the treated zones. Untreated-zone communities at Ibapah and Vernon study areas differed; each untreated site within the Ibapah and Vernon study areas had different ant communities (fig. 21). Convergence of
0
5
10
15
20
25
30
35
RBT
ST 5
/27
RBT
ST 6
/22
CLS
P1 5
/26
CLS
P1 1
0/7
CM
SP1
5/2
5
CM
SP1
6/2
4
CM
SP1
10/
7
CM
SP2
5/2
5
CM
SP2
6/2
4
CM
SP2
10/
7
Ric
hnes
s
0
2000
4000
6000
8000
10000
12000
RBT
ST 5
/27
RBT
ST 6
/22
CLS
P1 5
/26
CLS
P1 1
0/7
CM
SP1
5/2
5 CM
SP1
6/2
4
CM
SP1
10/
7
CM
SP2
5/2
5
CM
SP2
6/2
4
CM
SP2
10/
7
Abu
ndan
ce
pre-treatment samples2 week post-treatment samples3 month post-treatment samples
A
B
Figure 40. Taxa abundance (A) and richness (B) before diflubenzuron treatment, 2 weeks after treatment, and 4 months after treatment, at the Grouse Creek study area.

Discussion 47
communities in the treated zones indicates a possible link to diflubenzuron treatment. Additional research is needed, espe-cially a study designed to address the possibility of lag effects of diflubenzuron on the ant communities, and ants should be identified to species level to elucidate ecological functions that might be affected by changes in ant community structure in response to diflubenzuron application.
Non-ant Hymenoptera (including bees and predatory and parasitic wasps) were significantly lower in treated zones at Grouse Creek and Vernon. Coleoptera demonstrated the same pattern as non-ant Hymenoptera, with significantly fewer bee-tles at treated sites at Vernon and a trend toward more beetles at untreated sites in the Ibapah study area. Flies also were significantly reduced at Vernon and showed a trend toward declining numbers at treated sites at Ibapah. Catangui and others (2000) reported that diflubenzuron reduced the number of flying predators by 59 percent 15 to 20 days after treatment, however, numbers rebounded in subsequent samples. Parasite numbers also were reduced (by about 18 percent) 35 to 41 days after treatment, but abundance returned to near-control levels after 41 days (Catangui and others, 2000). Flying insects classified as parasites included both Hymenoptera and Diptera; flying insects classified as predators included Hymenoptera, Diptera, and Coleoptera (Catangui and others, 2000).
Hemiptera showed large differences in abundance among sites, and large changes over time were observed at Grouse Creek. Some differences were correlated with treatment zone; more Hemiptera and more of particular families were found in the untreated zones in all three study areas. Smith and others (2006) found the Hemiptera had mixed responses to various treatments, but some diflubenzuron treatments did reduce Hemiptera numbers.
Within the Hemiptera, there was some indication that the Lygaeidae (seed bugs), in particular, were sensitive to diflubenzuron treatments. Lygaeidae were absent at Grouse Creek from all late May and early June samples, probably because of phenology. No seed bugs were found in any traps from treated sites during the late June collection period, but they were caught consistently, albeit at low numbers, in the untreated zone during this sampling period. The seed bugs at Grouse Creek and Ibapah showed a trend toward reduced numbers in the treated zones; differences in numbers of seed bugs between zones were significant at both study areas. There were large differences in total numbers of seed bugs at Vernon (63 in the untreated zone, 32 in the treated zone), but the differences were not significant because of high variability among sites. Seed bugs represented a relatively small compo-nent of the arthropod community at all three study areas. The
RBNST 6/2
RBNST 6/22NFRST 10/7
RBTST 5/27
RBTST 6/22
CLSP1 5/26
CLSP1 10/7
CLSP2 6/23
CLSP2 10/7
LRSP 6/2
LRSP 6/22
LRSP 10/7
CMSP1 5/25CMSP1 6/24
CMSP1 10/7
CMSP2 5/25CMSP2 6/24
CMSP2 10/7
KGSP 5/25KGSP 6/23
KGSP 10/7
SKSP 7/13
BCST 7/13
MCST 7/12IJCST 7/13
JCST 7/13
SDST 7/13
ICST 7/14
NOXSP 7/13
SOXSP 7/13
DCST 7/14
VD6ST 7/1RCST 7/21
LFST 7/20 VD3ST 7/20
PCST 7/21ULVST 7/20
CCST 7/20
LVST 7/20
VCST 7/21
Ameletus sp.
Baetis tricaudatus
Callibaetis sp.
Erythemis sp. Sympetrum sp.
Enallagma sp.
Notonecta sp.
Micropsectra sp.
Pagastia sp.
Simulium sp.
Cladocera
Ostracoda
Axis 1
Axi
s 2
Figure 41. Nonmetric multidimensional scaling joint plot with aquatic macroinvertebrate relative taxa abundances. Dark green, Grouse Creek springs; light green, Ibapah springs; dark blue, Grouse Creek streams; light blue, Ibapah streams; purple, Vernon streams.

48 Mormon Cricket Control in Utah’s West Desert—Evaluation of Impacts of the Pesticide Diflubenzuron
ecological impact of changes in Lygaeidae numbers, if they are affected by diflubenzuron, is probably relatively minor given the small population of bugs that will be affected.
Scorpions and solifugids are large, nocturnal predators that forage on the ground. Scorpions and solifugids compete for food (Polis and McCormick; 1986a, Polis and others, 1989). Polis and McCormick (1986a) found that scorpions and solifugids also prey on each other. Thus, it is not surprising to find an inverse correlation between scorpion and solifugid abundance. This correlation was seen among the untreated sites at Ibapah. The association is reversed among plots treated with diflubenzuron in 2004. The data indicate that, rather than some interaction between scorpions and solifugids in the presence of diflubenzuron, scorpions may simply be more sensitive to diflubenzuron than solifugids. There was a dramatic decline in scorpion numbers in treated sites com-pared to untreated sites, while solifugid abundance remained unchanged. In the 4 untreated areas, 34 solifugids were found in traps, and 40 solifugids were caught in the traps in the treated zone. Only 6 scorpions were caught within the treated zone, while 24 scorpions were trapped in the untreated zone.
Scorpion life histories may make them more susceptible to exposure to diflubenzuron. Young scorpions molt more fre-quently than older individuals (Polis and McCormick, 1986b); if more young individuals are present during treatment peri-ods, the numbers could be affected. Another possibility is that scorpions’ prey may have been affected more than the solif-ugids’ prey. Thus, scorpion numbers declined, but solifugid numbers remained relatively unchanged in the treatment zone. At least one group of large, potential prey showed concomi-tant declines at the treated sites at Ibapah; Orthoptera were roughly one-third as abundant at treated sites as at untreated sites (62 total at the 4 treated sites compared to 172 total at the 4 untreated sites, fig. 16H). The relative importance of Orthoptera in scorpion and solifugid diets should be explored to test this hypothesis.
Scorpions eat solifugids and solifugids eat scorpions. In the Coachella Valley of California, Polis and McCormick (1986a) found the diet of the scorpion Paruroctonus mesaen-sis consisted of up to 14.4 percent solifugids and up to 65.4 percent intraguild prey (spiders, scorpions, and solifugids). However, in an experiment in which scorpions were removed from experimental plots and the numbers of solifugids and spiders were sampled spring and fall for 2 years, no significant increases in numbers or size of solifugids were observed in the removal plots compared to the control plots where scorpi-ons were not removed (Polis and McCormick, 1986b). In our study, solifugid numbers did not differ in treated and untreated zones despite a fourfold difference in scorpion numbers, which is consistent with the findings of Polis and McCormick (1986b) that indicate solifugids do not show a numerical response to reduction or removal of a potential competitor/predator.
The importance of scorpions in Great Basin sagebrush communities has not been well studied, but they can be extremely abundant in some systems (Polis and McCormick,
1986a) and may play a significant role in population regulation of other arthropods in arid and semiarid ecosystems. Research is needed to clarify the impact of scorpions on the arthropod community, especially experiments in which scorpions are removed from large plots and other arthropods are monitored.
Numbers of beetles in the families Carabidae and Ten-ebrionidae were reduced shortly after diflubenzuron treat-ment (Catangui and others, 2000). Smith and others (2006) reported that tenebrionid beetles (collected in pitfall traps) and Coleoptera (collected with sweep nets) showed some differ-ences in response to a variety of carbaryl and diflubenzuron treatments. Coleoptera collected in sweep nets had the most consistent response to diflubenzuron and carbaryl, with fewer beetles caught in all insecticide applications compared to the control plots. We found significant reductions in beetles at Vernon and markedly fewer beetles at Ibapah, indicating there may be long-term effects on beetles from diflubenzuron appli-cation in the Great Basin.
Ants and beetles are major components of sage grouse chick diets, as are many Orthoptera (Klebenow and Gray, 1968; Peterson, 1970; Pyle and Crawford, 1996; Drut and others, 1994). Few food-habit studies of sage grouse chicks have been done, and many lump invertebrates found in bird stomachs into very basic categories (for example, “beetles” or “worms”); thus, it is difficult to assess from these studies the potential effect of changes in arthropod communities from diflubenzuron application on sage grouse population dynam-ics. Because chicks concentrate on insects and other arthro-pods during the first month after hatching, even a temporary decline in numbers, such as those reported by Catangui and others (2000), could have a significant impact on sage grouse chick survival. Sample and others (1993) found that five spe-cies of songbirds in diflubenzuron-treated sites had signifi-cantly different and potentially less nutritious diets compared to songbirds in untreated sites, and two species in treated sites had significantly less invertebrate biomass in their stomachs. Whitmore and others (1993) found seven of nine bird spe-cies tested on diflubenzuron-treated plots had lower fat levels than those on untreated plots due to reductions in invertebrate prey populations, increased foraging costs, reduction in food quality, or some combination of the three. Bell and Whit-more (1997) reported lower numbers of birds of most species in plots that had been treated with diflubenzuron, and they attributed this to a reduction in habitat quality related to prey availability in treated forest plots.
Our temporal comparisons, while covering the critical insectivore phase of sage grouse chick life history (Drut and others, 1994), did not yield definitive results because of the extreme variability in sites and taxa response to diflubenzuron and the uncertainty of sage grouse chick food preferences. However, diflubenzuron application to control Orthoptera has the potential to affect sage grouse chick foraging by altering prey-species composition and/or abundance. Survival of chicks has been shown to be critical for sustainable sage grouse popu-lations (Johnson and Boyce, 1990). Additional work is needed to clarify whether diflubenzuron affects sage grouse chick
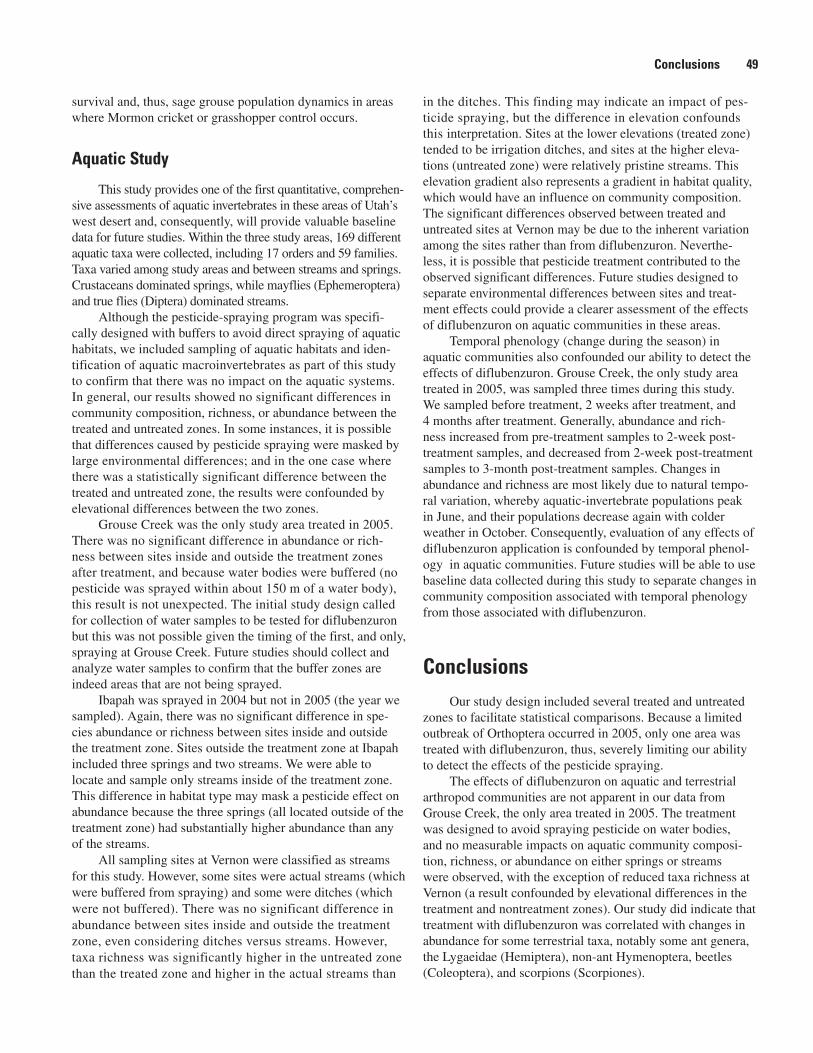
Conclusions 49
survival and, thus, sage grouse population dynamics in areas where Mormon cricket or grasshopper control occurs.
Aquatic Study
This study provides one of the first quantitative, comprehen-sive assessments of aquatic invertebrates in these areas of Utah’s west desert and, consequently, will provide valuable baseline data for future studies. Within the three study areas, 169 different aquatic taxa were collected, including 17 orders and 59 families. Taxa varied among study areas and between streams and springs. Crustaceans dominated springs, while mayflies (Ephemeroptera) and true flies (Diptera) dominated streams.
Although the pesticide-spraying program was specifi-cally designed with buffers to avoid direct spraying of aquatic habitats, we included sampling of aquatic habitats and iden-tification of aquatic macroinvertebrates as part of this study to confirm that there was no impact on the aquatic systems. In general, our results showed no significant differences in community composition, richness, or abundance between the treated and untreated zones. In some instances, it is possible that differences caused by pesticide spraying were masked by large environmental differences; and in the one case where there was a statistically significant difference between the treated and untreated zone, the results were confounded by elevational differences between the two zones.
Grouse Creek was the only study area treated in 2005. There was no significant difference in abundance or rich-ness between sites inside and outside the treatment zones after treatment, and because water bodies were buffered (no pesticide was sprayed within about 150 m of a water body), this result is not unexpected. The initial study design called for collection of water samples to be tested for diflubenzuron but this was not possible given the timing of the first, and only, spraying at Grouse Creek. Future studies should collect and analyze water samples to confirm that the buffer zones are indeed areas that are not being sprayed.
Ibapah was sprayed in 2004 but not in 2005 (the year we sampled). Again, there was no significant difference in spe-cies abundance or richness between sites inside and outside the treatment zone. Sites outside the treatment zone at Ibapah included three springs and two streams. We were able to locate and sample only streams inside of the treatment zone. This difference in habitat type may mask a pesticide effect on abundance because the three springs (all located outside of the treatment zone) had substantially higher abundance than any of the streams.
All sampling sites at Vernon were classified as streams for this study. However, some sites were actual streams (which were buffered from spraying) and some were ditches (which were not buffered). There was no significant difference in abundance between sites inside and outside the treatment zone, even considering ditches versus streams. However, taxa richness was significantly higher in the untreated zone than the treated zone and higher in the actual streams than
in the ditches. This finding may indicate an impact of pes-ticide spraying, but the difference in elevation confounds this interpretation. Sites at the lower elevations (treated zone) tended to be irrigation ditches, and sites at the higher eleva-tions (untreated zone) were relatively pristine streams. This elevation gradient also represents a gradient in habitat quality, which would have an influence on community composition. The significant differences observed between treated and untreated sites at Vernon may be due to the inherent variation among the sites rather than from diflubenzuron. Neverthe-less, it is possible that pesticide treatment contributed to the observed significant differences. Future studies designed to separate environmental differences between sites and treat-ment effects could provide a clearer assessment of the effects of diflubenzuron on aquatic communities in these areas.
Temporal phenology (change during the season) in aquatic communities also confounded our ability to detect the effects of diflubenzuron. Grouse Creek, the only study area treated in 2005, was sampled three times during this study. We sampled before treatment, 2 weeks after treatment, and 4 months after treatment. Generally, abundance and rich-ness increased from pre-treatment samples to 2-week post-treatment samples, and decreased from 2-week post-treatment samples to 3-month post-treatment samples. Changes in abundance and richness are most likely due to natural tempo-ral variation, whereby aquatic-invertebrate populations peak in June, and their populations decrease again with colder weather in October. Consequently, evaluation of any effects of diflubenzuron application is confounded by temporal phenol-ogy in aquatic communities. Future studies will be able to use baseline data collected during this study to separate changes in community composition associated with temporal phenology from those associated with diflubenzuron.
ConclusionsOur study design included several treated and untreated
zones to facilitate statistical comparisons. Because a limited outbreak of Orthoptera occurred in 2005, only one area was treated with diflubenzuron, thus, severely limiting our ability to detect the effects of the pesticide spraying.
The effects of diflubenzuron on aquatic and terrestrial arthropod communities are not apparent in our data from Grouse Creek, the only area treated in 2005. The treatment was designed to avoid spraying pesticide on water bodies, and no measurable impacts on aquatic community composi-tion, richness, or abundance on either springs or streams were observed, with the exception of reduced taxa richness at Vernon (a result confounded by elevational differences in the treatment and nontreatment zones). Our study did indicate that treatment with diflubenzuron was correlated with changes in abundance for some terrestrial taxa, notably some ant genera, the Lygaeidae (Hemiptera), non-ant Hymenoptera, beetles (Coleoptera), and scorpions (Scorpiones).
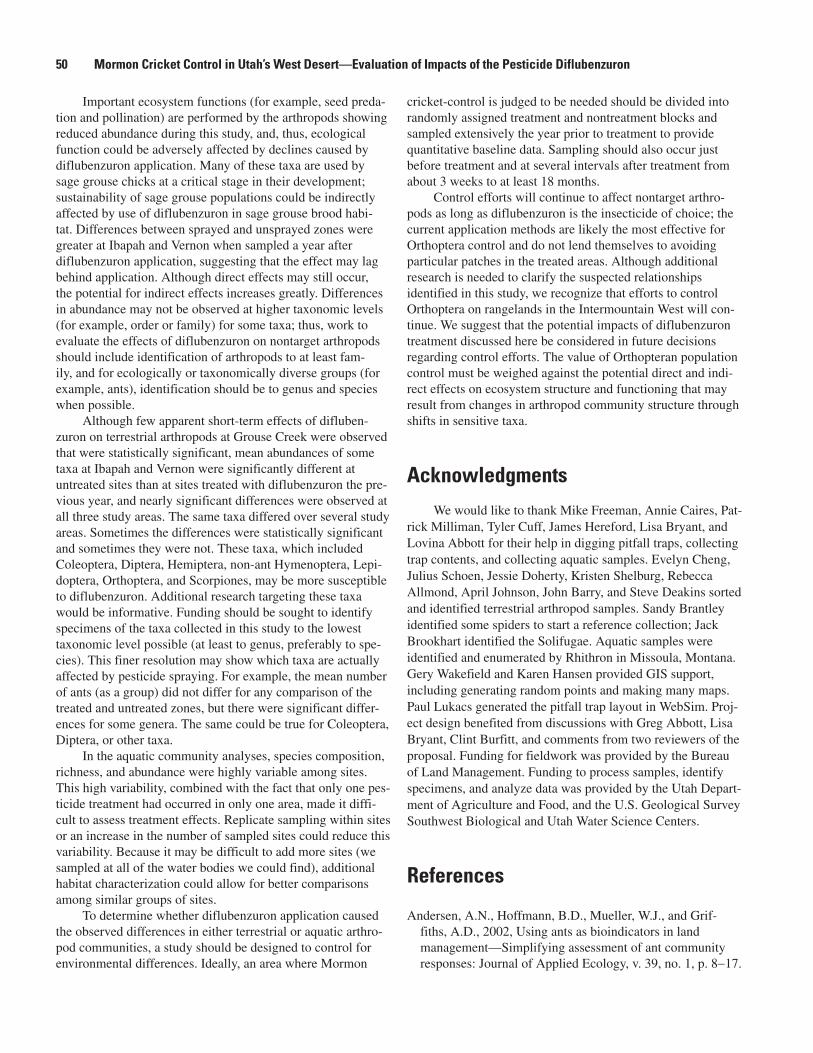
50 Mormon Cricket Control in Utah’s West Desert—Evaluation of Impacts of the Pesticide Diflubenzuron
Important ecosystem functions (for example, seed preda-tion and pollination) are performed by the arthropods showing reduced abundance during this study, and, thus, ecological function could be adversely affected by declines caused by diflubenzuron application. Many of these taxa are used by sage grouse chicks at a critical stage in their development; sustainability of sage grouse populations could be indirectly affected by use of diflubenzuron in sage grouse brood habi-tat. Differences between sprayed and unsprayed zones were greater at Ibapah and Vernon when sampled a year after diflubenzuron application, suggesting that the effect may lag behind application. Although direct effects may still occur, the potential for indirect effects increases greatly. Differences in abundance may not be observed at higher taxonomic levels (for example, order or family) for some taxa; thus, work to evaluate the effects of diflubenzuron on nontarget arthropods should include identification of arthropods to at least fam-ily, and for ecologically or taxonomically diverse groups (for example, ants), identification should be to genus and species when possible.
Although few apparent short-term effects of difluben-zuron on terrestrial arthropods at Grouse Creek were observed that were statistically significant, mean abundances of some taxa at Ibapah and Vernon were significantly different at untreated sites than at sites treated with diflubenzuron the pre-vious year, and nearly significant differences were observed at all three study areas. The same taxa differed over several study areas. Sometimes the differences were statistically significant and sometimes they were not. These taxa, which included Coleoptera, Diptera, Hemiptera, non-ant Hymenoptera, Lepi-doptera, Orthoptera, and Scorpiones, may be more susceptible to diflubenzuron. Additional research targeting these taxa would be informative. Funding should be sought to identify specimens of the taxa collected in this study to the lowest taxonomic level possible (at least to genus, preferably to spe-cies). This finer resolution may show which taxa are actually affected by pesticide spraying. For example, the mean number of ants (as a group) did not differ for any comparison of the treated and untreated zones, but there were significant differ-ences for some genera. The same could be true for Coleoptera, Diptera, or other taxa.
In the aquatic community analyses, species composition, richness, and abundance were highly variable among sites. This high variability, combined with the fact that only one pes-ticide treatment had occurred in only one area, made it diffi-cult to assess treatment effects. Replicate sampling within sites or an increase in the number of sampled sites could reduce this variability. Because it may be difficult to add more sites (we sampled at all of the water bodies we could find), additional habitat characterization could allow for better comparisons among similar groups of sites.
To determine whether diflubenzuron application caused the observed differences in either terrestrial or aquatic arthro-pod communities, a study should be designed to control for environmental differences. Ideally, an area where Mormon
cricket-control is judged to be needed should be divided into randomly assigned treatment and nontreatment blocks and sampled extensively the year prior to treatment to provide quantitative baseline data. Sampling should also occur just before treatment and at several intervals after treatment from about 3 weeks to at least 18 months.
Control efforts will continue to affect nontarget arthro-pods as long as diflubenzuron is the insecticide of choice; the current application methods are likely the most effective for Orthoptera control and do not lend themselves to avoiding particular patches in the treated areas. Although additional research is needed to clarify the suspected relationships identified in this study, we recognize that efforts to control Orthoptera on rangelands in the Intermountain West will con-tinue. We suggest that the potential impacts of diflubenzuron treatment discussed here be considered in future decisions regarding control efforts. The value of Orthopteran population control must be weighed against the potential direct and indi-rect effects on ecosystem structure and functioning that may result from changes in arthropod community structure through shifts in sensitive taxa.
AcknowledgmentsWe would like to thank Mike Freeman, Annie Caires, Pat-
rick Milliman, Tyler Cuff, James Hereford, Lisa Bryant, and Lovina Abbott for their help in digging pitfall traps, collecting trap contents, and collecting aquatic samples. Evelyn Cheng, Julius Schoen, Jessie Doherty, Kristen Shelburg, Rebecca Allmond, April Johnson, John Barry, and Steve Deakins sorted and identified terrestrial arthropod samples. Sandy Brantley identified some spiders to start a reference collection; Jack Brookhart identified the Solifugae. Aquatic samples were identified and enumerated by Rhithron in Missoula, Montana. Gery Wakefield and Karen Hansen provided GIS support, including generating random points and making many maps. Paul Lukacs generated the pitfall trap layout in WebSim. Proj-ect design benefited from discussions with Greg Abbott, Lisa Bryant, Clint Burfitt, and comments from two reviewers of the proposal. Funding for fieldwork was provided by the Bureau of Land Management. Funding to process samples, identify specimens, and analyze data was provided by the Utah Depart-ment of Agriculture and Food, and the U.S. Geological Survey Southwest Biological and Utah Water Science Centers.
References
Andersen, A.N., Hoffmann, B.D., Mueller, W.J., and Grif-fiths, A.D., 2002, Using ants as bioindicators in land management—Simplifying assessment of ant community responses: Journal of Applied Ecology, v. 39, no. 1, p. 8−17.

References 51
Andersen, A.N., and Majer, J.D., 2004, Ants show the way down under—Invertebrates as bioindicators in land manage-ment: Frontiers in Ecology and Environment, v. 2, no. 6, p. 291−298.
Bell, J.L., and Whitmore, R.C., 1997, Bird populations and habitat in Bacillus thuringiensis and dimilin-treated and untreated areas of hardwood forest: American Midland Naturalist, no. 137, p. 239–250.
Bestelmeyer, B.T., and Wiens, J.A., 1996, The effects of land use on the structure of ground-foraging ant communities in the Argentine Chaco: Ecological Applications, v. 6, no. 4, p. 1225−1240.
Buckland, S.T., Anderson, D.R., Burnham, K.P., Laake, J.L., Borchers, D.L., and Thomas, L., eds., 2001, Introduction to distance sampling—Estimating abundance of biological populations: Oxford, United Kingdom, Oxford University Press, 423 p.
Buckley, R., 1987, Ant-plant-homopteran interactions: Advances in Ecological Research, v. 16, p. 53−85.
Catangui, M.A., Fuller, B.W., and Walz, A.W., 2000, VII.3 Impact of Dimilin® on nontarget arthropods and its efficacy against rangeland grasshoppers, in Cunningham, G.L., and Sampson, M.W., eds., Grasshopper Integrated Pest Manage-ment User Handbook: Washington, D.C., U.S. Department of Agriculture, Animal and Plant Health Inspection Service, p. 1−5.
Cuffney, T.F., 2003, User’s manual for the national water-qual-ity assessment program invertebrate data analysis system (IDAS) software—Version 3: U.S. Geological Survey Open-File Report 03-172, 103 p.
Drut, M.S., Pyle, W.H., and Crawford, J.A., 1994, Diets and food selection of sage grouse chicks in Oregon: Journal of Range Management, v. 47, p. 90−93.
Fischer, M.K., and Shingleton, A.W., 2001, Host plant and ants influence the honeydew sugar composition of aphids: Functional Ecology, v. 15, no. 4, p. 544−550.
Greenslade, P.J.M., 1976, The meat ant Iridomyrmex pur-pureus (Hymenoptera: Formicidae) as a dominant member of ant communities: Australian Journal of Entomology, v. 15, no. 2, p. 237−240.
Johnson, G.D., and Boyce, M.S., 1990, Feeding trials with insects in the diet of sage grouse chicks: Journal of Wildlife Management, v. 54, p. 89−91.
Klebenow, D.A., and Gray, D.M., 1968, Food habits of juve-nile sage grouse: Journal of Range Management, v. 21, p. 80−83.
Lobry de Bruyn, L.A., and Conacher, A.J., 1990, The role of termites and ants in soil modification—a review: Australian Journal of Soil Research, v. 28, p. 55−93.
Lobry de Bruyn, L.A., and Conacher, A.J., 1994, The biotur-bation activity of ants in agricultural and naturally vegetated habitats in semi-arid environments: Australian Journal of Soil Research, v. 32, p. 555−570.
Lukacs, P.M., 2001, Estimating density of animal populations using trapping webs—Evaluation of web design and data analysis: Fort Collins, Colo., Colorado State University, 90 p.
Lukacs, P.M., 2002, WebSim—Simulation software to assist in trapping web design: Wildlife Society Bulletin, v. 30, p. 1259−1261.
Lukacs, P.M., Franklin, A.B., and Anderson, D.R., 2004, Pas-sive approaches to detection in distance sampling, in Buck-land, S.T., and others, eds., Advanced distance sampling—Estimating abundance of biological populations: Oxford, United Kingdon, Oxford University Press, p. 260−280.
McCune, B., and Grace, J.B., 2002, Analysis of ecological communities: Gleneden Beach, Oreg., MjM Software, 304 p.
McCune, B., and Mefford, M.J., 2005, PC-ORD, Multivariate analysis of ecological data, Version 5.0 (5th ed.): Gleneden Beach, Oreg., MjM Software Design, p. 237.
McEwen, L.C., Althouse, C.M., and Peterson, B.E., 1996, Direct and indirect effects of grasshopper integrated pest management (GHIPM) chemicals and biologicals on nontar-get animal life: U.S. Department of Agriculture, Animal and Plant Health Inspection Service Technical Bulletin 1809, Section III.2.
Nash, M.S., Bradford, D.F., Franson, S.E., Neale, A.C., Whit-ford, W.G., and Heggem, D.T., 2004, Livestock grazing effects on ant communities in the eastern Mojave Desert, USA: Ecological Indicators, v. 4, no. 3, p. 199−213.
Nash, M.S., Whitford, W.G., Bradford, D.F., Franson, S.E., Neale, A.C., and Heggem, D.T., 2001, Ant communities and livestock grazing in the Great Basin, U.S.A: Journal of Arid Environments, v. 49, no. 4, p. 695−710.
Nash, M.S., Whitford, W.G., Van, Z.J., and Havstad, Kris, 1998, Monitoring changes in stressed ecosystems using spa-tial patterns of ant communities: Environmental Monitoring and Assessment, v. 51, no. 1-2, p. 201−210.
New, T.R., 1998, Invertebrate surveys for conservation: Oxford, United Kingdom, Oxford University Press, 240 p.

52 Mormon Cricket Control in Utah’s West Desert—Evaluation of Impacts of the Pesticide Diflubenzuron
Offenberg, Joachim, 2001, Balancing between mutualism and exploitation: the symbiotic interaction between Lasius ants and aphids: Behavioral Ecology and Sociobiology, v. 49, no. 4, p. 304−310.
Peterson, J.G., 1970, The food habits and summer distribu-tion of juvenile sage grouse in central Montana: Journal of Wildlife Management, v. 34, p. 147−155.
Polis, G.A., and McCormick, S.J., 1986a, Scorpions, spiders, and solpugids—Predation and competition among distantly related taxa: Oecologia, v. 71, no. 1, p. 111−116.
Polis, G.A., and McCormick, S.J., 1986b, Patterns of resource use and age structure among species of desert scorpion: Journal of Animal Ecology, v. 55, no. 1, p. 59−73.
Polis, G.A., Myers, C.A., and Holt, R., 1989, The ecology and evolution of intraguild predation—Potential competi-tors that eat each other: Annual Review of Ecology and Systematics, v. 20, p. 297−330.
Prior-Magee, J.S., Boykin, K.G., Bradford, D.F., Kepner, W.G., Lowry, J.H., Schrupp, D.L., Thomas, K.A., and Thompson, B.C., eds., 2007, Southwest Regional Gap Analysis Project final report: Moscow, Idaho, U.S. Geologi-cal Survey.
Pyle, W. H. and J. A. Crawford (1996). Availability of foods of sage grouse chicks following prescribed fire in sage-brush-bitterbrush: Journal of Range Management, v.49, p. 320–324.
Read, J.L., and Andersen, A.N., 2000, The value of ants as early warning bioindicators—Responses to pulsed cattle grazing at an Australian arid zone locality: Journal of Arid Environments, v. 45, no. 3, p. 231−251.
Readio, J., and Sweet, M.H., 1982, A review of the Geo-corinae of the United States east of the 100th meridian (Hemiptera: Lygaeidae): Miscellaneous Publications of the Entomological Society of America, v. 12, p. 1−91.
Risch, S.J., and Carroll, C.R., 1982, The ecological role of ants in two Mexican agroecosystems: Oecologia, v. 55, p. 114−119.
S-PLUS, 2000: Seattle, MathSoft, Inc.
Sample, B.E., Cooper, R.J., and Whitmore, R.C., 1993, Dietary shifts among songbirds from a diflubenzuron-treated forest: The Condor, v. 95, p. 616−624.
Schuh, R.T., and Slater, J.A., 1995, True bugs of the world (Hemiptera: Heteroptera)—Classification and natural his-tory: New York, Cornell University Press, 336 p.
Smith, D.I., Lockwood, J.A., Latchininsky, A.V., and Legg, D.E., 2006, Changes in non-target arthropod populations following application of liquid bait formulations of insec-ticides for control of rangeland grasshoppers: International Journal of Pest Management, v. 52, p. 125−139.
Systat, 2004, SigmaStat: Richmond, Calif., Systat Software, Inc.
Triplehorn, C.A., and Johnson, N.F., 2005, Borror and DeLong’s introduction to the study of insects, 7th ed.: Bel-mont, Calif., Thomson Brooks/Cole, 864 p.
U.S. Department of Agriculture, 2002, Rangeland grasshop-per and Mormon cricket suppression program: Animal and Plant Health Inspection Service, U.S. Dept. of Agriculture, 88 p.
Weiland, R.T., Judge, F.D., Pels, Teun, and Grosscurt, A.C., 2002, A literature review and new observations on the use of diflubenzuron for control of locusts and grasshoppers throughout the world: Journal of Orthoptera Research, v. 11, no. 1, p. 43−54.
Whitford, W.G., Van Zee, J., Nash, M.S., Smith, W.E., and Herrick, J.E., 1999, Ants as indicators of exposure to envi-ronmental stressors in North American desert grasslands: Environmental Monitoring and Assessment, v. 54, no. 2, p. 143−171.
Whitmore, R.C., Cooper, R.J., and Sample, B.E., 1993, Bird fat reductions in forests treated with dimilin: Environmental Toxicology and Chemistry, v. 12, p. 2059−2064.
Wilcox, H., III, and Coffey, T., Jr., 1978, Environmental impacts of diflubenzuron (Dimilin) insecticide: U.S. Depart-ment of Agriculture, Forest Service, 18 p.

53Appendix A: Terrestrial Taxa Collected—Total Number of Arthropods Caught During Each Sampling Event at Each Site 53
Appendix A: Terrestrial Taxa Collected—Total Number of Arthropods Caught During Each Sampling Event at Each Site
Table A1a. Number of arthropods, by order, captured at each site in the untreated area at Grouse Creek, before and after treatment.
GC U01 pre-treatment
GC U01 post-treatment
GC U05 pre-treatment
GC U05 post-treatment
GC U06 pre-treatment
GC U06 post-treatment
GC U11 pre-treatment
GC U11 post-treatment
Coleoptera 162 516 181 355 84 333 29 76
Diptera 400 1,220 626 240 352 303 457 549
Hemiptera 233 8,581 404 34,856 262 1,420 88 410
Formicidae 173 453 151 150 602 786 456 869
non-ant Hymenoptera 115 669 123 240 70 197 44 200
Lepidoptera 64 33 114 37 12 25 23 95
Mantodea
Neuroptera 13 1 1 5
Orthoptera 1 18 12 20 34 73 36 381
Microcoryphia 6 3 1 19
Trichoptera 1 1 1
Araneae 61 139 85 144 86 205 88 325
Scorpiones 2 16 6 14 13
Solifugae
Pseudoscorpiones
Chilopoda 1 2 2
Diplopoda
Total arthropods 1,231 11,650 1,696 36,043 1,508 3,357 1,224 2,945

54 Mormon Cricket Control in Utah’s West Desert—Evaluation of Impacts of the Pesticide Diflubenzuron
Table A1b. Number of arthropods, by order, captured at each site in the treated area at Grouse Creek, before and after treatment.
GC T03 pre-treatment
GC T03 post-treatment
GC T04 pre-treatment
GC T04 post-treatment
GC T05 pre-treatment
GC T05 post-treatment
GC T06 pre-treatment
GC T06 post-treatment
Coleoptera 25 80 93 114 88 65 34 100
Diptera 230 161 314 747 858 204 83 223
Hemiptera 671 1,268 295 2,264 676 914 407 1,401
Formicidae 276 351 381 597 407 408 134 334
non-ant Hymenoptera 21 76 42 121 33 52 48 103
Lepidoptera 23 16 53 7 18 43
Mantodea 1 1 1
Neuroptera 1 3 1 3 9 6
Orthoptera 48 57 133 22 79 27 42 53
Microcoryphia 1 12
Trichoptera 1 1 2
Araneae 56 73 36 120 118 91 76 206
Scorpiones 2 2 4 2 6 1
Solifugae 1
Pseudoscorpiones 1
Chilopoda 1 2 1 1
Diplopoda
Total arthropods 1,357 2,088 1,295 4,048 2,261 1,776 853 2,485
Table A1c. Number of arthropods, by order, captured at each site in Ibapah.
IB U03 untreated
IB U06 untreated
IB U08 untreated
IB U09 untreated
IB T13 treated
IB T19 treated
IB T21treated
IB T22treated
Coleoptera 52 62 64 31 33 50 31 26
Diptera 155 246 206 96 130 90 128 125
Hemiptera 632 428 10,289 429 2,287 414 638 298
Formicidae 525 868 452 825 631 823 841 773
non-ant Hymenoptera 28 46 27 58 67 54 61 100
Lepidoptera 39 37 13 35 16 17 20 25
Mantodea 1 1 1 2
Neuroptera 4 1
Orthoptera 40 42 22 68 29 9 7 17
Microcoryphia 219
Trichoptera
Araneae 72 177 76 66 148 148 95 143
Scorpiones 3 4 9 8 3 1 2
Solifugae 19 11 1 3 12 8 15 5
Pseudoscorpiones 1 2 3 2
Chilopoda
Diplopoda
Total arthropods 1,571 1,924 11,159 1,622 3,357 1,616 1,841 1,731

55Appendix A: Terrestrial Taxa Collected—Total Number of Arthropods Caught During Each Sampling Event at Each Site 55
Table A1d. Number of arthropods, by order, captured at each site in Vernon.
VE U08 untreated
VE U09 untreated
VE U19 untreated
VE U20 untreated
VE T01 treated
VE T03 treated
VE T06 treated
VE T08 treated
Coleoptera 198 154 99 110 36 46 53 36
Diptera 336 310 220 397 253 129 117 110
Hemiptera 1,326 1,516 1,162 598 397 453 978 366
Formicidae 870 963 1,679 2,826 1,148 610 2,306 418
non-ant Hymenoptera 580 406 261 355 270 222 137 146
Lepidoptera 49 14 25 28 12 3 17 9
Mantodea 4 3 1 1 1
Neuroptera 1 2 1
Orthoptera 18 8 4 1 5
Microcoryphia 12 6
Trichoptera 1
Araneae 127 173 107 65 128 68 84 60
Scorpiones 1
Solifugae 4 1
Pseudoscorpiones 1 3 4 4
Chilopoda
Diplopoda 1,107 2
Total arthropods 3,504 4,670 3,566 4,389 2,256 1,533 3,703 1,162

56
Morm
on Cricket Control in Utah’s West Desert—
Evaluation of Impacts of the Pesticide Diflubenzuron
Ants
Aph
aeno
gast
er
Cam
pono
tus
Card
ioco
ndyl
a
Crem
atog
aste
r
Fore
lius
Form
ica
Lasi
us
Lept
otho
rax
Mes
sor
Mon
omor
ium
Myr
mec
ocys
tus
Myr
mic
a
Phei
dole
Pogo
nom
yrm
ex
Poly
ergu
s
Prio
nope
lta
Sole
nops
is
Tapi
nom
a
Tota
ls
GC U01pre 72 91 6 3 172
GC U05pre 138 6 1 5 150
GC U06pre 200 123 165 1 8 93 2 592
GC U11pre 19 6 20 285 47 2 36 25 16 456
GC T03pre 1 18 164 1 18 1 41 3 28 275
GC T04pre 3 16 139 53 88 7 17 51 4 1 379
GC T05pre 4 5 47 56 78 5 67 21 119 2 404
GC T06pre 5 2 88 1 34 1 2 133
GC U01post 155 1 270 25 1 452
GC U05post 118 17 10 1 1 2 149
GC U06post 380 88 77 12 6 10 182 2 27 784
GC U11post 18 64 127 310 102 1 1 112 73 2 56 866
GC T03post 1 42 101 1 24 1 2 120 7 51 350
GC T04post 19 189 69 120 1 11 169 1 10 1 590
GC T05post 6 12 37 55 25 5 118 118 28 4 408
GC T06post 16 215 82 3 13 6 6 341
IB U03 27 1 34 107 15 33 44 261
IB U06 279 2 44 1 81 1 2 448 858
IB U08 2 2 212 44 11 18 8 43 340
IB U09 2 541 11 78 42 1 112 787
IB T13 57 250 71 37 50 117 7 20 609
IB T19 1 42 527 24 14 25 112 7 1 10 1 764
IB T21 46 322 12 2 16 28 3 95 20 3 547
IB T22 56 7 5 108 297 51 34 25 154 1 5 743
VE U08 5 9 48 15 81 144 37 169 105 253 866
VE U09 37 78 315 121 196 141 45 29 962
VE U19 25 125 57 22 592 1 460 4 29 42 315 1,672
Table A2. Total numbers of ants by genus collected in pitfall traps at each site and sampling event in the three study areas.

57
Appendix A: Terrestrial Taxa Collected—Total N
umber of Arthropods Caught During Each Sam
pling Event at Each Site
57
Ants
Aph
aeno
gast
er
Cam
pono
tus
Card
ioco
ndyl
a
Crem
atog
aste
r
Fore
lius
Form
ica
Lasi
us
Lept
otho
rax
Mes
sor
Mon
omor
ium
Myr
mec
ocys
tus
Myr
mic
a
Phei
dole
Pogo
nom
yrm
ex
Poly
ergu
s
Prio
nope
lta
Sole
nops
is
Tapi
nom
a
Tota
ls
VE U20 80 26 1 2,212 8 357 123 6 2,813
VE T01 39 5 448 345 22 108 137 14 22 1,140
VE T03 2 66 86 386 21 12 32 605
VE T06 26 5 1,723 13 344 87 46 2,244
VE T08 20 2 51 60 205 8 61 2 409
Totals 294 455 6 210 4,594 6,165 529 2,020 2 2,098 47 772 1,429 1,438 9 3 764 1,286 22,121
Table A2. Total numbers of ants by genus collected in pitfall traps at each site and sampling event in the three study areas—Continued.

58
Morm
on Cricket Control in Utah’s West Desert—
Evaluation of Impacts of the Pesticide Diflubenzuron
Aly
dida
e
Aph
idid
ae
Ber
ytid
ae
Cerc
opid
ae
Cica
delli
dae
Cydn
idae
Del
phac
idae
Dic
tyop
hari
dae
Fulg
orid
ae
Geo
cori
dae
Lyga
eida
e
Mir
idae
Nab
idae
Pent
atom
idae
Phyl
loxe
rida
e
Pies
mat
idae
Psyl
lidae
Redu
viid
ae
Rhop
alid
ae
Ting
idae
Tota
ls
GC U01pre 16 192 29 237
GC U05pre 83 2 2 126 174 1 1 2 391
GC U06pre 4 5 152 4 17 1 183
GC U11pre 35 77 7 2 2 123
GC U01post 4,485 53 28 767 3 13 19 2,470 1 1 11 1 7,852
GC U05post 35,852 40 3 2,349 1 450 15 1 38,711
GC U06post 3 9 1 749 1 2 66 1 1 1 834
GC U11post 36 1 147 1 1 1 24 7 1 2 221
GC T03pre 2 24 73 979 4 4 1,086
GC T04pre 59 462 28 3 552
GC T05pre 13 610 3 25 4 5 660
GC T06pre 45 515 22 24 2 4 9 621
GC T03post 25 3 1,149 9 1 40 5 1,232
GC T04post 3 65 4 1,143 9 27 4 15 1,270
GC T05post 11 12 1 909 2 1 25 5 1 967
GC T06post 11 7 7 734 2 4 1 1 51 3 3 5 829
IB U03 29 8 27 510 17 4 21 13 1 630
IB U06 24 4 371 12 4 7 4 426
IB U08 3,958 612 1 5 5 1 4,582
IB U09 29 391 10 2 6 5 443
IB T13 2,006 8 245 16 5 6 1 2,287
IB T19 11 27 372 1 1 1 413
IB T21 7 4 614 3 1 2 1 632
IB T22 20 21 240 2 1 8 4 296
VE U08 29 3 21 971 3 23 21 33 1,104
VE U09 50 6 1,458 2 1,516
VE U19 69 14 55 55 221 689 1,103
Table A3. Total numbers of Hemiptera by family collected in pitfall traps at each site and sampling event in the three study areas.

59
Appendix A: Terrestrial Taxa Collected—Total N
umber of Arthropods Caught During Each Sam
pling Event at Each Site
59Table A3. Total numbers of Hemiptera by family collected in pitfall traps at each site and sampling event in the three study areas—Continued.
Aly
dida
e
Aph
idid
ae
Ber
ytid
ae
Cerc
opid
ae
Cica
delli
dae
Cydn
idae
Del
phac
idae
Dic
tyop
hari
dae
Fulg
orid
ae
Geo
cori
dae
Lyga
eida
e
Mir
idae
Nab
idae
Pent
atom
idae
Phyl
loxe
rida
e
Pies
mat
idae
Psyl
lidae
Redu
viid
ae
Rhop
alid
ae
Ting
idae
Tota
ls
VE U20 10 71 2 4 412 5 25 48 4 1 582
VE T01 6 7 3 324 5 6 12 15 1 3 382
VE T03 17 5 422 1 445
VE T06 19 1,659 2 11 35 8 125 1,859
VE T08 12 10 4 317 4 2 6 6 4 365
Totals 46,681 619 3 251 19,992 5 2 181 31 63 166 3,740 884 4 4 1 191 9 3 4 72,834

60 Mormon Cricket Control in Utah’s West Desert—Evaluation of Impacts of the Pesticide Diflubenzuron

61
Appendix B: Aquatic Taxa Collected
Appendix B: Aquatic Taxa Collected 61

62
Morm
on Cricket Control in Utah’s West Desert—
Evaluation of Impacts of the Pesticide Diflubenzuron
Code Phylum Class Order Suborder Family Subfamily/tribe Genus/species
MOORE Annelida Clitellata Arhynchobdellida Erpobdelliformes Erpobdellidae Mooreobdella sp.
ERPOB Erpobdellinae Erpobdella sp.
ENCHY Haplotaxida Enchytraeidae
NAIDI Naididae
TUBIF Tubificidae
HELOB Rhynchobdellida Glossiphoniidae Haementeriinae Helobdella stagnalis
PISID Mollusca Bivalvia Veneroida Pisidiidae
LYMNA Gastropoda Basommatophora Lymnaeidae
FOSSA Fossaria sp.
STAGN Stagnicola sp.
PHYSA Physidae Physa sp.
GYRAU Planorbidae Gyraulus sp.
FLUMI Neotaenioglossa Hydrobiidae Fluminicola sp.
NEMAT Nematoda
TURBE Platyhelminthes Turbellaria
POLYC Tricladida Planariidae Polycelis coronata
TROMB Arthropoda Arachnida Trombidiformes
CLADOC Branchiopoda Diplostraca Cladocera
GAMMA Malacostraca Amphipoda Gammaridae Gammarus sp.
HYALE Talitridae Hyalella sp.
COPEP Maxillopoda/ Copepoda
OSTRA Ostracoda
CAENI Insecta Ephemeroptera Furcatergalia Caenidae Caenis sp.
DRUNE Ephemerellidae Drunella sp.
DRUGR Drunella grandis
INERM Ephemerella inermis
SERRAT Ephemerellinae Serratella tibialis
PARAL Schistonota Leptophlebiidae Paraleptophlebia sp.
SIPHLO Siphlonuridae
AMELE Pisciforma Ameletidae Ameletus sp.
ACENT Baetidae Acentrella sp.

63
Code Phylum Class Order Suborder Family Subfamily/tribe Genus/species
BAETI Baetis tricaudatus
CALLI Callibaetis sp.
CENTR Centroptilum sp.
DIPHE Diphetor hageni
CINYG Setisura Heptageniidae Cinygmula sp.
EGRAND Epeorus grandis
EDECEPT Epeorus deceptivus
ELONGIM Epeorus longimanus
AESHN Odonata Anisoptera Aeshnidae
AESHNSP Aeshna sp.
ANAXSP Anax sp.
LIBEL Libellulidae
ERYTHEM Erythemis sp.
LIBELSP Libellula sp.
SYMPE Sympetrum sp.
HETAER Zygoptera Calopterygidae Hetaerina sp.
COENAGR Coenagrionidae
AMPHIAG Amphiagrion sp.
ENALLAG Enallagma sp.
LESTES Lestidae Lestes sp.
CAPNII Plecoptera Euholognatha Capniidae
NEMOU Nemouridae
MALENKA . Amphinemurinae Malenka sp.
ZAPAD Nemourinae Zapada sp.
ZAPACI Zapada cinctipes
ZAPACOL Zapada columbiana
ZAPAOR Zapada oregonensis
TAENIOP Taeniopterygidae Taeniopteryginae Taeniopteryx sp.
CHLORO Systellognatha Chloroperlidae
ISOPER Perlodidae Isoperlinae Isoperla sp.
PTERON Pteronarcyidae Pteronarcyinae Pteronarcella sp.
CORIXID Heteroptera Corixidae
CENOCOR Cenocorixa sp.
Appendix B: Aquatic Taxa Collected
63

64
Morm
on Cricket Control in Utah’s West Desert—
Evaluation of Impacts of the Pesticide Diflubenzuron
Code Phylum Class Order Suborder Family Subfamily/tribe Genus/species
HCORIXA Corixinae Hesperocorixa sp.
SIGARAS Sigara sp.
NOTONE Notonectidae Notonecta sp.
HPSYCHI Trichoptera Annulipalpia Hydropsychidae
HPSYCSP Hydropsychinae Hydropsyche sp.
AMIOCE Integripalpia Brachycentridae Amiocentrus aspilus
BRACHYC Brachycentrus ameri-canus
MICRAS Micrasema sp.
LEPIDO Lepidostomatidae Lepidostomatinae Lepidostoma sp.
LEPTO Leptoceridae
YLODE Ylodes sp.
LIMNE Limnephilidae
ECCLISO Limnephilidae Dicosmoecinae Ecclisomyia sp.
PHILAR Limnephilinae Philarctus quaeris
HESPER Hesperophylax sp.
LIMNEP Limnephilus sp.
HPTILID Spicipalpia Hydroptilidae
HPTILSP Hydroptilinae Hydroptila sp.
OCHROT Ochrotrichia sp.
RHYACO Rhyacophilidae Rhyacophila sp.
DYTISCI Coleoptera Adephaga Dytiscidae
AGABU Agabus sp.
COLYMB Colymbetes sp.
RHANTU Rhantus sp.
LIODESS Liodessus sp.
HYGROTU Hygrotus sp.
STICTOT Stictotarsus sp.
LACCOPH Laccophilus sp.
PELTODY Haliplidae Peltodytes sp.
CLEPTEL Polyphaga Elmidae Cleptelmis sp.
OPTIOSE Optioservus sp.
OCHTHEB Hydraenidae Ochthebius sp.

65
Code Phylum Class Order Suborder Family Subfamily/tribe Genus/species
HPHILID Hydrophilidae
HYBIUS Hydrobius sp.
LACCOB Laccobius sp.
TROPIST Tropisternus sp.
AGATH Diptera Nematocera Blephariceridae Blepharicerinae Agathon sp.
CERATOP Ceratopogonidae Ceratopogoninae
APEDILU Chironomidae Chironomini Apedilum sp.
CHIRONO Chironomus sp.
PARACHI Parachironomus sp.
PARACLA Paracladopelma sp.
PARATEN Paratendipes sp.
PHAENOP Phaenopsectra sp.
POLYPED Polypedilum sp.
PSEUDOC Pseudochironomini Pseudochironomus sp.
TARSINI Tanytarsini
CLADOT Cladotanytarsus sp.
MICROPS Micropsectra sp.
RHEOTAN Rheotanytarsus sp.
STEMPEL Stempellinella sp.
TANYTAR Tanytarsus sp.
PAGAS Diamesinae Pagastia sp.
IAMESA Pseudodiamesa sp.
DIAMES Diamesa sp.
ACRICOT Orthocladiinae Acricotopus sp.
BRILLIA Brillia sp.
CHAETOC Chaetocladius sp.
CORYNON Corynoneura sp.
CRICOTO Cricotopus (Cricotopus)
ISOCLAD Cricotopus (Isocladius)
EUKBREH Eukiefferiella brehmi gr.
EUKDEVO Eukiefferiella devonica gr.
EUKGRAC Eukiefferiella gracei gr.
Appendix B: Aquatic Taxa Collected
65

66
Morm
on Cricket Control in Utah’s West Desert—
Evaluation of Impacts of the Pesticide Diflubenzuron
Code Phylum Class Order Suborder Family Subfamily/tribe Genus/species
EUKCLAR Eukiefferiella claripen-nis gr.
LIMNOP Limnophyes sp.
ORTHOC Orthocladius sp.
PARAKI Parakiefferiella sp.
PARAME Parametriocnemus sp.
PARAPH Paraphaenocladius sp.
PSECTRC Psectrocladius sp.
PSEUDOS Pseudosmittia sp.
RHEOCRI Rheocricotopus sp.
THIENEM Thienemanniella sp.
TVETE Tvetenia bavarica gr.
METRIOC Metriocnemus sp.
PAROC Podonominae Parochlus sp.
ODONTO Prodiamesinae Odontomesa sp.
PRODIA Prodiamesa sp.
TANYPOD Tanypodinae
APSECTR Apsectrotanypus sp.
PSECTRT Psectrotanypus sp.
RADOTA Radotanypus sp.
PENTA Pentaneura sp.
NIMYIA Thienemannimyia gr.
ZAVRELI Zavrelimyia sp.
TANYPUS Tanypus sp.
CULICI Culicidae
DIXID Dixidae
DIXASP Dixa sp.
MERINGO Meringodixa sp.
PSYCHOD Psychodidae
PROSIMU Simuliidae Prosimulium sp.
SIMULIU Simulium sp.
MOLOPH Tipulidae Limoniinae Molophilus sp.
PEDICI Pedicia sp.

67
Code Phylum Class Order Suborder Family Subfamily/tribe Genus/species
DICRAN Dicranota sp.
TIPULA Tipulinae Tipula sp.
DOLICHO Brachycera Dolichopodidae
EMPIDI Empididae
NEOPLAS Neoplasta sp.
CLINOCE Clinocera sp.
EPHYDR Ephydridae
MUSCIDA Muscidae
SCIOMYZ Sciomyzidae
Appendix B: Aquatic Taxa Collected
67

68
Morm
on Cricket Control in Utah’s West Desert—
Evaluation of Impacts of the Pesticide Diflubenzuron
CMSP1 CMSP2 CLSP1 CLSP2 RBTST NFRST KGSP LRSP RBNST
Code 5/25 6/24 10/7 5/25 6/24 10/7 5/26 10/6 6/23 10/6 5/27 6/22 10/7 5/25 6/23 10/7 6/2 6/22 10/7 6/2 6/22
MOORE
ERPOB
ENCHY 90 15 30 10 30 20
NAIDI 90 180 390
TUBIF 1,185 1,484 70 1,395 40 20 7 30 8 5 320 960 330
HELOB
PISID 20 6
LYMNA 15 32 15 75 30
FOSSA 14 1 10
STAGN 10 80 48 110 30 26
PHYSA
GYRAU 90
FLUMI 315 15 680 80
NEMAT 60 11 8 10 13 615 130
TURBE 5 5
POLYC
TROMB 5 15 10 10
CLADOC 60 63 1,820 90 100 1,070 58 15 240 8 5 7,306 45 1150 32 10
GAMMA
HYALE 15 20 10
COPEP 10 40 14 72 180 8 165
OSTRA 2,235 6,821 110 2,715 4,560 630 595 243 2,310 230 6 35 150 2,620 671 2,655 700 276 20
CAENI 10 10
DRUNE 60 5
DRUGR 30
INERM 11 98 10 50 48
SERRAT 6
PARAL
SIPHLO 10
AMELE 29 30 10
Grouse Creek sites

69
Appendix B: Aquatic Taxa Collected
69
CMSP1 CMSP2 CLSP1 CLSP2 RBTST NFRST KGSP LRSP RBNST
Code 5/25 6/24 10/7 5/25 6/24 10/7 5/26 10/6 6/23 10/6 5/27 6/22 10/7 5/25 6/23 10/7 6/2 6/22 10/7 6/2 6/22
ACENT 217 195 212 21
BAETI 2 109 773 380
CALLI 30 411 820 30 340 1,010 88 225 875 6 160 2,718 10 105
CENTR 268 16
DIPHE
CINYG 11
EGRAND
EDECEPT
ELONGIM 8
AESHN 10
AESHNSP 32 20 20
ANAXSP 10 4
LIBEL 15 45 20 6
ERYTHEM 60 20 35
LIBELSP 32
SYMPE 32 15 35 35
HETAER
COENAGR 30
AMPHIAG 15 15 60 20 71 11
ENALLAG 15 189 110 30 40 220 145 282 15
LESTES
CAPNII 5
NEMOU 30
MALENKA
ZAPAD
ZAPACI 60 5
ZAPACOL
ZAPAOR
TAENIOP 15
CHLORO 6
Grouse Creek sites—Continued.

70
Morm
on Cricket Control in Utah’s West Desert—
Evaluation of Impacts of the Pesticide Diflubenzuron
CMSP1 CMSP2 CLSP1 CLSP2 RBTST NFRST KGSP LRSP RBNST
Code 5/25 6/24 10/7 5/25 6/24 10/7 5/26 10/6 6/23 10/6 5/27 6/22 10/7 5/25 6/23 10/7 6/2 6/22 10/7 6/2 6/22
ISOPER
PTERON
CORIXID 15 95 200 45 15 60
CENOCOR 2
HCORIXA 20 10 30 35
SIGARAS 5
NOTONE 15 32 10 120 20 10 7 5 20 35 60 2
HPSYCHI
HPSYCSP 8
AMIOCE 11 8 10
BRACHYC
MICRAS
LEPIDO
LEPTO 6
YLODE 8 20
LIMNE 10 10 2
ECCLISO
PHILAR 8
HESPER 8
LEPHILU 20
HPTILID 10
HPTILSP
OCHROT 5
RHYACO
DYTISCI 63 7 105 6 14 11
AGABU 20 50 5
COLYMB 35
RHANTU 20 7 5 10 35 15 30 2
LIODESS
HYGROTU
Grouse Creek sites—Continued.

71
Appendix B: Aquatic Taxa Collected
71
CMSP1 CMSP2 CLSP1 CLSP2 RBTST NFRST KGSP LRSP RBNST
Code 5/25 6/24 10/7 5/25 6/24 10/7 5/26 10/6 6/23 10/6 5/27 6/22 10/7 5/25 6/23 10/7 6/2 6/22 10/7 6/2 6/22
STICTOT 30 10 40
LACCOPH 15 50 2 5 5 71
PELTODY 32 40
CLEPTEL
OPTIOSE 10
OCHTHEB 10
HPHILID 10
HYBIUS 20
LACCOB 10 15
TROPIST 63 10 10 1
AGATH 6
CERATOP 30 45 8 20
APEDILU 15 10 2 5 459 8 6 77 3 318
CHIRONO 15 62 10 126 110 60 10
PARACHI
PARACLA
PARATEN 11
PHAENOP 41
POLYPED 10 33
PSEUDOC 45 411 257 109 400 40 17 35
TARSINI 2 10
CLADOT
MICROPS 135 474 31 14 1,123 12 429 2 35 195 4 22
RHEOTAN 6 5 11
STEMPEL 20
TANYTAR 12 10 47 65
PAGAS 6 5 6
IAMESA
DIAMES 54 79 76
ACRICOT 385 117 17 30
Grouse Creek sites—Continued.

72
Morm
on Cricket Control in Utah’s West Desert—
Evaluation of Impacts of the Pesticide Diflubenzuron
CMSP1 CMSP2 CLSP1 CLSP2 RBTST NFRST KGSP LRSP RBNST
Code 5/25 6/24 10/7 5/25 6/24 10/7 5/26 10/6 6/23 10/6 5/27 6/22 10/7 5/25 6/23 10/7 6/2 6/22 10/7 6/2 6/22
BRILLIA 11
CHAETOC 38 11 32 40 40 45 25
CORYNON 82 230 36 35 25
CRICOTO 7
ISOCLAD 35 6
EUKBREH 6
EUKDEVO
EUKGRAC
EUKCLAR
LIMNOP 10 17 20 14
ORTHOC 42 20 121 35 282 133
PARAKI
PARAME 78
PARAPH 6
PSECTRC 105 100 60 15 16 8 35 2
PSEUDOS 15
RHEOCRI
THIENEM
TVETE 2 30 14 11
METRIOC 2
PAROC
ODONTO
PRODIA
TANYPOD 35
ASPECTR
PSECTRT
RADOTA
PENTA 20
NIMYIA 20 10 10
ZAVRELI 95
TANYPUS
Grouse Creek sites—Continued.

73
Appendix B: Aquatic Taxa Collected
73
CMSP1 CMSP2 CLSP1 CLSP2 RBTST NFRST KGSP LRSP RBNST
Code 5/25 6/24 10/7 5/25 6/24 10/7 5/26 10/6 6/23 10/6 5/27 6/22 10/7 5/25 6/23 10/7 6/2 6/22 10/7 6/2 6/22
CULICI 19
DIXID
DIXASP
MERINGO 8
PSYCHOD 2
PROSIMU 223 9 141 38
SIMULIU 1,074 958 40 35 1,869 1,103
MOLOPH
PEDICI
DICRAN
TIPULA 10
DOLICHO 5 5
EMPIDI
NEOPLAS
CLINOCE 2
EPHYDR 8 10 20 5
MUSCIDA 8 30 10 11
SCIOMYZ 2
Grouse Creek sites—Continued.

74 Mormon Cricket Control in Utah’s West Desert—Evaluation of Impacts of the Pesticide Diflubenzuron
MCST SDST JCST IJCST ICST NOXSP SOXSP SKSP BCST DCST
Code 7/12 7/13 7/13 7/13 7/14 7/13 7/13 7/13 7/13 7/14
MOORE 30
ERPOB 86
ENCHY 60 47 9 52
NAIDI
TUBIF 140 55 435 450 6
HELOB 4
PISID 176 21 60 60
LYMNA
FOSSA
STAGN 15
PHYSA 555 300 857
GYRAU 8 210
FLUMI 1,971
NEMAT 8 103 181 65 15 30 1
TURBE
POLYC
TROMB 4 10 105 2 6
CLADOC 270 540
GAMMA 943
HYALE 825 360
MAXIL 120 360 600
OSTRA 26 36 30 315 2,850 21,086 4
CAENI
DRUNE
DRUGR 143 9 23 5 5 5
INERM
SERRAT
PARAL
SIPHLO
AMELE 23 4 2 5 5
ACENT
BAETI 615 459 201 403 365 196 474
CALLI 585 2,190
CENTR 8 9 5
DIPHE 9 5 3
CINYG
EGRAND 60
EDECEPT 5
ELONGIM 338 9 41 26 75
AESHN
Ibapah sites

75
Ibapah sites—Continued.
MCST SDST JCST IJCST ICST NOXSP SOXSP SKSP BCST DCST
Code 7/12 7/13 7/13 7/13 7/14 7/13 7/13 7/13 7/13 7/14
AESHNSP
ANAXSP
LIBEL
ERYTHEM
LIBELSP
SYMPE 15 30
HETAER 30
COENAGR
AMPHIAG
ENALLAG 780 810
LESTES 15
CAPNII
NEMOU
MALENKA 2 5 1
ZAPAD
ZAPACI
ZAPACOL
ZAPAOR
TAENIOP
CHLORO
ISOPER
PTERON
CORIXID
CENOCOR
HCORIXA 240
SIGARAS 105 240
NOTONE 5 15 90
HPSYCHI 2
HPSYCSP 10 5
AMIOCE
BRACHYC 3
MICRAS 285 5 1
LEPIDO
LEPTO
YLODE
LIMNE
ECCLISO 8 2
PHILAR
HESPER
LEPHILU 171
HPTILID
Appendix B: Aquatic Taxa Collected 75

76 Mormon Cricket Control in Utah’s West Desert—Evaluation of Impacts of the Pesticide Diflubenzuron
Ibapah sites—Continued.
MCST SDST JCST IJCST ICST NOXSP SOXSP SKSP BCST DCST
Code 7/12 7/13 7/13 7/13 7/14 7/13 7/13 7/13 7/13 7/14
HPTILSP 4 31 5 9
OCHROT 8 3
RHYACO
DYTISCI 47 11 5 75
AGABU 53 10
COLYMB
RHANTU
LIODESS 150 34
HYGROTU 4
STICTOT 12
LACCOPH
PELTODY
CLEPTEL
OPTIOSE 15
OCHTHEB
HPHILID 4 10
HYBIUS
LACCOB
TROPIST
AGATH
CERATOP 15 2 5 45 1
APEDILU 8 46 90 3
CHIRONO
PARACHI
PARACLA
PARATEN 16
PHAENOP 1 3
POLYPED 86
PSEUDOC 46
TARSINI
CLADOT 8
MICROPS 8 10 17 309 120 343 1
RHEOTAN
STEMPEL
TANYTAR
PAGAS 16 15 5 6 5 17
IAMESA
DIAMES
ACRICOT 103
BRILLIA
CHAETOC
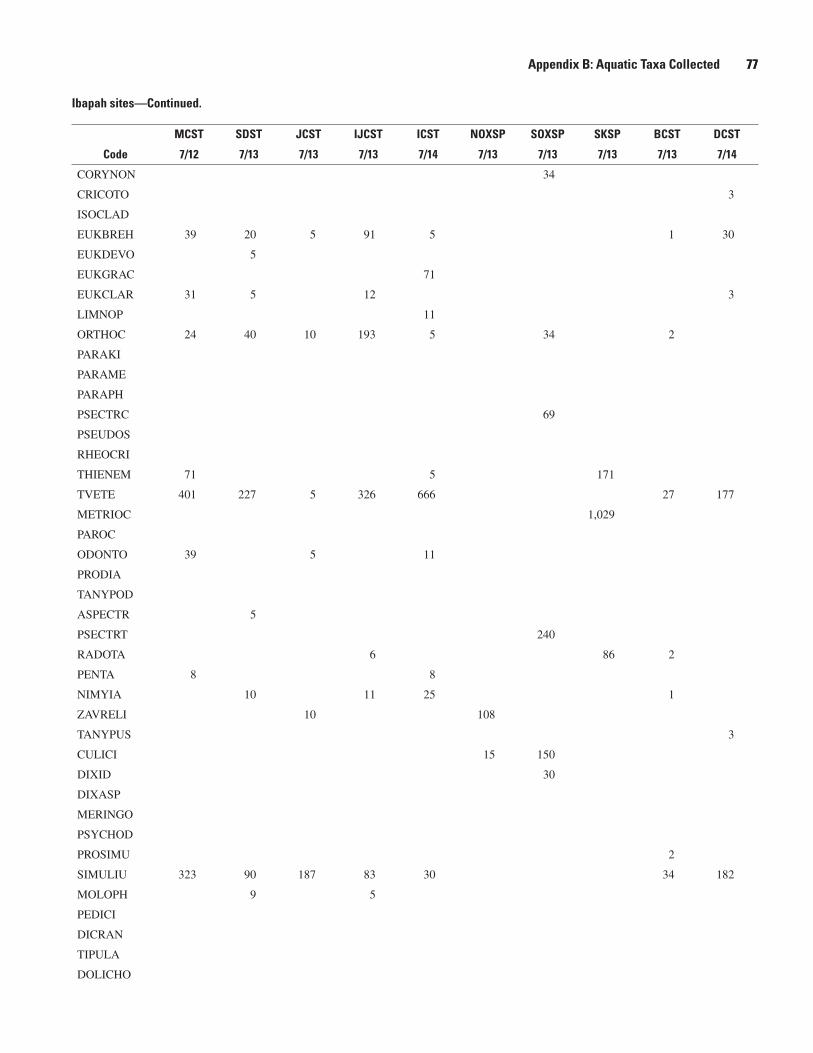
77
Ibapah sites—Continued.
MCST SDST JCST IJCST ICST NOXSP SOXSP SKSP BCST DCST
Code 7/12 7/13 7/13 7/13 7/14 7/13 7/13 7/13 7/13 7/14
CORYNON 34
CRICOTO 3
ISOCLAD
EUKBREH 39 20 5 91 5 1 30
EUKDEVO 5
EUKGRAC 71
EUKCLAR 31 5 12 3
LIMNOP 11
ORTHOC 24 40 10 193 5 34 2
PARAKI
PARAME
PARAPH
PSECTRC 69
PSEUDOS
RHEOCRI
THIENEM 71 5 171
TVETE 401 227 5 326 666 27 177
METRIOC 1,029
PAROC
ODONTO 39 5 11
PRODIA
TANYPOD
ASPECTR 5
PSECTRT 240
RADOTA 6 86 2
PENTA 8 8
NIMYIA 10 11 25 1
ZAVRELI 10 108
TANYPUS 3
CULICI 15 150
DIXID 30
DIXASP
MERINGO
PSYCHOD
PROSIMU 2
SIMULIU 323 90 187 83 30 34 182
MOLOPH 9 5
PEDICI
DICRAN
TIPULA
DOLICHO
Appendix B: Aquatic Taxa Collected 77

78 Mormon Cricket Control in Utah’s West Desert—Evaluation of Impacts of the Pesticide Diflubenzuron
Ibapah sites—Continued.
MCST SDST JCST IJCST ICST NOXSP SOXSP SKSP BCST DCST
Code 7/12 7/13 7/13 7/13 7/14 7/13 7/13 7/13 7/13 7/14
EMPIDI 3
NEOPLAS
CLINOCE 5
EPHYDR
MUSCIDA 8 9 5 2 3
SCIOMYZ 30
Vernon sites
VD3ST RCST VCST VD6ST CCST LFST LVST ULVST PCST
Code 7/20 7/21 7/21 7/21 7/20 7/20 7/20 7/20 7/20
MOORE 38 60
ERPOB
ENCHY 33 90 150
NAIDI 18 30 60
TUBIF 18 90 60
HELOB
PISID 450 15 38 480
LYMNA
FOSSA 8
STAGN 6
PHYSA 6
GYRAU
FLUMI 30 4,140 30 210 600
NEMAT 66 19 90 30 8
TURBE 510 120
POLYC 113
TROMB 11 113 60 180 23 60
CLADOC
GAMMA 75
HYALE 210 840
MAXIL 12 60
OSTRA 60 19 180 15 1,440
CAENI
DRUNE
DRUGR
INERM 56 30 435 135
SERRAT
PARAL 8
SIPHLO
AMELE
ACENT

79
Vernon sites—Continued.
VD3ST RCST VCST VD6ST CCST LFST LVST ULVST PCST
Code 7/20 7/21 7/21 7/21 7/20 7/20 7/20 7/20 7/20
BAETI 2,182 300 6,480 960 1,860 225 458 2,040
CALLI 12
CENTR
DIPHE 60 23 120
CINYG
EGRAND
EDECEPT
ELONGIM
AESHN
AESHNSP
ANAXSP
LIBEL
ERYTHEM
LIBELSP
SYMPE
HETAER
COENAGR
AMPHIAG
ENALLAG
LESTES
CAPNII
NEMOU
MALENKA
ZAPAD 6
ZAPACI 524 19 210 660 270 45 480
ZAPACOL 180
ZAPAOR 60
TAENIOP
CHLORO
ISOPER 38 60 30 8
PTERON 15
CORIXID 84
CENOCOR
HCORIXA
SIGARAS
NOTONE
HPSYCHI
HPSYCSP 75 75 38
AMIOCE
BRACHYC
MICRAS
Appendix B: Aquatic Taxa Collected 79

80 Mormon Cricket Control in Utah’s West Desert—Evaluation of Impacts of the Pesticide Diflubenzuron
Vernon sites—Continued.
VD3ST RCST VCST VD6ST CCST LFST LVST ULVST PCST
Code 7/20 7/21 7/21 7/21 7/20 7/20 7/20 7/20 7/20
LEPIDO 15 30
LEPTO
YLODE
LIMNE
ECCLISO
PHILAR 45
HESPER 113 135 120 45 60
LEPHILU 45
HPTILID
HPTILSP
OCHROT 30
RHYACO 30
DYTISCI 22 30 60 15
AGABU
COLYMB
RHANTU
LIODESS
HYGROTU
STICTOT 6
LACCOPH
PELTODY
CLEPTEL 19 75
OPTIOSE 75 150 480 210 540
OCHTHEB
HPHILID
HYBIUS
LACCOB
TROPIST
AGATH
CERATOP 30 15
APEDILU
CHIRONO
PARACHI 6
PARACLA 16
PARATEN
PHAENOP 43 62 93
POLYPED 31 60
PSEUDOC
TARSINI
CLADOT
MICROPS 1488 1,246 11,743 264 38 4,689
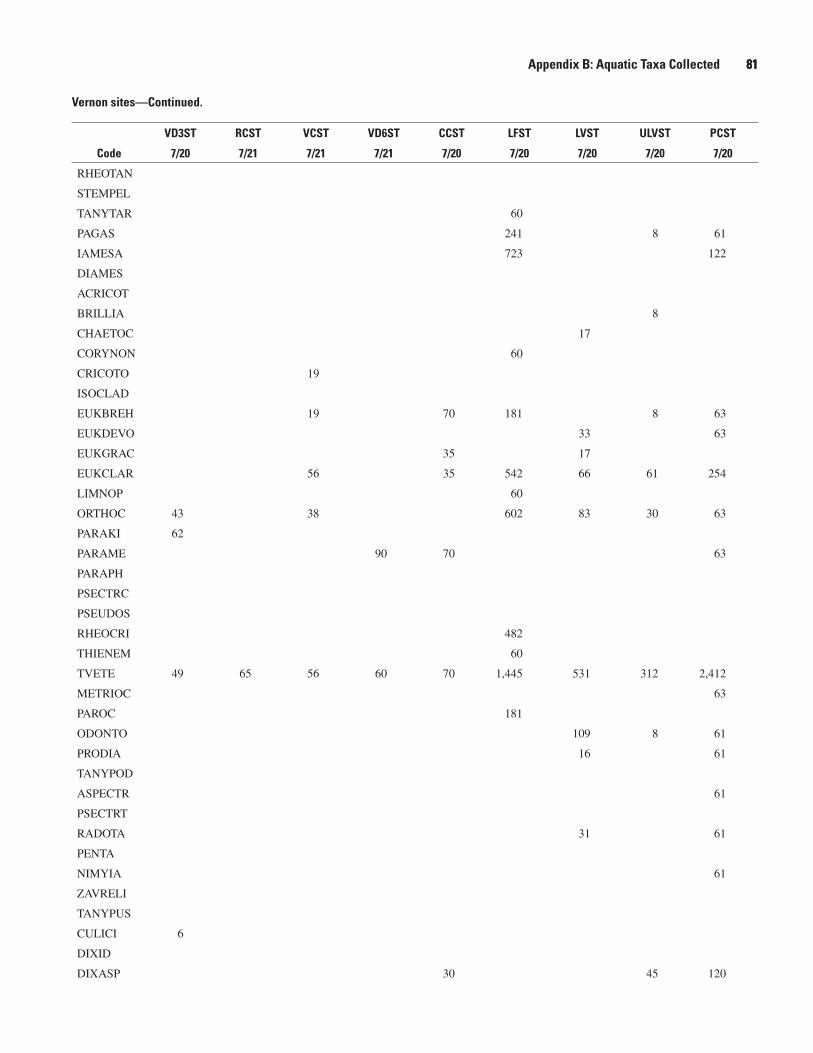
81
Vernon sites—Continued.
VD3ST RCST VCST VD6ST CCST LFST LVST ULVST PCST
Code 7/20 7/21 7/21 7/21 7/20 7/20 7/20 7/20 7/20
RHEOTAN
STEMPEL
TANYTAR 60
PAGAS 241 8 61
IAMESA 723 122
DIAMES
ACRICOT
BRILLIA 8
CHAETOC 17
CORYNON 60
CRICOTO 19
ISOCLAD
EUKBREH 19 70 181 8 63
EUKDEVO 33 63
EUKGRAC 35 17
EUKCLAR 56 35 542 66 61 254
LIMNOP 60
ORTHOC 43 38 602 83 30 63
PARAKI 62
PARAME 90 70 63
PARAPH
PSECTRC
PSEUDOS
RHEOCRI 482
THIENEM 60
TVETE 49 65 56 60 70 1,445 531 312 2,412
METRIOC 63
PAROC 181
ODONTO 109 8 61
PRODIA 16 61
TANYPOD
ASPECTR 61
PSECTRT
RADOTA 31 61
PENTA
NIMYIA 61
ZAVRELI
TANYPUS
CULICI 6
DIXID
DIXASP 30 45 120
Appendix B: Aquatic Taxa Collected 81

82 Mormon Cricket Control in Utah’s West Desert—Evaluation of Impacts of the Pesticide Diflubenzuron
Vernon sites—Continued.
VD3ST RCST VCST VD6ST CCST LFST LVST ULVST PCST
Code 7/20 7/21 7/21 7/21 7/20 7/20 7/20 7/20 7/20
MERINGO
PSYCHOD 60
PROSIMU
SIMULIU 30 764 5,250 2,820 180 1,020 1,665 368 4,860
MOLOPH
PEDICI 60
DICRAN 30 60
TIPULA
DOLICHO
EMPIDI
NEOPLAS 15
CLINOCE 60
EPHYDR
MUSCIDA 65 19 60 420 60
SCIOMYZ

This page intentionally left blank

Graham and others—
Morm
on Cricket Control in Utah’s W
est Desert—
Evaluation of Impacts of the Pesticide D
iflubenzuron on Nontarget A
rthropod Com
munities—
Open–File Report 2008–1305