Embed Size (px)
Citation preview

1live. learn. work. play.
Morgan Stanley Global Consumer and Retail ConferenceNovember 15, 2016
Michael B. Polk - Chief Executive Officer

2
Statements in this presentation that are not historical in nature constitute forward-looking statements. These forward-looking statements relate to information or assumptions about the effects of sales, income, earnings per share, operating income, operating margin or gross margin improvements or declines, Project Renewal, capital and other expenditures, cash flow, dividends, restructuring and other project costs, costs and cost savings, inflation or deflation, particularly with respect to commodities such as oil and resin, debt ratings, changes in exchange rates, expected benefits and financial results from the Jarden transaction and other recently completed acquisitions and related integration activities and planned divestitures and management's plans, projections and objectives for future operations and performance. These statements are accompanied by words such as "anticipate," "expect," "project," "will," "believe," "estimate" and similar expressions. Actual results could differ materially from those expressed or implied in the forward-looking statements. Important factors that could cause actual results to differ materially from those suggested by the forward-looking statements include, but are not limited to, our dependence on the strength of retail, commercial and industrial sectors of the economy; competition with other manufacturers and distributors of consumer products; major retailers' strong bargaining power and consolidation of our retail customers; changes in the prices of raw materials and sourced products and our ability to obtain raw materials and sourced products in a timely manner from suppliers; our ability to develop innovative new products and to develop, maintain and strengthen our end-user brands, including the ability to realize anticipated benefits of increased advertising and promotion spend; product liability, product recalls or regulatory actions; our ability to expeditiously close facilities and move operations while managing foreign regulations and other impediments; a failure of one of our key information technology systems or related controls; our ability to attract, retain and motivate key employees; future events that could adversely affect the value of our assets and require impairment charges; our ability to improve productivity and streamline operations; changes to our credit ratings; significant increases in the funding obligations related to our pension plans due to declining asset values, declining interest rates or otherwise; the imposition of tax liabilities greater than our provisions for such matters; the risks inherent in our foreign operations, including exchange controls and pricing restrictions; our ability to execute our new corporate strategy; our ability to complete planned divestitures, including our ability to obtain the regulatory approvals required to complete the Tools divestiture; our ability to successfully integrate acquired businesses, including the recently acquired Jarden business; our ability to realize the expected benefits and financial results from our recently acquired businesses and planned divestitures; and those factors listed in our filings with the Securities and Exchange Commission (including the information set forth under the caption “Risk Factors” in the Company’s Annual Report on Form 10-K). Changes in such assumptions or factors could produce significantly different results. The information contained in this presentation is as of the date indicated. The company assumes no obligation to update any forward-looking statements contained in this news release as a result of new information or future events or developments.
This presentation contains non-GAAP financial measures within the meaning of Regulation G promulgated by the Securities and Exchange Commission and includes a reconciliation of these non-GAAP financial measures to the most directly comparable financial measures calculated in accordance with GAAP. While the company believes that these non-GAAP financial measures are useful in evaluating the company’s performance, this information should be considered as supplemental in nature and not as a substitute for or superior to the related financial information prepared in accordance with GAAP. Additionally, these non-GAAP financial measures may differ from similar measures presented by other companies.
Forward-looking statements

3
One company with one corporate strategy

4
Strong global core sales growth
5
Driven by leading results in North America
Source: Public filings and transcripts of the respective companies. Please note that core sales may be calculated differently among the companies and therefore the presentation is not necessarily reflective of core sales growth as calculated on a consistent basis:CHD represents YOY change in organic sales in the Consumer Domestic segmentPG represents organic sales growth for North America during the first 6 months of calendar 2016UL represents year over year underlying sales growth for North AmericaRB represents year over year North America organic growth

6
And strong global growth in priority segments
Core sales growth year to date through end of Q3 2016

7
Positive momentum throughout 2016

8
Debt repayment ahead of plan

9
Recently raised FY 2016 outlook

10
New Corporate Strategy
Scale
Category
Geography
Brands
Actionability
Do first what we do best
2017/18 Accelerators
Develop future growth
Better Together
NWL Repeatable Model
Combination Benefits
M&A Platform

11
Leverages a playbook that is proven

12
And unique opportunity in our categories

13
Two Operating Models

14
16 Global Divisions from 32 business units

15
Development & Delivery divisions
16
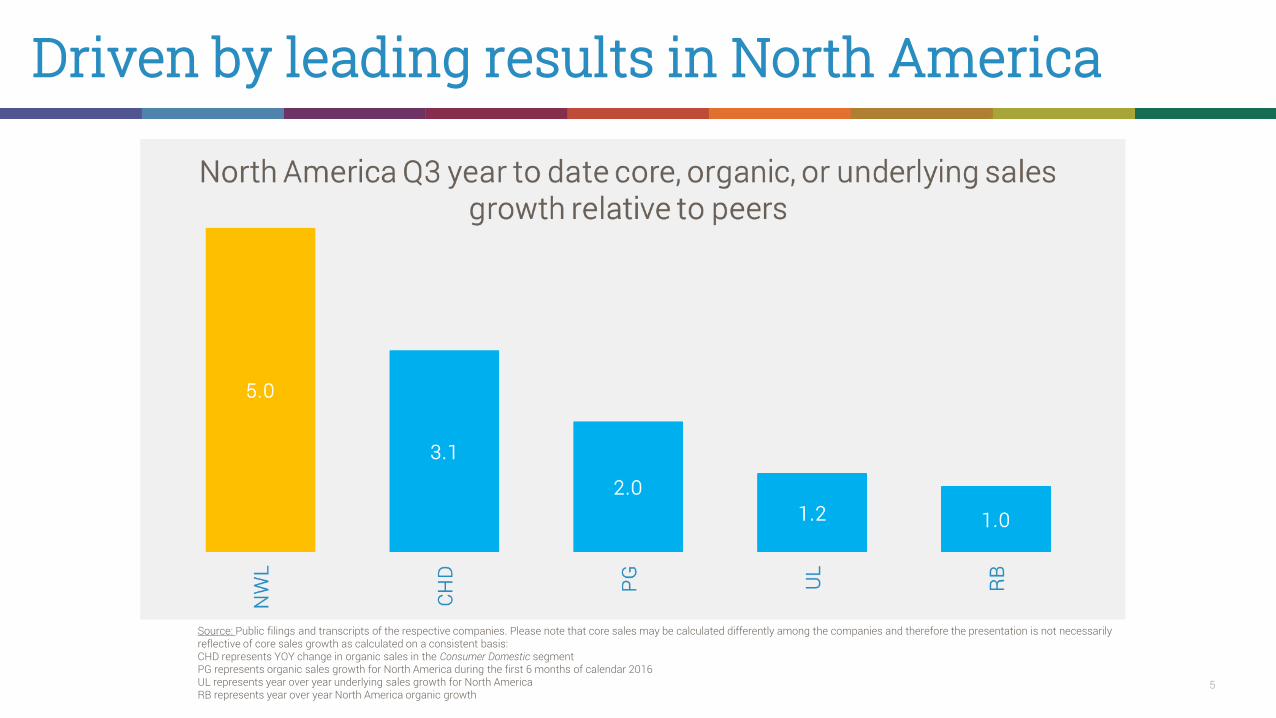
Entrepreneurial divisions

17
3 portfolio roles
• First priority for growth and brand investment
• Core businesses of NWL brands and leading growth contributors
• Actionable growth and innovation platforms funded decisively
• Major commercialization focus (assortment, distribution, international route to market)
• Priority for M&A to scale anchor categories
Win Bigger1 Develop for Growth2
• Potential to become Win Bigger and core anchor categories
• Establish paths to attractive growth and scalable strong business models
• Invest in insights, ideation, design, and brand development to plot future growth funnel
• Invest selectively on proven ideas
• Priority for M&A to accelerate organic development
• Freedom within a defined strategic and budget framework
• Above average EBITDA growth, simple, low risk plans on major value levers
• Not held for sale
• Focused, general manager led business model, simplified organization model
• Possibility M&A can transform
DeliverEntrepreneurially3

18
Newell Brands repeatable model
00%Description
Touching hundreds of millions everyday where they live, learn, work and play with purpose driven brands
Who we are
Growth is the engine that powers us …. Put the consumer at the heart of all that we do
What we believe
Leading brands in large and fragmented markets, responsive to activity and with low cost of growth
Business model
Build meaningful relative market share advantage and become a truly international company
Ambition
Big brand activity, big impact with big customers, reach the consumer where they want to buy
How we win
Money flows to growth, clearchoices driven into action, constantly increase ambition, good enough never is
How we work
Transformative leaders, embrace a dynamic and bold agenda, grow business, grow our people
Building our team
Operating company, building towards $20+bn, one company and one strategy, industry leaders in all core activities
Setting for scale

19
New Growth Game Plan

20
Transformative value creation opportunity
21
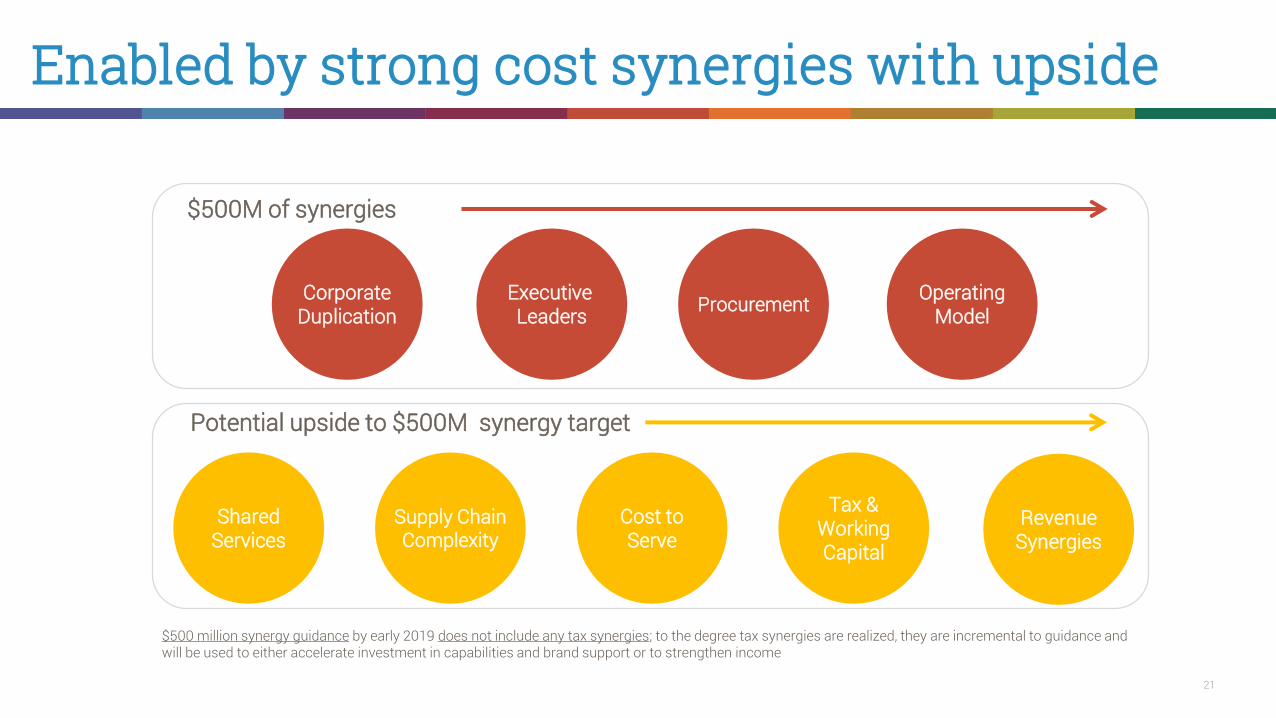
Enabled by strong cost synergies with upside
SharedServices
Supply ChainComplexity
Cost toServe
Tax &WorkingCapital
RevenueSynergies
Potential upside to $500M synergy target
Executive Leaders Procurement Operating
ModelCorporate
Duplication
$500M of synergies
$500 million synergy guidance by early 2019 does not include any tax synergies; to the degree tax synergies are realized, they are incremental to guidance and will be used to either accelerate investment in capabilities and brand support or to strengthen income

22
Will deliver $800m in savings by early 2019

23
Three phased transformation
* The company has presented forward-looking statements regarding normalized earnings per share and core sales growth for Year One, Year Two, and Year Three+, each of which is a non-GAAPfinancial measure. These non–GAAP financial measures are derived by excluding certain amounts, expenses or income and/or certain impacts, including the impact of foreign exchange or businessportfolio determinations, from the corresponding financial measures determined in accordance with GAAP. The determination of the amounts that are excluded from these non-GAAP financialmeasures is a matter of management judgment and depends upon, among other factors, the nature of the underlying expense or income amounts recognized in a given period. We are unable topresent a quantitative reconciliation of the aforementioned forward-looking non-GAAP financial measures to their most directly comparable forward-looking GAAP financial measures because suchinformation is not available and management cannot reliably predict all of the necessary components of such GAAP measures without unreasonable effort or expense. The unavailable informationcould have a significant impact on the company's Year One, Year Two and Year Three+ GAAP financial results.

24
2017 outlook competitive
Core Sales Growth +3% to +4%
Normalized EPS $2.85 to $3.05
Weighted Average Diluted Shares ~488 million
Effective Tax Rate 26% to 27%

25
Powerful investment thesis

26live. learn. work. play.
Morgan Stanley Global Consumer and Retail ConferenceNovember 15, 2016
Michael B. Polk - Chief Executive Officer

27
Appendix

28
2016 Normalized EPS Guidance
Year Ending
December 31, 2016
Diluted earnings per share 1.15$ to 1.20$
Tools sale - tax on basis difference 0.33$ to 0.35$
Project Renewal and Project Lean restructuring and other costs 0.09$ to 0.11$
Integration costs to drive synergies 0.28$ to 0.32$
Estimated gain on sale of Décor (0.24)$ to (0.24)$
Jarden transaction-related costs, including debt/credit facility extinguishment costs 0.19$ to 0.21$
Acquisition-related amortization* and inventory step-up 0.98$ to 1.00$
Normalized earnings per share 2.85$ to 2.90$
* Represents amortization of acquisition-related intangibles beginning in the second quarter of 2016.
Normalized Earnings Per Share
Guidance for the Year Ending December 31, 2016 2.85$ to 2.90$
Less: Reported for Nine Months Ended September 30, 2016 $ (2.08)
Guidance for the Three Months Ending December 31, 2016 0.77$ to 0.82$

29
FY 2016 Core Sales Growth Guidance
Year Ending
December 31, 2016
Estimated net sales growth (GAAP) 122.5% to 128.0%
Less: Jarden net sales growth included in pro forma base 115.0% to 120.0%
Net sales growth, Adjusted Pro Forma (1) 7.5% to 8.0%
Less: Currency -1.0% to -2.0%
Acquisitions, net of divestitures (2) 6.0% to 7.0%
Venezuela deconsolidation -1.0%
Core Sales Growth, Adjusted Pro Forma 3.5% to 4.0%
(1) Adjusted pro forma reflects Jarden sales from April 16, 2016 and 2015, respectively.
(2) Acquisitions, net of divestitures represents estimated sales of The Waddington Group, Inc., Jostens, Inc. and Elmer's Products, Inc. until the one year anniversary
of their respective dates of acquisition, net of the impacts of the divestiture of the Rubbermaid medical cart business in August 2015 and the divestiture of the Levolor and Kirsch window coverings brands ("Décor") in June 2016.

30
Q4 2016 Core Sales Growth Guidance
Estimated net sales growth (GAAP) 233.0% to 236.0%
Less: Jarden net sales growth included in pro forma base 225.0% to 227.0%
Net sales growth, Adjusted Pro Forma (1) 8.0% to 9.0%
Less: Currency -0.5% to -1.0%
Acquisitions, net of divestitures (2) 6.5% to 7.0%
Venezuela deconsolidation -0.5%
Core Sales Growth, Adjusted Pro Forma 2.5% to 3.5%
(1) Adjusted pro forma reflects Jarden sales from April 16, 2015.
(2) Acquisit ions, net of divest itures primarily represents est imated sales of Jostens, Inc. unt il the one year anniversary of the date of acquisit ion, net of the impacts
of the divest iture of the Rubbermaid medical cart business in August 2015 and the divest iture of the Levolor and Kirsch window coverings brands ("Décor") in June
2016 as well as the planned divest itures. Actual divest itures represent the Rubbermaid medical cart business, which the Company divested in August 2015; the
Levolor and Kirsch window coverings brands ("Décor"), which the Company divested in June 2016; as well as the planned divest itures of businesses held for sale
commencing in the third quarter including its Tools business (excluding Dymo® industrial labeling), the Rubbermaid® Consumer Storage business within the Home
Solut ions segment, Teutonia in the Baby and Parenting segment, two winter sports units, Völkl® and K2®, within the Outdoor Solut ions segment, its Heaters,
Humidifiers, and Fans business within the Consumer Solut ions segment, and Lehigh business in the Branded Consumables segment.
Three Months Ending
December 31, 2016

31
Q3 2016 GAAP & Non-GAAP Certain Line Items
NEWELL BRANDS INC.RECONCILIATION OF GAAP AND NON-GAAP INFORMATION
CERTAIN LINE ITEMS
(in millions, except per share data)
Three months ended September 30, 2016
GAAP Measure Acquisition Jarden Jarden transaction Décor Non-GAAP Measure
Advisory Personnel Other Restructuring Product Integration amortization inventory and loss Divestiture Percentage
Reported costs costs costs costs recall costs (2) costs (3) costs (4) step-up (5) related costs (6) on sale (7) costs (8) Normalized* of Sales
Cost of products sold 2,679.8$ -$ (1.5)$ (0.1)$ -$ -$ (0.4)$ (2.9)$ (145.8)$ -$ -$ -$ 2,529.1$ 64.0%
Gross profit 1,274.8$ -$ 1.5$ 0.1$ -$ -$ 0.4$ 2.9$ 145.8$ -$ -$ -$ 1,425.5$ 36.0%
Selling, general & administrative expenses 937.9$ (1.1)$ (4.0)$ (1.9)$ -$ (0.5)$ (52.5)$ (56.7)$ -$ (3.5)$ -$ (1.1)$ 816.6$ 20.6%
Operating income 323.9$ 1.1$ 5.5$ 2.0$ (0.2)$ 0.5$ 66.1$ 59.6$ 145.8$ 3.5$ -$ 1.1$ 608.9$ 15.4%
Non-operating (income) expenses 123.8$ -$ -$ -$ -$ -$ -$ -$ -$ -$ (1.5)$ -$ 122.3$
Income before income taxes 200.1$ 1.1$ 5.5$ 2.0$ (0.2)$ 0.5$ 66.1$ 59.6$ 145.8$ 3.5$ 1.5$ 1.1$ 486.6$
Income taxes (12) 13.6$ 0.3$ 1.7$ 0.6$ (0.1)$ 0.2$ 20.6$ 18.9$ 52.0$ 1.1$ 0.5$ 0.3$ 109.7$
Net income from continuing operations 186.5$ 0.8$ 3.8$ 1.4$ (0.1)$ 0.3$ 45.5$ 40.7$ 93.8$ 2.4$ 1.0$ 0.8$ 376.9$
Net income 186.5$ 0.8$ 3.8$ 1.4$ (0.1)$ 0.3$ 45.5$ 40.7$ 93.8$ 2.4$ 1.0$ 0.8$ 376.9$
Diluted earnings per share** 0.38$ 0.00$ 0.01$ 0.00$ (0.00)$ 0.00$ 0.09$ 0.08$ 0.19$ 0.00$ 0.00$ 0.00$ 0.78$
Project Renewal Costs (1)
(1) Costs associated with Project Renewal during the three months ended September 30, 2016 include $8.6 million of project-related costs and $0.2 million of restructuring reversals. Project-related costs include advisory and consultancy costs,
compensation and related costs of personnel dedicated to transformation projects, and other project-related costs. Costs associated with Project Renewal during the three months ended September 30, 2015 include $22.9 million of project-
related costs and $19.8 million of restructuring costs. Project-related costs include advisory and consultancy costs, compensation and related costs of personnel dedicated to transformation projects, and other project-related costs.
* Normalized results are financial measures that are not in accordance with GAAP and exclude the above normalized adjustments. See below for a discussion of each of these adjustments.
**Totals may not add due to rounding.
(12) The Company determined the tax effect of the items excluded from normalized results by applying the estimated effective rate for the applicable jurisdiction in which the pre-tax items were incurred, and for which realization of the resulting
tax benefit, if any, is expected. In certain situations in which an item excluded from normalized results impacts income tax expense, the Company uses a "with" and "without" approach to determine normalized income tax expense.
(2) During the three months ended September 30, 2016, the Company recognized $0.5 million of charges associated with the Graco product recall.
(3) During the three months ended September 30, 2016, the Company incurred $66.1 million of costs (including $13.2 million of restructuring costs) associated with the integration of Jarden and Elmer's, which primarily represents personnel and
advisory costs associated with the integration of Jarden. During the three months ended September 30, 2015, the Company incurred $1.7 million of costs (including $1.2 million of restructuring costs) associated with the integration of Ignite
Holdings, bubba brands, Baby Jogger, and Elmer's.
(4) During the three months ended September 30, 2016, the Company incurred acquisition amortization costs of $59.6 million.
(5) During the three months ended September 30, 2016, the Company incurred $145.8 million of costs related to the fair-value step-up of Jarden inventory.
(6) During the three months ended September 30, 2016, the Company recognized $3.5 million of costs associated with the Jarden transaction.
(7) During the three months ended September 30, 2016, the Company recognized a loss of $1.5 million related to the working capital adjustment in connection with the divestiture of Décor.
(8) During the three months ended September 30, 2016, the Company recognized $1.1 million of costs associated with the divestiture of Décor and planned divestiture of Tools (excluding Dymo® industrial labeling).
(9) During the three months ended September 30, 2015, the Company recognized an increase of $1.4 million in cost of products sold resulting from increased costs of inventory due to changes in the exchange rate for the Venezuelan Bolivar.
(10) During the three months ended September 30, 2015, the Company recognized foreign exchange losses of $4.5 million resulting from changes in the exchange rate for the Venezuelan Bolivar, which under hyperinflationary accounting is
recorded in the Statement of Operations.
(11) During the three months ended September 30, 2015, the Company recognized $0.2 million of income in discontinued operations primarily associated with Endicia.

32
Q3 2015 GAAP & Non-GAAP Certain Line Items
NEWELL BRANDS INC.RECONCILIATION OF GAAP AND NON-GAAP INFORMATION
CERTAIN LINE ITEMS
(in millions, except per share data)
GAAP Measure Acquisition Inventory charge from Charge resulting from
Advisory Personnel Other Restructuring and integration the devaluation of the the devaluation of the Discontinued Percentage
Reported costs costs costs costs costs (3) Venezuelan Bolivar (9) Venezuelan Bolivar (10) operations (11) Normalized* of Sales
Cost of products sold 931.1$ -$ (1.9)$ (2.2)$ -$ -$ (1.4)$ -$ -$ 925.6$ 60.5%
Gross profit 598.9$ -$ 1.9$ 2.2$ -$ -$ 1.4$ -$ -$ 604.4$ 39.5%
Selling, general & administrative expenses 391.3$ (9.8)$ (6.9)$ (2.1)$ -$ (0.5)$ -$ -$ -$ 372.0$ 24.3%
Operating income 186.6$ 9.8$ 8.8$ 4.3$ 19.8$ 1.7$ 1.4$ -$ -$ 232.4$ 15.2%
Nonoperating expenses 26.8$ -$ -$ -$ -$ -$ -$ (4.5)$ -$ 22.3$
Income before income taxes 159.8$ 9.8$ 8.8$ 4.3$ 19.8$ 1.7$ 1.4$ 4.5$ -$ 210.1$
Income taxes (12) 25.8$ 3.1$ 2.8$ 1.4$ 6.2$ 0.6$ 0.5$ 1.6$ -$ 42.0$
Net income from continuing operations 134.0$ 6.7$ 6.0$ 2.9$ 13.6$ 1.1$ 0.9$ 2.9$ -$ 168.1$
Net income 134.2$ 6.7$ 6.0$ 2.9$ 13.6$ 1.1$ 0.9$ 2.9$ (0.2)$ 168.1$
Diluted earnings per share** 0.50$ 0.02$ 0.02$ 0.01$ 0.05$ 0.00$ 0.00$ 0.01$ (0.00)$ 0.62$
Three months ended September 30, 2015
Project Renewal Costs (1) Non-GAAP Measure
(1) Costs associated with Project Renewal during the three months ended September 30, 2016 include $8.6 million of project-related costs and $0.2 million of restructuring reversals. Project-related costs include advisory and consultancy costs,
compensation and related costs of personnel dedicated to transformation projects, and other project-related costs. Costs associated with Project Renewal during the three months ended September 30, 2015 include $22.9 million of project-
related costs and $19.8 million of restructuring costs. Project-related costs include advisory and consultancy costs, compensation and related costs of personnel dedicated to transformation projects, and other project-related costs.
* Normalized results are financial measures that are not in accordance with GAAP and exclude the above normalized adjustments. See below for a discussion of each of these adjustments.
**Totals may not add due to rounding.
(12) The Company determined the tax effect of the items excluded from normalized results by applying the estimated effective rate for the applicable jurisdiction in which the pre-tax items were incurred, and for which realization of the resulting
tax benefit, if any, is expected. In certain situations in which an item excluded from normalized results impacts income tax expense, the Company uses a "with" and "without" approach to determine normalized income tax expense.
(2) During the three months ended September 30, 2016, the Company recognized $0.5 million of charges associated with the Graco product recall.
(3) During the three months ended September 30, 2016, the Company incurred $66.1 million of costs (including $13.2 million of restructuring costs) associated with the integration of Jarden and Elmer's, which primarily represents personnel and
advisory costs associated with the integration of Jarden. During the three months ended September 30, 2015, the Company incurred $1.7 million of costs (including $1.2 million of restructuring costs) associated with the integration of Ignite
Holdings, bubba brands, Baby Jogger, and Elmer's.
(4) During the three months ended September 30, 2016, the Company incurred acquisition amortization costs of $59.6 million.
(5) During the three months ended September 30, 2016, the Company incurred $145.8 million of costs related to the fair-value step-up of Jarden inventory.
(6) During the three months ended September 30, 2016, the Company recognized $3.5 million of costs associated with the Jarden transaction.
(7) During the three months ended September 30, 2016, the Company recognized a loss of $1.5 million related to the working capital adjustment in connection with the divestiture of Décor.
(8) During the three months ended September 30, 2016, the Company recognized $1.1 million of costs associated with the divestiture of Décor and planned divestiture of Tools (excluding Dymo® industrial labeling).
(9) During the three months ended September 30, 2015, the Company recognized an increase of $1.4 million in cost of products sold resulting from increased costs of inventory due to changes in the exchange rate for the Venezuelan Bolivar.
(10) During the three months ended September 30, 2015, the Company recognized foreign exchange losses of $4.5 million resulting from changes in the exchange rate for the Venezuelan Bolivar, which under hyperinflationary accounting is
recorded in the Statement of Operations.
(11) During the three months ended September 30, 2015, the Company recognized $0.2 million of income in discontinued operations primarily associated with Endicia.
33
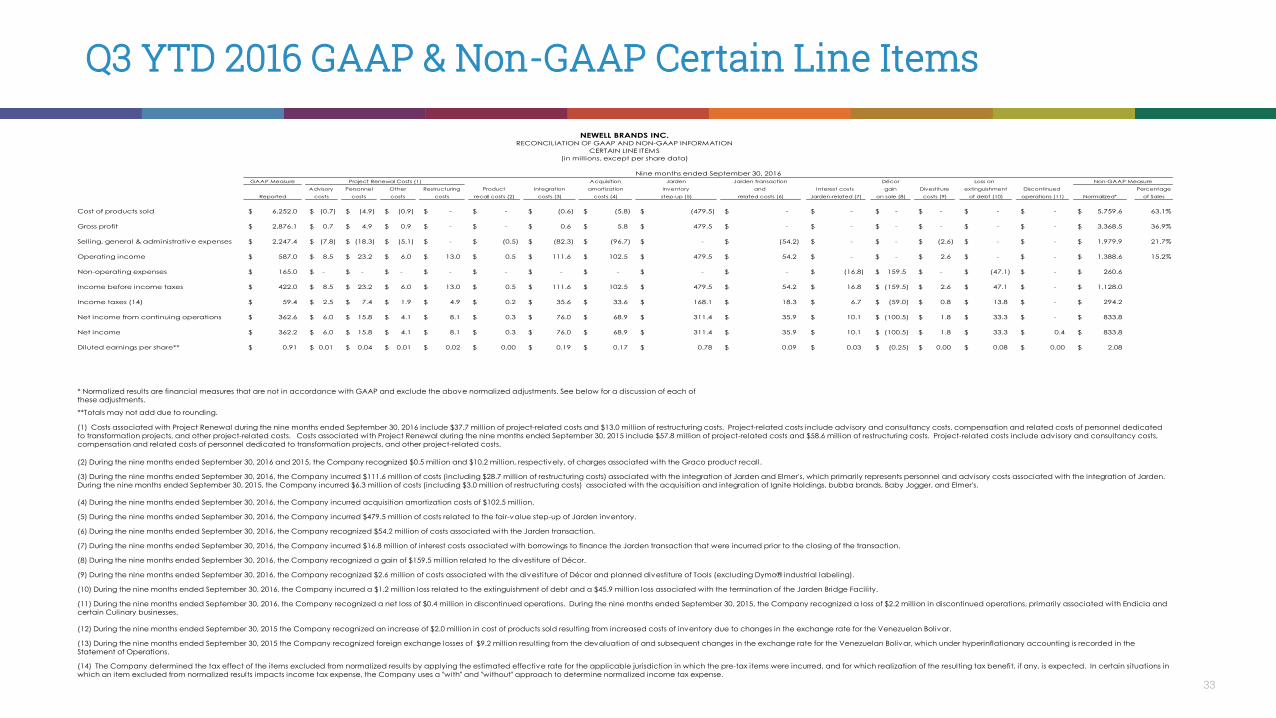
Q3 YTD 2016 GAAP & Non-GAAP Certain Line Items
NEWELL BRANDS INC.RECONCILIATION OF GAAP AND NON-GAAP INFORMATION
CERTAIN LINE ITEMS
(in millions, except per share data)
Nine months ended September 30, 2016
GAAP Measure Acquisition Jarden Jarden transaction Décor Loss on Non-GAAP Measure
Advisory Personnel Other Restructuring Product Integration amortization inventory and Interest costs gain Divestiture extinguishment Discontinued Percentage
Reported costs costs costs costs recall costs (2) costs (3) costs (4) step-up (5) related costs (6) Jarden-related (7) on sale (8) costs (9) of debt (10) operations (11) Normalized* of Sales
Cost of products sold 6,252.0$ (0.7)$ (4.9)$ (0.9)$ -$ -$ (0.6)$ (5.8)$ (479.5)$ -$ -$ -$ -$ -$ -$ 5,759.6$ 63.1%
Gross profit 2,876.1$ 0.7$ 4.9$ 0.9$ -$ -$ 0.6$ 5.8$ 479.5$ -$ -$ -$ -$ -$ -$ 3,368.5$ 36.9%
Selling, general & administrative expenses 2,247.4$ (7.8)$ (18.3)$ (5.1)$ -$ (0.5)$ (82.3)$ (96.7)$ -$ (54.2)$ -$ -$ (2.6)$ -$ -$ 1,979.9$ 21.7%
Operating income 587.0$ 8.5$ 23.2$ 6.0$ 13.0$ 0.5$ 111.6$ 102.5$ 479.5$ 54.2$ -$ -$ 2.6$ -$ -$ 1,388.6$ 15.2%
Non-operating expenses 165.0$ -$ -$ -$ -$ -$ -$ -$ -$ -$ (16.8)$ 159.5$ -$ (47.1)$ -$ 260.6$
Income before income taxes 422.0$ 8.5$ 23.2$ 6.0$ 13.0$ 0.5$ 111.6$ 102.5$ 479.5$ 54.2$ 16.8$ (159.5)$ 2.6$ 47.1$ -$ 1,128.0$
Income taxes (14) 59.4$ 2.5$ 7.4$ 1.9$ 4.9$ 0.2$ 35.6$ 33.6$ 168.1$ 18.3$ 6.7$ (59.0)$ 0.8$ 13.8$ -$ 294.2$
Net income from continuing operations 362.6$ 6.0$ 15.8$ 4.1$ 8.1$ 0.3$ 76.0$ 68.9$ 311.4$ 35.9$ 10.1$ (100.5)$ 1.8$ 33.3$ -$ 833.8$
Net income 362.2$ 6.0$ 15.8$ 4.1$ 8.1$ 0.3$ 76.0$ 68.9$ 311.4$ 35.9$ 10.1$ (100.5)$ 1.8$ 33.3$ 0.4$ 833.8$
Diluted earnings per share** 0.91$ 0.01$ 0.04$ 0.01$ 0.02$ 0.00$ 0.19$ 0.17$ 0.78$ 0.09$ 0.03$ (0.25)$ 0.00$ 0.08$ 0.00$ 2.08$
Project Renewal Costs (1)
(12) During the nine months ended September 30, 2015 the Company recognized an increase of $2.0 million in cost of products sold resulting from increased costs of inventory due to changes in the exchange rate for the Venezuelan Bolivar.
(13) During the nine months ended September 30, 2015 the Company recognized foreign exchange losses of $9.2 million resulting from the devaluation of and subsequent changes in the exchange rate for the Venezuelan Bolivar, which under hyperinflationary accounting is recorded in the
Statement of Operations.
(14) The Company determined the tax effect of the items excluded from normalized results by applying the estimated effective rate for the applicable jurisdiction in which the pre-tax items were incurred, and for which realization of the resulting tax benefit, if any, is expected. In certain situations in
which an item excluded from normalized results impacts income tax expense, the Company uses a "with" and "without" approach to determine normalized income tax expense.
(7) During the nine months ended September 30, 2016, the Company incurred $16.8 million of interest costs associated with borrowings to finance the Jarden transaction that were incurred prior to the closing of the transaction.
(8) During the nine months ended September 30, 2016, the Company recognized a gain of $159.5 million related to the divestiture of Décor.
(9) During the nine months ended September 30, 2016, the Company recognized $2.6 million of costs associated with the divestiture of Décor and planned divestiture of Tools (excluding Dymo® industrial labeling).
(10) During the nine months ended September 30, 2016, the Company incurred a $1.2 million loss related to the extinguishment of debt and a $45.9 million loss associated with the termination of the Jarden Bridge Facility.
(11) During the nine months ended September 30, 2016, the Company recognized a net loss of $0.4 million in discontinued operations. During the nine months ended September 30, 2015, the Company recognized a loss of $2.2 million in discontinued operations, primarily associated with Endicia and
certain Culinary businesses.
(6) During the nine months ended September 30, 2016, the Company recognized $54.2 million of costs associated with the Jarden transaction.
* Normalized results are financial measures that are not in accordance with GAAP and exclude the above normalized adjustments. See below for a discussion of each of
these adjustments.
**Totals may not add due to rounding.
(1) Costs associated with Project Renewal during the nine months ended September 30, 2016 include $37.7 million of project-related costs and $13.0 million of restructuring costs. Project-related costs include advisory and consultancy costs, compensation and related costs of personnel dedicated
to transformation projects, and other project-related costs. Costs associated with Project Renewal during the nine months ended September 30, 2015 include $57.8 million of project-related costs and $58.6 million of restructuring costs. Project-related costs include advisory and consultancy costs,
compensation and related costs of personnel dedicated to transformation projects, and other project-related costs.
(2) During the nine months ended September 30, 2016 and 2015, the Company recognized $0.5 million and $10.2 million, respectively, of charges associated with the Graco product recall.
(3) During the nine months ended September 30, 2016, the Company incurred $111.6 million of costs (including $28.7 million of restructuring costs) associated with the integration of Jarden and Elmer's, which primarily represents personnel and advisory costs associated with the integration of Jarden.
During the nine months ended September 30, 2015, the Company incurred $6.3 million of costs (including $3.0 million of restructuring costs) associated with the acquisition and integration of Ignite Holdings, bubba brands, Baby Jogger, and Elmer's.
(4) During the nine months ended September 30, 2016, the Company incurred acquisition amortization costs of $102.5 million.
(5) During the nine months ended September 30, 2016, the Company incurred $479.5 million of costs related to the fair-value step-up of Jarden inventory.

34
Q3 YTD 2015 GAAP & Non-GAAP Certain Line Items
NEWELL BRANDS INC.RECONCILIATION OF GAAP AND NON-GAAP INFORMATION
CERTAIN LINE ITEMS
(in millions, except per share data)
GAAP Measure Acquisition Inventory charge from Charge resulting from
Advisory Personnel Other Restructuring Product and integration Discontinued the devaluation of the the devaluation of the Percentage
Reported costs costs costs costs recall costs (2) costs (3) operations (11) Venezuelan Bolivar (12) Venezuelan Bolivar (13) Normalized* of Sales
Cost of products sold 2,647.5$ -$ (3.7)$ (4.5)$ -$ -$ (1.6)$ -$ (2.0)$ -$ 2,635.7$ 60.5%
Gross profit 1,707.4$ -$ 3.7$ 4.5$ -$ -$ 1.6$ -$ 2.0$ -$ 1,719.2$ 39.5%
Selling, general & administrative expenses 1,146.3$ (31.8)$ (13.6)$ (4.2)$ -$ (10.2)$ (1.7)$ -$ -$ -$ 1,084.8$ 24.9%
Operating income 499.5$ 31.8$ 17.3$ 8.7$ 58.6$ 10.2$ 6.3$ -$ 2.0$ -$ 634.4$ 14.6%
Nonoperating expenses 69.2$ -$ -$ -$ -$ -$ -$ -$ -$ (9.2)$ 60.0$
Income before income taxes 430.3$ 31.8$ 17.3$ 8.7$ 58.6$ 10.2$ 6.3$ -$ 2.0$ 9.2$ 574.4$
Income taxes (14) 91.3$ 10.8$ 5.9$ 2.9$ 14.5$ 3.3$ 2.3$ -$ 0.7$ 3.1$ 134.8$
Net income from continuing operations 339.0$ 21.0$ 11.4$ 5.8$ 44.1$ 6.9$ 4.0$ -$ 1.3$ 6.1$ 439.6$
Net income 336.8$ 21.0$ 11.4$ 5.8$ 44.1$ 6.9$ 4.0$ 2.2$ 1.3$ 6.1$ 439.6$
Diluted earnings per share** 1.24$ 0.08$ 0.04$ 0.02$ 0.16$ 0.03$ 0.01$ 0.01$ 0.00$ 0.02$ 1.62$
Nine months ended September 30, 2015
Project Renewal Costs (1) Non-GAAP Measure
(12) During the nine months ended September 30, 2015 the Company recognized an increase of $2.0 million in cost of products sold resulting from increased costs of inventory due to changes in the exchange rate for the Venezuelan Bolivar.
(13) During the nine months ended September 30, 2015 the Company recognized foreign exchange losses of $9.2 million resulting from the devaluation of and subsequent changes in the exchange rate for the Venezuelan Bolivar, which under hyperinflationary accounting is recorded in the
Statement of Operations.
(14) The Company determined the tax effect of the items excluded from normalized results by applying the estimated effective rate for the applicable jurisdiction in which the pre-tax items were incurred, and for which realization of the resulting tax benefit, if any, is expected. In certain situations in
which an item excluded from normalized results impacts income tax expense, the Company uses a "with" and "without" approach to determine normalized income tax expense.
(7) During the nine months ended September 30, 2016, the Company incurred $16.8 million of interest costs associated with borrowings to finance the Jarden transaction that were incurred prior to the closing of the transaction.
(8) During the nine months ended September 30, 2016, the Company recognized a gain of $159.5 million related to the divestiture of Décor.
(9) During the nine months ended September 30, 2016, the Company recognized $2.6 million of costs associated with the divestiture of Décor and planned divestiture of Tools (excluding Dymo® industrial labeling).
(10) During the nine months ended September 30, 2016, the Company incurred a $1.2 million loss related to the extinguishment of debt and a $45.9 million loss associated with the termination of the Jarden Bridge Facility.
(11) During the nine months ended September 30, 2016, the Company recognized a net loss of $0.4 million in discontinued operations. During the nine months ended September 30, 2015, the Company recognized a loss of $2.2 million in discontinued operations, primarily associated with Endicia and
certain Culinary businesses.
(6) During the nine months ended September 30, 2016, the Company recognized $54.2 million of costs associated with the Jarden transaction.
* Normalized results are financial measures that are not in accordance with GAAP and exclude the above normalized adjustments. See below for a discussion of each of
these adjustments.
**Totals may not add due to rounding.
(1) Costs associated with Project Renewal during the nine months ended September 30, 2016 include $37.7 million of project-related costs and $13.0 million of restructuring costs. Project-related costs include advisory and consultancy costs, compensation and related costs of personnel dedicated
to transformation projects, and other project-related costs. Costs associated with Project Renewal during the nine months ended September 30, 2015 include $57.8 million of project-related costs and $58.6 million of restructuring costs. Project-related costs include advisory and consultancy costs,
compensation and related costs of personnel dedicated to transformation projects, and other project-related costs.
(2) During the nine months ended September 30, 2016 and 2015, the Company recognized $0.5 million and $10.2 million, respectively, of charges associated with the Graco product recall.
(3) During the nine months ended September 30, 2016, the Company incurred $111.6 million of costs (including $28.7 million of restructuring costs) associated with the integration of Jarden and Elmer's, which primarily represents personnel and advisory costs associated with the integration of Jarden.
During the nine months ended September 30, 2015, the Company incurred $6.3 million of costs (including $3.0 million of restructuring costs) associated with the acquisition and integration of Ignite Holdings, bubba brands, Baby Jogger, and Elmer's.
(4) During the nine months ended September 30, 2016, the Company incurred acquisition amortization costs of $102.5 million.
(5) During the nine months ended September 30, 2016, the Company incurred $479.5 million of costs related to the fair-value step-up of Jarden inventory.
35
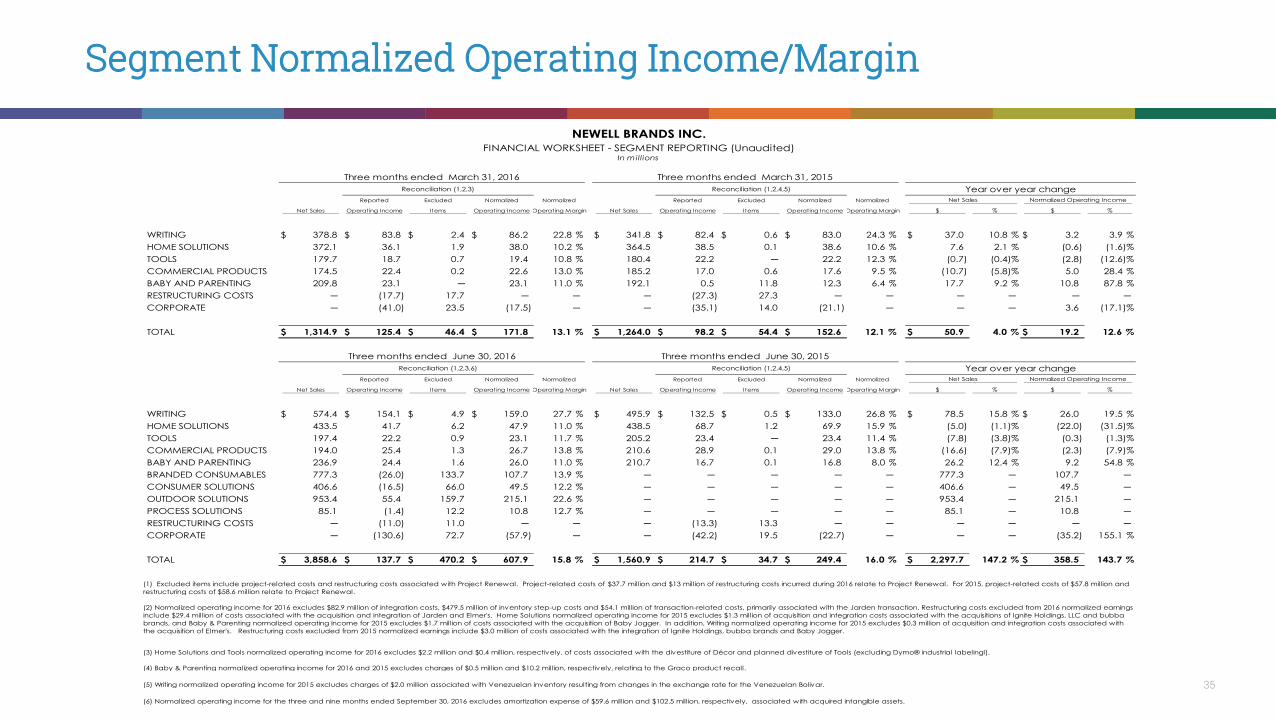
Segment Normalized Operating Income/Margin
NEWELL BRANDS INC.FINANCIAL WORKSHEET - SEGMENT REPORTING (Unaudited)
In millions
Three months ended March 31, 2016 Three months ended March 31, 2015
Reconciliation (1,2,3) Reconciliation (1,2,4,5) Year over year change
Reported Excluded Normalized Normalized Reported Excluded Normalized Normalized Net Sales Normalized Operating Income
Net Sales Operating Income Items Operating Income Operating Margin Net Sales Operating Income Items Operating Income Operating Margin $ % $ %
WRITING 378.8$ 83.8$ 2.4$ 86.2$ 22.8 % 341.8$ 82.4$ 0.6$ 83.0$ 24.3 % 37.0$ 10.8 % 3.2$ 3.9 %
HOME SOLUTIONS 372.1 36.1 1.9 38.0 10.2 % 364.5 38.5 0.1 38.6 10.6 % 7.6 2.1 % (0.6) (1.6)%
TOOLS 179.7 18.7 0.7 19.4 10.8 % 180.4 22.2 ─ 22.2 12.3 % (0.7) (0.4)% (2.8) (12.6)%
COMMERCIAL PRODUCTS 174.5 22.4 0.2 22.6 13.0 % 185.2 17.0 0.6 17.6 9.5 % (10.7) (5.8)% 5.0 28.4 %
BABY AND PARENTING 209.8 23.1 ─ 23.1 11.0 % 192.1 0.5 11.8 12.3 6.4 % 17.7 9.2 % 10.8 87.8 %
RESTRUCTURING COSTS ─ (17.7) 17.7 ─ ─ ─ (27.3) 27.3 ─ ─ ─ ─ ─ ─
CORPORATE ─ (41.0) 23.5 (17.5) ─ ─ (35.1) 14.0 (21.1) ─ ─ ─ 3.6 (17.1)%
TOTAL 1,314.9$ 125.4$ 46.4$ 171.8$ 13.1 % 1,264.0$ 98.2$ 54.4$ 152.6$ 12.1 % 50.9$ 4.0 % 19.2$ 12.6 %
Three months ended June 30, 2016 Three months ended June 30, 2015
Reconciliation (1,2,3,6) Reconciliation (1,2,4,5) Year over year change
Reported Excluded Normalized Normalized Reported Excluded Normalized Normalized Net Sales Normalized Operating Income
Net Sales Operating Income Items Operating Income Operating Margin Net Sales Operating Income Items Operating Income Operating Margin $ % $ %
WRITING 574.4$ 154.1$ 4.9$ 159.0$ 27.7 % 495.9$ 132.5$ 0.5$ 133.0$ 26.8 % 78.5$ 15.8 % 26.0$ 19.5 %
HOME SOLUTIONS 433.5 41.7 6.2 47.9 11.0 % 438.5 68.7 1.2 69.9 15.9 % (5.0) (1.1)% (22.0) (31.5)%
TOOLS 197.4 22.2 0.9 23.1 11.7 % 205.2 23.4 ─ 23.4 11.4 % (7.8) (3.8)% (0.3) (1.3)%
COMMERCIAL PRODUCTS 194.0 25.4 1.3 26.7 13.8 % 210.6 28.9 0.1 29.0 13.8 % (16.6) (7.9)% (2.3) (7.9)%
BABY AND PARENTING 236.9 24.4 1.6 26.0 11.0 % 210.7 16.7 0.1 16.8 8.0 % 26.2 12.4 % 9.2 54.8 %
BRANDED CONSUMABLES 777.3 (26.0) 133.7 107.7 13.9 % ─ ─ ─ ─ ─ 777.3 ─ 107.7 ─
CONSUMER SOLUTIONS 406.6 (16.5) 66.0 49.5 12.2 % ─ ─ ─ ─ ─ 406.6 ─ 49.5 ─
OUTDOOR SOLUTIONS 953.4 55.4 159.7 215.1 22.6 % ─ ─ ─ ─ ─ 953.4 ─ 215.1 ─
PROCESS SOLUTIONS 85.1 (1.4) 12.2 10.8 12.7 % ─ ─ ─ ─ ─ 85.1 ─ 10.8 ─
RESTRUCTURING COSTS ─ (11.0) 11.0 ─ ─ ─ (13.3) 13.3 ─ ─ ─ ─ ─ ─
CORPORATE ─ (130.6) 72.7 (57.9) ─ ─ (42.2) 19.5 (22.7) ─ ─ ─ (35.2) 155.1 %
TOTAL 3,858.6$ 137.7$ 470.2$ 607.9$ 15.8 % 1,560.9$ 214.7$ 34.7$ 249.4$ 16.0 % 2,297.7$ 147.2 % 358.5$ 143.7 %
(1) Excluded items include project-related costs and restructuring costs associated with Project Renewal. Project-related costs of $37.7 million and $13 million of restructuring costs incurred during 2016 relate to Project Renewal. For 2015, project-related costs of $57.8 million and
restructuring costs of $58.6 million relate to Project Renewal.
(2) Normalized operating income for 2016 excludes $82.9 million of integration costs, $479.5 million of inventory step-up costs and $54.1 million of transaction-related costs, primarily associated with the Jarden transaction. Restructuring costs excluded from 2016 normalized earnings
include $29.4 million of costs associated with the acquisition and integration of Jarden and Elmer's. Home Solutions normalized operating income for 2015 excludes $1.3 million of acquisition and integration costs associated with the acquisitions of Ignite Holdings, LLC and bubba
brands, and Baby & Parenting normalized operating income for 2015 excludes $1.7 million of costs associated with the acquisition of Baby Jogger. In addition, Writing normalized operating income for 2015 excludes $0.3 million of acquisition and integration costs associated with
the acquisition of Elmer's. Restructuring costs excluded from 2015 normalized earnings include $3.0 million of costs associated with the integration of Ignite Holdings, bubba brands and Baby Jogger.
(3) Home Solutions and Tools normalized operating income for 2016 excludes $2.2 million and $0.4 million, respectively, of costs associated with the divestiture of Décor and planned divestiture of Tools (excluding Dymo® industrial labelingl).
(6) Normalized operating income for the three and nine months ended September 30, 2016 excludes amortization expense of $59.6 million and $102.5 million, respectively, associated with acquired intangible assets.
(4) Baby & Parenting normalized operating income for 2016 and 2015 excludes charges of $0.5 million and $10.2 million, respectively, relating to the Graco product recall.
(5) Writing normalized operating income for 2015 excludes charges of $2.0 million associated with Venezuelan inventory resulting from changes in the exchange rate for the Venezuelan Bolivar.

36
Segment Normalized Operating Income/Margin (cont’d)
NEWELL BRANDS INC.FINANCIAL WORKSHEET - SEGMENT REPORTING (Unaudited)
In millions
Three months ended September 30, 2016 Three months ended September 30, 2015
Reconciliation (1,2,3,4,5,6) Reconciliation (1,2,4,5) Year over year change
Reported Excluded Normalized Normalized Reported Excluded Normalized Normalized Net Sales Normalized Operating Income
Net Sales Operating Income Items Operating Income Operating Margin Net Sales Operating Income Items Operating Income Operating Margin $ % $ %
WRITING 526.3$ 131.5$ 5.2$ 136.7$ 26.0 % 459.5$ 114.1$ 2.3$ 116.4$ 25.3 % 66.8$ 14.5 % 20.3$ 17.4 %
HOME SOLUTIONS 371.8 56.1 6.0 62.1 16.7 % 459.4 76.0 0.5 76.5 16.7 % (87.6) (19.1)% (14.4) (18.8)%
TOOLS 185.5 22.1 1.1 23.2 12.5 % 196.7 20.5 ─ 20.5 10.4 % (11.2) (5.7)% 2.7 13.2 %
COMMERCIAL PRODUCTS 199.2 33.7 1.5 35.2 17.7 % 206.8 29.5 1.9 31.4 15.2 % (7.6) (3.7)% 3.8 12.1 %
BABY AND PARENTING 231.1 34.6 2.2 36.8 15.9 % 207.6 10.2 ─ 10.2 4.9 % 23.5 11.3 % 26.6 260.8 %
BRANDED CONSUMABLES 957.3 122.3 42.5 164.8 17.2 % ─ ─ ─ ─ ─ 957.3 ─ 164.8 ─
CONSUMER SOLUTIONS 650.0 38.0 54.0 92.0 14.2 % ─ ─ ─ ─ ─ 650.0 ─ 92.0 ─
OUTDOOR SOLUTIONS 731.9 (18.7) 102.3 83.6 11.4 % ─ ─ ─ ─ ─ 731.9 ─ 83.6 ─
PROCESS SOLUTIONS 101.5 7.4 5.0 12.4 12.2 % ─ ─ ─ ─ ─ 101.5 ─ 12.4 ─
RESTRUCTURING COSTS ─ (13.0) 13.0 ─ ─ ─ (21.0) 21.0 ─ ─ ─ ─ ─ ─
CORPORATE ─ (90.1) 52.2 (37.9) ─ ─ (42.7) 20.1 (22.6) ─ ─ ─ (15.3) 67.7 %
TOTAL 3,954.6$ 323.9$ 285.0$ 608.9$ 15.4 % 1,530.0$ 186.6$ 45.8$ 232.4$ 15.2 % 2,424.6$ 158.5 % 376.5$ 162.0 %
Nine months ended September 30, 2016 Nine months ended September 30, 2015Reconciliation (1,2,3,4,5,6) Reconciliation (1,2,4,5) Year over year change
Reported Excluded Normalized Normalized Reported Excluded Normalized Normalized Net Sales Normalized Operating Income
Net Sales Operating Income Items Operating Income Operating Margin Net Sales Operating Income Items Operating Income Operating Margin $ % $ %
WRITING 1,479.5$ 369.4$ 12.5$ 381.9$ 25.8 % 1,297.2$ 329.0$ 3.4$ 332.4$ 25.6 % 182.3$ 14.1 % 49.5$ 14.9 %
HOME SOLUTIONS 1,177.4 133.9 14.1 148.0 12.6 % 1,262.4 183.2 1.8 185.0 14.7 % (85.0) (6.7)% (37.0) (20.0)%
TOOLS 562.6 63.0 2.7 65.7 11.7 % 582.3 66.1 ─ 66.1 11.4 % (19.7) (3.4)% (0.4) (0.6)%
COMMERCIAL PRODUCTS 567.7 81.5 3.0 84.5 14.9 % 602.6 75.4 2.6 78.0 12.9 % (34.9) (5.8)% 6.5 8.3 %
BABY AND PARENTING 677.8 82.1 3.8 85.9 12.7 % 610.4 27.4 11.9 39.3 6.4 % 67.4 11.0 % 46.6 118.6 %
BRANDED CONSUMABLES 1,734.6 96.3 176.2 272.5 15.7 % ─ ─ ─ ─ ─ 1,734.6 ─ 272.5 ─
CONSUMER SOLUTIONS 1,056.6 21.5 120.0 141.5 13.4 % ─ ─ ─ ─ ─ 1,056.6 ─ 141.5 ─
OUTDOOR SOLUTIONS 1,685.3 36.7 262.0 298.7 17.7 % ─ ─ ─ ─ ─ 1,685.3 ─ 298.7 ─
PROCESS SOLUTIONS 186.6 6.0 17.2 23.2 12.4 % ─ ─ ─ ─ ─ 186.6 ─ 23.2 ─
RESTRUCTURING COSTS ─ (41.7) 41.7 ─ ─ ─ (61.6) 61.6 ─ ─ ─ ─ ─ ─
CORPORATE ─ (261.7) 148.4 (113.3) ─ ─ (120.0) 53.6 (66.4) ─ ─ ─ (46.9) 70.6 %
TOTAL 9,128.1$ 587.0$ 801.6$ 1,388.6$ 15.2 % 4,354.9$ 499.5$ 134.9$ 634.4$ 14.6 % 4,773.2$ 109.6 % 754.2$ 118.9 %
(1) Excluded items include project-related costs and restructuring costs associated with Project Renewal. Project-related costs of $37.7 million and $13 million of restructuring costs incurred during 2016 relate to Project Renewal. For 2015, project-related costs of $57.8 million and
restructuring costs of $58.6 million relate to Project Renewal.
(2) Normalized operating income for 2016 excludes $82.9 million of integration costs, $479.5 million of inventory step-up costs and $54.1 million of transaction-related costs, primarily associated with the Jarden transaction. Restructuring costs excluded from 2016 normalized earnings
include $29.4 million of costs associated with the acquisition and integration of Jarden and Elmer's. Home Solutions normalized operating income for 2015 excludes $1.3 million of acquisition and integration costs associated with the acquisitions of Ignite Holdings, LLC and bubba
brands, and Baby & Parenting normalized operating income for 2015 excludes $1.7 million of costs associated with the acquisition of Baby Jogger. In addition, Writing normalized operating income for 2015 excludes $0.3 million of acquisition and integration costs associated with
the acquisition of Elmer's. Restructuring costs excluded from 2015 normalized earnings include $3.0 million of costs associated with the integration of Ignite Holdings, bubba brands and Baby Jogger.
(3) Home Solutions and Tools normalized operating income for 2016 excludes $2.2 million and $0.4 million, respectively, of costs associated with the divestiture of Décor and planned divestiture of Tools (excluding Dymo® industrial labelingl).
(6) Normalized operating income for the three and nine months ended September 30, 2016 excludes amortization expense of $59.6 million and $102.5 million, respectively, associated with acquired intangible assets.
(4) Baby & Parenting normalized operating income for 2016 and 2015 excludes charges of $0.5 million and $10.2 million, respectively, relating to the Graco product recall.
(5) Writing normalized operating income for 2015 excludes charges of $2.0 million associated with Venezuelan inventory resulting from changes in the exchange rate for the Venezuelan Bolivar.

37
Q3 2016 Core Sales by Segment
NEWELL BRANDS INC.CURRENCY ANALYSIS BY SEGMENT ACTUAL AND ADJUSTED PRO FORMA BASIS (UNAUDITED)
For the periods ended September 30, 2016 and 2015
$ in Millions
Three months ended September 30, 2016 and 2015 Increase/(Decrease)
2016
Net Sales
(Reported) (1)
Acquisitions/
Divestitures (3)
Net Sales
Base Business
Currency
Impact (2)
2016
Core Sales (2)
2015
Net Sales
(Pro forma) (1)
Divestitures
(3)
Net Sales
Base Business
Currency
Impact
2015
Core Sales (2)
Core Sales (2)
$ %
WRITING 526.3 (76.9) 449.4 6.3 455.7 459.5 (40.3) 419.2 3.8 423.0 32.7 7.7 %
HOME SOLUTIONS 371.8 (15.2) 356.6 1.7 358.3 459.4 (99.9) 359.5 0.6 360.1 (1.8) (0.5)%
TOOLS 185.5 (179.0) 6.5 0.3 6.8 196.7 (192.7) 4.0 2.5 6.5 0.3 4.6 %
COMMERCIAL PRODUCTS 199.2 ─ 199.2 0.4 199.6 206.8 (3.8) 203.0 0.3 203.3 (3.7) (1.8)%
BABY AND PARENTING 231.1 (1.4) 229.7 (3.9) 225.8 207.6 (3.7) 203.9 0.2 204.1 21.7 10.6 %
BRANDED CONSUMABLES 957.3 (74.1) 883.2 21.2 904.4 910.1 (12.8) 897.3 1.9 899.2 5.2 0.6 %
CONSUMER SOLUTIONS 650.0 (90.2) 559.8 13.2 573.0 602.4 (83.1) 519.3 4.8 524.1 48.9 9.3 %
OUTDOOR SOLUTIONS 731.9 (212.7) 519.2 (5.5) 513.7 652.8 (125.0) 527.8 2.7 530.5 (16.8) (3.2)%
PROCESS SOLUTIONS 101.5 ─ 101.5 1.0 102.5 91.1 ─ 91.1 0.1 91.2 11.3 12.4 %
TOTAL COMPANY 3,954.6$ (649.5)$ 3,305.1$ 34.7$ 3,339.8$ 3,786.4$ (561.3)$ 3,225.1$ 16.9$ 3,242.0$ 97.8$ 3.0 %
LESS: JARDEN ACQUISITION (2,256.4)
2015 AS REPORTED 1,530.0$
(1) Includes Jarden segment and consolidated sales from April 16, 2016 and 2015, respectively.
(2) "Currency Impact" is determined as the difference between the reported net sales and those reported net sales converted at a fixed exchange rate, calculated as the 12-month average in 2015,
excluding the impacts of acquisitions and divestitures. “Core Sales” excludes the impact of currency, acquisitions, and divestitures.
(3) Actual divestitures represent the Rubbermaid medical cart business, which the Company divested in August 2015; the Levolor and Kirsch window coverings brands ("Décor"),
which the Company divested in June 2016; and, the Company's Venezuela operations, which the Company deconsolidated as of December 31, 2015, as well as the planned divestitures
of businesses held for sale commencing in the third quarter including its Tools business (excluding Dymo® industrial labeling), the Rubbermaid® Consumer Storage business within the Home Solutions segment,
Teutonia in the Baby and Parenting segment, two winter sports units, Völkl® and K2®, within the Outdoor Solutions segment, its Heaters, Humidifiers, and Fans business within the Consumer Solutions segment,
and Lehigh business in the Branded Consumables segment. Acquisitions mainly represent Waddington Group Inc., Jostens, Inc., and Elmer’s Products, Inc.

38
Q3 YTD 2016 Core Sales by Segment
NEWELL BRANDS INC.CURRENCY ANALYSIS BY SEGMENT ACTUAL AND ADJUSTED PRO FORMA BASIS (UNAUDITED)
For the periods ended September 30, 2016 and 2015
$ in Millions
Nine months ended September 30, 2016 and 2015 Increase/(Decrease)
2016
Net Sales
(Reported) (1)
Acquisitions/
Divestitures (3)
Net Sales
Base Business
Currency
Impact (2)
2016
Core Sales (2)
2015
Net Sales
(Pro forma) (1)
Divestitures
(3)
Net Sales
Base Business
Currency
Impact
2015
Core Sales (2)
Core Sales (2)
$ %
WRITING 1,479.5 (201.7) 1,277.8 20.0 1,297.8 1,297.2 (104.8) 1,192.4 (5.8) 1,186.6 111.2 9.4 %
HOME SOLUTIONS 1,177.4 (156.8) 1,020.6 5.2 1,025.8 1,262.4 (250.3) 1,012.1 (1.3) 1,010.8 15.0 1.5 %
TOOLS 562.6 (179.0) 383.6 5.8 389.4 582.3 (192.7) 389.6 (2.9) 386.7 2.7 0.7 %
COMMERCIAL PRODUCTS 567.7 ─ 567.7 2.6 570.3 602.6 (26.4) 576.2 (1.1) 575.1 (4.8) (0.8)%
BABY AND PARENTING 677.8 (1.4) 676.4 (7.3) 669.1 610.4 (3.7) 606.7 (0.4) 606.3 62.8 10.4 %
BRANDED CONSUMABLES 1,734.6 (251.0) 1,483.6 30.2 1,513.8 1,478.2 (12.8) 1,465.4 (0.8) 1,464.6 49.2 3.4 %
CONSUMER SOLUTIONS 1,056.6 (90.2) 966.4 22.1 988.5 990.0 (83.1) 906.9 0.9 907.8 80.7 8.9 %
OUTDOOR SOLUTIONS 1,685.3 (541.9) 1,143.4 (8.3) 1,135.1 1,273.7 (125.0) 1,148.7 (0.1) 1,148.6 (13.5) (1.2)%
PROCESS SOLUTIONS 186.6 ─ 186.6 1.2 187.8 176.0 ─ 176.0 0.1 176.1 11.7 6.6 %
TOTAL COMPANY PRO FORMA 9,128.1$ (1,422.0)$ 7,706.1$ 71.5$ 7,777.6$ 8,272.8$ (798.8)$ 7,474.0$ (11.4)$ 7,462.6$ 315.0$ 4.2 %
LESS: JARDEN ACQUISITION (3,917.9)
2015 AS REPORTED 4,354.9$
(1) Includes Jarden segment and consolidated sales from April 16, 2016 and 2015, respectively.
(2) "Currency Impact" is determined as the difference between the reported net sales and those reported net sales converted at a fixed exchange rate, calculated as the 12-month average in 2015,
excluding the impacts of acquisitions and divestitures. “Core Sales” excludes the impact of currency, acquisitions, and divestitures.
(3) Actual divestitures represent the Rubbermaid medical cart business, which the Company divested in August 2015; the Levolor and Kirsch window coverings brands ("Décor"),
which the Company divested in June 2016; and, the Company's Venezuela operations, which the Company deconsolidated as of December 31, 2015, as well as the planned divestitures
of businesses held for sale commencing in the third quarter including its Tools business (excluding Dymo® industrial labeling), the Rubbermaid® Consumer Storage business within the Home Solutions segment,
Teutonia in the Baby and Parenting segment, two winter sports units, Völkl® and K2®, within the Outdoor Solutions segment, its Heaters, Humidifiers, and Fans business within the Consumer Solutions segment,
and Lehigh business in the Branded Consumables segment. Acquisitions mainly represent Waddington Group Inc., Jostens, Inc., and Elmer’s Products, Inc.
39
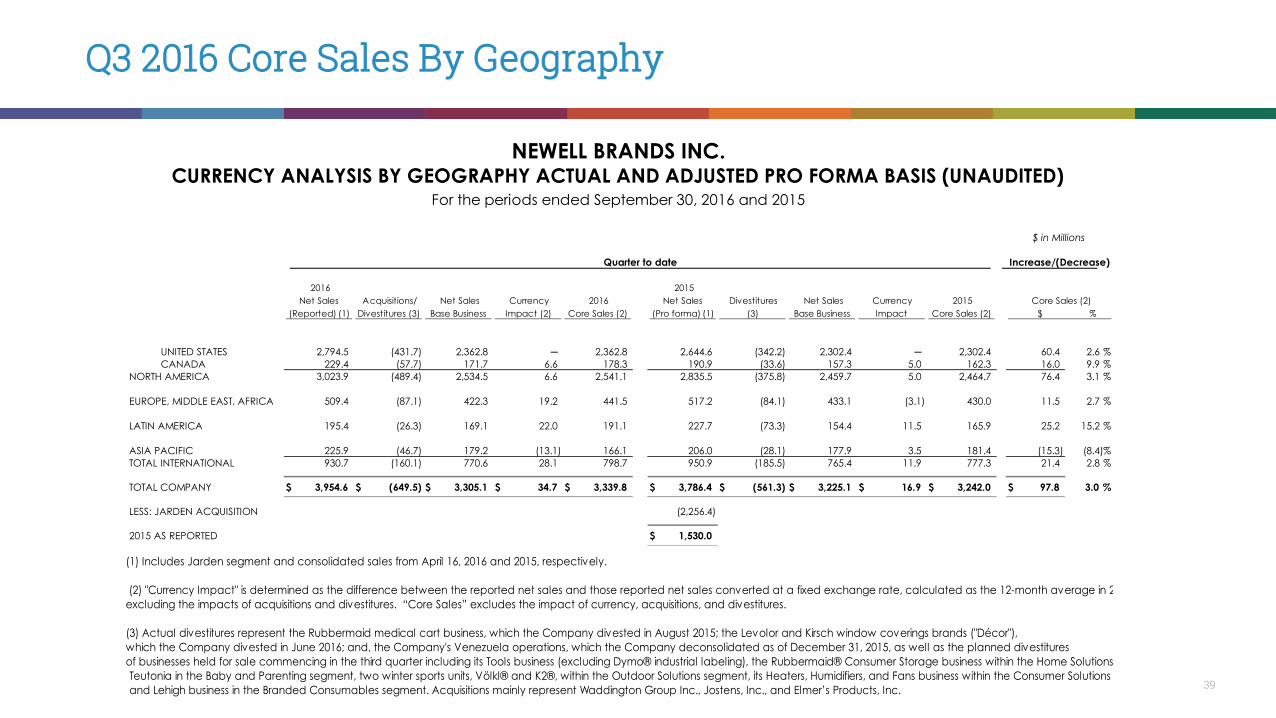
Q3 2016 Core Sales By Geography
NEWELL BRANDS INC.CURRENCY ANALYSIS BY GEOGRAPHY ACTUAL AND ADJUSTED PRO FORMA BASIS (UNAUDITED)
For the periods ended September 30, 2016 and 2015
$ in Millions
Quarter to date Increase/(Decrease)
2016
Net Sales
(Reported) (1)
Acquisitions/
Divestitures (3)
Net Sales
Base Business
Currency
Impact (2)
2016
Core Sales (2)
2015
Net Sales
(Pro forma) (1)
Divestitures
(3)
Net Sales
Base Business
Currency
Impact
2015
Core Sales (2)
Core Sales (2)
$ %
UNITED STATES 2,794.5 (431.7) 2,362.8 ─ 2,362.8 2,644.6 (342.2) 2,302.4 ─ 2,302.4 60.4 2.6 %
CANADA 229.4 (57.7) 171.7 6.6 178.3 190.9 (33.6) 157.3 5.0 162.3 16.0 9.9 %
NORTH AMERICA 3,023.9 (489.4) 2,534.5 6.6 2,541.1 2,835.5 (375.8) 2,459.7 5.0 2,464.7 76.4 3.1 %
EUROPE, MIDDLE EAST, AFRICA 509.4 (87.1) 422.3 19.2 441.5 517.2 (84.1) 433.1 (3.1) 430.0 11.5 2.7 %
LATIN AMERICA 195.4 (26.3) 169.1 22.0 191.1 227.7 (73.3) 154.4 11.5 165.9 25.2 15.2 %
ASIA PACIFIC 225.9 (46.7) 179.2 (13.1) 166.1 206.0 (28.1) 177.9 3.5 181.4 (15.3) (8.4)%
TOTAL INTERNATIONAL 930.7 (160.1) 770.6 28.1 798.7 950.9 (185.5) 765.4 11.9 777.3 21.4 2.8 %
TOTAL COMPANY 3,954.6$ (649.5)$ 3,305.1$ 34.7$ 3,339.8$ 3,786.4$ (561.3)$ 3,225.1$ 16.9$ 3,242.0$ 97.8$ 3.0 %
LESS: JARDEN ACQUISITION (2,256.4)
2015 AS REPORTED 1,530.0$
(1) Includes Jarden segment and consolidated sales from April 16, 2016 and 2015, respectively.
(2) "Currency Impact" is determined as the difference between the reported net sales and those reported net sales converted at a fixed exchange rate, calculated as the 12-month average in 2015,
excluding the impacts of acquisitions and divestitures. “Core Sales” excludes the impact of currency, acquisitions, and divestitures.
(3) Actual divestitures represent the Rubbermaid medical cart business, which the Company divested in August 2015; the Levolor and Kirsch window coverings brands ("Décor"),
which the Company divested in June 2016; and, the Company's Venezuela operations, which the Company deconsolidated as of December 31, 2015, as well as the planned divestitures
of businesses held for sale commencing in the third quarter including its Tools business (excluding Dymo® industrial labeling), the Rubbermaid® Consumer Storage business within the Home Solutions segment,
Teutonia in the Baby and Parenting segment, two winter sports units, Völkl® and K2®, within the Outdoor Solutions segment, its Heaters, Humidifiers, and Fans business within the Consumer Solutions segment,
and Lehigh business in the Branded Consumables segment. Acquisitions mainly represent Waddington Group Inc., Jostens, Inc., and Elmer’s Products, Inc.

40
Q3 YTD 2016 Core Sales By Geography
(1) Includes Jarden segment and consolidated sales from April 16, 2016 and 2015, respectively.
(2) "Currency Impact" is determined as the difference between the reported net sales and those reported net sales converted at a fixed exchange rate, calculated as the 12-month average in 2015,
excluding the impacts of acquisitions and divestitures. “Core Sales” excludes the impact of currency, acquisitions, and divestitures.
(3) Actual divestitures represent the Rubbermaid medical cart business, which the Company divested in August 2015; the Levolor and Kirsch window coverings brands ("Décor"),
which the Company divested in June 2016; and, the Company's Venezuela operations, which the Company deconsolidated as of December 31, 2015, as well as the planned divestitures
of businesses held for sale commencing in the third quarter including its Tools business (excluding Dymo® industrial labeling), the Rubbermaid® Consumer Storage business within the Home Solutions segment,
Teutonia in the Baby and Parenting segment, two winter sports units, Völkl® and K2®, within the Outdoor Solutions segment, its Heaters, Humidifiers, and Fans business within the Consumer Solutions segment,
and Lehigh business in the Branded Consumables segment. Acquisitions mainly represent Waddington Group Inc., Jostens, Inc., and Elmer’s Products, Inc.
NEWELL BRANDS INC.CURRENCY ANALYSIS BY GEOGRAPHY ACTUAL AND ADJUSTED PRO FORMA BASIS (UNAUDITED)
For the periods ended September 30, 2016 and 2015
$ in Millions
Year to date Increase/(Decrease)
2016
Net Sales
(Reported) (1)
Acquisitions/
Divestitures (3)
Net Sales
Base Business
Currency
Impact (2)
2016
Core Sales (2)
2015
Net Sales
(Pro forma) (1)
Divestitures
(3)
Net Sales
Base Business
Currency
Impact
2015
Core Sales (2)
Core Sales (2)
$ %
UNITED STATES 6,635.2 (1,107.1) 5,528.1 ─ 5,528.1 5,796.4 (508.0) 5,288.4 ─ 5,288.4 239.7 4.5 %
CANADA 487.8 (128.7) 359.1 15.1 374.2 374.6 (40.8) 333.8 (0.2) 333.6 40.6 12.2 %
NORTH AMERICA 7,123.0 (1,235.8) 5,887.2 15.1 5,902.3 6,171.0 (548.8) 5,622.2 (0.2) 5,622.0 280.3 5.0 %
EUROPE, MIDDLE EAST, AFRICA 1,092.1 (110.2) 981.9 26.0 1,007.9 1,070.9 (84.1) 986.8 (6.1) 980.7 27.2 2.8 %
LATIN AMERICA 410.8 (29.3) 381.5 50.6 432.1 542.7 (137.8) 404.9 (4.7) 400.2 31.9 8.0 %
ASIA PACIFIC 502.2 (46.7) 455.5 (20.2) 435.3 488.2 (28.1) 460.1 (0.4) 459.7 (24.4) (5.3)%
TOTAL INTERNATIONAL 2,005.1 (186.2) 1,818.9 56.4 1,875.3 2,101.8 (250.0) 1,851.8 (11.2) 1,840.6 34.7 1.9 %
TOTAL COMPANY 9,128.1$ (1,422.0)$ 7,706.1$ 71.5$ 7,777.6$ 8,272.8$ (798.8)$ 7,474.0$ (11.4)$ 7,462.6$ 315.0$ 4.2 %
LESS: JARDEN ACQUISITION (3,917.9)
2015 AS REPORTED 4,354.9$