Embed Size (px)
Citation preview
Appears in Proceedings of the 2nd Annual Conference on File and Storage Technology (FAST), March 2003.
More than an interface — SCSI vs. ATADave Anderson, Jim Dykes, Erik Riedel
Seagate Technology
AbstractThis paper sets out to clear up a misconception prominent inthe storage community today, that SCSI disc drives and IDE(ATA) disc drives are the same technology internally, anddiffer only in their external interface and in their suggestedretail price. The two classes of drives represent two differentproduct lines aimed at two different markets. In fact, bothclasses contain a range of products that address a variety offeatures and usage patterns beyond simply the interface usedto talk to the device. The target market and final productspecification are taken into account from the earliest designdecision through the manufacturing and testing process. Thispaper attempts to clarify the differences by illuminatingsome of these design choices and their consequences on finaldevice characteristics. This will hopefully allow the commu-nity to build better storage systems with better knowledge ofthe trade-offs being made and the performance characteris-tics that result.
1 IntroductionEvery manufacturer has different product families aimed atdifferent customer segments. A Smart city coupe fromDaimlerChrysler is much different than a Mercedes E-classsedan, although the apparent technology (gasoline engine,four round wheels) may be quite similar.The disc drives traditionally sold with personal computersystems are quite distinct in appearance, performance andcost from those sold on larger computer systems. We willrefer to the former as personal storage (PS) and the latter asenterprise storage (ES).There are, of course, more than two classes of disc drives.Portable computers and some consumer electronics devicesuse disc drives that differ in important ways from either ofthe classes we will discuss here. We will leave as future workcomparing the unique features of those drives with theirlarger cousins.
1.1 ATA versus SCSIThe question addressed in this paper is often phrased interms of ATA drives versus SCSI drives. This is not accurate,as we will see: the ATA versus SCSI debate groups the drivesby interface, but the interface is perhaps the least significantdifference. Differences in mechanics, materials, electronics,and firmware make for the real distinctions among drive
families and product lines. When choosing a drive for a par-ticular application, system designers must consider theseunderlying factors, and not assume that the interface distinc-tion alone is sufficient.The interface difference may appear to categorize the drivescorrectly, but, in fact, does not. There have been severalinstances of PS drives equipped with a SCSI interface andES drives are also used in high-end personal computers.There is no inherent reason why an ES drive could not havean ATA interface.
1.2 Personal storageThe most important quality in PS drives is that a drive have acost commensurate with the cost of the system in which it isinstalled. The cost pressure of the personal computer marketgave rise to the first low-cost hard discs, and has continuedto put pressure on PS drive pricing. As we discuss PS drives,we will come back to this point repeatedly: low cost domi-nates the design of PS drives.When the first personal computers appeared, none had a harddrive. The drives of the day were too big and far too expen-sive. The customer demand for a hard drive based personalcomputer drove the development of a small-sized, low costdrive.
1.3 Enterprise storageSince their invention disc drives have been used on largecomputer systems. At the time, these systems tended to bevery big, expensive and were employed to access large quan-tities of data. Because of the cost, they were used to supportmany users simultaneously.This environment gave rise to the essential properties of ESdrives. First, they tend to be configured in groups (aggrega-tion), as opposed to PS drives, which are most often the onlydrive in a system. Second, they are used to randomly accesssmall portions of large data spaces. Third, reliability and per-formance are critical characteristics. A failure could idle aconsiderable number of employees and directly impact busi-ness operations. In normal operation, the faster the drivescan service requests, the more employees can be supportedand the more productive those workers can be.
1.4 Key requirementsWe will now look at these key requirements and see howthey have manifested themselves in drives for each market.
1

1.4.1 CostThere is constant pressure to reduce drive costs, even asdrives become more complex to build. Due to the resultingdemands on encoding schemes, error correction, and servoprocessing, it takes considerably more logic to control basicreading and writing with every areal density improvement. Italso requires greater precision and lower tolerances for noiseand interference of any kind. Each component of a drivemust become more complex in order to deliverstate-of-the-art capacity, while at the same time being pushedto become less costly to build.
1.4.2 Seek performanceImproving seek performance is the continuous struggle toget the head to move from one location to another faster thanin the previous generation product. This involves using moreexpensive components such as higher performance magneticcircuits, faster microprocessors and lower-mass actuatorassemblies. The process of designing an ES drive involvesmore sophisticated modeling and analysis to optimize thestructures for seek movements. The various vibrationalmodes of the structure can negatively affect seek perfor-mance. Fast seeks depend on the ability to rapidly follow theservo patterns on the media in a predictable way. The designmust preclude drive seeking being throttled by an obscureresonance of the head/disc assembly [IBM99c].
1.4.3 Rotational latencyLatency is improved by spinning the media faster. PS drivesare much slower to adopt the performance improvementsfirst introduced in ES drives. PS performance enhancementsare made only when they do not incur any marginal cost.After a given capability has been in ES drives for some yearsit is practical to move it to PS models; the cost penalty anddevelopment cost having been eliminated by the volume ofES market. Figure 1 shows the history of rpm adoption inmainstream products over the last 15 years.
In fact, this history illustrates a general characteristic of therelationship between ES and PS drives. ES drives tend todrive costly innovation - achieving new levels of perfor-mance, reliability or function - and PS drives adopt that tech-nology when it becomes cheap enough. This is a model thatputs ES drives in a difficult pricing position compared to PSdrives, but growth in the ES market depends on these addedcapabilities.There is innovation in PS drives as well, but it tends to be interms of cost savings, such as making a 7,200 rpm motorcheaper, rather than building a 15,000 rpm motor for the firsttime. ES drive cost comes in the form of higher cost of mate-rials, but also in larger research and development invest-ment.
1.4.4 AggregationA notable difference in operating environment between PSand ES drives is the use of ES drives in groups. This is morethan simply an interface issue - just being able to electricallyinterconnect multiple drives. A property of Fibre Channel(FC), SCSI and Serial Attached SCSI (SAS) is that they effi-ciently attach more drives to a host than the two drive limitof a traditional IDE controller.That is not, however, all there is to aggregation. If drives arehoused together and used at the same time, interactionsoccur that can dramatically decrease performance if no com-pensation is included. When one drive is trying to seek orsimply stay on track while nearby drives are spinning, thereis an energy transfer, known as rotational vibration, fromone seeking drive to the other drives in the cabinet.
1.4.5 ReliabilityReliability varies significantly with usage patterns and oper-ating environment. Personal computers are designed foractive use only several hours per day, while most enterprisesystems are active 24 hours a day, every day. This means thatdesign choices made in PS drives for cost reasons will makethem less likely to perform well under operational stressesfor which they were not designed.
1.5 History of the interfacesTraditionally, the difference in the two interface was basedon how much work was done by the host and by the drive.Until a few years ago, IDE controllers used programmed I/O,where the main system processor was responsible for allinteractions with the disc drive, without interrupts or directmemory access (DMA) to offload data transfer. In SCSI,there was always an external control chip on the drive thathandled independent operation of the drive.While a standards group is currently adding a commandqueuing function similar to that in SCSI to the Serial ATA(SATA) protocol, ATA historically has not added any of themajor features of SCSI: multiple CPU support (both failoverand simultaneous operation), variable block size support
Figure 1: The adoption of higher rotational speeds.Data from Control Data product guides, 1988-1989and Seagate product guides, 1990-2002.
0
2,0004,000
6,000
8,000
10,00012,000
14,000
16,000
1985 1990 1995 2000 2005year of introduction
spin
dle
spee
d (rp
m) PS rpm
ES rpm
2
(that is, the ability to specify and format the drive to anon-512 byte block sector) and dual porting. Note that as thistype of ES drive functionality accretes to PS drives, the com-plexity of implementation also increases.
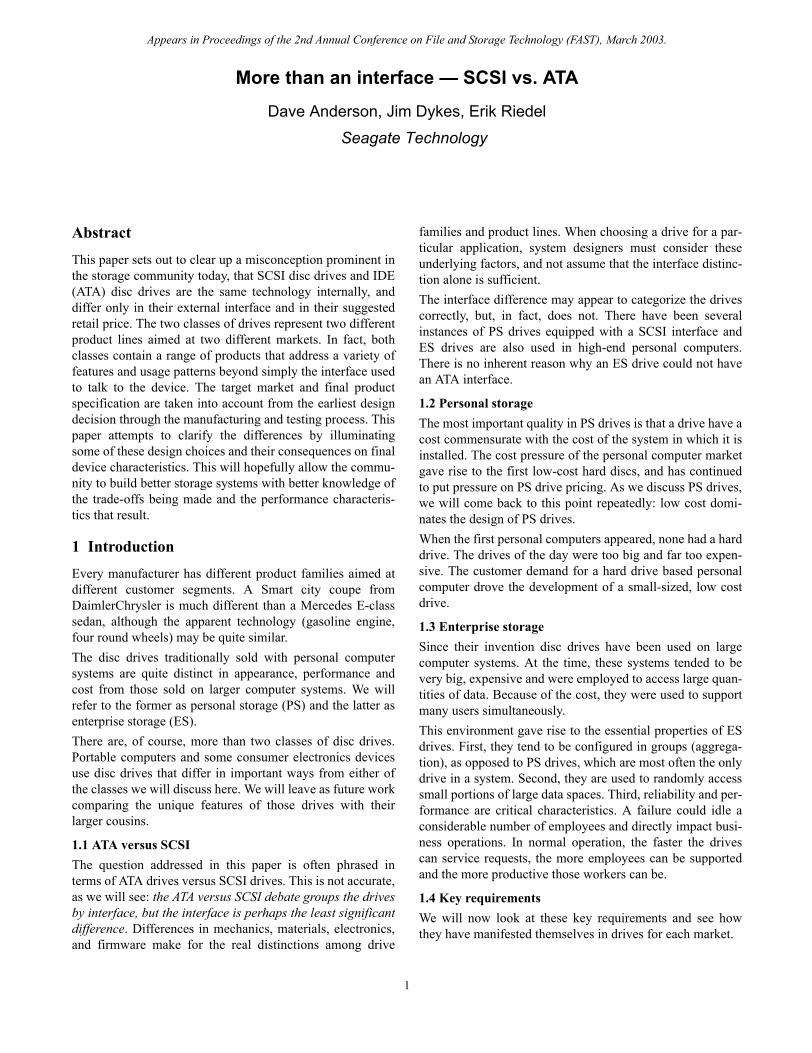
2 Technology DifferencesThe differences between PS and ES drives are far-reachingand start from the earliest design choices. The diagram inFigure 2 illustrates the basic components of a modern discdrive. This section will consider each of these items in turn.Note that since the market for disc drives is a very cost-sen-sitive one, drive designers will not spend an extra penny inmaterial or assembly cost to go beyond the target devicespecifications.
2.1 MechanicsThe basic component choices in the mechanical portion ofthe drive affect the overall reliability, seek time, acoustics,and resistance to temperature, shock, vibration, and otherenvironmental variations.
2.1.1 Head/Disc AssemblyThe head/disc assembly (HDA) consists of the base casting,heads, actuator, spindle, discs, air handling system, and topcover. The ES drive operates at higher rpm, while also main-taining a higher tolerance for external disturbance. Theseexternal disturbances could be the influence of neighboringdrives — rotational vibration — or other environmental fac-tors such as temperature. This is complicated by the fact thathigher rpm and faster seeking ES drives put more energyinto a drive cabinet, creating more disturbance. At the sametime the drives are required to be less affected by it. Thisrequires more rigidity in the mechanical structure of thedrive, more mass, higher bandwidth servos, and in somecases special support circuitry to offset effects that couldotherwise decimate a drive's performance.Higher rpm drives also require more power to operate, creat-ing more heat that can affect the drive or its neighbors in acabinet.
Achieving a million hour MTBF drive is not an easy thing.Every failure mode must be addressed. ES drives will havetighter tolerances and design rules to control externally andinternally generated particles and outgassing. These rulesinclude such things as avoiding through holes, greater envi-ronmental control and higher quality sealing. The ES drivetypically has more environmental protection. An ES drivewill have a filter for particles, a desiccant to control humid-ity, and an active carbon absorbent for eliminating organicsubstances inside the HDA. The spindle motors have O-ringseals, and the drive cover better gasketing. Each of these lit-tle things adds cost but improves reliability. Individually,each one addresses a relatively minor failure mode, buttogether they help achieve 1,000,000+ hour MTBF.PS drives are designed for reliability, but they tend to com-promise where components can be eliminated to save cost.The O-rings and desiccant, for example, are usually elimi-nated in PS drives.An ES drive has more shrouding and air control devices tobetter manage air flow inside the HDA. This eliminates airturbulence, which would otherwise make it harder to keepthe head on track and optimize seek performance. It alsodirects air to the actuator to help cool it. It also adds cost.The size and stiffness of the base casting and top coverimpact both the acoustic characteristics of the drives, as wellas the susceptibility to rotational vibration. Both of theseproblems become more acute at higher spindle speeds.
2.1.2 ActuatorLarger magnets are key to achieving faster seek times, butthey bring additional requirements, along with a higher cost.In order to get the most seek performance and still staywithin a tight power budget, the ES actuator coils must haveless resistance. This requires thicker coil material with fewerwindings. As already mentioned, special HDA design fea-tures promote cooling the actuator to prevent overheating.An interesting example of complex interactions arises withthe latch. Inside every drive is a latch to hold the actuatorwhen power is off. The most common method of latchinginvolves a magnetic circuit. However, the latch has a mag-netic field associated with it, which can affect seek perfor-mance when the actuator is operating near the latch. In a PSdrive, there is no compensation for this, as seek performanceis not critical. To achieve the optimum seek performance, ESdrives will have a bi-stable latch that does not affect perfor-mance. This is a more expensive solution, but gives betteroverall performance.Both the coil and the bearing cartridge are independentlybonded to the arm using a special epoxy in an ES drive. In aPS drive the coil is likely to be attached to the arm with asingle molded connector, a less expensive technique. Theformer makes for a more rigid structure and is necessary toachieving maximum seek performance.Figure 2: Diagram of the major components of a disc drive.
HEAD/DISC ASSEMBLY
COVER
DISCSACTUATOR
E-BLOCK
FLEX CIRCUIT
FLEX CIRCUITCONNECTOR
DC POWERI/O CONNECTOR
PRINTED CIRCUIT BOARD
BASECASTING
SPINDLE
READ/WRITEHEADS
3

In a PS drive, seek performance is not the high priority it isin an ES drive. Typically a PS drive design must first achieveits cost targets, and then do the best it can with seek perfor-mance. The opposite priority holds with ES drives, e.g., theactuator design must prevent its various bending modes andresonances from impacting seek, settle time, and perfor-mance in the presence of rotational vibration.
2.1.3 SpindleFor over 15 years drives spun no faster than 3,600 rpm.Since then drives have been sped up first to 5,400 rpm, then7,200 rpm, 10,000 rpm and most recently 15,000 rpm. Spin-ning faster is a tremendous engineering challenge. Theread/write head must be kept on track, and this is increas-ingly difficult as rpm goes up. An off-track head during read-ing can cause a mis-read and a rotational miss (requiring afull rotation before the read can be re-tried). An off-trackhead during writing can cause a mis-write that introducesnoise or even overwrites adjacent tracks.Higher rpm requires more expensive motors. As tracks perinch (TPI) increases the motor becomes a bigger challenge.Disturbances such as windage (air movement between thedisk and arm) and vibration increase with rpm. At the sametime ES drives must be less affected in order to get the bestpossible random performance. For cost reasons PS drivesuse a cantilever motor design, where the motor shaft is cap-tured only at the base deck end. An ES motor shaft is cap-tured at both ends, with an attachment to the top cover. Withtoday's TPI, fluid bearing motors are preferred since theyminimize runout and acoustical noise (see below for a dis-cussion of runout). For years it was thought impossible tohave a fluid dynamic bearing motor captured at both ends.Seagate solved this with a unique conical design that givesES drives the benefits of both fluid bearings and a motorsupported at both ends. This is a more expensive design, butgives better overall performance.
2.2 ElectronicsThe on-drive electronics are becoming more integrated asimprovements in processor technology allow[Matsumoto99]. This means that fewer components arerequired to provide the same basic functionality.
2.2.1 Control processorThe drive servo system keeps the read/write head on track ormoves it from one track to another. The drive determines itsposition by reading very small fields of information inter-spersed among the data blocks on every track (servo bursts).Every time the head crosses over a servo burst, the micropro-cessor suspends what it is doing and takes up the task ofidentifying where the head is. If it is wandering off trackslightly, it must move the head in the appropriate directionand distance to get back in the middle of the track. Duringseeks, the actuator constantly reads servo bursts as it crosses
tracks. This information is used to determine how close theactuator is getting to the target location and, when it is close,to decelerate the actuator.
2.2.2 Servo processorAs TPI gets higher, more servo processing is needed to keepthe head off neighboring tracks. This would not be so hard ifthe tracks were perfect, repeatable circles. They are not:motor variation, platter waviness (both circumferentially andradially), stacking tolerances and other factors give rise toboth repeatable and non-repeatable runout. Runout - varia-tion in the radius or circumference of the track - occurs whenthe head is unable to follow the current track and stay inposition above it. Repeatable runout is inherent in the track,and is the same on each rotation, making it easier to compen-sate for. Non-repeatable runout is due to external influencessuch as vibration, and varies over time. The servo processormust adjust the head to follow the track wandering under-neath it. To get more servo capability, higher capacitiesrequire more servo bursts. This requires more processingworks against minimizing cost and increasing capacity. A PSdrive is a constant balancing act between minimizing cost -including processing power - and tracking the higher TPI's toachieve maximum capacity.
2.2.3 InterfaceThere is significantly more silicon on ES products. The fol-lowing comparison comes from a study done in 2000:
· the ES ASIC gate count is more than 2x a PS drive,· the embedded SRAM space for program code is 2x,· the permanent flash memory for program code is 2x,· data SRAM and cache SRAM space is more than 10x.
The complexity of the SCSI/FC interface compared to theIDE/ATA interface shows up here due in part to the morecomplex system architectures in which ES drives find them-selves. ES interfaces support multiple initiators or hosts. Thedrive must keep track of separate sets of information for eachhost to which it is attached, e.g., maintaining the processorpointer sets for multiple initiators and tagged commands.The capability of SCSI/FC to efficiently process commandsand tasks in parallel has also resulted in a higher overhead“kernel” structure for the firmware. All of these complexitiesand an overall richer command set result in the need for amore expensive PCB to carry the electronics.When the drive processor is busy doing servo work andread/write tasks, it cannot be doing interface work. In orderfor an ES drive to offer the maximum performance, it isequipped with two processors - one dedicated to servo andthe other for interface and read/write handling. Maximizingrandom access and performance under rotational vibrationboth depend on that dedicated servo processor.
4

A PS drive has a single processor, which must handle allthree basic processor tasks in a drive. It must run the inter-face, support the reading and writing of data and do all theservo processing.
2.2.4 MemoryThe firmware for the SCSI command set is more than twiceas large as that for ATA, requiring more permanent flash forcode and increased SRAM at runtime. The more complexcommand set and larger command queues also require addi-tional memory space. The SCSI command set allows forvendor-specific extensions which require additional codespace, allowing greater flexibility in configuration.
2.3 MagneticsIn magnetic componentry there is much similarity betweenthe ES and PS drives since both strive to stretch the sameareal density boundary. Differences stem from the perfor-mance goals of the ES drives. The higher rpm of ES drivesdelivers higher data rates.
2.3.1 HeadsThough magneto-resistive head technology has made a pro-found change in how data is read in a drive, writing is still aninductive process. As such it is sensitive to linear velocityand higher rpm improves not only latency, but data rate, aswell. For this reason, ES drives tend to stretch writing capa-bility, and demand constant innovation to keep up with thehigh rpm and higher areal density. PS drives usually adoptthe writer technology proven in previous generations of ESdrives.Reading is just the opposite. Read data rate is generallyinsensitive to linear velocity, but in some cases it may beadversely affected by higher rotational speed. Signal ampli-tude does not increase as it does with inductive heads, butnoise does. This means that ES drives, with their higher rpmand data rate targets, have a more difficult magnetic environ-ment in which to read data.The key property to having a system that will read and writereliably is the signal to noise ratio (SNR). It is much harderto reach a given SNR in a high rpm drive. This makes thetask of extracting the data from the read signal significantlymore difficult. This is sometimes referred to as recordingstress, and is usually more pronounced in an ES drive. ESdrives must have more expensive read/write electronics tocope with this more difficult magnetic environment andhigher data rate.
2.3.2 MaterialsThe traditional substrate material for media is aluminum,onto which a layer of magnetic material is deposited. Therecent use of glass substrates provides a greater uniformityof the magnetic surface and greater stiffness [IBM99], butthe magnetic layer is harder to deposit on glass, making it
more difficult and expensive to achieve the same read densi-ties [Walker01]. The better shock tolerance of glass must betraded against lower density or data rate. In addition, sinceglass cannot be textured, the actuator must be removed fromthe media to land (load/unload ramp) rather than landing onthe media (contact start/stop) [IBM99a]. This requires alanding zone at the outer edge of the disc in case there is con-tact as the heads leave the platters - precisely the area ofhighest density and data rate.A recent change in media structure is the use of anti-ferro-magnetically coupled media, which contains a second mag-netic layer oriented opposite the primary layer to reinforcethe magnetic orientation [IBM01]. This is necessary toachieve higher densities, at the cost of increased complexityin both materials and in the manufacturing process[Walker01]. The diagram in Figure 3 illustrates this layering.
2.4 ManufacturingThe build and test times for ES drives are considerablylonger than PS drives. Increased test time can make a drivemore reliable. During this time, drives also undergo detailedcharacterization, such as learning precisely how irregularindividual tracks are, which allows them to better keep theheads on track during normal operation. More time spentanalyzing the media for flaws results in lower probabilitiesthese flaws causing unrecoverable read errors in the field.
3 Performance DifferencesWe have outlined the design choices possible when design-ing a disc drive for a particular target market. Most of thesechoices affect performance in some way, and we will nowattempt to quantify the impact of specific choices.
3.1 CapacityThe basic media structures used are the same in both drivetypes, with the highest areal density used at any given time.The choice of the number of disc platters and the size of theplatters changes the overall capacity - for example, 15,000
Figure 3: Diagram of media layers. The base substrate consists ofeither aluminum or glass, topped with a layer of magneticmaterial. In anti-ferromagnetically coupled (AFC) media, anadditional layer of magnetic material and a layer of rutheniumare added, with the two layers reinforcing each other for bettermagnetic stability at higher density.
substrate (aluminum or glass)
5

rpm drives use 2.5” platters to support the faster spindlespeeds, while 7,200 rpm drives use 3.7” platters.
3.1.1 Size of PlattersES drives spin faster to get better performance. However,power increases almost to the cube of rpm. Smaller diameterplatters keep drive power at an acceptable level. This has acost: an ES drive uses more platters to achieve the samecapacity as a PS drive at a given areal density. The smallerplatters actually brings two performance advantages - theability to spin faster and faster seeking. Average seek timesare better because the head must traverse a smaller recordingband. This, together with the greater investment in actuatorcapability as discussed earlier, makes for drives that performrandom access much faster than their PS counterparts atequivalent areal densities.The larger diameter platters and the lower rpm give the PSdrive a clear advantage in delivering capacity. This is consis-tent with the primary market requirement of lowest cost. Acombination of minimizing the parts cost and delivering thehighest capacity yields the lowest dollar per gigabyte. Thedata in Figure 4 compares drive capacity against date ofintroduction over the last 10 years.
3.1.2 Number of PlattersMany drives are manufactured with fewer platters than pos-sible, as performance matters more than capacity. The chartin Figure 5 illustrates this trend toward depopulated drives,as well as the more recent use of depopulated heads (onlyusing one platter surface to save the cost of the additionalread/write head).Fewer platters translates into faster seeks because there areless heads, so the actuator has a lower total mass and canmove a fraction of a millisecond faster, which can be signifi-cant at sub-4 ms average seek times. This also matches themarketplace as users with a requirement for performancewill often buy more drives, each of a lower capacity, tospread data across as many actuators as possible.
3.2 Data rateThe fastest ES drives will always have higher data rate than acontemporary PS drive, due in large part to the higher rpm,as explained earlier. However, the PS drive has an advantagein media size. Typically PS drives use 95 mm (3.7”) platters,compared to 84 mm (3.3”) in 10,000 rpm and 65 mm (2.5”)in 15,000 rpm ES drives respectively. The larger media sizehelps the PS drives follow closely in data rate.Another factor favoring the PS drive is that new models tendto come out more frequently than ES drives. Introduction ofa new ES drive comes when the new generation is able todouble the capacity of the previous generation. Hence suc-cessive models over the last several years have been 9, 18,36, 73 and 146 GB. PS drives, on the other hand, come out assoon as it is possible to deliver an appreciable increase incapacity. Instead of doubling, they have been introduced at10, 20, 30, 40, 60, and 80 GB per platter. This higher fre-quency enables PS drives to stay much closer to ES drives indata rate than if they were following the same “jumps” thathappen for ES drives. The data in Table 1 compares the datarates of several drives and shows the underlying spindlespeed, areal density, and platter size.
Figure 4: Comparison of capacities. Capacity andintroduction date of 10 years of Seagate drives [Seagate02].
1
10
100
1,000
10,000
100,000
May-90 Sep-91 Jan-93 Jun-94 Oct-95 Mar-97 Jul-98 Dec-99 Apr-01 Sep-02
date of introduction
driv
e ca
paci
ty (M
B)
ES capacity
PS capacity
Figure 5: Trend toward depopulated drives. More users arechoosing drives with less platters, trading capacity forperformance.
0%10%20%30%40%50%60%70%80%90%
100%
1998 1999 2000 2001 2002calendar year
fract
ion
of d
rives
sol
d
6+ platters5-6 platters3-4 platterstwo plattersthree headssingle plattersingle head
cap speed density dia int bw (Mb/s) ext bw
GB rpm Gb/in2 calc spec MB/sAtlas 10k 18WLS ES 18 10000 3.4 3.3” - 314 24.6DeskStar 75 PS 30 7200 11.0 3.7” 551 444 35.6Cheetah 36LP ES 18 10000 7.3 3.3” 579 427 -Cheetah X15 ES 18 15000 7.3 2.5” 690 508 39.5Cheetah X15-36LP ES 36 15000 17.5 2.5” 969 709 57.7
Table 1: Comparison of drives with increasing data rates.Capacities, speeds, and densities are from published specsheets. Diameters are typical for those spindle speeds. Internalbandwidths are calculated from the speed, diameter, and TPIas shown in the spec sheets. External bandwidths are asmeasured by LinuxHardware.org [Augustus01].
6

This table shows the three components to sequential datarate: the rotational speed, the areal density, and the diameterof the platters. Higher speed drives will use smaller plattersfor lower energy consumption and faster seeks, resulting inlower data rates. The five drives in the table are arranged inorder of externally-measured sequential throughput. We seethat the 7,200 rpm DeskStar is faster than the 10,000 rpmAtlas due to a much higher areal density, and a larger platterdiameter. The DeskStar and the Cheetah 36LP are quite closein data rate because the increased rpm of the Cheetah is onlyenough to overcome the density disadvantage and thesmaller platter diameter. The Cheetah X15 at 15,000 rpmgains data rate, but loses some due to the further reducedplatter diameter. Finally, the second generation Cheetah X15increases the areal density and far outperforms the otherseven with the smallest diameter platter.The diagram in Figure 6 illustrates the trade-off among datarate, capacity, seek time and power consumption whenchoosing a platter size.
3.3 Random performanceRandom performance describes the ability of a drive to getfrom one location to some other unpredicted address to ser-vice the next request. There are three components to the per-formance of this movement - seek performance, controlleroverhead, and rotational latency.
3.3.1 Seek timesSeveral of the mechanical items mentioned in the last sectiondirectly affect the ability of the drive to seek quickly and tostay on a servo track in response to environmental factors.The data in Figure 7 compares the seek time of drivesagainst their date of introduction.Seek performance of PS drives always lags that of ES drives,and improves at a slower rate, while ES drives are expectedto squeeze out a gain with each new generation of drives.The entire mechanical design of an ES drive is focused on
achieving the highest random access performance, as this iscritical in the target market.Table 2 shows the seek performance of a PS against an ESdrive under the same workload. This comparison is betweena Barracuda IV and a Cheetah 73LP drive in the same sys-tem. Table 3 details our experimental setup. The mechanicaldetails of these two drives are different, but quite close -higher density in the Barracuda compensates for the higherspindle speed in the Cheetah. The higher spindle speed willalso account for some of the improvement in random perfor-mance on the ES drive.
Figure 6: Diagram of basic drive parameters. A smallermedia (lower r) sacrifices bandwidth and capacity forshorter seeks and lower power. Each additional platter addsto capacity and power consumption.
seek ( )dis cetan r∝
data rate ( )rate 2πr( ) density( ) rpm( )××∝
power ( )power rpm( )2 drag( )×∝drag n platter( )× spindle( )+∝
capacity ( )cap πr2( ) density( )×∝ r
Figure 7: Comparison of seek times [Seagate02].
0.0
5.0
10.0
15.0
20.0
25.0
30.0
May-90 Sep-91 Jan-93 Jun-94 Oct-95 Mar-97 Jul-98 Dec-99 Apr-01 Sep-02data of introduction
aver
age
seek
tim
e (m
s)
ES seekPS seek
queue depth read (8 KB) write (8 KB)
PS ES PS ES1 requests 65 req/s 115 req/s 105 req/s 184 req/s2 requests 66 req/s 116 req/s 105 req/s 184 req/s4 requests 71 req/s 146 req/s 105 req/s 187 req/s8 requests 79 req/s 174 req/s 105 req/s 190 req/s16 requests 89 req/s 202 req/s 108 req/s 200 req/s32 requests 101 req/s 235 req/s 108 req/s 213 req/s
Table 2: Comparison of random request rates at increasingqueue depth on the same request stream in PS and ESdrives. Both drives are run with write caches enabled. If thewrite cache on the ES drive were disabled, the improvementwith larger queue depth would be even larger, as observed ina previous study [White01].
server Dell PowerEdge 2550operating system Windows 2000 Pro SP3
scsi controller Adaptec 39160ata controller Promise Ultra 100 TX2
ES drive Seagate Cheetah 73LP - 73 GBspecs 10,000 rpm; 18 Gb/in2; 5.1 ms seek
PS drive Seagate Barracuda IV - 80 GBspecs 7,200 rpm; 31 Gb/in2; 9.5 ms seek
benchmark iometer (jan 2001 code release)
Table 3: Experimental ES and PS drive testbed.
7

3.3.2 Seek scheduling - queue depthsSeek sorting impacts performance and PS drives generallyhave shorter queues. In fact, the shorter queue lengths whenusing the ATA interface also have a direct impact on drivemechanics. The fact that seeks are not aggressively sched-uled in PS drives keeps the average seek distance closer tothe theoretical average of 1/3 the disc radius. ES drives withmore aggressive scheduling can bring this as low as 1/10 ofthe radius on average. This means that the mechanical dutycycle - the total amount of time spent seeking and stressingthe mechanical components - of the PS drives could be morethan 3x higher for a similar request stream.The data in Table 2 compares the random performance of aPS drive against an ES drive as the queue depth seen at thedrive increases. With a queue of 32 pending requests, the ESdrive is able to achieve more than twice the random perfor-mance possible with only a single queued request, while thePS drive only improves throughput by 55% for reads andbarely at all for writes. This is similar to results in an earlierstudy [White01] where ES performance increase by 100%and PS performance by only 45%. The improvement comesbecause seeks are smaller, which leads to both better perfor-mance and better reliability. Additional scheduling sophisti-cation could be included in the PS drive as well, but wouldrequire some of the additional electronics discussed earlier.
3.3.3 Controller overheadController overhead is optimized by having as much proces-sor performance available as possible to interpret and sched-ule commands as they arrive. More recently, this has beenaugmented with custom hardware assist to provide more per-formance than could be economically realized simply bygreater investments in software. Such hardware ensures thatdata can be moved to and from the interface at rates as closeto the internal drive data rate as possible.
3.4 Rotational vibrationWhen one drive is trying to seek or simply stay on trackwhile nearby drives are spinning, there is an energy transferfrom one seeking drive to the other drives in the cabinet.This tends to excite the drives to rotate around their center ofmass, throwing the actuator off track. Unless a drive isdesigned to mitigate this effect, writes will abort or seekswill fail to find the desired track. In most cases this will man-ifest as a decrease in performance as aborted writes and rota-tional misses accumulate. At its extreme, this effect can getso bad that any drive, ES or PS, will cease to function. Itsimply could not stay on track long enough to complete anyoperation. The key is to understand how much rotationalvibration is likely to be present in a server environment anddesign the drive to withstand it.Since PS drives are built to be in single drive systems, rota-tional vibration is not an important factor. Though aCD-ROM drive can create a certain amount of vibration, the
slight and infrequent effect is not sufficient to produce anoticeable performance problem. PC responsiveness is mea-sured only by what a single user can see, and even a fewretries would not create a serious problem in most cases.ES drives, on the other hand, are explicitly designed to oper-ate in cabinets full of spinning drives. This requires design-ing a drive to maintain its operation in the presence ofconsiderable rotational vibration. As tracks per inch (TPI)increases, the rotational vibration problem gets worse. It ismore difficult to stay on track even in ideal conditions, muchless with external vibrations that are difficult to compensatefor [Abramovitch96]. Some recent drives have added a rota-tional vibration sensor that can detect external rotation andcompensate in the servo processing.Earlier we mentioned the performance degradation possibledue to rotational vibration, which we will attempt to quantifyhere. The chart in Figure 8 shows the performance of a sin-gle drive on a test stand under varying rotational vibration.Performance of the PS drive is much more affected than theES drive. The PS drive essentially stops at 30 radians/s2 ofexternal vibration, while the ES drive degrades much moresmoothly and is able to operate beyond 60 radians/s2.When multiple drives are placed together in the same cabi-net, the rotation induced by adjacent discs or other systemcomponents affects performance. The design of a cabinetand mountings determines how bad this effect will be in aparticular system. Studies of more than 20 drive enclosuresand machine designs from a variety of manufacturers show awide range of vibration characteristics - from the bestdesigns that subject the drives to 5 radians/s2 with only minorperformance consequences, through cabinets inducing up to45 radians/s2 [Hall00].
3.5 ReliabilityOne of the trickiest drive characteristics to measure is reli-ability, which arises from a wide range of factors and consid-
Figure 8: Externally applied rotational vibration can have amajor, negative impact on performance. Individual drivecabinets vary widely in the amount of rotational vibrationthey transfer, and have been measured up to 45 rad/s2
[Hall00]. Data for Seagate Cheetah 18LP and Barracuda III.
020406080
100120140160180
200
0 10.5 21 31.5 42 52.5
applied rotational vibration (rad/s2)
oper
atio
ns p
er s
econ
d (IO
PS)
ES iopsPS iops
8

erations in design, manufacturing, and in the operationalenvironment [Kaczeus90, Yang99, Elerath00].The most significant difference in the reliability specifica-tion of PS and ES drives is the expected power-on hours(POH) for each drive type. The MTBF calculation for PSassumes a POH of 8 hours/day for 300 days/year1 while theES specification assumes 24 hours per day, 365 days peryear. The longer a drive is expected to be running, the lowerthe MTBF, and the higher the annual failure rate (AFR).The chart in Figure 9 shows the expected increase in AFRdue to higher power-on-hours. Moving a drive from anexpected 2,400 POH per year to 8,760 POH per year wouldincrease the failure rate almost two-fold, if there were nocompensation elsewhere in the design.
3.5.1 Duty cycleIn addition to the obvious increase with increased power-onhours, the amount of mechanical work the drive has to do isaffected by its basic structure and by the workload it is askedto do. A larger number of platters in the drive increasescapacity, but also increases the mechanical stresses.The chart in Figure 10 shows the increase in expected AFRwith higher duty cycle. The increase is higher for the drivewith the larger number of platters. For a four platter disk, aduty cycle of 40% instead of 100% would reduce the failurerate by almost 50%.Better seek scheduling leads to shorter seeks on average andtherefore a lower effective duty cycle for the same set of userrequests. In preliminary measurements on our testbed, wesee a mechanical duty cycle of approximately 40% for theES drive against 75% for the PS drive on the same set ofrequests.Adding platters and heads increases the AFR not just due tothe additional mechanical stresses, but also due to increasedinternal heat generation, and the additional head/disc inter-faces which might release particles or lead to other negativeinteractions, such as head crashes.
3.5.2 TemperatureReliability decreases with increases in ambient temperature.The drive temperature is affected not only by the outsidetemperature, but also by other components in the system. Ahigh-density server rack with many disc drives groupedclose together may experience much higher temperaturesthan a single drive mounted in a desktop computer.The chart in Figure 11 shows increased AFR with increasedtemperature. A fifteen degree temperature rise is expected toincrease the failure rate by a factor of two, and an increase ofthat size is a common assumption in high-density serverracks [Patel01].In order to prevent data corruption and failure at very ele-vated temperature, some drives contain temperature sensorsthat provide warnings of temperature outside the specifica-tion range [Herbst97].
3.5.3 Overall reliabilityEach of these factors makes an individual contribution todrive failure rate, and they may also magnify each other. Acapacity-focussed drive with more platters and less sophisti-cated seek scheduling may have a higher base duty cycleunder certain workloads, and may also be more subject totemperature variation.
1This is the specification used by Seagate, other manufacturers use varying,but similar, assumptions about power-on hours [Vilsbeck02].
Figure 9: Reliability reduction with increased poweron hours, ranging from a few hours per day to 24 x 7operation [Cole00].
0 .0
0 .5
1 .0
1 .5
2 .0
2 .5
492
1128
1764
2400
3036
3672
4308
4944
5580
6216
6852
7488
8124
8760
ye a r ly p o w e r - o n - h o u r s ( P O H )
AFR
mul
tiplie
r
Figure 10: Reliability is decreased with higher dutycycle, and the effect is greater for drives with largernumbers of platters [Cole00].
0.0
0.3
0.6
0.9
1.2
10% 20% 30% 40% 50% 60% 70% 80% 90%100%
duty cycle
AFR
mul
tiplie
r
single platterfour platters
Figure 11: Reliability decrease due to ambienttemperature variation [Cole00].
0
1
2
3
4
5
6
7
8
25 26 30 34 38 42 46 50 54 58 62 66 70
temperature (oC)
AFR
mul
tiplie
r
9

Past work comparing the reliability of PS against ES drivesreported a failure rate of 25% for 24 IDE drives against 2%for 368 SCSI drives over an 18 month period [Talagala99].However, these numbers cannot be treated as a controlledstudy due to the very small sample size for the PS drives.Another study using data collected during the design phaseof two different drives - it is not reported whether they wereSCSI or ATA drives - shows a less than 1% annual failurerate for one, and a larger than 4% for the other [Hughes02].This clearly shows that different design choices can have asignificant impact on the final drive failure rates.
4 Related WorkA previous comparison of SCSI vs. IDE [White01] con-cluded that IDE had slightly better sequential performance,but lagged significantly in random performance. However,the authors of that study did not compare all the mechanicaldetails of the two drives, leading to a conclusion that cannotbe generalized to all SCSI and all IDE drives.The data in Table 4 compares a set of basic characteristicsfor the two drives considered in their study. The slightadvantage of the ATA drive in sequential performance is dueto the density advantage of the ATA drive (almost 60%higher) and the larger platter diameter (between 15% and25% larger), which is not overcome by the rotational speedadvantage of the SCSI drive (40% higher). A SCSI drivewith a comparable density would perform significantly bet-ter, as discussed in Section 3.2.The data in Table 5 shows the improvement to the next gen-eration of both drives from the same manufacturer. In thenewer SCSI drive - comparing the UltraStar 35Z15 to the
DeskStar 75 at the same areal density - the rotational speedadvantage, even with smaller diameter platters, still push theSCSI drive to much higher data rates (40% higher).The advantage of the SCSI drive over the ATA drive in ran-dom performance is partly due to the smaller platters, as wellas additional differences in the mechanics as explained inearlier sections. Also note that between the two generationsof SCSI drives, the seek performance has improved byalmost 20%, while the seek performance of the ATA driveshas remained constant.A performance comparison under Windows 2000 [Chung00]shows an IDE drive only 20% slower than a SCSI drive onsequential throughput and 44% slower on random perfor-mance. As shown in Table 6, most of this performance dif-ference is again due to the mechanical differences. Thehigher density and larger platters of the IDE drive almostcompensate for the faster spindle speed of the SCSI drive,although both seeks and latencies are significantly lower inthe higher rpm drive. If these drives had been introducedwith the same density, the higher rpm drive would also havea larger sequential throughput advantage.
A comparison of SCSI and ATA for end users[Dominguez99] makes many of the high-level points dis-
iface cap price speed seek density kbpi ktpi internal bw dia^ ext bw dsks cap3.7” 3.3” 3.0” spec raw
UltraStar 36LZX SCSI 36 GB $550 10000 rpm 4.9 ms 7.0 Gb/in2 352 20.0 645 610 552 452 Mb/s 3.0” 36 MB/s 6 594 GbDeskStar 75 ATA 30 GB $159 7200 rpm 8.5 ms 11.0 Gb/in2 391 28.4 551 487 442 444 Mb/s 3.7” 37 MB/s 2 483 Gb
Table 4: Comparison of PS and ES drives from IBM [White01]. The Deskstar drive has a slight advantage in sequential bandwidth, eventhough the UltraStar has a higher rpm. The authors of the previous study attribute this to overhead in the SCSI interface. In fact, a closerlook at the physical discs shows the most likely explanation a smaller platter size in the UltraStar (3.0” instead of the normal 3.7”). Thisreduces seek time at the expense of lower sequential bandwidth on the outer tracks. Since the UltraStar has a much lower areal density, itmust also make up the capacity difference by using additional platters (6 vs. 2). ^estimated based on the internal transfer rate and rawcapacity differences
iface cap price speed seek density kbpi ktpi int bw dia ext bw disks capcalc spec raw
UltraStar 36Z15 SCSI 36 GB $381* 15000 rpm 4.1 ms 10.7 Gb/in2 397 27.0 798 647 Mb/s 2.6” 53 MB/s% 6 661 GbDeskStar 120 ATA 60 GB $99 7200 rpm 8.5 ms 29.7 Gb/in2 547 54.0 771 592 Mb/s 3.7” 48 MB/s% 2# 979 Gb
Table 5: Comparison of a newer generation of drives from IBM. In this case, the new UltraStar increases sequential performance over thenew DeskStar due to the higher spindle speed, even though the areal density is lower. *from Harddrive.com in August 2002 %according tothe published specification, not a measured number #the 60 GB version of the DeskStar 120 has 2 disks, but only 3 heads, one surfaceremains unused
cap seek speed density dia int bw (Mb/s) ext bw
GB ms rpm Gb/in2 calc spec MB/sFireball lct 08 26 9.5 5400 6.1 3.7” 343 257 19Atlas 10K (SCSI) 18 4.5 10000 3.4 3.3” 444 314 24
Table 6: Comparison ATA vs. SCSI under Windows 2000[Chung00].
10
cussed here. ATA drives are optimized for simplicity and lowcost, while SCSI drives must be optimized for performance,reliability and the ability to connect to multiple hosts. Trendsin the speed and sophistication of the interfaces have beenbringing ATA and SCSI closer together, with ATA gainingcomplexity as it moves closer to SCSI.The comparison of ATA and SCSI reliability from the enduser perspective, covering many of the factors mentionedabove, was discussed extensively in a recent online article[Vilsbeck02].Trends and recent innovation in disc drive technology, aswell as the details of a specific SCSI drive design haverecently been published by another disc drive maker[Miura01, Aruga01].The design of disc drives is a very complex and multi-fac-eted process, and has been used as an example for students tounderstand engineering and cost trade-offs [Richkus99].
5 Summary and DiscussionTo compare any two individual drive models at a givencapacity point, one has to look at the detailed device specifi-cations as these impact every aspect of drive design anddetermine drive performance. Looking at those factors inturn and comparing the impacts:Capacity is about the same for both markets, everyone wantsthe highest affordable density. This is determined largely bythe areal density trends. There is some variation in numbersof platters in a drive, but it is possible to build a drive of anychosen capacity for either market.Data rate is proportional to spindle speed, areal density, andplatter size. The data rate for the enterprise market tends tobe higher than for personal storage, but higher spindlespeeds cost more regardless of the interface used.Fast seeks cost more and target the enterprise market. Thisincludes larger magnets, better bearings, and stiffer actua-tors. The challenge is to rapidly find the target track (seek)and then to stay on track (servo) in spite of the harsh electri-cal and magnetic environment.Protection from rotational vibration costs extra and targetsmarkets where multiple drives sit next to each other. Thisincludes better motors, top covers, stiffer actuators, and addi-tional mass.Better scheduling costs extra, requiring more code space,more memory for re-order queues and for algorithms. This iseasier to do in the SCSI interface because it has traditionallyhad queueing and is more mature, but the implementationcomplexity would exist regardless of the interface used.Fancier interface electronics cost extra. Because SCSI isricher and more complex, with more customer-modifiableoptions and host connectivity, it takes more electronics and
more memory space. This is the only difference that trulyarises solely from the choice of interface.Finally, high reliability costs extra. It needs to be consideredin every component and material choice along the way, aswell as in the overall design. It also has to take into accountthe duty cycle targets for the expected workload and theexpected environment.
6 ConclusionsThe differences between enterprise and personal storage discdrives are significant. They derive from the different require-ments of the respective markets and offer a range of choicesto system designers. Simply separating the products by theirexternal interface - ATA vs. SCSI - misses many of the inter-nal details and design choices that will affect system perfor-mance. We have shown that the external interface chosen isone of the smallest contributors to overall performance. Theperformance and reliability characteristics of a drive aredetermined by the way the drive is designed - from thesmallest mechanical and materials choices in the head-discassembly, through the seek scheduling algorithms in theinterface processing. In order to find the right features anddesign points for a particular application, the underlyingtrade-offs must be taken into account across a continuum ofspecific choices.
7 AcknowledgementsWe thank Albertine Flora for help with the performance test-ing and benchmarking. The details of drive internalsreported here are due to discussions with Zip Cotter, NealGunderson, and Jim Weispfenning. We thank Kevin Gomezand Mark Lutwyche for explaining some of the terminology.This analysis and comparison builds on previous work led byHeath Miller and Ed Skalko, with contribution from manyothers. We thank the anonymous reviewers and especiallyour shepherd, John Wilkes, for many detailed and helpfulcomments.
8 References
[Abramovitch96] Abramovitch, D.Y. “Rejecting rotational distur-bances on small disk drives using rotational accelerometers” IFAC World Congress, July 1996.
[Aruga01] Aruga, K. “3.5-inch High-Performance Disk Drives for Enterprise Applications: AL-7 Series”, Fujitsu Scientific & Technical Journal 37 (2), December 2001.
[Augustus01] Augustus “Seagate Cheetah X15 36LP Review” www.linuxhardware.org/fea-tures/01/09/10/065209.shtml, LinuxHard-ware.org, September 2001.
11

[Blount01] Blount, W.C. “Fluid Dynamic Bearing Spindle Motors” IBM Storage Systems Group - San Jose, February 2001.
[Chung00] Chung, L., Gray, J., Worthington, B. and Horst, R. “Windows 2000 Disk IO Performance” Tech-nical Report MSR-TR-2000-55, Microsoft Research, June 2000.
[CNET02] CNET Hardware Reviews. May 2002.
[Cole00] Cole, G. “Estimating Drive Reliability in Desk-top Computers and Consumer Electronics Sys-tems” Technology Paper TP-338.1, Seagate Technology, November 2000.
[Dominguez99] Dominguez, R. and Coligan, T. “SCSI vs. ATA: Interface Comparison” Technology Brief, Dell Computer, December 1999.
[Elerath00] Elerath, J.G. “Specifying Reliability in the Disk Drive Industry: No More MTBF’s” IEEE Annual Reliability and Maintainability Sympo-sium, January 2000.
[Hall00] Hall, J. “Seagate’s Advanced Multidrive System (SAMS) Rotational Vibration Feature” Technol-ogy Paper TP-229D, Seagate Technology, Feb-ruary 2000.
[Herbst97] Herbst, G. “IBM’s Drive Temperature Indicator Processor (Drive-TIP) Helps Ensure High Drive Reliability” White Paper, International Business Machines Corp, October 1997.
[Hughes02] Hughes, G.F., Murray, J.F., Kreutz-Delgado, K. and Elkan, C. “Improved Disk Drive Failure Warnings” IEEE Transactions on Reliability, September 2002.
[IBM99a] IBM “IBM hard disk drive load/unloadtechnology” IBM Storage Systems Division, May 1999.
[IBM99b] IBM “Higher reliability with IBM glasssubstrate disks” IBM Storage Systems Division, July 1999.
[IBM99c] IBM “Advanced Servo-MechanicalDesign Facilitates ImprovedPerformance and Reliability” IBM Storage Sys-tems Division, November 1999.
[IBM01] IBM Research News “IBM’s new magnetic hard-disk-drive media delays superparamag-netic effects” www.research.ibm.com/resour- ces/news/20010518_whitepaper.shtml, February 2001.
[Kaczeus90] Kaczeus, S. “Disk reliability is a function of design as well as manufacture” Computer Tech-nology Review 10 (9), Summer 1990.
[Mason00] Mason, H. “SCSI, the industry workhorse, is still working hard” IEEE Computer, December 2000.
[Matsumoto99] Matsumoto, C. “Diskcon abuzz over single-chip drives, home markets” EE Times, eetimes.com/sys/news/OEG19990917S0013, September 1999.
[Miura01] Miura, Y. “Information Storage for the Broad-band Network Era - Fujitsu’s Challenge in Hard Disk Drive Technology” Fujitsu Scientific & Technical Journal 37 (2), December 2001.
[Patel01] Patel, C.D., Bash, C.E., Belady, C., Stahl, L. and Sullivan, D. “Computational Fluid Dynamics Modeling of High Compute Density Data Cen-ters to Assure System Inlet Air Specifications” ASME International Electronic Packaging Technical Conference and Exhibition (IPACK ‘01), July 2001.
[Reinsel00] Reinsel, D. “180 Gigabytes in One Drive:Seagate’s Barracuda 180” IDC Bulletin, November 2000.
[Richkus99] Richkus, R., Agogino, A.M., Yu, D., and Tang, D. “Virtual Disk Drive Design Game with Links to Math, Physics andDissection Activities” 29th ASEE/IEEE Fron-tiers in Education Conference, San Juan, Puerto Rico, November 1999. Online at bits.me.ber-keley.edu/mmcs/disk/disk.html
[Seagate00] Seagate “Disk Drive Acoustics” Technology Paper TP-296, Seagate Technology, April 2000.
[Seagate02] Seagate Support “Disc Drive Encyclopedia” www.seagate.com/support/disc, Seagate Tech-nology, August 2002.
[Talagala99] Talagala, N. and Patterson, D. “An Analysis of Error Behavior in a Large Storage System” Technical Report UCB/CSD-99-1042, Univer-sity of California - Berkeley, February 1999.
[Vilsbeck02] Vilsbeck, C. “Gefahr: IDE-Festplatten im Dauereinsatz” www.tecchannel.de/hard-ware/964/index.html, tecCHANNEL.de, June 2002.
[Walker01] Walker, M. “Performance Media: Tweaking Magnetic Capabilities” Technology Paper TP-577, Seagate Technologies, August 2001.
[White01] White, B. Ng, W.T. and Hillyer, B.K. “Perfor-mance Comparison of IDE and SCSI Disks” Technical Report, Bell Labs - Lucent Technolo-gies, January 2001.
[Worthington95] Worthington, B.L., Ganger, G.R., Patt, Y.N., Wilkes, J. “On-Line Extraction of SCSI Disk Drive Parameters” SIGMETRICS, May 1995.
[Yang99] Yang, J. and Sun, F. “A Comprehensive Review of Hard-Disk Drive Reliability” IEEE Annual Reliability and Maintainability Symposium, January 1999.
12

9 AppendixThe data in Table 7 shows multiple generations of drivesfrom several manufacturers, including both ATA and SCSIinterfaces.
These numbers serve as a reference for the comparisonsmade in the paper. Detailed data is provided for all the drivesdiscussed in the text, those mentioned in previous studies,and some recently released drives.
iface intro cap price speed seek density kbpi ktpi dia int bw ext bw disks cache
rpm calc specQuantum Atlas 10K SCSI 1999 18 GB - 10000 4.5 ms 3.4 Gb/in2 256 13.0 3.3” 444 314 Mb/s 25 MB/s@& 6 2 MBMaxtor Fireball lct 08 ATA 1999 26 GB - 5400 9.5 ms 6.1 Gb/in2 324 19.5 3.7” 343 257 Mb/s 19 MB/s& 3 512 KBIBM UltraStar 36LZX SCSI 1999 36 GB - 10000 4.9 ms 7.0 Gb/in2 352 20.0 3.0” 552 452 Mb/s 36 MB/s^ 6 4 MBSeagate Cheetah X15 SCSI 2000 18 GB - 15000 3.9 ms 7.3 Gb/in2 343 21.4 2.6” 689 508 Mb/s 40 MB/s@ 5 16 MB*Quantum Atlas 10K II SCSI 2000 18 GB - 10000 4.7 ms 7.7 Gb/in2 341 14.2 3.3” 591 478 Mb/s - 3 8 MBIBM UltraStar 36Z15 SCSI 2001 36 GB $365 15000 4.1 ms 10.7 Gb/in2 397 27.0 2.6” 798 647 Mb/s 53 MB/s% 6 4 MBIBM DeskStar 75GXP ATA 2000 30 GB - 7200 8.5 ms 11.0 Gb/in2 391 28.4 3.7” 551 444 Mb/s 37 MB/s^@ 2 2 MBIBM UltraStar 73LXZ SCSI 2001 36 GB $239 10000 4.9 ms 13.1 Gb/in2 480 27.3 3.3” 832 690 Mb/s 57 MB/s% 3 4 MBSeagate Barracuda 180 SCSI 2001 180 GB $1369 7200 7.4 ms 15.0 Gb/in2 490 31.2 3.7” 691 508 Mb/s - 12 16 MB*Fujitsu AL-7LX SCSI 2001 36 GB $369 15000 4.0 ms 15.8 Gb/in2 450 35.0 2.7” 954 734 Mb/s 58 MB/s% 4 8 MBSeagate Cheetah X15-36LP SCSI 2001 36 GB $395 15000 3.6 ms 17.5 Gb/in2 482 38.0 2.6” 969 709 Mb/s 58 MB/s@ 4 8 MBSeagate Cheetah 73LP SCSI 2001 73 GB - 10000 5.1 ms 18.4 Gb/in2 485 38.0 3.3” 840 671 Mb/s - 4 4 MBFujitsu AL-7LE SCSI 2001 73 GB $529 10000 5.0 ms 19.2 Gb/in2 485 39.5 3.3” 838 673 Mb/s 56 MB/s% 4 8 MBMaxtor DiamondMax D540X-4G ATA 2001 160 GB - 5400 12.0 ms 25.2 Gb/in2 442 57.0 3.7” 467 347 Mb/s 38 MB/s< 3 2 MBIBM DeskStar 120GXP ATA 2000 60 GB $105 7200 8.5 ms 29.7 Gb/in2 547 54.0 3.7” 771 592 Mb/s 48 MB/s% 2# 2 MBIBM DeskStar 120GXP ATA 2000 120 GB - 7200 8.5 ms 29.7 Gb/in2 547 54.0 3.7” 771 592 Mb/s 50 MB/s< 3 2 MBSeagate Barracuda IV ATA 2001 80 GB $125 7200 9.5 ms 31.3 Gb/in2 540 58.0 3.7” 761 555 Mb/s 41 MB/s% 2 2 MBSeagate Cheetah 10K.6 SCSI 2002 146 GB $1139 10000 5.3 ms 34.0 Gb/in2 570 64.0 3.3” 988 841 Mb/s 68 MB/s% 4 8 MBSeagate Cheetah 15K.3 SCSI 2002 73 GB $769 15000 4.0 ms 34.0 Gb/in2 533 64.0 2.6” 1071 891 Mb/s 75 MB/s% 4 8 MBWestern Digital Caviar WD1200 ATA 2002 120 GB $179 7200 10.9 ms - - - 3.7” - 736 Mb/s 50 MB/s< 2 8 MB*Seagate Barracuda V ATA 2002 120 GB $185 7200 10.5 ms 42.2 Gb/in2 542 78.0 3.7” 764 570 Mb/s 44 MB/s% 2 8 MB*Western Digital Caviar WD2000 ATA 2002 200 GB $359 7200 10.9 ms 45.0 Gb/in2 - - 3.7” - 525 Mb/s - 3 8 MB*Seagate Barracuda 7200.7 ATA 2002 160 GB - 7200 9.0 ms 56.3 Gb/in2 595 94.6 3.7” 839 683 Mb/s 58 MB/s% 2 8 MB*
Table 7: Comparison of multiple drive generations and manufacturers. All numbers are from manufacturer specifications or productmanuals, except where noted. Prices for drives still being sold in August 2002 are from dirtcheapdrives.com. Seek times are for averageseek. All values for density and bandwidth are maximums (outer diameter). Internal bandwidth is calculated from the rpm, Kbpi, and discdiameter values and provided for comparison to the published values. #the 60 GB version of the DeskStar 120 has 2 disks, but only 3heads, one side remains unused @as measured by Linuxhardware.org [Augustus01] ^as measured at Bell Labs [White01] &as measuredunder Windows 2000 [Chung00] %according to the published specifications, not measured numbers <as measured by CNET Hardware[CNET02] *option, the default cache size is 2 MB
13


![NVM Express: SCSI Translation Reference · 2015-03-02 · SCSI Architecture Model – 4 (SAM-4) [T10/1683-D] SCSI / ATA Translation – 3 (SAT-3) NVM Express 1.0b or later 1.3 Terminology](https://img.dokumen.tips/doc/110x75/5f1b8fba85052457c54eaaec/nvm-express-scsi-translation-reference-2015-03-02-scsi-architecture-model-a.jpg)