Embed Size (px)
Citation preview
Personal Automobile Insurance
More Accidents Larger Claims Drive Costs HigherOctober 2016
Robert P Hartwig PhD CPCUMoore School of Business University of South CarolinaSpecial Consultant Insurance Information Institutebobhiiiorg
110 William Street New York NY 10038 2123465500wwwiiiorg
James Lynch FCAS MAAAVice President Chief Actuary2123465533jamesliiiorg
Steven Weisbart PhD CLUSenior Vice PresidentChief Economist2123465540stevenwiiiorg
Insurance Information Institutewwwiiiorg
2
TABLE OF CONTENTS Page
Executive Summary 3
Rising Claim Costs 4
Reasons for Increasing Costs 6
Rising Accident Rates 6
Impact of Weather 11
Distracted Driving 11
Increase in Average Size of Claim 12
Falling Investment Income 14
Efforts Made by Insurers to Keep Costs Down 16
What Consumers Can Do to Lower Their Rates 17
Conclusion 18
Appendix A Automobile Insurance Coverages 19
Endnotes 21
Insurance Information Institutewwwiiiorg
3
Over the past year several forces have coincided
to place considerable upward pressure on personal
automobile insurance costs1 Insurer actions in
response have drawn considerable media and
regulatory scrutiny2
This paper examines recent trends in the largest
component of the cost of auto insurancemdashthe cost
of accidents
The dollar amount of claims per vehicle per yearmdash
known in insurance as the loss costmdashis rising Loss
costs are the largest component of the price of auto
insurance They are also the most volatile Whatever
direction they move rates will eventually follow In
recent years total loss costs have been moving
considerably highermdashrising 13 percent in the two
years ending March 2016mdashmore than 10 times the
inflation rate
Loss costs have two parts the number of claims per
vehicle known as frequency or more colloquially
the accident rate and the average size of the claim
known as severity
a Claim frequency has been rising In the last two
years (first quarter 2014 to first quarter 2016)
collision claim frequencymdasha good proxy for the
overall accident ratemdashincreased 26 percent3 The
frequency for other coverages rose as well This
appears directly linked to an increase in the number
of miles people are driving which itself is a function
of the increasing number of people employed
A vehicle year is equal to 365 days of insured coverage for a single vehicle It is the standard measurement of automobile exposures
b Claim severity has also been rising after several
relatively flat years In the past two years collision
claim severity rose 82 percent Other coverages
show similar increases
This information is summarized in Fig 1
EXECUTIVE SUMMARY
This paper documents the increase in loss costs
and resulting pressure on auto insurance rates The
reasons for the increase are complex but this paper
examines some of the reasons that both the rate of
accidents and their size are growing It discusses what
insurance companies are doing to attempt to keep
costs in check It gives consumers advice on how to
reduce the cost of their own insurance
Severity Frequency
Bodily Injurydagger 70 22
Property Damage 115 29
Personal Injury Protection 77 102
Collision 82 26
Comprehensive 83 26
Fig 1
Auto Accidents Growing in Size and FrequencyChange in Frequency Severity 2014ndash2016
Four quarters ended in March daggerBodily injury property damage personal injury protection collision and comprehensive are the five standard coverages in a personal automobile policy They are defined and described further in the AppendixSource Fast Track Monitoring System
4Insurance Information Institutewwwiiiorg
RISING CLAIM COSTSFig 2 shows that auto insurance losses and
expenses have exceeded premium for every
year since 2007 Losses and expenses exceeded
premiums by $75 billion in 2015 up from $33 billion
a year earlier4
An auto insurance policy is actually a bundle of several
coverages There are five standard coverages
bull Bodily Injury Liability coverage constituted
24 percent of auto insurance premium in 2012
according to the most recent data from the National
Association of Insurance Commissioners (NAIC)
It is required in every state
bull Property Damage Liability constituted 18 percent
of auto insurance premium in 2012 according to the
most recent NAIC data It is required in every state
bull Personal Injury Protection constituted 8 percent of
auto insurance premium in 2012 according to NAIC
data It is required in some states but is not written
in others
bull Collision coverage constituted 26 percent of auto
insurance premium in 2012 It is not required by
law but more than 70 percent of drivers purchase
the coverage
bull Comprehensive coverage constituted 12 percent
of 2012 auto insurance premium It is also not
required by law but more than 70 percent of drivers
purchase it
bull Miscellaneous coverages make up the remaining
12 percent of premium This paper will not address
them6
Each of the five standard coverages have seen losses
from accidents spike over the past two years as
shown in Fig 4 By contrast consumer prices overall
rose 09 percent during the same period indicating
that accident costs are rising more than 10 times faster
than inflation overall
Fig 3 shows that insurers have seen losses grow
much faster than expenses Losses grew 371 percent
since 2006 while expenses grew 139 percent5
The increases have been steep across all of the many
protections that auto policies offer
Fig 2
Private Passenger Auto Premiums vs Losses and Expenses 2006ndash2015
Source NAIC data sourced from SampP Market Intelligence Insurance Information Institute
Written premiums Losses and expenses
Billions
$0 $50 $100 $150 $200 $250
2015
2014
2013
2012
2011
2010
2009
2008
2007
2006$1645
$1646$1614$1642
$1641
$1578
$1645
$1664$1666$1683$1690
$1756$1746$1798$1817$1855
$1903$1936$1988
$2063
5Insurance Information Institutewwwiiiorg
Fig 4
Auto Insurance Increase in Loss Costs 2014Q1ndash2016Q1
Fig 3
Private Passenger Auto Losses and Expenses 2006ndash2015
Source NAIC data via SampP Global Market Intelligence Insurance Information Institute
Billi
ons
$0
$25
$50
$75
$100
$125
$150
$175
2015201420132012201120102009200820072006
Losses Expenses and Dividends
$1145$1203 $1234 $1255 $1266
$1331 $1357 $1393$1462
$1570
$433 $411 $411 $409 $417 $425 $441 $462 $474 $493
By contrast consumer prices overall rose 17 percent during 2014 and 2015Source Fast Track Monitoring System
Bodily Injury
96
Property Damage
147
Personal Injury Protection
184
Collision
111
Comprehensive
110
6Insurance Information Institutewwwiiiorg
It is clear that insurance costs are rising Less obvious
is why This paper will focus on what affects collision
coverage The situation is similar in other coverages
Fig 5 shows the rise in the collision losses per vehicle-
year a measure known as the loss cost Insurers
monitor loss costs carefully They are the most variable
component of an insurance companyrsquos business
REASONS FOR INCREASING COSTSthe number of claims per 100 vehicle-years It is
sometimes referred to as the accident rate Severity
is the average size of a claim
A simple formula links loss costs to frequency and
severity
Loss cost = frequency x severity divide 100
For example in 2015 there were 596 collision claims
per 100 vehicle-years so frequency was 596 per
100 The average collision claim was $3434 So for
collision claims that year the loss cost was $20475
being 596 x $3434 divide 100
Rising accident ratesHistorically the rate at which accidents occurmdash
frequencymdashfalls over time Vehicles incorporate safety
improvements such as electronic stability control and
antilock brakes As more and more cars on the road
adopt an improvement more accidents injuries and
deaths are prevented
Highway design contributes as well Newly constructed
roads have wider lanes and fewer sharp turns than
in the past making driving easier and preventing
accidents
Public policy changes are another reason Graduated
driving licenses help young drivers (the most crash-
prone class) learn to drive in stages Social norms and
tougher laws have reduced the threat of drunk drivers
Improvements such as these have pushed claim
frequency lower For some coverages frequency has
fallen by more than half across the past five decades7
The figure shows that loss costs remained within a tight
band (approximately $165ndash$170) from 2008 through
2012 They begin to rise sharply thereaftermdash66 percent
in 2013 58 percent in 2014 and 66 percent in 2015
Other standard coverages show similar increases
Loss costs can be broken down into two componentsmdash
frequency and severity Doing so allows more precise
analysis of what is driving rates higher Frequency is
Fig 5
Collision Loss Cost
Sources Fast Track Monitoring System
$0
$50
$100
$150
$200
$250
16Q120152014201320122011201020092008
$17145
$16526
$16460$170
97$170
39 $18160 $19207 $20475$20706
7Insurance Information Institutewwwiiiorg
Falling frequency helps hold down auto insurance
costs Think back to the equation
Loss cost = frequency x severity divide 100
If frequency is lower then loss costs will be lower all
else being equal Loss costs are the key component
to rates lower frequency will reduce claim costs
However as can be seen in Fig 6 collision frequency
has been rising the past three years climbing 24
percent in 2013 44 percent in 2014 and 08 percent
in 2015 This increase of more than 7 percent over the
past three years places an unusual upward pressure
on claim costs
It appears the immediate reason claim frequency is
rising is that people are driving more miles Fig 7
is the Federal Highway Administrationrsquos estimate of
miles driven annually by people8 There has been a
noticeable spike since 2013 in miles driven coinciding
with the increase in claim frequency
Fig 8 makes the point more clearly It charts
the annual moving averages of collision claim
frequency vs miles driven
The figure demonstrates that as miles driven declined
with the recession claims frequency did as well When
miles driven rose so did claim frequency
The number of miles people drive also appears to be
closely linked to the number of people employed As
Fig 9 shows the number of miles driven tracks closely
with the number of people employed
This again makes sense Most people drive to work
and home again When they lose their jobs they donrsquot
drive to work In addition they have less discretionary
income so they would seem less likely to drive to
movie theaters restaurants and other entertainment
venues or to take vacations As the economy recovers
and they find work again they drive to their jobs and
to spend their newly won discretionary income
Fig 6
Collision Claims Frequency Trending Higher in 2015
Source Fast Track Monitoring System Insurance Information Institute
-4
-3
-2
-1
0
1
2
3
4
5
20152014201320122011201020092008200720062005
Annu
al C
hang
e
-18
-36
25
09
24
44
08
-24-18
-05
-14
8Insurance Information Institutewwwiiiorg
Fig 7
America Is Driving More Again 2000ndash2016
Fig 8
More Miles Driven More Collisions 2006ndash2015
2850
2900
2950
3000
3050
3100
3150
15Q414Q413Q412Q411Q410Q409Q408Q407Q406Q455
56
57
58
59
60
Billi
ons
of M
iles
Driv
en in
Prio
r Yea
r
Ove
rall
Colli
sion
Cla
ims
per 1
00 In
sure
d Ve
hicl
e Ye
ars
Moving 12-month totalSource Federal Highway Administration Insurance Information Institute
Source Federal Highway Administration Rolling Four-Qtr Avg Frequency from Fast Track Monitoring System Insurance Institute for Highway Safety Insurance Information Institute
Miles Driven Collision Claim Frequency
-25
-15
-05
05
15
25
35
20162015201420132012201120102009200820072006200520042003200220012000
Perc
ent C
hang
e M
iles
Driv
en
246
182215
123
253
084 084056
037064 064
127
340 336
-067 -054
-181
9Insurance Information Institutewwwiiiorg
The final chart in this sequence Fig 10 shows
how closely auto claim frequency and employment
have been linked in recent years As the number of
employed people fell claim frequency fell and as
employment rose frequency did as well
A number of industry observers including the authors
have commented on the possibility of a link between
gasoline prices and both the number of miles driven
and claim frequency The logic People were driving
more because gasoline prices were falling But Fig 1 1
shows a much more tenuous link between the price
of gasoline and miles driven There was a period in
late 2014 and early 2015 in which miles driven rose as
gasoline prices fell Over the past few years though
the link seems weaker as the figure demonstrates9
This reinforces other research that shows a weak
relationship between gasoline prices and miles
driven By extension the relationship between gas-
oline prices and claim frequency would be similarly
weak Rising gas prices seem unlikely to force claim
frequency to decline
Impact of weather
Severe weather events can certainly have an impact on
auto accidents and insurance claims Snowstorms ice
sleet heavy rain high winds or heavy fog can impair
visibility when driving and affect driver capabilities
vehicle performance (ie traction stability and maneu-
verability) pavement friction roadway infrastructure
and crash risk
Weather can have an impact on auto insurance in two
significant ways Poor weather often leads to more
crashes It can also result in flooding fallen trees and
other off-road claims
Fig 9
Why Are People Driving More Miles Jobs
Source Federal Highway Administration Seasonally Adjusted Employed from Bureau of Labor Statistics Insurance Institute for Highway Safety Insurance Information Institute
2850
2900
2950
3000
3050
3100
3150
120
125
130
135
140
145
15Q415Q114Q113Q112Q111Q110Q109Q108Q107Q106Q1
Billi
ons
of M
iles
Driv
en in
Prio
r Yea
r
Mill
ions
Em
ploy
ed
Miles Driven Number Employed
10Insurance Information Institutewwwiiiorg
Fig 10
More People Working and Driving =gt More Collisions 2006ndash2016
Fig 11
Why Are People Driving More Miles Cheap Gas
Source Seasonally adjusted employed from Bureau of Labor Statistics rolling four-quarter average frequency from Fast Track Monitoring System Insurance Information Institute
Source Federal Highway Administration Energy Information Administration Insurance Institute for Highway Safety Insurance Information Institute
Billi
ons
of M
iles
Driv
en in
Prio
r Yea
r
Aver
age
Pric
e pe
r Gal
lon
2850
2900
2950
3000
3050
3100
3150
15Q414Q413Q412Q411Q410Q409Q408Q407Q406Q4$15
$20
$25
$30
$35
$40
$45
Num
ber E
mpl
oyed
Mill
ions
120
125
130
135
140
145
16Q115Q114Q113Q112Q111Q110Q109Q108Q107Q106Q155
56
57
58
59
60
Ove
rall
Colli
sion
Cla
ims
per 1
00 In
sure
d Ve
hicl
e Ye
arsNumber Employed Collision Claim Frequency
Miles Driven Gas Prices
11Insurance Information Institutewwwiiiorg
Based on 2005ndash2014 data from the National Highway
Traffic Safety Administration approximately 22 percent
of crashes are related to weather On average nearly
6000 people are killed and over 445000 people are
injured in weather-related crashes each year The vast
majority of these crashes happen on wet pavement
(73 percent) while nearly half occur during rainfall
(46 percent) During the wintry months 17 percent of
weather-related crashes occur during snow or sleet
14 percent result from driving on snowy or slushy pave-
ment and 13 percent from driving on icy payment Fog
is present in 3 percent of weather-related crashes10
Weather effects are highly localized and can vary
considerably from year to year Insurance data show
rising claims experience in regions with more severe
winter weather conditions On average some New
England and Mid-Atlantic states saw an 80 percent
growth in first quarter collision claim frequency from
2012 to 2013 and another 12 percent increase in 2014
Not only do severe rainy conditions cause more
accidents but thousands of cars are damaged or
totaled from significant flooding due to heavy rainfall
these losses are reported under the comprehensive
insurance coverage
Insurance rates are built to sustain a certain level of
catastrophe claims but if that is exceeded a rate
increase may follow Over the past year for example
Arkansas Louisiana Oklahoma and Texas have seen
inordinate amounts of flooding The Weather Channel
noted significant storms in March April May June
July August October November and December 2015
and March April and May 201611 Texas also had a
record 240 tornadoes in 201512
Hail storms can also cause a significant number of
auto insurance claims again affecting comprehensive
coverage In early 2016 for example Texas was struck
by a series of significant hailstorms Three April storms
around San Antonio resulted in 136000 damaged
vehicles March hailstorms in Fort Worth and Plano
resulted in $13 billion in claims and an April 11 storm in
Wylie caused $300 million in insured claims much of
it to insured vehicles13
Distracted drivingThere has been a great deal of media coverage
suggesting that an increase in distracted drivingmdash
driving while doing another activity that takes your
attention away from drivingmdashmay be causing an
increase in the accident rate For example CNN
presented ldquoDriving While Distractedrdquo a series of
more than a dozen video reports14
Distracted driving contributes to both the number
of accidents and their seriousness The National
Highway Traffic Safety Administration reported that
more than 3000 persons were killed and 431000
injured in distracted driving accidents in 2014 the
most recent data available That year 10 percent of
fatal crashes 18 percent of crashes with injuries
and 15 percent of property damage only accidents
involved distracted drivers percentages that have
remained consistent since 201015
As smartphones have become ubiquitous concerns
have grown A National Safety Council survey found
that 74 percent of drivers surveyed used Facebook
while driving16 That survey was conducted before the
release of Pokemon Go an app that lets users capture
virtual monsters that appear in the environment as
viewed through a smartphone Pokemon Go was an
instant hit upon its July 2016 release but there were
reports of drivers playing the game behind the wheel17
12Insurance Information Institutewwwiiiorg
Forty-six states and the District of Columbia have
banned texting while driving Fourteen states and the
District of Columbia ban drivers from using handheld
cell phones18 New Jersey legislators have proposed
fining distracted drivers the proposal was received
skeptically19
Increase in size of average claimThe other element in driving loss cost per vehicle
higher is claim severity
Recall the equation
Loss cost = frequency x severity divide 100
If severity rises all else equal loss costs will rise and
put pressure on rates to rise as well Normally claim
severity exceeds the rate of inflation Between 1963
and 2013 for example claim severity for property
damage claims rose 59 percent per year on average20
The inflation rate over that period averaged 41 percent
annually21 This has put consistent upward pressure on
insurance rates and is the reason that auto insurance
rates exceed the overall inflation rate despite the long-
term decline in claim frequency
Most observers point to two reasons that claim
severity increases faster than the inflation rate the
cost of body work and the cost of medical treatment
For collision and property damage claims they point
to increases in the cost of repairs The logic Collision
coverage addresses the cost of repairing a damaged
vehicle which is a function of the cost of body work
As the repair costs rise collision severity will as well
Inflation in the cost of body work consistently exceeds
the overall inflation rate particularly since 2008
Since 2005 the cost of body work has risen nearly
40 percent more than prices overall as Fig 12 shows22
During and immediately after the Great Recession
collision claim severity did not rise as it normally
does As Fig 13 shows collision claim severity rose
less than one-half of 1 percent in each year between
2007 and 2010 It is not immediately clear why this
occurred though it was observed across several
insurance lines including homeowners insurance and
workers compensation23
The figure also shows that claim severity has returned
to its traditional positionmdashexceeding the inflation rate
consistently from 2011 to 2015 Claim severity is again
applying upward pressure to claim costs
The reason bodily injury and personal injury protection
claims grow faster than inflation overall is because
medical inflation rises faster than inflation overall
The amounts that these claims settle for is generally
some function of the severity of injuries a crash victim
receives As medical inflation rises claim severity in
these coverages will rise as well
Fig 14 shows trends over the past decade for bodily
injury coverage (PIP claim severity had similar trends)
From 2006 to 2008 BI claim severity rose more
than 5 percent per year vs a 331 percent average
increase in the Consumer Price Index over that span
From 2009 to 2012 the trend abated though not to
the same degree as in collision claims Severity rose
a bit more than 2 percent per year In the past three
years claim severity has resumed its above-inflation
trend rising more than 3 percent per year
The dynamics of what is causing claim severity to
rise are complex and definitive conclusions are
much harder to reach One trend to note the recent
increase in traffic fatalities Fatalities are tragically the
most severe auto accidents Injury claims often settle
13Insurance Information Institutewwwiiiorg
Fig 13
Collision Claims Severity Trending Higher in 2009ndash2015
Source Fast Track Monitoring System Insurance Information Institute
-3
-2
-1
0
1
2
3
4
5
6
20152014201320122011201020092008200720062005
Annu
al C
hang
e
39
31
01
28
41
13
57
05
13
-01
-23
Fig 12
Cost of Body Work Is Rising Faster Than Costs Overall
(Indexed so 2004 = 100) Source Insurance Information Institute Bureau of Labor Statistics
100
110
120
130
140
201520142013201220112010200920082007200620052004
Body work Overall inflation
14Insurance Information Institutewwwiiiorg
at policy limits and vehicles are either total losses or
expensive to repair An increase in fatalities is likely to
pressure claim severity upward
In 2015 the nation saw a sudden spike in traffic
fatalities Fig 15 shows that the number of fatalities in
2015 rose approximately 8 percent according to the
National Safety Council24 In the first half of 2016 they
have risen another 9 percent compared with the same
period a year earlier25
Some analysts note that the number of traffic deaths
rises when lawmakers raise speed limits Texas now
has the highest speed limit 85 mph on some roads
(enacted in 2012) In the last few years Idaho Montana
Nevada South Dakota and Utah raised their maximum
limits to 80 mph Other states that had fairly recent
changes to 70 mph include Georgia Illinois Maryland
Ohio Oregon Pennsylvania and Wisconsin
More recently an analysis of Ohiorsquos increase in
speed limit (in July 2013) found that crashes jumped
by 19 percent from about 8600 in the two years
pre-change to about 10200 in the two years post-
change Fatal crashes dropped about 10 percent
but all others spiked26
After a comprehensive study on the impact of raising
speed limits in 41 states during 1993ndash2013 the I IHS
recently released its findings Three key conclusions are
bull Higher speeds resulted in at least 33000 additional
fatalities in the 20-year period This nearly offsets the
43000 lives saved by frontal airbags
bull Although the proportion of traffic deaths involving
speed has been falling from 32 percent of crashes in
2010 to 28 percent in 2014 fatality rates would have
been much lower if speed limits had not been raised
in certain states
bull After taking into account factors that could affect the
fatality rate (eg alcohol consumption changes in
unemployment and the number of young drivers)
the number of deaths climbed slightly more than
4 percent with each 5 mph increase in the maximum
speed limit The increase in deaths is more than
8 percent on interstates and freeways27
Summing up both frequency and severity have
been climbing faster in recent years These two facts
have applied considerable upward pressure to auto
insurance rates
Falling investment income
Auto insurers generate profits from two sources under-
writing profits and investment income The company
generates underwriting profits when its premium
exceeds the sum of losses and expenses The com-
pany generates investment income by investing the
funds it is holding It invests the premium it receives
as it waits to pay its expenses and settle claims It also
invests the surplus or cushion that it holds in case it
does not collect enough premium to cover its costs
Even as claim costs have been rising insurers have
been constrained by nearly a decade of low interest
rates in the wake of the Great Recession The return on
insurersrsquo portfolio has declined by nearly one-third with
insurersrsquo return falling to 318 percent in 2015 down
from 449 percent in 2007
Interest rates seem unlikely to climb significantly
soon Economists project that interest rates will begin
rising this year but slowly Their forecast indicates
that insurers are unlikely to achieve rates of return on
investment similar to those in 2007 until well past 2021
Thus insurers find themselves in a difficult marketplace
stuck with rising losses and declining investment yields
15Insurance Information Institutewwwiiiorg
Fig 15
Severity Driver Fatalities Are Rising
Source National Safety Council Insurance Information Institute
-12
-10
-8
-6
-4
-2
0
2
4
6
8
2015201420132012201120102009200820072006200520042003200220012000199919981997199619951994199319921991
Annu
al C
hang
e in
Mot
or V
ehic
le D
eath
s
-70-59
-04
-25-14
-30-24
-01
31
01
80
-29
-95-90
2215
07 01
2210
36
0409
-01
Fig 14
Bodily Injury Severity Rising Every Year in the Past Decade 2005ndash2015
Source Fast Track Monitoring System Insurance Information Institute
0
2
4
6
8
20152014201320122011201020092008200720062005
Annu
al C
hang
e
29
47
57
21
37
18
41
59
17
30
20
16Insurance Information Institutewwwiiiorg
Insurers are continually working to promote traffic
safety reduce costs and make auto insurance more
affordable for their customers Over the years they
have been successful in working with industry partners
to get stricter seatbelt and drunk driving laws enforced
and the adoption of graduated driversrsquo license pro-
grams across the country Insurers also support the
implementation of medical fee schedules to control
rising health care costs and pro-competitive measures
that result in more efficient and cost-effective body
shop repairs They continue to promote anti-fraud
legislation and encourage campaigns to educate
the public on the adverse consequences of fraud
Conversely insurers oppose legislative measures such
as increasing state financial responsibility limits that
result in inflated costs
EFFORTS MADE BY INSURERS TO KEEP COSTS DOWN
Insurers are also developing new tools and technolo-
gies for greater access to online repair service informa-
tion to reduce costs settle claims more efficiently and
improve customer service With access to ldquobig datardquo
and advanced predictive analytics insurers can better
understand their customersrsquo driving risks and behaviors
so that more accurate pricing can be achieved
17Insurance Information Institutewwwiiiorg
WHAT CONSUMERS CAN DO TO LOWER THEIR RATESThere are many ways that insurance customers
can help keep their auto insurance rates down An
obvious one is to drive more safely be alert and
avoid reckless or careless behavior After analyzing
more than 2 million crashes the National Highway
Traffic Safety Administration states that drivers are the
critical reason (ie the last event in the causal chain)
behind 94 percent of crashes Recognition error which
includes driversrsquo inattention and internal and external
distractions is the most common cause (41 percent)
About 33 percent of crashes are due to decision
errors that include driving too fast for conditions
illegal maneuvering and incorrect judgments Other
kinds of careless driving include performance errors
such as poor directional control (1 1 percent) and non-
performance errors such as sleep (7 percent)28
Consumers should also make sure their vehicles
are properly maintained Vehicles are the critical
reason behind 2 percent of crashes due primarily
to tire problems followed by brake-related problems
and steeringsuspensiontransmissionengine-
related problems
Other steps that consumers can take to save on auto
insurance include the following
bull Shop around and compare different insurance
companiesrsquo prices Most if not all state insurance
departments have rate comparison guides to
help consumers
bull Compare insurance costs before buying a car
The premium is based in part on the carrsquos sticker
price the cost to repair it its overall safety record
and the likelihood of theft
bull Make sure to inquire about all discounts
Companies offer discounts to policyholders who
have not had any accidents or moving violations
over a period to time Other discount options may
include those for good students recent graduates
and veterans for installing anti-theft devices having
multiple cars for taking a defensive driving course
or for being a long-term customer
bull Bundle auto insurance with a homeowners insur-
ance policy Many insurers will provide discounts
if the policyholder purchases two or more types
of insurance from them
bull Lower coverage limits or raise deductibles to get
potentially substantial cost savings
bull Consider dropping the collision andor compre-
hensive coverage If a car is an older one perhaps
physical damage coverage is not necessary
bull Take advantage of low-mileage discounts Some
companies offer discounts to motorists who drive a
lower-than-average number of miles per year Low
mileage discounts can also apply to drivers who car
pool to work
18Insurance Information Institutewwwiiiorg
bull Consider usage-based insurance (ie install a
telematics device in the car so that mileage and
driving behavior can be tracked) The use of
telematics helps insurers more accurately estimate
accident damages and reduce fraud potentially
providing cost savings to their customers
bull Ask about group insurance Some companies offer
reductions to drivers who get insurance through a
group plan from their employers through profes-
sional business and alumni groups or from other
associations Consumers should ask their employer
and inquire with groups or clubs of which they are
a member to see if this is possible
As a positive correlation exists between onersquos credit
history and the likelihood of filing a claim policyholders
should maintain a good credit record
Until recently auto insurance rates were fairly stable
due to falling or stable accident rates that kept insured
costs down There has been an alarming increase in
crashes and claims reportedmdashthe upward trend in
claims combined with the cost of claims that is rising
faster than inflation has led to a dramatic rise in the
overall loss cost causing underwriting performance
to deteriorate
Insurers will continue to be active in an effort to con-
tain the number of auto accidents and related costs
Customers can also take certain steps to help lower
their own costs Such steps include shopping around
taking advantage of available discounts bundling
their auto insurance with homeowners insurance
maintaining a good credit score and practicing safe
driving habits
CONCLUSION
19Insurance Information Institutewwwiiiorg
Appendix A
Automobile insurance coveragesInsurers offer different types of auto insurance coverages to pay for injuries and damage to vehicles and other
property when accidents thefts or other events happen A general description of these coverages is provided
below Some coverages are required and others are optional All are priced individually to let policyholders
customize coverage amounts to suit their needs and budget
Mandatory Coverages
Nearly every state requires car owners to carry the following auto liability coverages
bull Bodily Injury (BI) LiabilitymdashThis covers costs associated with injuries and deaths caused by a policyholder
or another individual while driving the policyholderrsquos car
bull Property Damage (PD) LiabilitymdashThis coverage reimburses others for damage to another vehicle or other
property such as a fence building or utility pole caused by the policyholder or another driver operating the
policyholderrsquos car
Frequently Required Coverages
Many states require one or more of the following coverages
bull Medical Payments (MP) or Personal Injury Protection (PIP)mdashThese coverages provide reimbursement
for medical expenses for injuries to driver or the carrsquos passengers It will also cover lost wages and other
related expenses
bull Uninsured Motorist (UM) and Underinsured (UIM) CoveragemdashUM coverage reimburses the policyholder
when an accident is caused by an uninsured motorist or a hit-and-run driver UIM coverage may also be
purchased to cover costs when another driver responsible for an accident lacks adequate liability coverage
Most states are required to offer UM-Bodily Injury coverage although the insured can reject it in some states
UIM-BI coverage may be required either combined with UM-BI or as a separate coverage Insurers in many
states also offer UM-Property Damage and UIM-PD coverages
20Insurance Information Institutewwwiiiorg
Optional Coverages
While basic legally mandated auto insurance covers the cost of damages to other vehicles that are caused by
the insured while driving it does not cover damage to the insuredrsquos own car To cover this the following optional
auto insurance coverages need to be purchased
bull CollisionmdashThis optional coverage reimburses a policyholder for damage to his or her car that occurs as a
result of a collision with another vehicle or other objectmdasheg a tree or guardrailmdashwhen the policyholder is at
fault While collision coverage will not reimburse the driver for mechanical failure or normal wear-and-tear on
the vehicle it will cover damage from potholes or from the car rolling
bull ComprehensivemdashThis provides coverage against theft and damage caused by an incident other than
a collision such as fire flood vandalism hail falling rocks or trees and other hazardsmdasheven getting hit by
an asteroid
bull Glass CoveragemdashWindshield damage is common and some auto policies include no-deductible glass
coverage which also includes side windows rear windows and glass sunroofs Supplemental glass coverage
may also be purchased
21Insurance Information Institutewwwiiiorg
Endnotes1 In this paper we make a clear distinction between rates and premiums A rate is the amount an insurer
charges per vehicle-year of insurance with a car-year being one vehicle insured for 12 months The premium is the amount that policyholders pay which is the rate adjusted for the number and type of vehicles insured and each policyholderrsquos risk profile Typical adjustments where permitted by law include age gender and driving record The premium can change if policyholders grow older or purchase a new vehicle but such changes are not within the scope of this paper
2 See for example Ed Leefeldt ldquoThe deadly math behind rising auto insurance ratesrdquo CBS Marketwatch February 18 2016 Jeff Daniels ldquoAuto insurance rates rising at fastest rate in almost 13 yearsrdquo CNBC May 27 2016 Insurance Journal ldquoGeorgia to Investigate Allstate Auto Rate Increaserdquo April 12 2016 and Therese Apel ldquoDrive in Mississippi Brace for auto insurance hikesrdquo The Clarion-Ledger May 26 2016
3 Statistics on claim frequency claim severity and loss costs are based on data obtained from the quarterly industry Fast Track report prepared by ISO a Verisk Analytics company the most recent edition of which was published April 19 2016
4 National Association of Insurance Commissioners data sourced from SampP Global Market Intelligence
5 Ibid
6 Insurance Information Institute calculations from data in National Association of Insurance Commissioners Auto Insurance Database Report 20122013 December 2015 pp 49 65 89 109 125 149 183 199 Other coverages included in this calculation are Combined Single Limit Liability (2 percent) Medical Payments (2 percent) and UninsuredUnderinsured Motorist (8 percent)
7 James Lynch ldquoNot So Fast Autonomous vehicles will challenge auto insurers but they wonrsquot obliterate themrdquo Contingencies MarchApril 2015 p 38
8 Federal Highway Administration ldquoTraffic Volume Trendsrdquo March 2016 Figure 1
9 US Energy Information Administration ldquoUS All Grades All Formulations Retail Gasoline Pricesrdquo accessed May 23 2016
10 Federal Highway Administration ldquoHow Do Weather Events Impact Roadsrdquo accessed May 31 2016
11 Jon Erdman ldquoThe Major Flash Floods That Have Hit Texas Louisiana Oklahoma Arkansas Since March 2015rdquo The Weather Channel May 27 2016
12 Insurance Council of Texas ldquoLarge Hail Strikes North Texas Cities Againrdquo news release April 12 2016
13 Insurance Council of Texas ldquoSan Antonio Storm becomes Costliest Hailstorm in Texas Historyrdquo news release April 20 2016
14 CNN ldquoDriving While Distractedrdquo August 2016
15 National Highway Traffic Safety Administration ldquoDistracted Driving 2014rdquo Traffic Safety Facts April 2016
16 National Safety Council ldquoDistracted Driving Public Opinion Pollrdquo March 2016
22Insurance Information Institutewwwiiiorg
17 Tanya Mendis ldquoPokemon Gomdashanother distraction for driversrdquo WCNCcom July 14 2016
18 Governors Highway Safety Association ldquoDistracted Driving Lawsrdquo August 2016
19 Vivian Yee ldquoA Distracted-Driving Ban in New Jersey Some Say It Threatens A Way of Liferdquo New York Times August 17 2016 Page 19
20 Lynch p 38
21 Insurance Information Institute calculation from Bureau of Labor Statistics ldquoCPI Inflation Calculatorrdquo accessed May 30 2016
22 Dr Steven N Weisbart ldquoInflation Watch ndash April 2016rdquo Insurance Information Institute May 18 2016
23 Kathy Antonello ldquoState of the Workers Compensation Line 2016rdquo presentation at the National Council of Compensation Insurance Annual Issues Symposium May 13 2016 Dr Steven N Weisbart and James Lynch ldquoInflation From All Sidesrdquo presentation at the Spring Meeting of the Casualty Actuarial Society Colorado Springs Colorado May 18 2015
24 National Safety Council NSC Motor Vehicle Fatality Estimates 2016 Table 1
25 Beckie Strum ldquoUS Traffic Fatalities Continued to Surge in First Half of 2016rdquo The Wall Street Journal
August 23 2016
26 American Journal of Public Health Sept 2009 ldquoLong-Term Effects of Repealing the National Maximum
Speed Limit in the United Statesrdquo Vol 99(9) pp 1626-1631 and The Columbus Dispatch April 17 2016
ldquoMore crashes fewer tickets as Ohiorsquos speed limits roserdquo
27 Insurance Institute for Highway SafetyHighway Loss Data Institute ldquoSpeed limit increases cause 33000
deaths in 20 yearsrdquo Status Report Vol 51 No 4 April 12 2016
28 NHTSA Critical Reasons for Crashes Investigated in the National Motor Vehicle Crash Causation Survey
February 2015
Insurance Information Institutewwwiiiorg
2
TABLE OF CONTENTS Page
Executive Summary 3
Rising Claim Costs 4
Reasons for Increasing Costs 6
Rising Accident Rates 6
Impact of Weather 11
Distracted Driving 11
Increase in Average Size of Claim 12
Falling Investment Income 14
Efforts Made by Insurers to Keep Costs Down 16
What Consumers Can Do to Lower Their Rates 17
Conclusion 18
Appendix A Automobile Insurance Coverages 19
Endnotes 21
Insurance Information Institutewwwiiiorg
3
Over the past year several forces have coincided
to place considerable upward pressure on personal
automobile insurance costs1 Insurer actions in
response have drawn considerable media and
regulatory scrutiny2
This paper examines recent trends in the largest
component of the cost of auto insurancemdashthe cost
of accidents
The dollar amount of claims per vehicle per yearmdash
known in insurance as the loss costmdashis rising Loss
costs are the largest component of the price of auto
insurance They are also the most volatile Whatever
direction they move rates will eventually follow In
recent years total loss costs have been moving
considerably highermdashrising 13 percent in the two
years ending March 2016mdashmore than 10 times the
inflation rate
Loss costs have two parts the number of claims per
vehicle known as frequency or more colloquially
the accident rate and the average size of the claim
known as severity
a Claim frequency has been rising In the last two
years (first quarter 2014 to first quarter 2016)
collision claim frequencymdasha good proxy for the
overall accident ratemdashincreased 26 percent3 The
frequency for other coverages rose as well This
appears directly linked to an increase in the number
of miles people are driving which itself is a function
of the increasing number of people employed
A vehicle year is equal to 365 days of insured coverage for a single vehicle It is the standard measurement of automobile exposures
b Claim severity has also been rising after several
relatively flat years In the past two years collision
claim severity rose 82 percent Other coverages
show similar increases
This information is summarized in Fig 1
EXECUTIVE SUMMARY
This paper documents the increase in loss costs
and resulting pressure on auto insurance rates The
reasons for the increase are complex but this paper
examines some of the reasons that both the rate of
accidents and their size are growing It discusses what
insurance companies are doing to attempt to keep
costs in check It gives consumers advice on how to
reduce the cost of their own insurance
Severity Frequency
Bodily Injurydagger 70 22
Property Damage 115 29
Personal Injury Protection 77 102
Collision 82 26
Comprehensive 83 26
Fig 1
Auto Accidents Growing in Size and FrequencyChange in Frequency Severity 2014ndash2016
Four quarters ended in March daggerBodily injury property damage personal injury protection collision and comprehensive are the five standard coverages in a personal automobile policy They are defined and described further in the AppendixSource Fast Track Monitoring System
4Insurance Information Institutewwwiiiorg
RISING CLAIM COSTSFig 2 shows that auto insurance losses and
expenses have exceeded premium for every
year since 2007 Losses and expenses exceeded
premiums by $75 billion in 2015 up from $33 billion
a year earlier4
An auto insurance policy is actually a bundle of several
coverages There are five standard coverages
bull Bodily Injury Liability coverage constituted
24 percent of auto insurance premium in 2012
according to the most recent data from the National
Association of Insurance Commissioners (NAIC)
It is required in every state
bull Property Damage Liability constituted 18 percent
of auto insurance premium in 2012 according to the
most recent NAIC data It is required in every state
bull Personal Injury Protection constituted 8 percent of
auto insurance premium in 2012 according to NAIC
data It is required in some states but is not written
in others
bull Collision coverage constituted 26 percent of auto
insurance premium in 2012 It is not required by
law but more than 70 percent of drivers purchase
the coverage
bull Comprehensive coverage constituted 12 percent
of 2012 auto insurance premium It is also not
required by law but more than 70 percent of drivers
purchase it
bull Miscellaneous coverages make up the remaining
12 percent of premium This paper will not address
them6
Each of the five standard coverages have seen losses
from accidents spike over the past two years as
shown in Fig 4 By contrast consumer prices overall
rose 09 percent during the same period indicating
that accident costs are rising more than 10 times faster
than inflation overall
Fig 3 shows that insurers have seen losses grow
much faster than expenses Losses grew 371 percent
since 2006 while expenses grew 139 percent5
The increases have been steep across all of the many
protections that auto policies offer
Fig 2
Private Passenger Auto Premiums vs Losses and Expenses 2006ndash2015
Source NAIC data sourced from SampP Market Intelligence Insurance Information Institute
Written premiums Losses and expenses
Billions
$0 $50 $100 $150 $200 $250
2015
2014
2013
2012
2011
2010
2009
2008
2007
2006$1645
$1646$1614$1642
$1641
$1578
$1645
$1664$1666$1683$1690
$1756$1746$1798$1817$1855
$1903$1936$1988
$2063
5Insurance Information Institutewwwiiiorg
Fig 4
Auto Insurance Increase in Loss Costs 2014Q1ndash2016Q1
Fig 3
Private Passenger Auto Losses and Expenses 2006ndash2015
Source NAIC data via SampP Global Market Intelligence Insurance Information Institute
Billi
ons
$0
$25
$50
$75
$100
$125
$150
$175
2015201420132012201120102009200820072006
Losses Expenses and Dividends
$1145$1203 $1234 $1255 $1266
$1331 $1357 $1393$1462
$1570
$433 $411 $411 $409 $417 $425 $441 $462 $474 $493
By contrast consumer prices overall rose 17 percent during 2014 and 2015Source Fast Track Monitoring System
Bodily Injury
96
Property Damage
147
Personal Injury Protection
184
Collision
111
Comprehensive
110
6Insurance Information Institutewwwiiiorg
It is clear that insurance costs are rising Less obvious
is why This paper will focus on what affects collision
coverage The situation is similar in other coverages
Fig 5 shows the rise in the collision losses per vehicle-
year a measure known as the loss cost Insurers
monitor loss costs carefully They are the most variable
component of an insurance companyrsquos business
REASONS FOR INCREASING COSTSthe number of claims per 100 vehicle-years It is
sometimes referred to as the accident rate Severity
is the average size of a claim
A simple formula links loss costs to frequency and
severity
Loss cost = frequency x severity divide 100
For example in 2015 there were 596 collision claims
per 100 vehicle-years so frequency was 596 per
100 The average collision claim was $3434 So for
collision claims that year the loss cost was $20475
being 596 x $3434 divide 100
Rising accident ratesHistorically the rate at which accidents occurmdash
frequencymdashfalls over time Vehicles incorporate safety
improvements such as electronic stability control and
antilock brakes As more and more cars on the road
adopt an improvement more accidents injuries and
deaths are prevented
Highway design contributes as well Newly constructed
roads have wider lanes and fewer sharp turns than
in the past making driving easier and preventing
accidents
Public policy changes are another reason Graduated
driving licenses help young drivers (the most crash-
prone class) learn to drive in stages Social norms and
tougher laws have reduced the threat of drunk drivers
Improvements such as these have pushed claim
frequency lower For some coverages frequency has
fallen by more than half across the past five decades7
The figure shows that loss costs remained within a tight
band (approximately $165ndash$170) from 2008 through
2012 They begin to rise sharply thereaftermdash66 percent
in 2013 58 percent in 2014 and 66 percent in 2015
Other standard coverages show similar increases
Loss costs can be broken down into two componentsmdash
frequency and severity Doing so allows more precise
analysis of what is driving rates higher Frequency is
Fig 5
Collision Loss Cost
Sources Fast Track Monitoring System
$0
$50
$100
$150
$200
$250
16Q120152014201320122011201020092008
$17145
$16526
$16460$170
97$170
39 $18160 $19207 $20475$20706
7Insurance Information Institutewwwiiiorg
Falling frequency helps hold down auto insurance
costs Think back to the equation
Loss cost = frequency x severity divide 100
If frequency is lower then loss costs will be lower all
else being equal Loss costs are the key component
to rates lower frequency will reduce claim costs
However as can be seen in Fig 6 collision frequency
has been rising the past three years climbing 24
percent in 2013 44 percent in 2014 and 08 percent
in 2015 This increase of more than 7 percent over the
past three years places an unusual upward pressure
on claim costs
It appears the immediate reason claim frequency is
rising is that people are driving more miles Fig 7
is the Federal Highway Administrationrsquos estimate of
miles driven annually by people8 There has been a
noticeable spike since 2013 in miles driven coinciding
with the increase in claim frequency
Fig 8 makes the point more clearly It charts
the annual moving averages of collision claim
frequency vs miles driven
The figure demonstrates that as miles driven declined
with the recession claims frequency did as well When
miles driven rose so did claim frequency
The number of miles people drive also appears to be
closely linked to the number of people employed As
Fig 9 shows the number of miles driven tracks closely
with the number of people employed
This again makes sense Most people drive to work
and home again When they lose their jobs they donrsquot
drive to work In addition they have less discretionary
income so they would seem less likely to drive to
movie theaters restaurants and other entertainment
venues or to take vacations As the economy recovers
and they find work again they drive to their jobs and
to spend their newly won discretionary income
Fig 6
Collision Claims Frequency Trending Higher in 2015
Source Fast Track Monitoring System Insurance Information Institute
-4
-3
-2
-1
0
1
2
3
4
5
20152014201320122011201020092008200720062005
Annu
al C
hang
e
-18
-36
25
09
24
44
08
-24-18
-05
-14
8Insurance Information Institutewwwiiiorg
Fig 7
America Is Driving More Again 2000ndash2016
Fig 8
More Miles Driven More Collisions 2006ndash2015
2850
2900
2950
3000
3050
3100
3150
15Q414Q413Q412Q411Q410Q409Q408Q407Q406Q455
56
57
58
59
60
Billi
ons
of M
iles
Driv
en in
Prio
r Yea
r
Ove
rall
Colli
sion
Cla
ims
per 1
00 In
sure
d Ve
hicl
e Ye
ars
Moving 12-month totalSource Federal Highway Administration Insurance Information Institute
Source Federal Highway Administration Rolling Four-Qtr Avg Frequency from Fast Track Monitoring System Insurance Institute for Highway Safety Insurance Information Institute
Miles Driven Collision Claim Frequency
-25
-15
-05
05
15
25
35
20162015201420132012201120102009200820072006200520042003200220012000
Perc
ent C
hang
e M
iles
Driv
en
246
182215
123
253
084 084056
037064 064
127
340 336
-067 -054
-181
9Insurance Information Institutewwwiiiorg
The final chart in this sequence Fig 10 shows
how closely auto claim frequency and employment
have been linked in recent years As the number of
employed people fell claim frequency fell and as
employment rose frequency did as well
A number of industry observers including the authors
have commented on the possibility of a link between
gasoline prices and both the number of miles driven
and claim frequency The logic People were driving
more because gasoline prices were falling But Fig 1 1
shows a much more tenuous link between the price
of gasoline and miles driven There was a period in
late 2014 and early 2015 in which miles driven rose as
gasoline prices fell Over the past few years though
the link seems weaker as the figure demonstrates9
This reinforces other research that shows a weak
relationship between gasoline prices and miles
driven By extension the relationship between gas-
oline prices and claim frequency would be similarly
weak Rising gas prices seem unlikely to force claim
frequency to decline
Impact of weather
Severe weather events can certainly have an impact on
auto accidents and insurance claims Snowstorms ice
sleet heavy rain high winds or heavy fog can impair
visibility when driving and affect driver capabilities
vehicle performance (ie traction stability and maneu-
verability) pavement friction roadway infrastructure
and crash risk
Weather can have an impact on auto insurance in two
significant ways Poor weather often leads to more
crashes It can also result in flooding fallen trees and
other off-road claims
Fig 9
Why Are People Driving More Miles Jobs
Source Federal Highway Administration Seasonally Adjusted Employed from Bureau of Labor Statistics Insurance Institute for Highway Safety Insurance Information Institute
2850
2900
2950
3000
3050
3100
3150
120
125
130
135
140
145
15Q415Q114Q113Q112Q111Q110Q109Q108Q107Q106Q1
Billi
ons
of M
iles
Driv
en in
Prio
r Yea
r
Mill
ions
Em
ploy
ed
Miles Driven Number Employed
10Insurance Information Institutewwwiiiorg
Fig 10
More People Working and Driving =gt More Collisions 2006ndash2016
Fig 11
Why Are People Driving More Miles Cheap Gas
Source Seasonally adjusted employed from Bureau of Labor Statistics rolling four-quarter average frequency from Fast Track Monitoring System Insurance Information Institute
Source Federal Highway Administration Energy Information Administration Insurance Institute for Highway Safety Insurance Information Institute
Billi
ons
of M
iles
Driv
en in
Prio
r Yea
r
Aver
age
Pric
e pe
r Gal
lon
2850
2900
2950
3000
3050
3100
3150
15Q414Q413Q412Q411Q410Q409Q408Q407Q406Q4$15
$20
$25
$30
$35
$40
$45
Num
ber E
mpl
oyed
Mill
ions
120
125
130
135
140
145
16Q115Q114Q113Q112Q111Q110Q109Q108Q107Q106Q155
56
57
58
59
60
Ove
rall
Colli
sion
Cla
ims
per 1
00 In
sure
d Ve
hicl
e Ye
arsNumber Employed Collision Claim Frequency
Miles Driven Gas Prices
11Insurance Information Institutewwwiiiorg
Based on 2005ndash2014 data from the National Highway
Traffic Safety Administration approximately 22 percent
of crashes are related to weather On average nearly
6000 people are killed and over 445000 people are
injured in weather-related crashes each year The vast
majority of these crashes happen on wet pavement
(73 percent) while nearly half occur during rainfall
(46 percent) During the wintry months 17 percent of
weather-related crashes occur during snow or sleet
14 percent result from driving on snowy or slushy pave-
ment and 13 percent from driving on icy payment Fog
is present in 3 percent of weather-related crashes10
Weather effects are highly localized and can vary
considerably from year to year Insurance data show
rising claims experience in regions with more severe
winter weather conditions On average some New
England and Mid-Atlantic states saw an 80 percent
growth in first quarter collision claim frequency from
2012 to 2013 and another 12 percent increase in 2014
Not only do severe rainy conditions cause more
accidents but thousands of cars are damaged or
totaled from significant flooding due to heavy rainfall
these losses are reported under the comprehensive
insurance coverage
Insurance rates are built to sustain a certain level of
catastrophe claims but if that is exceeded a rate
increase may follow Over the past year for example
Arkansas Louisiana Oklahoma and Texas have seen
inordinate amounts of flooding The Weather Channel
noted significant storms in March April May June
July August October November and December 2015
and March April and May 201611 Texas also had a
record 240 tornadoes in 201512
Hail storms can also cause a significant number of
auto insurance claims again affecting comprehensive
coverage In early 2016 for example Texas was struck
by a series of significant hailstorms Three April storms
around San Antonio resulted in 136000 damaged
vehicles March hailstorms in Fort Worth and Plano
resulted in $13 billion in claims and an April 11 storm in
Wylie caused $300 million in insured claims much of
it to insured vehicles13
Distracted drivingThere has been a great deal of media coverage
suggesting that an increase in distracted drivingmdash
driving while doing another activity that takes your
attention away from drivingmdashmay be causing an
increase in the accident rate For example CNN
presented ldquoDriving While Distractedrdquo a series of
more than a dozen video reports14
Distracted driving contributes to both the number
of accidents and their seriousness The National
Highway Traffic Safety Administration reported that
more than 3000 persons were killed and 431000
injured in distracted driving accidents in 2014 the
most recent data available That year 10 percent of
fatal crashes 18 percent of crashes with injuries
and 15 percent of property damage only accidents
involved distracted drivers percentages that have
remained consistent since 201015
As smartphones have become ubiquitous concerns
have grown A National Safety Council survey found
that 74 percent of drivers surveyed used Facebook
while driving16 That survey was conducted before the
release of Pokemon Go an app that lets users capture
virtual monsters that appear in the environment as
viewed through a smartphone Pokemon Go was an
instant hit upon its July 2016 release but there were
reports of drivers playing the game behind the wheel17
12Insurance Information Institutewwwiiiorg
Forty-six states and the District of Columbia have
banned texting while driving Fourteen states and the
District of Columbia ban drivers from using handheld
cell phones18 New Jersey legislators have proposed
fining distracted drivers the proposal was received
skeptically19
Increase in size of average claimThe other element in driving loss cost per vehicle
higher is claim severity
Recall the equation
Loss cost = frequency x severity divide 100
If severity rises all else equal loss costs will rise and
put pressure on rates to rise as well Normally claim
severity exceeds the rate of inflation Between 1963
and 2013 for example claim severity for property
damage claims rose 59 percent per year on average20
The inflation rate over that period averaged 41 percent
annually21 This has put consistent upward pressure on
insurance rates and is the reason that auto insurance
rates exceed the overall inflation rate despite the long-
term decline in claim frequency
Most observers point to two reasons that claim
severity increases faster than the inflation rate the
cost of body work and the cost of medical treatment
For collision and property damage claims they point
to increases in the cost of repairs The logic Collision
coverage addresses the cost of repairing a damaged
vehicle which is a function of the cost of body work
As the repair costs rise collision severity will as well
Inflation in the cost of body work consistently exceeds
the overall inflation rate particularly since 2008
Since 2005 the cost of body work has risen nearly
40 percent more than prices overall as Fig 12 shows22
During and immediately after the Great Recession
collision claim severity did not rise as it normally
does As Fig 13 shows collision claim severity rose
less than one-half of 1 percent in each year between
2007 and 2010 It is not immediately clear why this
occurred though it was observed across several
insurance lines including homeowners insurance and
workers compensation23
The figure also shows that claim severity has returned
to its traditional positionmdashexceeding the inflation rate
consistently from 2011 to 2015 Claim severity is again
applying upward pressure to claim costs
The reason bodily injury and personal injury protection
claims grow faster than inflation overall is because
medical inflation rises faster than inflation overall
The amounts that these claims settle for is generally
some function of the severity of injuries a crash victim
receives As medical inflation rises claim severity in
these coverages will rise as well
Fig 14 shows trends over the past decade for bodily
injury coverage (PIP claim severity had similar trends)
From 2006 to 2008 BI claim severity rose more
than 5 percent per year vs a 331 percent average
increase in the Consumer Price Index over that span
From 2009 to 2012 the trend abated though not to
the same degree as in collision claims Severity rose
a bit more than 2 percent per year In the past three
years claim severity has resumed its above-inflation
trend rising more than 3 percent per year
The dynamics of what is causing claim severity to
rise are complex and definitive conclusions are
much harder to reach One trend to note the recent
increase in traffic fatalities Fatalities are tragically the
most severe auto accidents Injury claims often settle
13Insurance Information Institutewwwiiiorg
Fig 13
Collision Claims Severity Trending Higher in 2009ndash2015
Source Fast Track Monitoring System Insurance Information Institute
-3
-2
-1
0
1
2
3
4
5
6
20152014201320122011201020092008200720062005
Annu
al C
hang
e
39
31
01
28
41
13
57
05
13
-01
-23
Fig 12
Cost of Body Work Is Rising Faster Than Costs Overall
(Indexed so 2004 = 100) Source Insurance Information Institute Bureau of Labor Statistics
100
110
120
130
140
201520142013201220112010200920082007200620052004
Body work Overall inflation
14Insurance Information Institutewwwiiiorg
at policy limits and vehicles are either total losses or
expensive to repair An increase in fatalities is likely to
pressure claim severity upward
In 2015 the nation saw a sudden spike in traffic
fatalities Fig 15 shows that the number of fatalities in
2015 rose approximately 8 percent according to the
National Safety Council24 In the first half of 2016 they
have risen another 9 percent compared with the same
period a year earlier25
Some analysts note that the number of traffic deaths
rises when lawmakers raise speed limits Texas now
has the highest speed limit 85 mph on some roads
(enacted in 2012) In the last few years Idaho Montana
Nevada South Dakota and Utah raised their maximum
limits to 80 mph Other states that had fairly recent
changes to 70 mph include Georgia Illinois Maryland
Ohio Oregon Pennsylvania and Wisconsin
More recently an analysis of Ohiorsquos increase in
speed limit (in July 2013) found that crashes jumped
by 19 percent from about 8600 in the two years
pre-change to about 10200 in the two years post-
change Fatal crashes dropped about 10 percent
but all others spiked26
After a comprehensive study on the impact of raising
speed limits in 41 states during 1993ndash2013 the I IHS
recently released its findings Three key conclusions are
bull Higher speeds resulted in at least 33000 additional
fatalities in the 20-year period This nearly offsets the
43000 lives saved by frontal airbags
bull Although the proportion of traffic deaths involving
speed has been falling from 32 percent of crashes in
2010 to 28 percent in 2014 fatality rates would have
been much lower if speed limits had not been raised
in certain states
bull After taking into account factors that could affect the
fatality rate (eg alcohol consumption changes in
unemployment and the number of young drivers)
the number of deaths climbed slightly more than
4 percent with each 5 mph increase in the maximum
speed limit The increase in deaths is more than
8 percent on interstates and freeways27
Summing up both frequency and severity have
been climbing faster in recent years These two facts
have applied considerable upward pressure to auto
insurance rates
Falling investment income
Auto insurers generate profits from two sources under-
writing profits and investment income The company
generates underwriting profits when its premium
exceeds the sum of losses and expenses The com-
pany generates investment income by investing the
funds it is holding It invests the premium it receives
as it waits to pay its expenses and settle claims It also
invests the surplus or cushion that it holds in case it
does not collect enough premium to cover its costs
Even as claim costs have been rising insurers have
been constrained by nearly a decade of low interest
rates in the wake of the Great Recession The return on
insurersrsquo portfolio has declined by nearly one-third with
insurersrsquo return falling to 318 percent in 2015 down
from 449 percent in 2007
Interest rates seem unlikely to climb significantly
soon Economists project that interest rates will begin
rising this year but slowly Their forecast indicates
that insurers are unlikely to achieve rates of return on
investment similar to those in 2007 until well past 2021
Thus insurers find themselves in a difficult marketplace
stuck with rising losses and declining investment yields
15Insurance Information Institutewwwiiiorg
Fig 15
Severity Driver Fatalities Are Rising
Source National Safety Council Insurance Information Institute
-12
-10
-8
-6
-4
-2
0
2
4
6
8
2015201420132012201120102009200820072006200520042003200220012000199919981997199619951994199319921991
Annu
al C
hang
e in
Mot
or V
ehic
le D
eath
s
-70-59
-04
-25-14
-30-24
-01
31
01
80
-29
-95-90
2215
07 01
2210
36
0409
-01
Fig 14
Bodily Injury Severity Rising Every Year in the Past Decade 2005ndash2015
Source Fast Track Monitoring System Insurance Information Institute
0
2
4
6
8
20152014201320122011201020092008200720062005
Annu
al C
hang
e
29
47
57
21
37
18
41
59
17
30
20
16Insurance Information Institutewwwiiiorg
Insurers are continually working to promote traffic
safety reduce costs and make auto insurance more
affordable for their customers Over the years they
have been successful in working with industry partners
to get stricter seatbelt and drunk driving laws enforced
and the adoption of graduated driversrsquo license pro-
grams across the country Insurers also support the
implementation of medical fee schedules to control
rising health care costs and pro-competitive measures
that result in more efficient and cost-effective body
shop repairs They continue to promote anti-fraud
legislation and encourage campaigns to educate
the public on the adverse consequences of fraud
Conversely insurers oppose legislative measures such
as increasing state financial responsibility limits that
result in inflated costs
EFFORTS MADE BY INSURERS TO KEEP COSTS DOWN
Insurers are also developing new tools and technolo-
gies for greater access to online repair service informa-
tion to reduce costs settle claims more efficiently and
improve customer service With access to ldquobig datardquo
and advanced predictive analytics insurers can better
understand their customersrsquo driving risks and behaviors
so that more accurate pricing can be achieved
17Insurance Information Institutewwwiiiorg
WHAT CONSUMERS CAN DO TO LOWER THEIR RATESThere are many ways that insurance customers
can help keep their auto insurance rates down An
obvious one is to drive more safely be alert and
avoid reckless or careless behavior After analyzing
more than 2 million crashes the National Highway
Traffic Safety Administration states that drivers are the
critical reason (ie the last event in the causal chain)
behind 94 percent of crashes Recognition error which
includes driversrsquo inattention and internal and external
distractions is the most common cause (41 percent)
About 33 percent of crashes are due to decision
errors that include driving too fast for conditions
illegal maneuvering and incorrect judgments Other
kinds of careless driving include performance errors
such as poor directional control (1 1 percent) and non-
performance errors such as sleep (7 percent)28
Consumers should also make sure their vehicles
are properly maintained Vehicles are the critical
reason behind 2 percent of crashes due primarily
to tire problems followed by brake-related problems
and steeringsuspensiontransmissionengine-
related problems
Other steps that consumers can take to save on auto
insurance include the following
bull Shop around and compare different insurance
companiesrsquo prices Most if not all state insurance
departments have rate comparison guides to
help consumers
bull Compare insurance costs before buying a car
The premium is based in part on the carrsquos sticker
price the cost to repair it its overall safety record
and the likelihood of theft
bull Make sure to inquire about all discounts
Companies offer discounts to policyholders who
have not had any accidents or moving violations
over a period to time Other discount options may
include those for good students recent graduates
and veterans for installing anti-theft devices having
multiple cars for taking a defensive driving course
or for being a long-term customer
bull Bundle auto insurance with a homeowners insur-
ance policy Many insurers will provide discounts
if the policyholder purchases two or more types
of insurance from them
bull Lower coverage limits or raise deductibles to get
potentially substantial cost savings
bull Consider dropping the collision andor compre-
hensive coverage If a car is an older one perhaps
physical damage coverage is not necessary
bull Take advantage of low-mileage discounts Some
companies offer discounts to motorists who drive a
lower-than-average number of miles per year Low
mileage discounts can also apply to drivers who car
pool to work
18Insurance Information Institutewwwiiiorg
bull Consider usage-based insurance (ie install a
telematics device in the car so that mileage and
driving behavior can be tracked) The use of
telematics helps insurers more accurately estimate
accident damages and reduce fraud potentially
providing cost savings to their customers
bull Ask about group insurance Some companies offer
reductions to drivers who get insurance through a
group plan from their employers through profes-
sional business and alumni groups or from other
associations Consumers should ask their employer
and inquire with groups or clubs of which they are
a member to see if this is possible
As a positive correlation exists between onersquos credit
history and the likelihood of filing a claim policyholders
should maintain a good credit record
Until recently auto insurance rates were fairly stable
due to falling or stable accident rates that kept insured
costs down There has been an alarming increase in
crashes and claims reportedmdashthe upward trend in
claims combined with the cost of claims that is rising
faster than inflation has led to a dramatic rise in the
overall loss cost causing underwriting performance
to deteriorate
Insurers will continue to be active in an effort to con-
tain the number of auto accidents and related costs
Customers can also take certain steps to help lower
their own costs Such steps include shopping around
taking advantage of available discounts bundling
their auto insurance with homeowners insurance
maintaining a good credit score and practicing safe
driving habits
CONCLUSION
19Insurance Information Institutewwwiiiorg
Appendix A
Automobile insurance coveragesInsurers offer different types of auto insurance coverages to pay for injuries and damage to vehicles and other
property when accidents thefts or other events happen A general description of these coverages is provided
below Some coverages are required and others are optional All are priced individually to let policyholders
customize coverage amounts to suit their needs and budget
Mandatory Coverages
Nearly every state requires car owners to carry the following auto liability coverages
bull Bodily Injury (BI) LiabilitymdashThis covers costs associated with injuries and deaths caused by a policyholder
or another individual while driving the policyholderrsquos car
bull Property Damage (PD) LiabilitymdashThis coverage reimburses others for damage to another vehicle or other
property such as a fence building or utility pole caused by the policyholder or another driver operating the
policyholderrsquos car
Frequently Required Coverages
Many states require one or more of the following coverages
bull Medical Payments (MP) or Personal Injury Protection (PIP)mdashThese coverages provide reimbursement
for medical expenses for injuries to driver or the carrsquos passengers It will also cover lost wages and other
related expenses
bull Uninsured Motorist (UM) and Underinsured (UIM) CoveragemdashUM coverage reimburses the policyholder
when an accident is caused by an uninsured motorist or a hit-and-run driver UIM coverage may also be
purchased to cover costs when another driver responsible for an accident lacks adequate liability coverage
Most states are required to offer UM-Bodily Injury coverage although the insured can reject it in some states
UIM-BI coverage may be required either combined with UM-BI or as a separate coverage Insurers in many
states also offer UM-Property Damage and UIM-PD coverages
20Insurance Information Institutewwwiiiorg
Optional Coverages
While basic legally mandated auto insurance covers the cost of damages to other vehicles that are caused by
the insured while driving it does not cover damage to the insuredrsquos own car To cover this the following optional
auto insurance coverages need to be purchased
bull CollisionmdashThis optional coverage reimburses a policyholder for damage to his or her car that occurs as a
result of a collision with another vehicle or other objectmdasheg a tree or guardrailmdashwhen the policyholder is at
fault While collision coverage will not reimburse the driver for mechanical failure or normal wear-and-tear on
the vehicle it will cover damage from potholes or from the car rolling
bull ComprehensivemdashThis provides coverage against theft and damage caused by an incident other than
a collision such as fire flood vandalism hail falling rocks or trees and other hazardsmdasheven getting hit by
an asteroid
bull Glass CoveragemdashWindshield damage is common and some auto policies include no-deductible glass
coverage which also includes side windows rear windows and glass sunroofs Supplemental glass coverage
may also be purchased
21Insurance Information Institutewwwiiiorg
Endnotes1 In this paper we make a clear distinction between rates and premiums A rate is the amount an insurer
charges per vehicle-year of insurance with a car-year being one vehicle insured for 12 months The premium is the amount that policyholders pay which is the rate adjusted for the number and type of vehicles insured and each policyholderrsquos risk profile Typical adjustments where permitted by law include age gender and driving record The premium can change if policyholders grow older or purchase a new vehicle but such changes are not within the scope of this paper
2 See for example Ed Leefeldt ldquoThe deadly math behind rising auto insurance ratesrdquo CBS Marketwatch February 18 2016 Jeff Daniels ldquoAuto insurance rates rising at fastest rate in almost 13 yearsrdquo CNBC May 27 2016 Insurance Journal ldquoGeorgia to Investigate Allstate Auto Rate Increaserdquo April 12 2016 and Therese Apel ldquoDrive in Mississippi Brace for auto insurance hikesrdquo The Clarion-Ledger May 26 2016
3 Statistics on claim frequency claim severity and loss costs are based on data obtained from the quarterly industry Fast Track report prepared by ISO a Verisk Analytics company the most recent edition of which was published April 19 2016
4 National Association of Insurance Commissioners data sourced from SampP Global Market Intelligence
5 Ibid
6 Insurance Information Institute calculations from data in National Association of Insurance Commissioners Auto Insurance Database Report 20122013 December 2015 pp 49 65 89 109 125 149 183 199 Other coverages included in this calculation are Combined Single Limit Liability (2 percent) Medical Payments (2 percent) and UninsuredUnderinsured Motorist (8 percent)
7 James Lynch ldquoNot So Fast Autonomous vehicles will challenge auto insurers but they wonrsquot obliterate themrdquo Contingencies MarchApril 2015 p 38
8 Federal Highway Administration ldquoTraffic Volume Trendsrdquo March 2016 Figure 1
9 US Energy Information Administration ldquoUS All Grades All Formulations Retail Gasoline Pricesrdquo accessed May 23 2016
10 Federal Highway Administration ldquoHow Do Weather Events Impact Roadsrdquo accessed May 31 2016
11 Jon Erdman ldquoThe Major Flash Floods That Have Hit Texas Louisiana Oklahoma Arkansas Since March 2015rdquo The Weather Channel May 27 2016
12 Insurance Council of Texas ldquoLarge Hail Strikes North Texas Cities Againrdquo news release April 12 2016
13 Insurance Council of Texas ldquoSan Antonio Storm becomes Costliest Hailstorm in Texas Historyrdquo news release April 20 2016
14 CNN ldquoDriving While Distractedrdquo August 2016
15 National Highway Traffic Safety Administration ldquoDistracted Driving 2014rdquo Traffic Safety Facts April 2016
16 National Safety Council ldquoDistracted Driving Public Opinion Pollrdquo March 2016
22Insurance Information Institutewwwiiiorg
17 Tanya Mendis ldquoPokemon Gomdashanother distraction for driversrdquo WCNCcom July 14 2016
18 Governors Highway Safety Association ldquoDistracted Driving Lawsrdquo August 2016
19 Vivian Yee ldquoA Distracted-Driving Ban in New Jersey Some Say It Threatens A Way of Liferdquo New York Times August 17 2016 Page 19
20 Lynch p 38
21 Insurance Information Institute calculation from Bureau of Labor Statistics ldquoCPI Inflation Calculatorrdquo accessed May 30 2016
22 Dr Steven N Weisbart ldquoInflation Watch ndash April 2016rdquo Insurance Information Institute May 18 2016
23 Kathy Antonello ldquoState of the Workers Compensation Line 2016rdquo presentation at the National Council of Compensation Insurance Annual Issues Symposium May 13 2016 Dr Steven N Weisbart and James Lynch ldquoInflation From All Sidesrdquo presentation at the Spring Meeting of the Casualty Actuarial Society Colorado Springs Colorado May 18 2015
24 National Safety Council NSC Motor Vehicle Fatality Estimates 2016 Table 1
25 Beckie Strum ldquoUS Traffic Fatalities Continued to Surge in First Half of 2016rdquo The Wall Street Journal
August 23 2016
26 American Journal of Public Health Sept 2009 ldquoLong-Term Effects of Repealing the National Maximum
Speed Limit in the United Statesrdquo Vol 99(9) pp 1626-1631 and The Columbus Dispatch April 17 2016
ldquoMore crashes fewer tickets as Ohiorsquos speed limits roserdquo
27 Insurance Institute for Highway SafetyHighway Loss Data Institute ldquoSpeed limit increases cause 33000
deaths in 20 yearsrdquo Status Report Vol 51 No 4 April 12 2016
28 NHTSA Critical Reasons for Crashes Investigated in the National Motor Vehicle Crash Causation Survey
February 2015
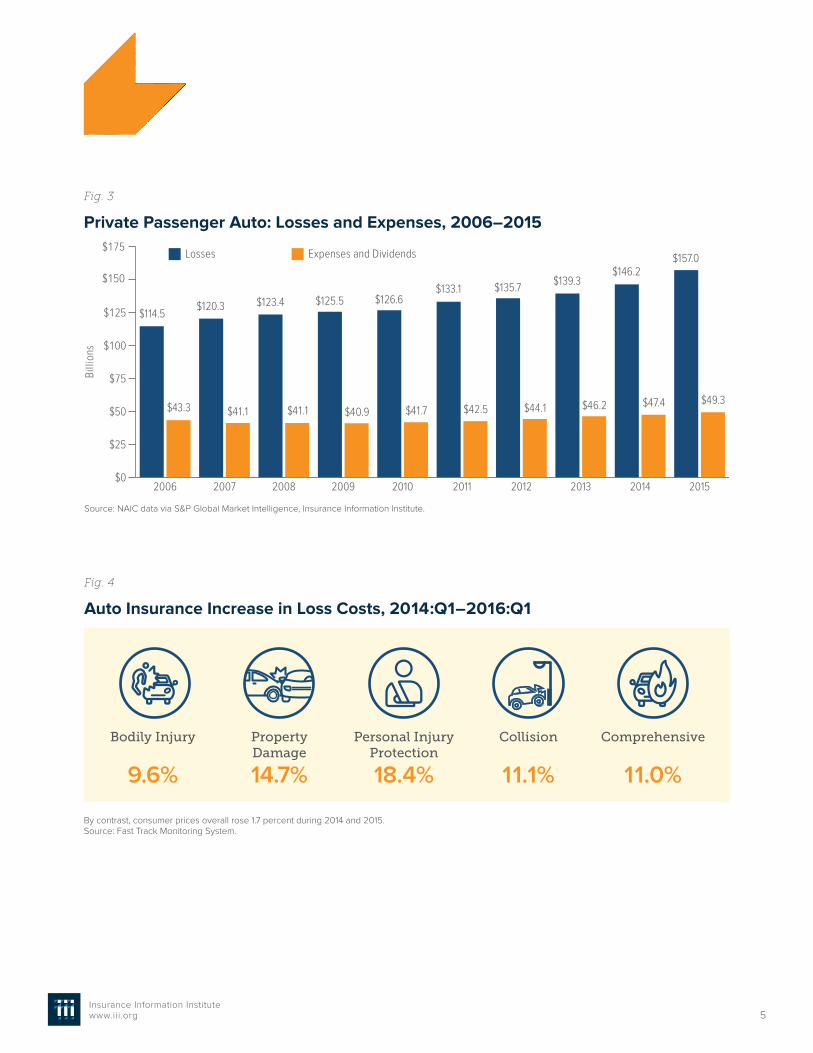
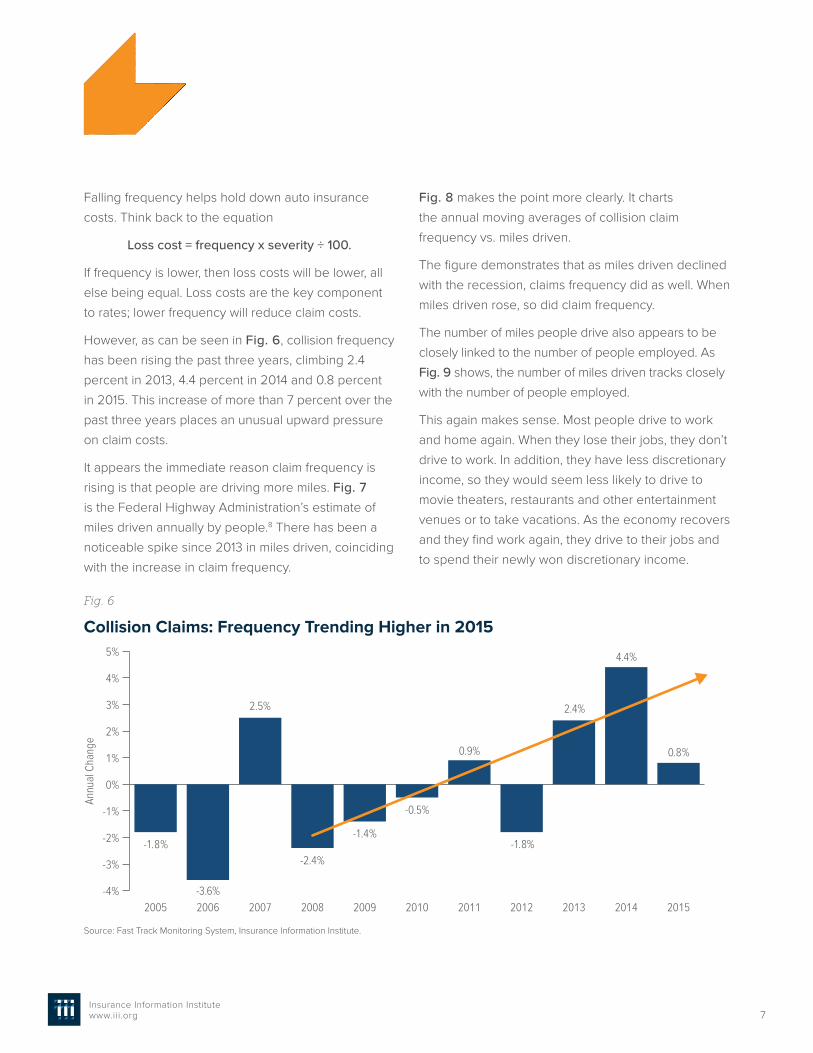
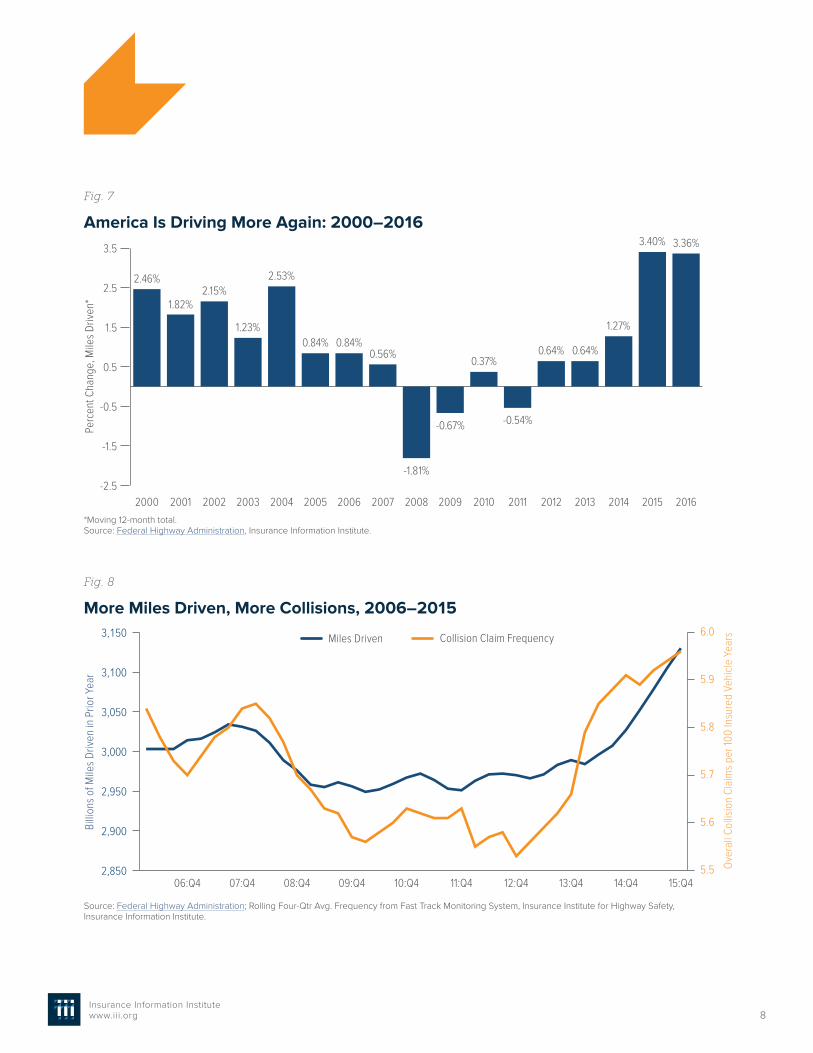
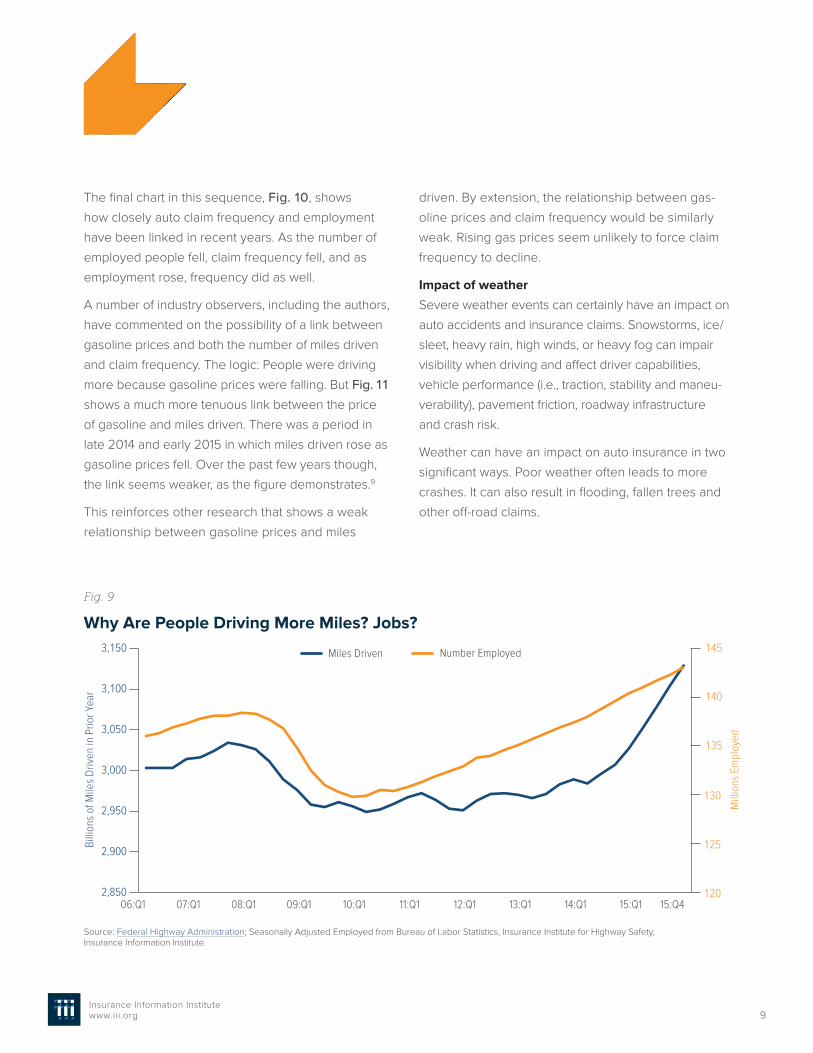
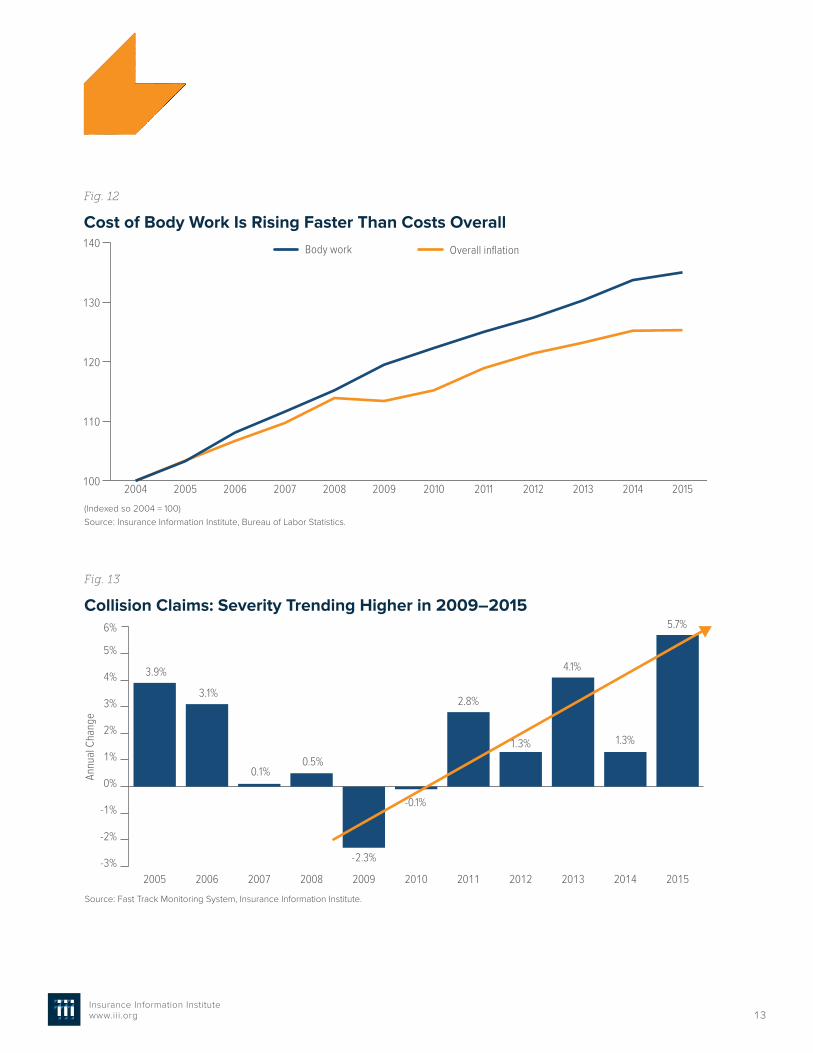
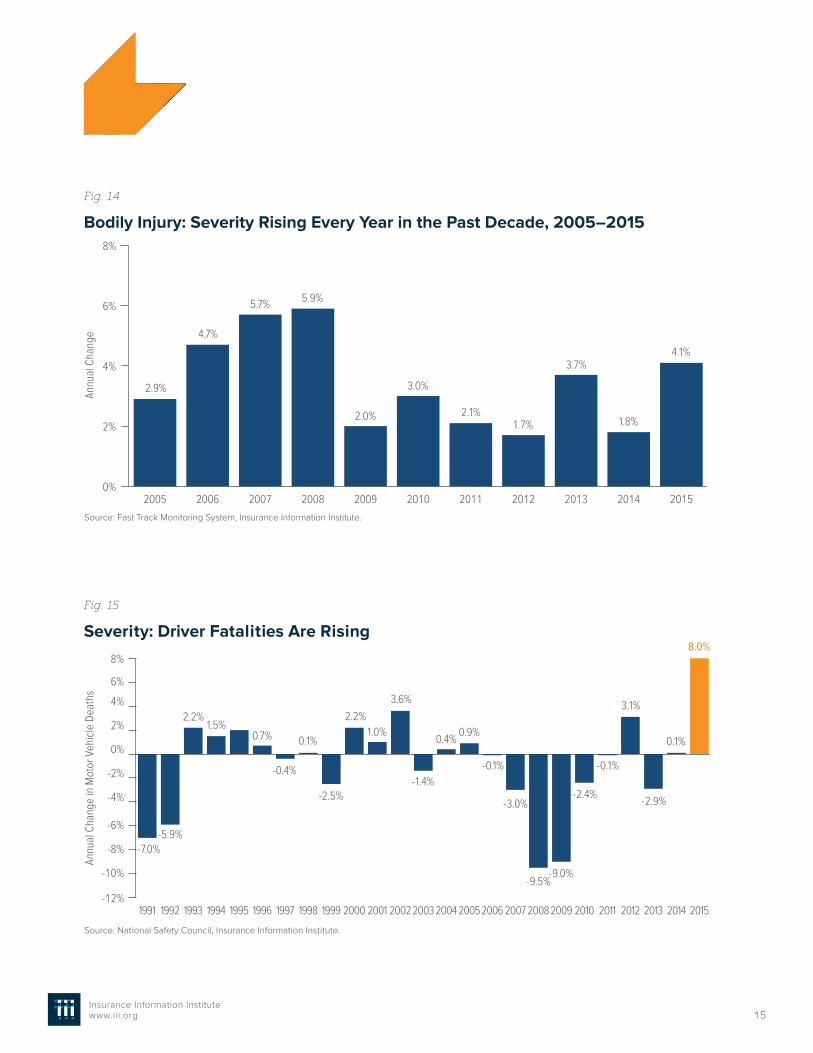