Embed Size (px)
Citation preview
Inspection of Fatigue Cracks on a CN Bridge Using the Electrochemical Fatigue Sensor
Monty A. Moshier, Ph.D.1, Marybeth Miceli2, Hoat Le3, and Dallin Leach1
1SUEE 316 South 400 East
Suite D4 St. George, UT 84790
T: 435-215-4183 [email protected]
2MATECH Corp. 11661 San Vicente, Blvd.
Suite 707 Los Angeles, CA 90049
T: 310-208-5589 F: 310-473-3177
3Canadian National Railway 17641 – South Ashland Avenue
Homewood, Illinois 60430 T: 708-332-3165 [email protected]
Abstract
In early 2008, CN provided a bridge in Steven's Point, WI for the demonstration of the MATECH
Corp. Electrochemical Fatigue Sensor (EFS) System. The EFS System is a non-destructive
fatigue crack inspection tool that can be used to: locate and characterize growing fatigue cracks,
verify the effectiveness of repairs and retrofits, and prioritize repair funds. During this
demonstration, 17 locations were inspected with the EFS system, and MATECH Corp. engineers
determined that nine locations had cracks which were growing, two showed the precursors to
crack growth and that no growing cracks existed at the remaining six locations. As part of CN's
proactive bridge assessment program, CN intends to validate the results provided by MATECH
Corp. with other available technologies. This paper will describe the EFS system, the inspected
bridge, and the inspection results.
© AREMA 2009 ®

INTRODUCTION
The Electrochemical Fatigue Sensor (EFS) system is an innovative, non-destructive testing
method for detecting growing cracks in metal components. Fatigue is one of the primary
degradation mechanisms that limit the life of structures constructed using metal components.
Furthermore, cracks in metal components that result from fatigue may eventually grow to some
critical length causing failure of the structure. When fatigue cracks grow to critical lengths in
steel bridges the bridge either fails, is closed, or requires significant repairs to return it to normal
service. The county’s aging bridges are littered with fatigue cracks.
Currently, classifying fatigue cracks and prioritizing their repair is primarily completed with
information gathered visually.
MATECH Corp. (MATECH) in conjunction with the U.S. Air Force and the University of
Pennsylvania researched and developed the EFS technology in the early 1990’s to detect
growing fatigue cracks in metals. The original research was aimed at developing a technology
for detecting problem cracks in airframes and engines. Since that time, additional research and
development has resulted in the adaptation of the EFS system for steel bridge inspection. Over
the last three years EFS has been successfully used to inspect bridges in the United States and
Australia.
The EFS system’s ability to detect growing cracks in accessible areas provides an immediate
benefit to bridge safety and maintenance. The EFS system provides immediate retrofit
verification and the immediate diagnosis of fatigue cracks in steel bridges. The EFS system
provides previously unavailable information that can be used to prioritize maintenance repairs,
discover problem failure areas, and verify retrofit designs; collectively this provides information
that can be used to save money and lives by helping to extend bridge life and eliminate bridge
failures.
THE EFS SYSTEM AND BRIDGE MANAGEMENT
Traditional fatigue crack inspection tools give inspectors information about the condition of the
inspected structure. That information, however, does not give information beyond a “good – no
good” indicator. That is, traditional tools indicate the presence of a crack but no further
© AREMA 2009 ®

information about the activity of the crack. The fundamental operational characteristics of the
EFS system mean that higher-order information is provided. The following section briefly
describes the various ways that the EFS system can and is currently being utilized in bridge
management approaches.
Traditional Inspection Tool
The first way that the EFS system can be utilized is as a simple complement for other
technologies. In this way, the EFS system is used in combination with engineering judgment and
visual inspection techniques to inspect fatigue sensitive areas. The information derived from
such usage gives engineers information on which inspection locations covered under the sensors
are devoid of growing cracks, and which ones have active cracks present.
A Tool for Prioritizing Repairs
When a number of locations are inspected on a single bridge or a group of bridges the results of
an EFS inspection can be utilized to prioritize repairs and repair dollars. As touched on above the
results of an inspection results in the assignment of one of three categories: (1) no crack activity,
(2) strong potential for future crack growth, (3) growing crack. The prioritization then of where
to repair first, where repairs can wait, and where repairs are not needed is straightforward.
A Tool for Verifying the Efficacy of Repairs
Fatigue crack repairs take a variety of forms depending on the structural geometry and loading
conditions. As one example, stop-holes are frequently drilled at crack tips as a means of altering
high-stress conditions. However, attempts to “capture” the crack tip are frequently unsuccessful
as identifying the true crack tip is generally difficult to impossible. In this instance, an EFS
inspection is performed near the stop-hole to verify that the crack tip had been completely
removed. In other cases, geometrical changes to a bridge are made to alter the load path causing
high fatigue stresses. For example, out-of-plane fatigue cracks are frequently identified in the
web-gap regions of steel girder bridges. As it is known that the out-of-plane stresses result from
differential deflection of adjacent girders, one common repair is to loosen cross frame bracing
connectors or to completely remove the bracing. This repair effectively changes the load paths
which caused the locally high stresses. In this instance, an EFS inspection could be performed
© AREMA 2009 ®

near the known fatigue crack to verify that microplasticity near the crack tip has been eliminated.
Regardless of the type of fatigue crack or the repair methodology employed, an EFS inspection
provides immediate feedback on the effectiveness of the repair at removing the conditions
causing critical stress levels. This approach (repair – inspect – mitigate), then, would represent
an active (and more cost effective) approach to bridge management and repair.
THE EFS SYSTEM
Technical Background on the EFS System
The EFS system is a non-destructive testing method that detects active crack growth, either of
known cracks or in areas that are susceptible to fatigue cracking. During an EFS inspection, an
EFS sensor array is temporarily installed each location of interest. The EFS inspection system
consists of electrolyte filled sensors (used in pairs), a potentiostat that applies a precise constant
polarizing voltage between the structure and the sensors, a ground, and data collection and
analysis software.
During testing, the inspection areas encompassed by the sensors are anodically polarized to
create a passive film on the areas of interest. This polarizing voltage produces a DC base current
in the electrochemical cell. As the structure is exposed to cyclic stresses, the current flowing
within the cell fluctuates in a complex relation to the variations in the mechanical stress. This
results in an AC current superimposed on the base DC current.
During cyclic loading, the fatigue process causes microplasticity and strain localization on a very
fine scale. The interaction of the cyclic slip and the passivating process (due to the applied
polarizing voltage) causes temporary and repeated changes to the passive layers. These
disruptions, including both dissolution and repassivating processes, give rise to transient
currents. Dependent upon the material properties, the loading conditions, and the activity of the
cracks under inspection, this transient current provides information on the status of fatigue
damage at that location.
It is important to note that the transient currents generally possess the same frequency as that of
the mechanical stress, but also have a complex phase relationship. In addition, the disruption of
© AREMA 2009 ®

the passivation layer by the cyclic slip causes an additional component of the transient current
which has double the frequency of the elastic current due to the disruptions occurring during
both the tensile and compressive portions of the loading cycle.
As fatigue damage develops, the resulting cracks induce localized plasticity at different parts of
the fatigue cycle from those in which the background microplasticity occurs and in locations
where cracks have not yet formed inducing higher harmonic components into the transient EFS
current. Analysis of each of these multiple current components indicates whether a crack is
actively growing.
The EFS Sensor
The basic EFS sensor, shown in Figure 1, consists of several integral parts. Each sensor has a
peel back contact adhesive on one side for attachment to the structure. The open area in the
middle of the sensor holds the subsequently described EFS electrolyte. The sensor is filled with
the EFS electrolyte through the lower filler tube while air escapes through the upper bleeder
tube. The EFS sensor electrode – a stainless steel mesh – is sandwiched between the upper and
lower sensor sections. When the sensor is filled with electrolyte, the electrode is completely
covered. Depending on the area to be tested, EFS sensors can be custom-made to fit any three-
dimensional geometric requirements (including size, shape, orientation, etc.).
(a) (b) (c) Figure 1 : (a) Schematic of the EFS sensor (b) Schematic of EFS System in use (c) Photograph of EFS sensor. To enhance the sensitivity of the EFS system, a configuration known as differential EFS is
employed. Differential EFS is a sensor array with one reference (R) and one crack measurement
(CM) sensor. The CM sensor is located over the area of interest and the R sensor is located near
the CM sensor but in a location where a crack is not probable. In this configuration both sensors
Loaded Structure To Be Examined
EFS Sensor
Electrode
Electrolyte
Potentiostat+-
A
Measured CurrentGround
Loaded Structure To Be Examined
EFS Sensor
Electrode
Electrolyte
Potentiostat+-
A
Measured CurrentGround
© AREMA 2009 ®

experience the same elastic loading conditions. Using various proprietary signal and data
processing techniques, the signals from the two sensors are compared to determine if a crack is
present. In the presence of a growing crack, the CM measurement sensor outputs a greater
absolute current magnitude than the R sensor data and contains the extra frequency content as
alluded to earlier.
The EFS Electrolyte
The chemical composition of the EFS electrolyte is proprietary. It is a water-based solution that
has been tested on multiple materials including aluminum, titanium, copper, and steel and has
been found to be benign to metals in all studies. The electrolyte is inert and environmentally safe.
The EFS Potentiostat Data Link
The EFS potentiostat data link (PDL) is an electronic device that has been custom designed not
only to precisely control the voltage between the inspection material (the steel bridge member)
and the sensor but to also measure and store the current data. The current data are then used to
determine the crack growth activity of the inspection location.
The battery-powered, wireless PDLs and access points, shown near the bottom of Figure 2 (note:
PDLs are numbered 60, 55, 62, etc.; access points are located directly behind the PDLs) provides
all of the features necessary to collect data in the field. The potentiostat is compact, lightweight,
and provides isolated channels for the R sensor and the CM sensor. The MATECH PDL features
onboard A/D conversion, data collection to a removable MMC card, wireless data streaming, and
an easy to use wireless setup for bias, gain, and sample rate. The access points are used to setup
a temporary network on the bridge for wireless communication between PDLs and an interfacing
control laptop.
© AREMA 2009 ®

Figure 2 : The EFS wireless access point antenna (back) with the numbered PDL’s and individual wireless
antennae (front). Sensors and electrolyte shown in foreground.
The EFS Software
An easy to use software package was developed specifically for the collection and analysis of
EFS data. The software uses a proprietary algorithm, various filters and windowing to analyze
the collected data. Specifically, a chirp Z-Transform, or CZT, is used to extract the relevant
frequency data from the bridge loading frequency spectrum.
The software allows for a raw EFS current output in the time domain and an FFT of the time-
based data, both of which are analyzed to determine the activity of a crack.
© AREMA 2009 ®

Sensor Installation
Sensor installation requires a clean and bare, but not polished, metal surface in the sensor
installation areas. A power wire wheel and 120-grit sandpaper are used to remove the paint and
any dirt from the inspection areas. After paint removal, the metal surface is cleaned with acetone
to remove any residual paint and debris, to provide an electrically conductive surface. The sensor
arrays are then installed by simply removing the self-adhesive backing and firmly pressing them
in place. Following sensor placement, the sensors are filled with the EFS electrolyte by injecting
the electrolyte through the filler tube. Once full, the filler and bleeder tubes were sealed.
Once sensor installation was complete, the PDL’s are installed (affixed magnetically to the
structure) and connected to the sensors. Wireless communications are then registered and the
bias, gain, and data acquisition rate were set for each PDL. Typically, a bias of 0.4 volts, a gain
of 1, and a data acquisition rate of 200 Hz are used.
Data Collection and Analysis
Wireless communications are used to trigger data collection and the data are stored locally on the
individual potentiostat data links (PDL’s). After the data collection is complete, the data are
downloaded from each PDL wirelessly to the laptop computer for analysis and data archiving.
An EFS data set is collected for each of the EFS sensor arrays (reference (R) and crack
measurement (CM)) while the bridge is loaded dynamically by moving loaded trains or trucks
depending on the type of bridge. Multiple data sets are collected for each of the locations to
assure system repeatability.
The ratio in the frequency domain for crack measurement (CM) sensor data to the reference (R)
sensor data is defined as the energy ratio. In general, crack growth is indicated when the energy
ratio of the CM sensor EFS signal output to the R sensor output in is at least 2.0. Energy ratios
in the range of 1.5 to 1.9 indicate that microplasticity is occurring at that location and that the
area is at an elevated risk for future crack growth. Energy ratios below 1.5 generally indicate
that active crack growth is not occurring. These are general and simplified guidelines for the
purpose of quickly determining the crack activity. The EFS software is used to complete a more
robust analysis. The software provides the results and indications for crack growth.
© AREMA 2009 ®

Stevens Point Rail Bridge, Stevens Point, WI – Canadian National Railway - CASE STUDY
The Stevens Point rail bridge (Figure 3) at mile 251.15 in Stevens Point, WI was inspected using
EFS in 2008. Seventeen inspection locations on nine connection details were inspected using the
EFS system to determine the activity of cracks on the bridge. All seventeen test locations were of
a similar detail. A photo of a typical inspected detail is shown in Figure 4, while a schematic of
the inspection locations are shown in Figure 5. A visual inspection revealed that cracks had
formed around the toe of the welds at the connection detail and had either propagated into the
base metal, or continued along the toe of the weld itself. Except for Location 4, both ends of
each crack were inspected at each location. Locations 3 and 6 did not have visually detectable
cracks, but were of the same detail as the other locations and were, thus, inspected to determine
the possibility of previously unidentified cracks in the area covered under the sensors at these
locations. A summary of the results is contained in Table 1.
Figure 3 : Stevens Point Bridge at Mile 251.15 in Stevens Point, WI.
© AREMA 2009 ®

Figure 4 : A photo of a typical cracked stiffener connection.
Figure 5 : Schematic of the inspection locations.
© AREMA 2009 ®

Table 1 - Tabulated Results from the 17 Inspection Locations.
Inspection Location ID
Crack Visually Detected Prior?
Energy Ratio Activity
1A Yes 1.3 No Activity 1B Yes 1.1 No Activity 2A Yes 2.1 Actively Growing 2B Yes 1.4 No Activity 3A Yes 1.0 No Activity 3B Yes 1.7 Microplasticity 4 Yes 2.8 Actively Growing
5A Yes 3.7 Actively Growing 5B Yes 2.2 Actively Growing 6A No 3.0 Actively Growing 6B No 1.4 No Activity 7A Yes 1.2 No Activity 7B Yes 2.3 Actively Growing 8A Yes 1.4 No Activity 8B Yes 1.8 Microplasticity 9A Yes 1.9 Microplasticity 9B Yes 2.3 Actively Growing
Locations 2A, 4 through 6A, 7B, and 9B all exhibited active crack growth under train loads.
Both the frequency and time domain data exhibited visible differences in magnitude and
frequency content between the CM sensor and the R sensor. The Energy Ratio for the growing
cracks was as much as 3.7. The results from locations 1A, 1B, 2B, 3A, 6B, 7A, and 8A showed
no signs of crack growth activity with the energy ratios all below 1.4. With energy ratios
between 1.5 and 1.9, the results from locations 3B, 8B, and 9A showed signs of microplasticity
the precursor to crack growth.
Understanding the EFS System Results
Fatigue in metals can be broken down into two stages, the initiation stage and the crack growth
stage. During the initiation stage microplasticity causes damage to accumulate in the form of
slip bands. Eventually this damage progresses until a small crack forms. Once a fatigue crack
has formed the remaining stage of crack growth begins. Both stages of fatigue are highly
dependent on the number of dynamic cycles and the level of the dynamic stress being applied.
© AREMA 2009 ®

Crack growth continues anytime the crack driving force is above threshold. The crack driving
force is a function of the geometry, crack size, and the applied stress. If any one of these factors
changes the crack growth status can change. The crack status can be broken down into three
categories, actively growing, no activity, and microplasticity. Actively growing is defined as a
crack whose length is increasing. No activity is defined as a crack or location that is not
experiencing any signs of microplasticity. Microplasticity indicates that incremental damage is
occurring in the form of slip bands forming at the steel surface. These slip bands often result in
fatigue crack initiation and growth sometime in the future.
An EFS inspection categorizes the inspected areas into the three categories discussed above,
actively growing, no activity, and microplasticity. Three specific examples from the Stevens
Point Bridge inspection will be used to illustrate the three types of EFS inspection system results.
Actively Growing
Figure 6 shows a typical fatigue sensitive detail that was inspected on the Stevens Point Bridge.
EFS sensors were installed on both crack tips. The cracks tips were marked as locations 2A and
2B. Location 2A is shown in the left hand pictures and location 2B is shown in the right in right
hand pictures (Figure 6). The EFS data analysis shows that a crack is growing on the left side of
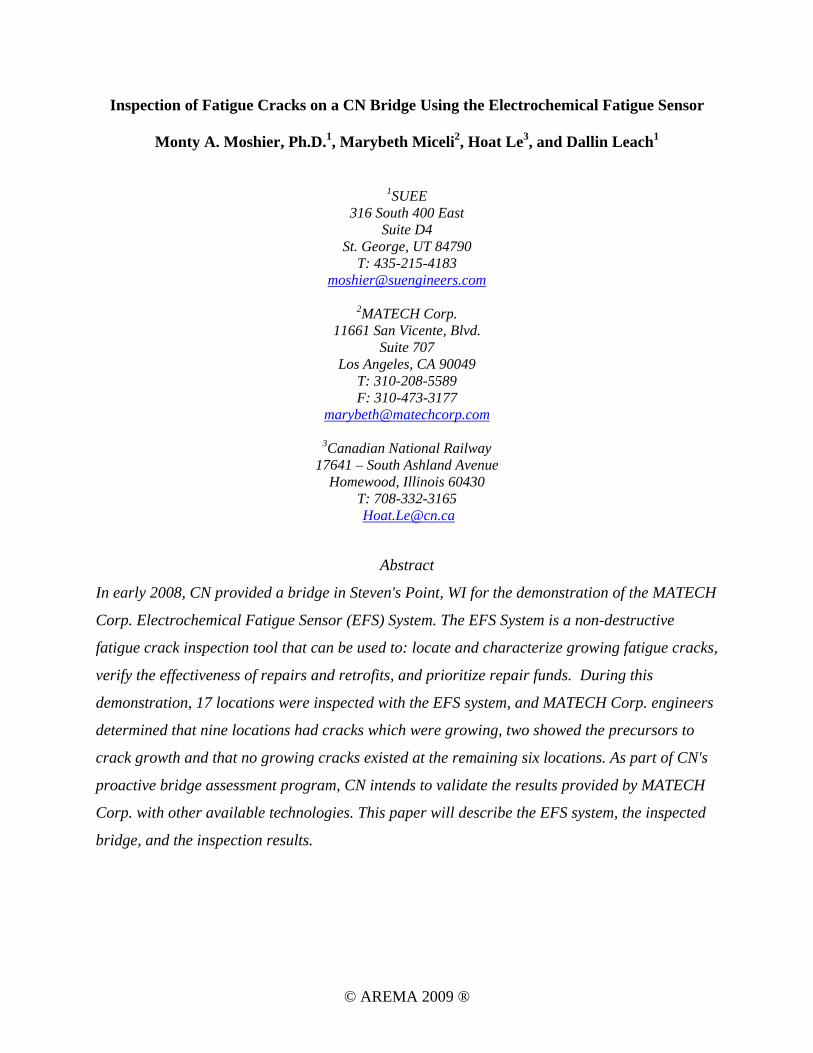
the beam at Location 2A. The time and frequency domain outputs for the inspection done at
location 2A are shown in Figures 7 and 8. The data result for the CM sensor is shown in red
while the R sensor is shown in green. Crack growth is indicated when the energy ratio is at least
1.9. This is visually seen in the data when the red signal is sufficiently larger than the green
signal (Figure 8). At location 2A the energy ratio between the EFS signal of the CM sensor and
the R sensor is 2.05 and indicates that there is a growing crack at this location.
© AREMA 2009 ®

Figure 6 : EFS response from an actively growing crack at a stiffener.
© AREMA 2009 ®
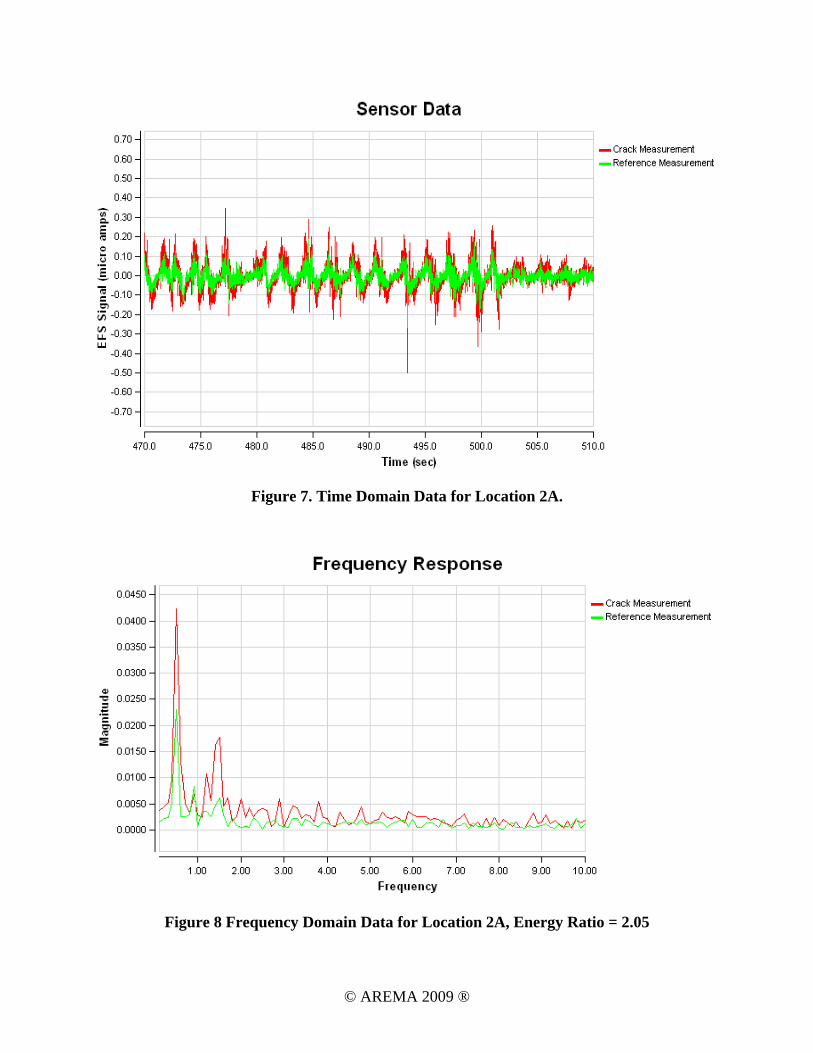
Figure 7. Time Domain Data for Location 2A.
Figure 8 Frequency Domain Data for Location 2A, Energy Ratio = 2.05
© AREMA 2009 ®

No Activity
Generally, the EFS system indicates no activity when the energy ratio between the CM and R
sensor is less than 1.5. The energy ratio between the CM sensor and the R sensor for location 3A
was 1.08. Location 3A shown in Figure 9 was found to have no crack growth activity. Visually,
no activity can be seen when the red signals (CM sensor) and the green signals (R sensor) are
nearly the same as shown in the time and frequency domain plots (Figure 10 and Figure 11).
Note: The top left picture shows the location before testing. . The top right picture shows the location with corrosion removed. The bottom pictures show the sensors installed.
Figure 9. Locations 3A - Span 5, Outer East, South Stiffener.
© AREMA 2009 ®

Figure 14. Output of Time Domain of Location 3A.
Figure 15 Output of Frequency Domain of Location 3A, Energy Ratio = 1.08
Microplasticity
Microplasticity is indicated by the EFS system when the energy ratio is between the CM and R
© AREMA 2009 ®
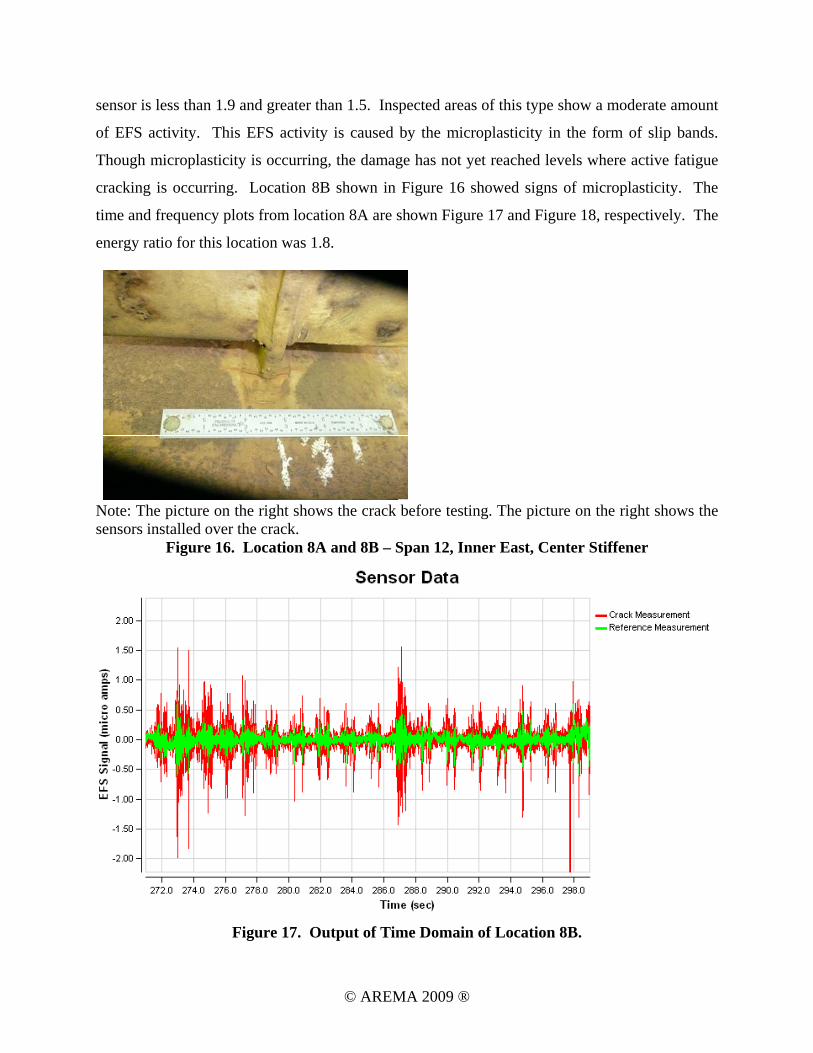
sensor is less than 1.9 and greater than 1.5. Inspected areas of this type show a moderate amount
of EFS activity. This EFS activity is caused by the microplasticity in the form of slip bands.
Though microplasticity is occurring, the damage has not yet reached levels where active fatigue
cracking is occurring. Location 8B shown in Figure 16 showed signs of microplasticity. The
time and frequency plots from location 8A are shown Figure 17 and Figure 18, respectively. The
energy ratio for this location was 1.8.
Note: The picture on the right shows the crack before testing. The picture on the right shows the sensors installed over the crack.
Figure 16. Location 8A and 8B – Span 12, Inner East, Center Stiffener
Figure 17. Output of Time Domain of Location 8B.
© AREMA 2009 ®

Figure 18. Output of Frequency Domain of Location 8B, Energy Ratio = 1.8
SUMMARY
The EFS system is currently being deployed in multiple states as an important bridge
management decision tool. The system accurately monitors crack behavior at known sites as
well as indicates the likelihood of crack initiation and degree of crack propagation in fatigue
prone locations, in the areas covered under the sensors. EFS investigation results aid in the
prioritization of repairs and subsequent review dates based on the degree of severity the crack
propagation behavior. Prioritizing problem areas ensures public safety and is cost efficient.
Problem areas can be detected and corrected earlier than cases using alternate technology.
Repairs are then tested for efficacy using the EFS system to help bridge owners attain the
optimal quality they seek in repairs and retrofits.
© AREMA 2009 ®

REFERENCES
1. Moore, M.E., B.M. Phares, B.A. Graybeal, D.D. Rolander, and G.A. Washer, “Reliabilty
of Visual Inspection of Highway Bridges” Federal Highway Administration Report
FHWA-RD-01-20, Washington, DC, 2001.
2. National Bridge Inspection Standards. Washington, DC: United States Department of
Transportation, Federal Highway Administration; Government Printing Office (2002).
3. Ryan, T., R. Hartle, J. Mann and L. Danovich. Bridge Inspector’s Reference Manual [No.
FHWA NHI 03-001]. Arlington, Virginia: Federal Highway Administration, National
Highway Institute (2006).
4. Kirk, R. and W. Mallett. [RL34127] CRS Report for Congress, Highway Bridges;
Conditions and the Federal /State Role. Washington, DC: Congressional Research
Service: (2007): p CRS-14.
ACKNOWLEDGEMENTS
Thanks are accorded to the Canadian National Railway for their cooperation during the
inspection and preparation of this paper. Special thanks are also given to the senior management
of MATECH Corp. for their support, input, vision, and encouragement.
© AREMA 2009 ®