Embed Size (px)
Citation preview

Telephone (+61 8) 9263 1111
Facsimile (+61 8) 9325 6452
Email [email protected]
Website www.psl.com.au
MONTHLY STRATEGIC OUTLOOK
AUGUST 2011
Shattering the glass debt ceiling

All information and advice is confi dential and for the private information of the person to whom it is provided and is provided without any responsibility or liability on
any account whatsoever on the part of this fi rm or any member or employee thereof.
MONTHLY STRATEGIC OUTLOOK 2
IN THIS ISSUE...
Macro Investment Strategy
Shattering the glass debt ceiling . . . . . . . . . . . . . . . . . . . . . . . . . . . . . . . . . . . . . . . . . . . . . . . . . . . . . . . . . . . 3
Australian Outlook
Cost pressures apparent, but RBA sits pat, trims GDP growth expectations . . . . . . . . . . . . . . . . . . . . . . . . 8
Quantitative Focus
High earnings risk present over reporting season . . . . . . . . . . . . . . . . . . . . . . . . . . . . . . . . . . . . . . . . . . . . . .10
SECTORS
Banks
The end-June back sector reporting cycle beckons . . . . . . . . . . . . . . . . . . . . . . . . . . . . . . . . . . . . . . . . . . . .12
Energy
Coal - Coal and Carbon . . . . . . . . . . . . . . . . . . . . . . . . . . . . . . . . . . . . . . . . . . . . . . . . . . . . . . . . . . . . . . . . . .14
Oil and Gas - Early stage Australian shale appraisal could prove a key growth sector . . . . . . . . . . . . . . . . .18
Industrials
Resource Services - Reporting season preview . . . . . . . . . . . . . . . . . . . . . . . . . . . . . . . . . . . . . . . . . . . . . . . .23
Mining and Metals
Flight to quality with M&A activity pending . . . . . . . . . . . . . . . . . . . . . . . . . . . . . . . . . . . . . . . . . . . . . . . . . .32
REITs
Is Westfi eld’s current share price justifi ed? . . . . . . . . . . . . . . . . . . . . . . . . . . . . . . . . . . . . . . . . . . . . . . . . . . .40
Retail
Retailers are the fi rst to experience . . . . . . . . . . . . . . . . . . . . . . . . . . . . . . . . . . . . . . . . . . . . . . . . . . . . . . . . .46

MONDAY 20 APRIL 2009
All information and advice is confi dential and for the private information of the person to whom it is provided and is provided without any responsibility or liability on
any account whatsoever on the part of this fi rm or any member or employee thereof.
MONTHLY STRATEGIC OUTLOOK 3
Andrew Quin - Research and Strategy Coordinator
SHATTERING THE GLASS DEBT CEILING
AUGUST 2011
Macro Investment Strategy
We maintain a Neutral/Bearish view on the market though would move to a fully Bearish view on a sustained break of All Ordinaries (XAO) 4200, signalling a failure of the 24 months established primary trading range.
There is one major date for stock traders to note in their diaries; US politicians just told traders, and anyone else who cared to
listen, that the country will face another debt crisis period in 1QTR 2013. This has been told to the market at the same time as US
economic numbers are deteriorating, and debt pressures continue to infl uence the EU, China and Japan. In Australia there has been
a deterioration in confi dence based on RBA interest rate settings and government management.
US proposed government spending cuts look weak and implemented over a long period. They do not start signifi cantly till 2013, this
“lack of a clear plan to defi cit control” is likely to restrain confi dence and US economic growth. It is possible the US will have a new
government and be back in recession by 2013 making it more diffi cult to cut spending, or lift taxes.
The US will soon be pushing gross debt to GDP to around 110-115%. However, this is likely to still be sustainable, provided any
economic slowdown is not too severe. A US ratings downgrade from AAA will not make much difference to the Bond market given
limited alternative liquid AAA options.
Larger structural risk factors probably reside in Japan, the EU, and possibly China, from an Australian perspective, although scope to
address problems look more achievable in China. Macro strength to move the stock market still obviously resides in the US, though
the US has a highly liquid Bond market and its reserve currency status will see it receive support from multiple parties allowing debt
risk levels to be pushed further than many other countries in the world. This is evidenced by the movement of funds into US Bonds
during the current stressed period.
Multiple external macro and domestic risk factors are apparent warranting an ongoing conservative stance towards the Australian
stock market.
Let’s recap
Back in 2007/2008 a downturn in the US property market, leveraged by derivatives, resulted in a freezing of the interbank market
and near collapse of the global economy. Central bank intervention, acting to guarantee the interbank market saved the economic
system from meltdown. The shock to the global economy crashed stock markets, and private sector demand. Governments raced
interest rates to base levels and spent trillions of dollars, much raised through the sovereign Bond markets and thus defi cit spending,
to replace the drop in private demand. Governments assumed these fi scal and monetary initiatives would be suffi cient to stimulate
demand for a period, before private sector demand recovered suffi ciently for expenditure to be reduced. This effect we saw from
2009 to 2011. However, the anticipated recovery in private sector demand has not occurred.
Absent a recovery in private sector demand, many governments now fi nd themselves saddled with very high debt to GDP levels with
little room to move on either the fi scal or monetary sides. Following Bond market collapse in Greece, Ireland and Portugal; Spain,
France and Italy are also seeing enhanced risks. A self-reinforced Bond yield spiral remains a primary risk for many countries and the
global economy.
To counter this risk central banks in the US, EU and Japan have implemented quantitative easing (QE), government purchases
of Bonds to support demand and hold yields down. As stimulatory effects from governments abate global economic growth is
declining. Structural risk has partly been shifted from the private fi nancial sector to the sovereigns.
While parts of the vanilla (base) market, such as US stocks and their earnings, have bounced substantially, the underlying fi nancial
and debt market structures of the global economy are in a severely stressed state. Multiple risk factors in the vanilla markets are
compounded by linked derivatives, or the synthetic markets, adding both risk and complexity.
What are the key structural risk factors?
• Bank solvency – if the value of assets against debt held was accurately marked to the market many banks (outside Australia)
would be insolvent.
• Sovereign solvency – high debt to GDP levels in many countries risks a Bond market collapse.
• OTC Derivatives – factor up the risks if vanilla markets experience excess stress.

All information and advice is confi dential and for the private information of the person to whom it is provided and is provided without any responsibility or liability on
any account whatsoever on the part of this fi rm or any member or employee thereof.
MONTHLY STRATEGIC OUTLOOK 4
What are the key structural risk points to watch?
• A Bond yield expansion not contained by QE efforts, relative to GDP growth – By buying their own Bonds governments can
hold Bond yields down. However, there is a likely point where QE becomes ineffective and the market moves to adjust yields to
refl ect true debt servicing risks, or the risk of default. Yields moving higher if economic growth improves are not a problem.
Thus sovereign Bond market yields and CDS movements are fundamental structural risk factors to watch. The most vulnerable
markets to watch are Japanese, Spanish, Italian, French and US Bonds and CDS (For more detail see Weekly Market Wrap 16
February 2011 – Bond yield tipping points you need to know).
• Economic growth slowing – The global economy is at a stretched point of risk due to a heavy debt load. A slowdown in global
growth could reduce tax receipts and add to debt servicing diffi culties.
The biggest defi cit is the confi dence defi cit
The trouble with the world today is that there is extreme oversight; of the wrong people. Lurching from one economic crisis to the
next is like shouting at a child for doing something wrong, and then wondering why the child fails to show initiative. Metaphorically,
governments and politicians can shout all they like, and the US Treasury, Federal Reserve, European Central Bank, Reserve Bank of
Australia, and Bank of Japan do what they may, but until they instil confi dence back into the people, the people are not going to
show initiative, they are going to play it safe, and playing it safe is both a recipe for stagnation and mediocrity, if it is driven by fear.
The primary business of government is confi dence
There is in the end only one role for governments and that is to instil justifi ed confi dence in the minds of the people. Unfortunately,
that is not happening in Australia, the US, Japan, or the EU. Debt negotiations in the US have highlighted two things. Firstly, that the
system is a shambles, and secondly the focus for US default has simply shifted from 2nd August 2011, to 1QTR 2013.
There are two basic measures the US should implement immediately. Firstly, they should do away with having an arbitrary debt
ceiling point, and secondly rather than instigating a QE3 the Fed should simply state, “The Federal Reserve maintains its authority to
enter the US Bond market when it believes such activity is warranted.”
The US debt ceiling is just a point put in place by Congress. There is no reason to have a debt ceiling, especially if it risks periodic
default. By having set and defi ned US QE programs the success and scale of these is measured by the market. Both debt ceiling and
QE initiatives in their current form allow quantifi able risk points to be determined and this adds unnecessary stress to global markets.
The US government will increase its debt ceiling limit by US$2.1 trillion, initially reduce spending by US$1 trillion over 10 years, and
an additional US$1.5 to US$1.2 trillion by 2021. At least that is the theory. The reality is that the deal does not look very aggressive on
the spending cut side and post the 6 November 2012 election much of these potential cuts will be up for debate alongside spending
increases.
The spending cuts, if they occur also appear to be pushed out over a long period, and take place on the assumption solid growth
will return to the US economy suffi cient to deal with cut backs in spending. The reason most cuts have been delayed till past 2013 is
the US Government deems the economy to be too weak currently to manage cuts. So there is an assumption that in the future the
economy will improve suffi ciently to implement spending cuts over a longer period. Certainly a reduction in military expenditure,
all going well in Afghanistan and Iraq should assist the defi cit situation, however the US defi cit will be pushing US$16.4 trillion in the
near future.
In the short term the US will be in the market for another US$2.1 trillion. The total US gross national debt is made up of “debt held by
the public” valued at approximately US$9.6 trillion and “intra-governmental debt” valued at US$4.6 trillion. Given that a reasonable
portion of the debt is owned to itself the US has scope to push debt to GDP levels further. In fact, it could be wise to keep a closer
eye on the EU and Japanese debt situations than the US debt situation.
The EU and Japan
In the EU post the latest “patch up the economy initiatives”, the situation is again deteriorating. Spanish and Italian 10Y Bond yields
have moved above 6%. There is potential both of these large economies could require a bailout if yields on the 10Y move above 7%.
Looking at selected debt to GDP levels we see the following: Greece 130%, Italy 118.1%, Ireland 94.2%, France 83.5%, Portugal
83.2%, Germany 78.8%, UK 76.5% and Australia 22%. The key point here is that the two major powers in the EU, Germany and
France are not actually that well positioned to be picking up increased exposure risks to the EU periphery. If they have to bailout
Spain or Italy they will likely place their own economies at risk. The market has woken up to this fact and has pushed French, Spanish
and Italian CDS spreads to new highs, with German CDS spreads also rising in recent weeks.
However, while the US and EU situation gains most of the press the real risk could come from Japan. Japanese debt to GDP now
stands at 225.8%. If this keeps rising at its current rate it is only a matter of time before the Japanese economy meets major problems.
Because of the structure of the Japanese Bond market a lift in yields could occur almost without warning and be very rapid. The

All information and advice is confi dential and for the private information of the person to whom it is provided and is provided without any responsibility or liability on
any account whatsoever on the part of this fi rm or any member or employee thereof.
MONTHLY STRATEGIC OUTLOOK 5
country does have a strong trade position, however running debt to GDP levels this high means yields do not have to lift greatly to
present servicing diffi culties. The Japanese 10Y Bond yield is, at the time of writing 1.02%. This is extremely low for the risk Bond
holders are taking.
US banks – “Do as I do, not as I say”
Arguably, the major US banks are best positioned to assess the fi nancial situation and so it is important to watch what they do, rather
than what they say. The major US commercial banks are consistent in one area; they continue to rapidly lift Excess Reserves with the
Federal Reserve banks, these recently nearing US$1.6 trillion.
It is hard to believe these actions are a vote of confi dence in the
future, given this money earns 0.25% per annum and the normal
level of Excess Reserves is zero.
It is evident that there is very little confi dence within the US
banking system, and few places where banks feel confi dent
enough to operate and believe they can receive a return greater
than 0.25% per annum.
Forewarned is forearmed
While the above may sound foreboding it is important to
understand “nothing is written.” We remind clients that risk
is defi ned by position size in the market relative to the whole
portfolio and across the full asset base. It is very important in
these types of markets to assess the level of portfolio exposure to
the market and to be holding appropriate levels of cash refl ective
of background risks.
Our role is not to shy away from what we see as the economic truth, but to tell that truth without bias so that when investing a client
is doing so with the full facts, be they palatable or not. It is about informed decision making and sometimes this makes it necessary
to focus on the downside risks, because we know the upside can take care of itself. Adjust portfolios for more diffi cult times ahead,
and to take advantage of opportunities as they are presented in what is set to continue to be a challenging future.
The ASX market is at trading range base lows around XAO 4200. We are currently Neutral/Bearish on the market. However, would
move fully Bearish on a clear break below 4200, as this would represent a failure of the 24 month established trading range.
We hold a view to lighten on any bounce in the intermediate downtrend until Italian (10Y 6.18%) and Spanish (10Y 6.25%) Bond yields
reduce below 6%. If yields move into the 7% range this will increase the probability the world will enter GFC2.
At the moment the stock market is factoring in a deterioration in background sovereign risks, and a decline in US economic numbers.
Also confi dence has been damaged by the poor performance of politicians to manage the problems. However, the US will get its
additional debt money, and at this stage we do not have a structural failure in the credit markets that cannot be at least held back for
a while longer. However, this could change in future, hence our close watching of US, EU and Japanese Bonds and CDS. Thus, the
situation is still vanilla and not fully structural, just yet.
Terms used
Bonds A method of raising debt capital. As Bond prices rise, yields fall and vice versa.
Credit Default Swaps A derivative designed to “insure” against Bond default.
Derivative A fi nancial product deriving its value from a base asset.
OTC DerivativeA derivative product traded in the Over the Counter market, rather than through a central clearing house, and thus
facing counterparty risk.
Reserves Federal Reserve required minimum bank holdings for risk control and monetary policy adjustment.
Synthetic A product derived from another eg. CDS
Vanilla A plain structure, such as seen in base assets eg. Bonds.

All information and advice is confi dential and for the private information of the person to whom it is provided and is provided without any responsibility or liability on
any account whatsoever on the part of this fi rm or any member or employee thereof.
MONTHLY STRATEGIC OUTLOOK 6
MARKET STRATEGY:
August 2011: Market – Neutral/Bearish. The All Ordinaries (XAO) is testing 4200 base support. We would move to fully Bearish on
a clear break of 4200, a sign the 24 month trading range has failed to the downside. The global economy is slowing, and sovereign
debt and credit market risks are rising. The Australian economy is slowing on fl ood, interest rate, government performance, and
dollar pressures. The pace of US economic growth, US/Japanese/EU Bond risk, and Chinese liquidity/infl ation are focus issues. The
US economy is slowing down, with a recent increase in unemployment to 9.2%, housing entering a double dip, and manufacturing
slowing. Excess Reserves continue to rise rapidly, and the credit markets, particularly in real estate, remain very weak. Structural
sovereign and fi nancial risks remain in the global economy. US, EU, UK and Japanese monetary policy is set at very stimulatory
levels in an effort to lift demand and reduce defl ationary expectations. Defl ation risk is abating, with infl ation pressures in some
countries pressuring interest rates against a reasonably slow growth environment. The stock market is currently an interplay
between central bank refl ation efforts in developed countries, infl ation pressures in emerging countries fl owing over to some
developed countries, mixed economic data, background structural debt risk, currency dynamics, and cashed up companies.
Despite recent bailout and support efforts, EU CDS spreads remain high, suggesting stress in the EU sovereign Bond markets. We
see the probability of a second US technical recession (defi ned by two quarters of negative growth) at 50% in 2012. A recession
could be avoided by periodic, additional or extended fi scal stimulus and monetary measures. Pressures such as high sovereign
debt levels, high Crude oil prices and rising infl ation increase the probability of a stagfl ation scenario. The fi nancial structural
risks of 2007/08 are partly reduced by implicit government guarantees. However, sovereign fi nancial risks, particularly related to
sovereign Bond markets remain very high. The market is likely to be signifi cantly infl uenced by ongoing central bank activity. We
see the market as prone to both sharp falls and short lived sharp upside corrections. The twelve month technical target is 4900.
Key theme 12-Month view Primary risks Technical (XAO 4200)
The market is likely to long term
range trade suggesting the need
to recycle dividends, time, and
trade positions. A specifi c stock
focus is recommended. The
market is testing range lows.
Neutral/Bearish Sovereign credit risk and fi nancial
structural pressuresSupport Resistance
Bond Yield/Interest rate increases
relative to growth rate
Near: 4200
Medium: 4000
Base: 3080
Near: 4300
Medium: 4400
Primary:
4500/5200
1- Month view US employment and housing
pressures
Neutral/Bearish Rising infl ation/stagfl ation
Neutral capital gains in a cyclical
ranging market
SECTOR WEIGHTING COMMENT
Consumer
Discretionary
Under weight Successive interest rate lifts and a weaker housing outlook have started to take some of the edge
off the sector outlook. We are Index weight on a view successive interest rate rises and background
global economic risks increase the probability of margin pressures and consumers becoming less
inclined to spend. Technically the sector has broken downside support.
Consumer Staples Index weight More defensive than the Consumer Discretionary sector. Technically the sector is trading on base
support.
Energy Index weight The longer-term outlook for energy remains positive. The oil price continues to be heavily infl uenced
by OPEC, however is partly trading in line with the S&P500 refl ecting the global growth outlook.
Middle East and Northern African risk is oil price supportive. Technically the sector has broken below
base support.
Financials Under weight Tight credit markets, margin contraction and loan book risks are negatives for the sector. However,
a rising interest rate environment coupled with enhanced market share for the big four are sector
positives in the medium term. Margin pressure, combined with a slight cooling in the Australian
property sector are primary infl uencing factors in the market at the moment. Technically the sector
has broken below base support.
Healthcare Index weight Expected to benefi t long-term by the aging population and government support. The sector has
broken below base support..
Industrials Index weight A stronger Australian dollar will hamper exports for some companies. Slower offshore demand will
also drag. The sector is trading towards base support.
Information
Technology
Index weight The Information Technology Index is stock specifi c. Technically the sector is trading just below its
base having broken support.
Materials Index weight China is continuing to signifi cantly drive metal demand. However, the country is currently trying to
slow its economy due to rising infl ation and property price risks. Chinese efforts to slow its economy
remains the primary short term risk. Technically the sector has broken below support.

All information and advice is confi dential and for the private information of the person to whom it is provided and is provided without any responsibility or liability on
any account whatsoever on the part of this fi rm or any member or employee thereof.
MONTHLY STRATEGIC OUTLOOK 7
SECTOR WEIGHTING COMMENT
Property Trusts Index weight We believe the worst for the sector is behind us and the majority of ASX 200 REITs are in good
health and well set for the next upturn. Outside the ASX 200 investors still need to be cautious and
selective, given many of these trusts have not recapitalised. We like the sector as a long term four
year play for recovery with a good yield in the interim. The sector is trading below long term range
support.
Telecommunications Index weight The sector has regulatory, competitive and technological change pressures. Diffi culty predicting
forward earnings adds sector risk. Technically the sector is trading lower off resistance.
Utilities Index weight Many stocks in the Utilities sector are moving to more vanilla models and so the sector is in the midst
of structural change. This is adding sector risk. Avoid stocks with excess leverage and refi nancing risk.
Technically the sector has bounced down strongly from resistance and is now mid range.

MONDAY 20 APRIL 2009
All information and advice is confi dential and for the private information of the person to whom it is provided and is provided without any responsibility or liability on
any account whatsoever on the part of this fi rm or any member or employee thereof.
MONTHLY STRATEGIC OUTLOOK 8
Higher than expected June 2011 quarter CPI disperses interest rate doves for a time
The June 2011 quarter CPI was above expectations, with the quarterly increase, 0.9% on both a headline and underlying basis, up
on consensus forecasts of 0.7%. The gain was broad-based with nine of the CPI’s 11 groupings advancing in the quarter. The annual
(that is, June-on-June) increase in the headline number was 3.6%, while from an underlying perspective, both the Trimmed Mean and
Trimmed Median measures rose by 2.7%. Key drivers behind the second quarter increment were fruit (+26.9% - A seasonal/weather-
driven spike that will pass), auto fuel (+4.0%) and hospital/medical (+3.4%). There was however a drop in the audio/visual segment,
helped by currency effects and softer retailer conditions. All up though, those hoping for a material offset in price pressures due to
the rising A$ would be a little disappointed by the latest CPI release. The electricity component was lower, but realistically this retreat
is unlikely to be long-lived!
Clearly talk of near-term rate reductions by some economists looks to be overdone at this stage. Indeed, some economists argued
that with infl ationary expectations trending higher (helped by stronger wage outcomes in “hot” sectors and rising commodity
prices) the RBA was becoming concerned about cost pressures. To this must be added the potential for price increases out of policy
initiatives like the carbon trading scheme. On the latter issue, we remain sceptical that the assumption that any shift in prices linked
to our planned emissions trading scheme will be one-off in nature. Concern over price pressures lessened during the early part of
August as several lower than expected economic indicators, including retail sales and building approvals, got some investors thinking
cuts again. RBA happy to sit pat for now – and for a time down the track
Tony Farnham - Economist
COST PRESSURES APPARENT, BUT RBA SITS PAT, TRIMS GDP GROWTH EXPECTATIONS
AUGUST 2011
Australian Outlook
Trimmed Mean (Underlying) CPI Surprises on the Upside...
0.0
0.2
0.4
0.6
0.8
1.0
1.2
1.4
Jun-0
3
Jun-0
4
Jun-0
5
Jun-0
6
Jun-0
7
Jun-0
8
Jun-0
9
Jun-1
0
Jun-1
1
QoQ % Chg
0.0
1.0
2.0
3.0
4.0
5.0YoY % Chg
QoQ (LHS) YoY (RHS)
… Prompting Momentary Upshift in Aussie Bank Bills Curve
4.7
4.8
4.9
5.0
5.1
5.2
1 M
th
2 M
th
3 M
th
4 M
th
5 M
th
6 M
th
% pa
Early Jun-11Early Jul-11Jul-11 (Post CPI)Early Aug-11
Source: ABS, Patersons Research Source: Bloomberg, Patersons Research
The RBA’s benchmark interest rate was left unchanged at 4.75% at the August RBA board meeting. The bank was at pains to
point out that it was appropriate at the current time for monetary policy to exert a degree of restraint. At the same time though
it conceded that a myriad of uncertainties in global fi nancial markets over recent weeks had put the kibosh on any rate hike at the
August gathering. This has left us in a holding pattern, with the bank continuing to “assess carefully the evolving outlook for growth
and infl ation”.
The bank gave due regard to the bearishness pervading the global economy at the current time. It conceded that global growth
had slowed over the middle part of calendar 2011, helped by worsening fi scal-related dramas in both the US and Europe. The supply
dislocations fl owing from Japan’s Great Eastern earthquake earlier in the year lingered. While there was some evidence that the latter
growth impediment was at last abating, any recovery in the Japanese economy is still expected to be a gradual affair.
On the upside though, the all-important Chinese economy has to date only experienced a mild slow-down, despite concerted
efforts by authorities there to take the hurt out of cost pressures. This task has been ably assisted by some reductions in commodity
prices. Largely on the back of this robust growth in emerging Asia – India is also still powering ahead – the RBA still expects world
GDP growth to be at or above its long-term average over the next couple of years.

All information and advice is confi dential and for the private information of the person to whom it is provided and is provided without any responsibility or liability on
any account whatsoever on the part of this fi rm or any member or employee thereof.
MONTHLY STRATEGIC OUTLOOK 9
Despite the abovementioned modest falls in commodity prices, Australia’s terms of trade remain high, to the benefi t of our external
sector performance. This has in turn fuelled (1) a good uplift in resources-oriented business investment levels and (2) ongoing growth
in Australia’s national income. The ramp up in coal production in the aftermath of the Queensland fl oods continues – a point
highlighted in the recently released June ABS trade data - but any return to more normal levels is now not expected until early next
year.
But other parts of the domestic economy remain, in relative terms, subdued. The crucial households sector continues to ultra
cautious while the high A$ has provided a drag to profi tability in sectors subject to import competition. In the fi nancial sector, bank
credit growth has softened over recent months and is very subdued by historical standards, even with evidence of greater willingness
to lend – which goes to prove that you can lead a horse to water but you can not make it drink! Most asset prices, including housing-
related ones, have also softened over recent months, a view reinforced by the June quarter ABS house price series.
This consumer cautiousness has occurred despite still reasonable growth in employment that has kept the Australian jobless rate
around 5%. Some skills shortages are discernible, although these are still confi ned to the resources and related sectors. At the
same time, wages growth has returned to levels seen prior to our Global Financial Crisis-related economic slowdown, while our
productivity performance remains sub-optimal.
With regard to cost pressures, the RBA warned that price measures that give a better indication of the trend in infl ation have begun
to rise over the past six months, after declining for the previous two years. While these measures have, to date, remained consistent
with the 2–3% target on a year-ended basis, the RBA is clearly concerned about the medium-term outlook for infl ation – this is an
unambiguous warning for the Gillard Federal government, the gatekeeper of fi scal and wages policy, to keep these two policy arms
under appropriate control!
The RBA downgrades its medium-term GDP growth forecasts
RBA-compiled medium-term growth projections contained in the recently released August 2011 Statement on Monetary Policy were
shy of those accompanying the May release. This refl ects recognition by RBA economists that the increased frugality of Australian
consumers and economic uncertainty created by tax measures and the high A$ have clipped prior growth dynamics. As the table
below shows, real GDP growth in calendar 2011 is now forecast to be around trend (the year average fi gure is projected to be below
trend at around 2.0%). In the out-years though, our economic growth rate is still expected to be at trend or higher, on the caveat of
continued respectable global growth.
From a costs perspective, the underlying CPI rate is forecast to push above 3.0% in late calendar 2011. This projection explains the
RBA’s current cautious stance on monetary policy despite the near-term downside to our growth prospects. The second uptick in
underlying CPI in FY13 is explained by the planned introduction of the Gillard government carbon tax/emissions trading scheme, the
price effects of which are assumed to be temporary (this could be a brave call!)
Shifts in RBA Statement on Monetary Policy Economic Forecasts
Dec-10 Jun-11 Dec-11 Jun-12 Dec-12 Jun-13 Dec-13
August 2011 S on MP 2.70 1.25 3.25 4.50 3.75 3.75 3.75May 2011 S on MP 2.70 2.50 4.25 4.25 3.75 3.75 3.75
Change 0.00 -1.25 -1.00 0.25 0.00 0.00 0.00
Dec-10 Jun-11 Dec-11 Jun-12 Dec-12 Jun-13 Dec-13
August 2011 S on MP 2.25 2.75 3.25 3.00 3.25 3.25 3.25May 2011 S on MP 2.25 2.50 3.00 3.00 3.00 3.00 3.25
Change 0.00 0.25 0.25 0.00 0.25 0.25 0.00
Source: August 2011 and May 2011 RBA Statements on Monetary Policy
Underlying Inflation (% change over year ended)
GDP (% change over year ended)

MONDAY 20 APRIL 2009
All information and advice is confi dential and for the private information of the person to whom it is provided and is provided without any responsibility or liability on
any account whatsoever on the part of this fi rm or any member or employee thereof.
MONTHLY STRATEGIC OUTLOOK 10
To understand where we are in the market cycle, let us take a
look at the All Ordinaries Index on a much longer time horizon.
The chart below displays the Index on a log scale so that recent
market movements can be compared with those in history.
Since 1936, the average capital gain on the share market is 5.8%
per annum. There have been 3 signifi cant bear markets lasting
four or more years over this time period. Although secular bear
markets may appear daunting at fi rst glance, investors should
not avoid the market during this extended period otherwise
they will miss out on opportunities presented by aggressive bull
markets within the secular trend (as witnessed from 2009 to
2010).
During the 2011 fi nancial year, the Australian sharemarket has signifi cantly underperformed its US counterpart, returning -2.6%
compared to the S&P500 Index return of 28%. There are a number of reasons for this. First and foremost, earnings forecasts for
Australian companies have been in decline over the year. In fact, 2011 forecasts have been revised down by 15%, while earnings
have being trending upward in the US. Other reasons include quantitative easing in the US (which has artifi cially infl ated prices),
the introduction of fl awed government policies such as the carbon tax, rising interest rates (in an effort to control infl ation caused
by rising global commodity and energy prices), and weak consumer and business sentiment. Unfortunately restrictive monetary
policies, designed to slow down the booming resources sector, also affect the struggling industrials which have also been victims of
the high AUD. Economic conditions have deteriorated. Infl ation has come in above expectations. NAB business surveys show a trend
in weakening profi tability. Building approvals fell 3.5% in June. Car sales dropped by 1.7% in July. Unemployment has risen among the
non-mining sectors. Over the fi nancial year, retail spending grew by 2.6%, the weakest growth since the early 1960s. Evidence of the
two speed nature of the economy emerged with recent trade fi gures. Consumer imports fell 0.6% while imports of capital goods such
as mining equipment rose 7.3%. These macroeconomic developments point to further earnings downgrades in the industrials sector
for the 2012 fi nancial year. The following chart compares the trend in earnings against stock prices since 1999. The deterioration
in earnings over the last 16 months points to an environment of rising cost pressures without the corresponding increase in top
line revenue. This environment is commonly known as a secular bear market – a very long period of fl at or falling equity markets
punctuated by a series of bull/ bear market cycles. It is now very likely that we have entered a bear market cycle (beginning in April
2011) within the secular bear market which can last up to 6 years. Markets will need to fully digest the consequences of what initiated
the secular bear in the fi rst place – the liquidity crunch and ramifi cations of short term remedies via quantitative easing and fi scal
policies (raising of the US debt ceiling, Greece bailouts). The chart below also shows that a turnaround in earnings forecasts can lag
the market reversal by up to 6 months.
Kien Trinh - Quantitative Analyst
HIGH EARNINGS RISK PRESENT OVER REPORTING SEASON
AUGUST 2011
Quantitative Focus
EARNINGS FORECASTS VS SHARE PRICES
2000
2500
3000
3500
4000
4500
5000
5500
6000
6500
7000
FY99
FY00
FY01
FY02
FY03
FY04
FY05
FY06
FY07
FY08
FY09
FY10
FY11
FY12
10
15
20
25
30
35
40
45
50
55
60
ALL ORDINARIES (LHS) EPS FORECASTS (RHS)
LAG
-1.0
0.0
1.0
2.0
3.0
4.0
5.0
1936
1938
1940
1942
1944
1946
1948
1950
1952
1954
1956
1958
1960
1962
1964
1966
1968
1970
1972
1974
1976
1978
1980
1982
1984
1986
1988
1990
1992
1994
1996
1998
2000
2002
2004
2006
2008
2010
LOG SCALEALL ORDINARIES INDEX
SECULAR BEAR MARKETS IN AUSTRALIAN HISTORY

All information and advice is confi dential and for the private information of the person to whom it is provided and is provided without any responsibility or liability on
any account whatsoever on the part of this fi rm or any member or employee thereof.
MONTHLY STRATEGIC OUTLOOK 11
Given the diffi cult macroeconomic backdrop, it is not surprising that the historical trend in positive earnings surprises has been
coming down. In the 1H11 reporting season, positive surprises were on par with negative surprises at 24%. The sectors that are
predominantly affected by negative surprises in this environment include media, retailing, steel, transportation, insurance, diversifi ed
fi nancials, and building materials. On the other hand, sectors that are most likely to surprise on the upside are telecoms, banks,
mining, mining services, packaging, property and healthcare. Company executives have learned over time that if they provide
modest earnings guidance, then beat or meet expectations, their management and company performance looks much better.
Hence, there is an increasing trend for companies to revise their earnings guidance prior to reporting season. Companies that have
provided downgrades to guidance recently include OGC, MQG, WES, MBN, MCC, PNA, HVN, RSG, DJS, MRE, KZL, QAN, ABC,
BKW, MMX, PPX, TPI, QAN, GUD, APN, WOR, PPT, TAH and TEN. Those that have inferred upgrades to earnings guidance are
LEI, KMD, SBM, WHC, ORI, OSH, STO, NCM, WOW, WSA, OZL, FLT, FMG, ILU, NUF, ERA, BKN, MAH, SDL, FWD, and SGM
A key theme this reporting season is the effect of the strong AUD on companies with overseas earnings. Investors should pay
attention to the translation effect of the currency on companies that are negatively impacted. These include PPX, BSL, OST, IPL,
ALL, JHX, QBE, CTX, CSR, SGM, RMD, ANN, CSL, COH, NWS, WOR, BBG, and BLD. Resource companies that are most at risk
from diverging movements between commodity prices and the AUD are GBG, MGX, ERA, PAN, OZL, WSA, FMG, AGO, GCL,
MCC, AQA, and ILU.
A signifi cant amount of earnings risk appears to have been factored into the share prices. Companies that are able to report a
stabilisation in earnings in the second half and provide upbeat guidance for 2012 will be strong outperformers. Rebuilding efforts
from the QLD fl oods and Japan natural disasters is expected to assist near term profi t growth, especially for contractors and coal
companies. Stocks to look out for are TLS, BOQ, GWA, FWD, IPL, BKN, MAH, TRS, DOW, MGR, DXS, GPT, SGP, CHC, JBH, WTF,
CPU, COH, CSL, RMD, UGL, CTX, ORG, STO, TOL, AGK, PRY, SMX, WOR and ALL.
Our quant team has identifi ed companies with a history of positive earnings surprises and price reactions post result announcements.
Stocks that have strong track records of meeting expectations or positively surprising the market over the reporting season are ORI,
FXJ, CCL, MGR, RHC, CSL, GPT, UGL, MND, WOW, CGF, NCM, TRS, FWD, SEK, JBH, ANN, BLD, BKN and SAI. Industrial stocks
which have a history of disappointing the market over the reporting season include IAG, APN, PRY, GFF, BSL, QBE, AUN, COF,
SWM, HST, VBA, TPI, SUN, BBG, NUF and ELD.
POSITIVE EARNINGS SURPRISE NEGATIVE EARNINGS SURPRISE
No Code Earnings
Surprise
(%)
Earnings
Delivery
(%)
Earnings
Uncert.
(%)
Price
Reaction
3-Mth
Earnings
Revision
No Code Earnings
Surprise
(%)
Earnings
Delivery
(%)
Earnings
Uncert.
(%)
Price
Reaction
3-Mth
Earnings
Revision
1 ORI 75.0 100.0 3.5 1.00 -1.4 1 AWE 12.4 13.3 196.3 0.33 -38.8
2 FXJ 61.5 100.0 5.9 0.90 -11.4 2 GBG 0.0 20.0 91.0 0.38 -17.8
3 CCL 34.3 100.0 1.4 0.81 -1.8 3 IAG 1.1 26.4 14.9 0.48 -2.2
4 WBC 42.2 97.8 5.8 0.52 0.3 4 ROC 27.6 27.6 104.5 0.33 13.4
5 CSL 58.2 96.7 7.0 0.48 -2.8 5 APN 1.1 28.6 11.4 0.29 -13.4
6 MAH 38.2 96.4 24.4 0.62 2.2 66 AWC 19.8 29.7 27.6 0.19 -13.0
7 LLC 39.6 95.6 8.8 0.38 0.7 7 MMX 30.0 30.0 60.4 0.28 -38.0
8 NAB 93.3 95.6 3.9 0.29 1.3 8 PRY 22.8 30.1 10.2 0.10 0.0
9 MGR 42.5 94.8 1.8 0.71 -0.6 9 GFF 10.9 30.9 7.4 0.38 -2.4
10 RHC 50.9 94.2 6.1 0.67 0.9 10 TAP 14.3 33.3 395.9 0.25 -38.5
11 ALL 49.5 93.3 5.4 0.67 -15.1 11 BSL 26.4 34.1 23.5 0.52 -31.3
12 GPT 50.3 92.4 1.6 0.86 -0.3 12 QBE 9.5 34.3 9.8 0.38 -3.4
13 CTX 49.5 92.3 23.4 0.76 -14.8 13 PBG 15.4 34.6 72.3 0.24 -9.3
14 UGL 53.8 92.3 3.1 0.71 -0.4 14 PDN 15.6 35.6 127.3 0.14 -29.0
15 MND 70.9 90.9 3.2 0.67 -0.8 15 KZL 22.2 36.1 45.3 0.29 -25.8
16 WOW 24.2 90.1 1.1 0.86 -0.9 16 KCN 37.8 37.8 33.4 0.36 -13.7
17 CGF 27.3 89.1 8.6 0.71 -0.5 17 AUN 39.6 41.8 21.5 0.43 -0.9
18 DJS 21.0 88.6 3.1 0.62 -14.8 18 SFH 25.5 41.8 5.3 0.39 -32.0
19 NCM 50.9 87.1 5.9 0.71 -10.5 19 COF 17.9 42.9 26.2 0.33 -2.8
20 MQG 33.3 86.7 8.1 0.81 -15.4 20 ERA 43.4 50.7 261.6 0.71 -72.0
Source: Patersons Quant: NB: Price Reaction is the probability of a price rise after a result announcement.

MONDAY 20 APRIL 2009
All information and advice is confi dential and for the private information of the person to whom it is provided and is provided without any responsibility or liability on
any account whatsoever on the part of this fi rm or any member or employee thereof.
MONTHLY STRATEGIC OUTLOOK 12
AUGUST 2011
Banks
Tony Farnham - Economist
THE END-JUNE BANK SECTOR REPORTING CYCLE BECKONS
All of the Big-4 Australian banks are soon to provide profi t and/or trading updates
The next bank reporting cycle is close at hand, with Commonwealth Bank of Australia (CBA), Bendigo & Adelaide Bank (BEN) and
Suncorp Group (SUN) all set to announce year ended June results over August. The remaining three major Australian banks will issue
fi scal third quarter trading updates.
The following table shows key dates for Australian banks reporting over the month of August.
Result Announced Ex-Div Record Date PayableBEN FY11 8-Aug 29-Aug 2-Sep 30-SepCBA FY11 10-Aug 15-Aug 19-Aug 6-OctSUN FY11 24-Aug 29-Aug 2-Sep 3-OctUpcoming Bank Trading UpdatesNAB 3Q11 9-Aug na na naWBC 3Q11 16-Aug na na naANZ 3Q11 19-Aug na na na
Upcoming Bank Reporting Dates
Source: Various bank announcements/websites
What are the broad themes expected in these results?
Muted growth in loan books will be a key thematic of the profi t/trading update announcements to be released over August. This
refl ects (1) consumer cautiousness, which has been a defi nitive growth impediment in the personal and housing market segments
and (2) a raft of domestic and global uncertainties that are currently impacting demand for funds by our ex-mining corporate sector.
This drag on net interest income levels has seen a discernible nudging down in bank analysts’ projections for CBA, BEN and SUN FY11
cash earnings – the following table provides a pointer to the cash profi ts and DPS levels likely to be delivered by these three fi nancial
institutions over their 2011 fi scal years.
Cash ProfitFull Year, $B 2H11, cents FY11, cents
BEN 0.33 31.0 61.0CBA 6.877 182.0 314.0SUN 0.614 16.0 31.0Source: Bloomberg, various brokers
DPSUpcoming Bank Results - Cash Earnings & DPS Projections
We anticipate that bad debt expense will be wound back on a FY11-on-FY10 basis. We do however anticipate that bad debt levels will
trend higher between 1H11 and 2H11, as the adverse impact of the early 2011 fl oods, a distinctly two-speed economy (which should
boost SME bad and doubtful debts) and a more recent uptick in mortgage arrears have an effect. This said, banks should remain
comfortable with the overall level of credit quality. At the same time, reduced heat in the domestic deposit market – helped by a
retreat to deposits by cautious investors and the reduced growth in loan books since the RBA wheeled out a series of rate hikes –
should be of benefi t to net interest margin performance. The latter has partially offset the NIM drag provided by increased price
competition in lending markets (particularly the mortgage segment).
Looking to FY12 – muted credit growth but no material blow out in funding costs or bad debt expense
Looking to the following six months or so, the general expectation is that the usually scant trading environment statements will talk
down any chance of a pick up in lending growth, as current nervousness – both here and abroad - persists. The resolution of the US
debt impasse (albeit temporary!) and signs that Chinese economic growth remains robust should help bolster lending growth, but
this recovery process will be a gradual affair.

All information and advice is confi dential and for the private information of the person to whom it is provided and is provided without any responsibility or liability on
any account whatsoever on the part of this fi rm or any member or employee thereof.
MONTHLY STRATEGIC OUTLOOK 13
HIGHLIGHTED STOCKS
SECTOR WEIGHTING Under Weight
COMPANY RECOMMENDATION COMMENT
Westpac Banking
Corporation (WBC)
BUY Cash NPAT of $3.2bn for 1H11 was 7% higher than 1H10 and in line with our expectations.
The jump in profi ts was primarily due to the 47% reduction in bad debts from $0.9bn
to $0.5bn. Operating revenue declined 1% on pcp, but was up a modest 2% on pp. The
key retail banking operations of Westpac and St George underpinned group performance,
generating 48% of 1H11 cash NPAT. 1H11 net interest margins improved 4bps on 2H10 to
2.21%, but were 5bps lower than 1H10. Statutory NPAT was up 38% to $4.0bn.
Commonwealth Bank
of Australia (CBA)
ACCUM CBA reported 3Q11 cash NPAT of $1.7bn. CBA’s outlook continues to grow a little
brighter with each result. While operating conditions remain challenging, management’s
commentary and tone were more relaxed than at the interim result, which itself had a less
cautious outlook statement than the FY10 result.
On the assumption that Australia’s FY12 sees economic growth is around 3.0% plus annual CPI growth of around 2.5-3.0%, private
sector credit growth of 5-6% looks likely. The stronger than expected September quarter CPI has thrown a spanner in the works,
although talk of another monetary policy tightening before 2011 is out remains unlikely. Were rate hike expectations to rise, personal
and housing loan activity would remain subdued. At this stage, we would be surprised if the RBA adjusts one way or another before
the November board meeting (the fi rst after the release of the September 2011 quarter CPI). Either way, we anticipate that National
Bank (NAB) will continue to be an outperformer from a loan book growth perspective, thanks to its price leadership strategy which
is bequeathing them increased market share.
Some recovery in the NZ operations of our Big-4 Australian banks looks likely – a point reinforced by a relatively upbeat NZ trading
update recently issued by Westpac (WBC). Signs are already apparent that private sector credit growth in the Kiwi economy is on the
rise, helped by the relatively low interest rates currently in place. Aligning with this view, the RBNZ in June hinted that it could soon
tighten monetary policy settings as the economy regained its composure post the early 2011 Christchurch earthquake.
More generally we anticipate that the banks will become more attentive to cost structures, with cost to income ratios to be gradually
wound back over the coming few years.
CBA to get a new CEO in November
CBA recently announced that its long-time CEO Ralph Norris would retire at the end of November. This was perhaps a little earlier
than expected, but nothing to get overly fussed about. The successful BankWest acquisition and a defi nite improvement in consumer
satisfaction levels have been delivered during the incumbent’s watch. Norris is to be replaced by Ian Narev, who has been with the
CBA since May 2007 and is currently head of the bank’s Business & Private Banking arm. While the CEO-elect is well-credentialed,
he has not held a leadership role in the CBA’s all-important Retail Banking operation. The market will be watching closely for
evidence that the current boss of the Retail arm, Ross McEwan (who is well-regarded and was considered another potential internal
candidate for the CEO role) is happy with being passed over. Were he to leave soon (it is a reasonable assumption that he will be
fi elding calls from head-hunters for a time!), the CBA share price could experience some momentary weakness.
Banks now look cheap; CBA and WBC are still our preferred bank exposures
We expect a continuation of the current RBA rates pause. At the same time, the stock market is valuing our banks on the assumption
of modest single-digit expansions in bank loan books and limited scope for a blow out in bad debt experience. This clear evidence
that Australian banks are defi nitely not priced for perfection – forward PEs for our banks now approximate those seen in the GFC,
while prospective FY12 dividend yields are around 6% fully franked – means defi nite value exists. This is especially so for the Big-4,
which have clear advantages over the regionals.
This being the case, increased attention should be paid to which bank can best deliver on cost reductions and/or other competitive
advantages. On the latter front, investors will look more closely at points of difference between our Major-4 banks, inclusive of
ANZ’s Asian push, WBC’s multi brand and Strategic Investment Priorities (SIP) initiatives and the potential fi rst mover advantage
provided by the CBA’s substantial IT program.
We remain unconvinced that NAB’s price leadership strategy, which will likely have NIM (inclusive of funding) ramifi cations over the
medium to longer term. We will be closely monitoring its performance for evidence of any slippage in credit quality and/or increased
stresses on the funding front.
We continue to prefer WBC and CBA We beg to differ with the Buy NAB, Sell WBC skew still evident in bank analyst reports and
consider now a good opportunity to switch from NAB into WBC.
MONDAY 20 APRIL 2009
All information and advice is confi dential and for the private information of the person to whom it is provided and is provided without any responsibility or liability on
any account whatsoever on the part of this fi rm or any member or employee thereof.
MONTHLY STRATEGIC OUTLOOK 14
On 10 July, the Federal Government announced details of the proposed carbon price mechanism as agreed by the Multi Party
Committee on Climate Change. The mechanism proposes a fi xed price carbon tax commencing on 1 July 2012 to operate for 3 years
before transitioning to a cap and trade emissions trading scheme. The fi xed price will commence at $23 per tonne of CO2 equivalent,
indexed at 2.5% in real terms.
There is still a level of uncertainty around the scheme however we can assume Australian coal companies will be charged with 3
additional costs (direct and indirect).
1. Fugitive methane emissions
2. A proposed 6 cent per litre reduction in the diesel fuel excise rebate.
3. Pass through costs on electricity, port and rail charges.
Points 2 & 3 will be borne by the whole mining industry while the fi rst point will be a coal related expense. There has been some
work in quantifying fugitive gas emissions generated from black coal as a by-product of the mining process in recent years. In 2006
a study by the CSIRO estimated that coal mining and handling contributed 3% of Australia’s net greenhouse gas emissions and this
will increase signifi cantly with the estimated increase in coal production.
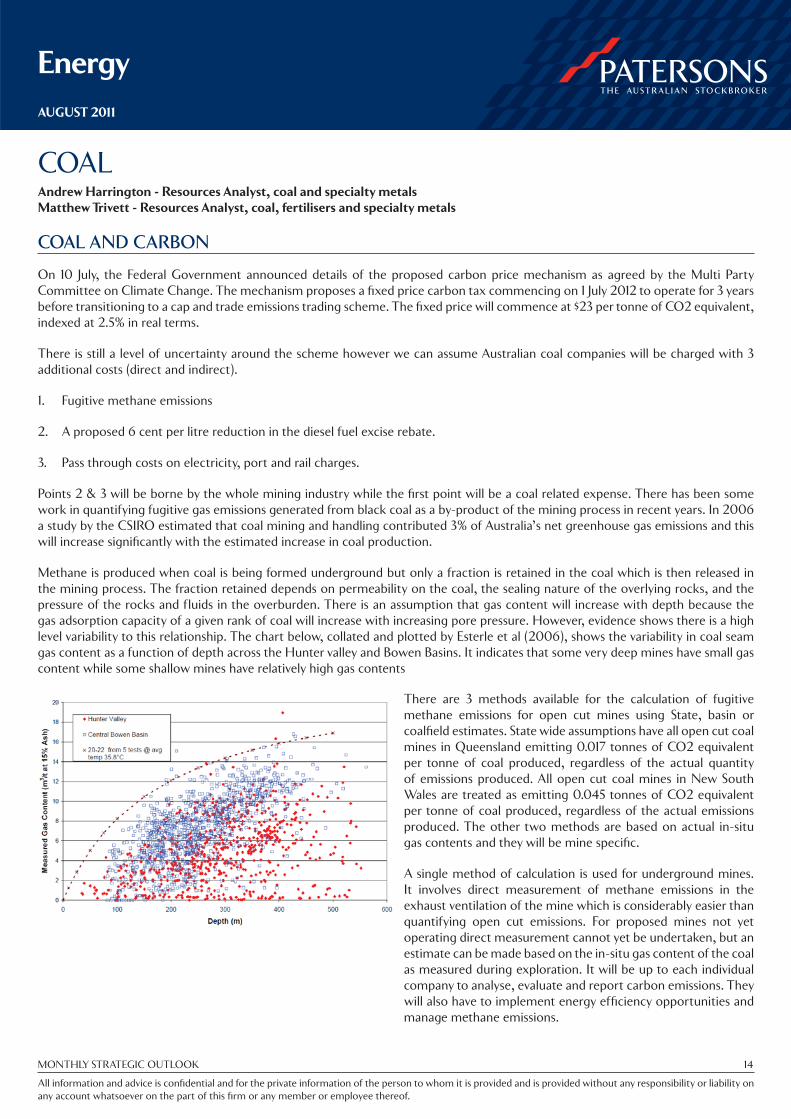
Methane is produced when coal is being formed underground but only a fraction is retained in the coal which is then released in
the mining process. The fraction retained depends on permeability on the coal, the sealing nature of the overlying rocks, and the
pressure of the rocks and fl uids in the overburden. There is an assumption that gas content will increase with depth because the
gas adsorption capacity of a given rank of coal will increase with increasing pore pressure. However, evidence shows there is a high
level variability to this relationship. The chart below, collated and plotted by Esterle et al (2006), shows the variability in coal seam
gas content as a function of depth across the Hunter valley and Bowen Basins. It indicates that some very deep mines have small gas
content while some shallow mines have relatively high gas contents
COALAndrew Harrington - Resources Analyst, coal and specialty metals
Matthew Trivett - Resources Analyst, coal, fertilisers and specialty metals
COAL AND CARBON
AUGUST 2011
Energy
There are 3 methods available for the calculation of fugitive
methane emissions for open cut mines using State, basin or
coalfi eld estimates. State wide assumptions have all open cut coal
mines in Queensland emitting 0.017 tonnes of CO2 equivalent
per tonne of coal produced, regardless of the actual quantity
of emissions produced. All open cut coal mines in New South
Wales are treated as emitting 0.045 tonnes of CO2 equivalent
per tonne of coal produced, regardless of the actual emissions
produced. The other two methods are based on actual in-situ
gas contents and they will be mine specifi c.
A single method of calculation is used for underground mines.
It involves direct measurement of methane emissions in the
exhaust ventilation of the mine which is considerably easier than
quantifying open cut emissions. For proposed mines not yet
operating direct measurement cannot yet be undertaken, but an
estimate can be made based on the in-situ gas content of the coal
as measured during exploration. It will be up to each individual
company to analyse, evaluate and report carbon emissions. They
will also have to implement energy effi ciency opportunities and
manage methane emissions.

All information and advice is confi dential and for the private information of the person to whom it is provided and is provided without any responsibility or liability on
any account whatsoever on the part of this fi rm or any member or employee thereof.
MONTHLY STRATEGIC OUTLOOK 15
HIGHLIGHTED STOCKS
SECTOR WEIGHTING Index Weight
COMPANY RECOMMENDATION COMMENT
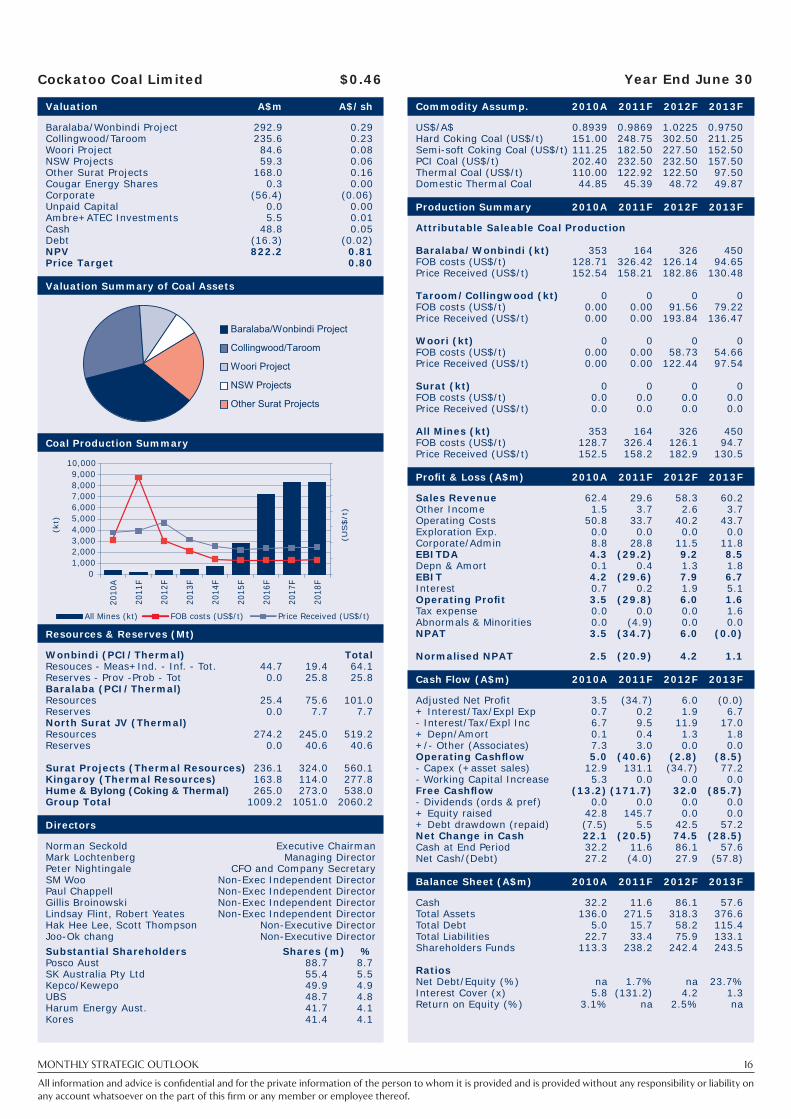
Cockatoo Coal Ltd
(COK)
BUY Mine in production at Baralaba and many other thermal and coking projects in QLD and
NSW. COK has raised capital already and shareholders and JV partners that are very large
coal consumers from Korea and Japan. .
ZYL Ltd (ZYL) BUY ZYL is developing an open cut anthracite project in South Africa. It is fully funded to
production in late 2012 or early 2013. ZYL is lead by a strong management team and it is
only 100km from port with infrastructure available.
The carbon tax will make Australia’s coal industry less competitive in international terms; however the carbon tax imposed on
fugitive emissions will create competitive advantages within the Australian industry. Open cut Queensland producers and developers
will be the least impacted such as Cockatoo Coal (COK) and Bandana (BND) while offshore developers such as ZYL Limited (ZYL)
and Coalspur Mines (CPL) could benefi t once the carbon tax is legislated.
MONTHLY STRATEGIC OUTLOOK 16
All information and advice is confi dential and for the private information of the person to whom it is provided and is provided without any responsibility or liability on
any account whatsoever on the part of this fi rm or any member or employee thereof.
Valuation A$m A$/sh
Baralaba/Wonbindi Project 292.9 0.29 Collingwood/Taroom 235.6 0.23 Woori Project 84.6 0.08 NSW Projects 59.3 0.06 Other Surat Projects 168.0 0.16 Cougar Energy Shares 0.3 0.00 Corporate (56.4) (0.06)Unpaid Capital 0.0 0.00 Ambre+ATEC Investments 5.5 0.01 Cash 48.8 0.05 Debt (16.3) (0.02)NPV 822.2 0.81 Price Target 0.80
Valuation Summary of Coal Assets
Coal Production Summary
Resources & Reserves (Mt)
Wonbindi (PCI/Thermal) TotalResouces - Meas+Ind. - Inf. - Tot. 44.7 19.4 64.1Reserves - Prov -Prob - Tot 0.0 25.8 25.8Baralaba (PCI/Thermal) Resources 25.4 75.6 101.0Reserves 0.0 7.7 7.7North Surat JV (Thermal) Resources 274.2 245.0 519.2Reserves 0.0 40.6 40.6 Surat Projects (Thermal Resources) 236.1 324.0 560.1Kingaroy (Thermal Resources) 163.8 114.0 277.8Hume & Bylong (Coking & Thermal) 265.0 273.0 538.0Group Total 1009.2 1051.0 2060.2
Directors
Norman Seckold Executive ChairmanMark Lochtenberg Managing DirectorPeter Nightingale CFO and Company SecretarySM Woo Non-Exec Independent DirectorPaul Chappell Non-Exec Independent DirectorGillis Broinowski Non-Exec Independent DirectorLindsay Flint, Robert Yeates Non-Exec Independent DirectorHak Hee Lee, Scott Thompson Non-Executive DirectorJoo-Ok chang Non-Executive Director
Substantial Shareholders Shares (m) %Posco Aust 88.7 8.7SK Australia Pty Ltd 55.4 5.5Kepco/Kewepo 49.9 4.9UBS 48.7 4.8Harum Energy Aust. 41.7 4.1Kores 41.4 4.1
Commodity Assump. 2010A 2011F 2012F 2013F
US$/A$ 0.8939 0.9869 1.0225 0.9750Hard Coking Coal (US$/t) 151.00 248.75 302.50 211.25Semi-soft Coking Coal (US$/t) 111.25 182.50 227.50 152.50PCI Coal (US$/t) 202.40 232.50 232.50 157.50Thermal Coal (US$/t) 110.00 122.92 122.50 97.50Domestic Thermal Coal 44.85 45.39 48.72 49.87
Production Summary 2010A 2011F 2012F 2013F
Attributable Saleable Coal Production
Baralaba/Wonbindi (kt) 353 164 326 450FOB costs (US$/t) 128.71 326.42 126.14 94.65Price Received (US$/t) 152.54 158.21 182.86 130.48 Taroom/Collingwood (kt) 0 0 0 0FOB costs (US$/t) 0.00 0.00 91.56 79.22Price Received (US$/t) 0.00 0.00 193.84 136.47 Woori (kt) 0 0 0 0FOB costs (US$/t) 0.00 0.00 58.73 54.66Price Received (US$/t) 0.00 0.00 122.44 97.54 Surat (kt) 0 0 0 0FOB costs (US$/t) 0.0 0.0 0.0 0.0Price Received (US$/t) 0.0 0.0 0.0 0.0 All Mines (kt) 353 164 326 450FOB costs (US$/t) 128.7 326.4 126.1 94.7Price Received (US$/t) 152.5 158.2 182.9 130.5
Profi t & Loss (A$m) 2010A 2011F 2012F 2013F
Sales Revenue 62.4 29.6 58.3 60.2 Other Income 1.5 3.7 2.6 3.7 Operating Costs 50.8 33.7 40.2 43.7 Exploration Exp. 0.0 0.0 0.0 0.0 Corporate/Admin 8.8 28.8 11.5 11.8 EBITDA 4.3 (29.2) 9.2 8.5 Depn & Amort 0.1 0.4 1.3 1.8 EBIT 4.2 (29.6) 7.9 6.7 Interest 0.7 0.2 1.9 5.1 Operating Profi t 3.5 (29.8) 6.0 1.6 Tax expense 0.0 0.0 0.0 1.6 Abnormals & Minorities 0.0 (4.9) 0.0 0.0 NPAT 3.5 (34.7) 6.0 (0.0) Normalised NPAT 2.5 (20.9) 4.2 1.1
Cash Flow (A$m) 2010A 2011F 2012F 2013F
Adjusted Net Profi t 3.5 (34.7) 6.0 (0.0)+ Interest/Tax/Expl Exp 0.7 0.2 1.9 6.7 - Interest/Tax/Expl Inc 6.7 9.5 11.9 17.0 + Depn/Amort 0.1 0.4 1.3 1.8 +/- Other (Associates) 7.3 3.0 0.0 0.0 Operating Cashfl ow 5.0 (40.6) (2.8) (8.5)- Capex (+asset sales) 12.9 131.1 (34.7) 77.2 - Working Capital Increase 5.3 0.0 0.0 0.0 Free Cashfl ow (13.2) (171.7) 32.0 (85.7)- Dividends (ords & pref) 0.0 0.0 0.0 0.0 + Equity raised 42.8 145.7 0.0 0.0 + Debt drawdown (repaid) (7.5) 5.5 42.5 57.2 Net Change in Cash 22.1 (20.5) 74.5 (28.5)Cash at End Period 32.2 11.6 86.1 57.6 Net Cash/(Debt) 27.2 (4.0) 27.9 (57.8)
Balance Sheet (A$m) 2010A 2011F 2012F 2013F
Cash 32.2 11.6 86.1 57.6Total Assets 136.0 271.5 318.3 376.6Total Debt 5.0 15.7 58.2 115.4Total Liabilities 22.7 33.4 75.9 133.1Shareholders Funds 113.3 238.2 242.4 243.5 Ratios Net Debt/Equity (%) na 1.7% na 23.7%Interest Cover (x) 5.8 (131.2) 4.2 1.3Return on Equity (%) 3.1% na 2.5% na
Year End June 30Cockatoo Coal Limited $0.46
Baralaba/Wonbindi Project
Collingwood/Taroom
Woori Project
NSW Projects
Other Surat Projects
(kt)
(US$/t
)
All Mines (kt) FOB costs (US$/t) Price Received (US$/t)
01,0002,0003,0004,0005,0006,0007,0008,0009,000
10,000
2010
A
2011
F
2012
F
2013
F
2014
F
2015
F
2016
F
2017
F
2018
F

MONTHLY STRATEGIC OUTLOOK 17
All information and advice is confi dential and for the private information of the person to whom it is provided and is provided without any responsibility or liability on
any account whatsoever on the part of this fi rm or any member or employee thereof.
Valuation A$m A$/sh
Kangwane 265.0 0.54 Coal Resources 0.0 0.00 FX Hedging 0.0 0.00 Corporate (7.1) (0.01)Unpaid Capital 0.5 0.00 Cash 33.0 0.07 Debt (1.0) (0.00) NPV 290.4 0.59 Price Target 0.60
Coal Sales (equity basis) by coal type
Coal Prodcution Summary
Resources 100% Basis (Mt)
Mine Total Kangwane Resources
Measured 21.4 21.4Indicated 25.5 25.5Inferred 67.2 67.2
Total Resources 114.1
Directors
Name PositionBevan Tarratt ChairmanDr Eric Lilford Managing DirectorMzwandile Nombewu Director of Siyanda ResourcesDavid Greenwood Non-Executive DirectorNicholas Ong Company SecretaryIan Benning Country Director Signifi cant Shareholders Shares (m) %Macquarie Bank 39.7 8.2Sing-Tang 23.9 5.0Mighty River International 21.8 4.5
Commodity Assumptions 2011F 2012F 2013F
US$/A$ 0.9869 1.0225 0.9750Hard Coking Coal 248.75 302.50 211.25Semi-soft Coking Coal 182.50 227.50 152.50PCI 195.00 232.50 157.50Export Thermal Coal 106.00 122.50 97.50Domestic Thermal Coal (A$/t) 45.39 48.72 49.87
Production Summary 2011F 2012F 2013F
Attributable Saleable Coal Production Kangwane (kt) 1 1 408FOB costs (US$/t) 60.91 63.77 56.11Price Received (US$/t) 154.17 191.69 129.97
All Mines (Kt) 1 1 408Cash costs (US$/t) 56.11Price Received (US$/t) 129.97
Profi t & Loss (A$m) 2011F 2012F 2013F
Sales Revenue 0.2 0.2 54.3 Other Income 0.5 1.2 1.0 Operating Costs 0.1 0.1 23.5 Exploration Exp. 0.0 0.0 0.0 Corporate/Admin 1.0 1.2 1.2 EBITDA (0.4) 0.2 30.6 Depn & Amort 0.0 0.0 0.6 EBIT (0.4) 0.2 30.0 Interest 0.1 0.1 0.1 Operating Profi t (0.4) 0.1 29.9 Tax expense 0.0 0.0 9.0 Abnormals + Minorities 0.0 0.0 0.0 NPAT (0.5) 0.1 20.9 Normalised NPAT (0.4) 0.1 20.9
Cash Flow (A$m) 2011F 2012F 2013F
Adjusted Net Profi t (0.5) 0.1 20.9 + Interest/Tax/Expl Exp 0.1 0.1 9.1 - Interest/Tax/Expl Inc 0.5 0.5 9.5 + Depn/Amort 0.0 0.0 0.6 +/- Other (Associates) 0.0 0.0 0.0 Operating Cashfl ow (0.9) (0.3) 21.1 - Capex (+asset sales) 5.2 11.3 2.2 - Working Capital Increase 1.0 0.0 0.0 Free Cashfl ow (7.1) (11.6) 18.9 - Dividends (ords & pref) 0.0 0.0 0.0 + Equity raised 32.8 0.0 0.0 + Debt drawdown (repaid) 1.0 0.0 0.0 Net Change in Cash 26.7 (11.6) 18.9 Cash at End Period 27.9 16.3 35.2 Net Cash/(Debt) 26.9 15.3 34.2
Balance Sheet (A$m) 2011F 2012F 2013F
Cash 27.9 16.3 35.2Total Assets 34.4 34.6 73.3Total Debt 1.0 1.0 1.0Total Liabilities 1.1 1.1 19.0Shareholders Funds 33.3 33.4 54.4 Ratios Net Debt/Equity (%) na naInterest Cover (x) na 3.3 510.8Return on Equity (%) na 0.4% 38.5%
Year End June 30ZYL Limited $0.230
Sale
able
Coal (k
t)
Export Sales Domestic Sales
0
200
400
600
800
1,000
1,200
1,400
2012e 2013e 2014e 2015e 2016e 2017e 2018e 2019e 2020e 2021e
(kt)
(US$/t
)
All Mines (kt) Cash costs (US$/t) Price Received (US$/t)
0
300
600
900
1,200
1,500
2012F
2013F
2014F
2015F
2016F
2017F
2018F
2019F
2020F
2021F
30.00
50.00
70.00
90.00
110.00
130.00
150.00

All information and advice is confi dential and for the private information of the person to whom it is provided and is provided without any responsibility or liability on
any account whatsoever on the part of this fi rm or any member or employee thereof.
MONTHLY STRATEGIC OUTLOOK 18
2011 is proving a very eventful year for early stage Australian shale appraisal, with a number of defi nitive programs getting underway and
increasing interest in our projects from North American companies & investors. Upcoming shale and tight gas appraisal programs include
activities in the Perth Basin, Nappamerri Trough, Canning Basin and activities in a number of basins in Central Australia. The increased
activity is in light of the explosion of successful shale appraisal in the USA and a roll out of exploration globally to secure and appraise
prospective shale plays. Up until 2011, work had consisted of technical/geological studies based on core and logging data, however 2011 has
seen the commencement of a series of planned drill, frac and fl ow test activities, targeting shale formations. The fi rst of these was BPT/
ADE’s recent test of the Holdfast-1 well in the Nappamerri trough which provided some very encouraging initial fl ow results. However one
of the most signifi cant programs in 2011 is set to commence, with TSX listed PetroFrontier’s planned appraisal program getting underway
in the southern Georgian Basin. This will initially include the drilling of two full horizontal appraisal wells drilled into the Arthur Creek shale
horizon followed by multistage fracture stimulation - a fi rst for shale exploration in Australia. CTP holds 6 million acres in the basin and is
therefore highly leveraged to any encouraging results from the planned program. The activity is refl ective of a growing interest in Australia’s
non-conventional resources from Nth American interests which understand the upside from securing early stage non-conventional resource
plays and are willing to carry the early risk capital. This interest includes the entry of PetroFrontier into the southern Georgina Basin, the Hess
farm-in to the Beetaloo Basin, Rodinia’s activities in the Offi cer Basin and the recent ConocoPhillips farm-in to the Canning Basin.
In this space we cover CTP which is highly leveraged to the upcoming PetroFrontier program, ADE which has provided some promising
initial test results from the Cooper Basin and AWE which is set to commence its fi rst frac and fl ow test in the Sep Q in the Perth Basin. While
Australia is at a very early stage of appraisal we believe that several juniors are leveraged to signifi cant potential upside with early catalysts
including the farmout of interest in large acreage positions to signifi cant parties and the results of initial testing programs. In China we also
closely follow SEH’s highly prospective tight gas appraisal project.
Oil was supported at +$95/bbl through the majority of June, with WTI fi nishing the month lower at $US93/bbl. However recent US and
European debt issues together with a fears of slowing economy has sent WTI crude prices lower in early August. The current market price is
inline with our long term oil price assumption of US$95/bbl.The Brent oil premium continues to Siden, with a 2nd August Brent Oil price of
US$116.46 representing a $23/bbl premium.
Our long term view on the oil and gas sector remains unchanged with a focus on profi table oil and gas producers with a solid growth
engine and portfolio of near-term and funded catalysts. We also have a strong focus on quality junior oil and gas explorers which are likely to
generate signifi cant organic growth from the early stage technical work-up and farm-out of prospective acreage in emerging plays.
OIL AND GASScott Simpson - Senior Oil and Gas Analyst
EARLY STAGE AUSTRALIAN SHALE APPRAISAL COULD PROVE A KEY GROWTH SECTOR
HIGHLIGHTED STOCKS
SECTOR WEIGHTING Index Weight
COMPANY RECOMMENDATION COMMENT
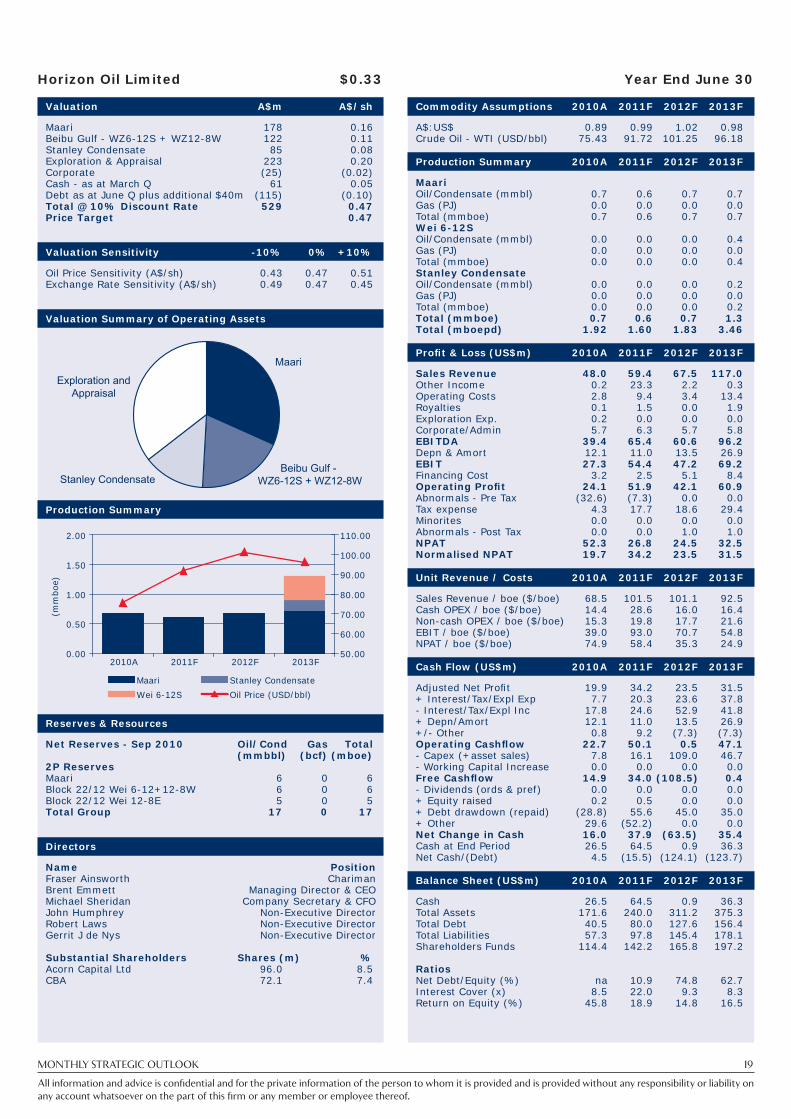
Horizon Oil Ltd
(HZN)
BUY HZN remains our key mid-cap oil producer with a unique portfolio of growth projects. Recent appraisal results in PNG look likely to yield a material increase in recoverable volumes, with maiden reserves estimates due in the coming months. Underpinned by production from its 10% interest in the Maari oilfi eld, HZN is progressing a number of projects which include the Beibu Gulf development, the Stanley Condensate project and further exploration and development of its NZ interests.
Neon Energy Ltd
(NEN)
BUY With a substantial increase in production at NSA, NEN is funded to benefi t from a number of exploration and appraisal opportunities in the USA and in its prospective acreage in Vietnam. Upcoming steam production trials of the 100mmbbls of oil in place at Paris Valley could yield signifi cant value, even at low recoveries. In Vietnam NEN recently completed independent resource assessments across its 2 x blocks by mid-2011 and plans to drill 3 x wells in Q2 2012, subject to ongoing farmout.
Oil Search Ltd (OSH) BUY OSH remains our preferred large-cap oil exposure with upside to be driven by the potential for 2011 Hides development drilling and a targeted farmout of its Papua Gulf area permits to allow for drilling of key targets in 2012. While trains 1 and 2 underpin the current share price, upside is contingent on a 3rd train expansion. OSH plans a “two-pronged strategy” to grow its business which includes exploration and appraisal in the highland region and exploration of resources in the Papua Gulf area. Key catalysts will be the farmout of its Gulf Area and appraisal drilling set to commence in the Highlands in late 2011.
Tap Oil Ltd (TAP) BUY With TAP’s cash generating assets set to deliver a steady cash-fl ow, it is underpinned to meet committed expenditure and targeted growth. The company appears clear in its strategy to become more commercially driven (as evidenced by the successful re-sale of a 25% stake in WA-351) and will focus on Thailand, the Carnarvon Basin and Ghana for growth. Catalysts include 3rd party verifi cation of the volumetrics at Zola-1 and any further news on potential development/commercialisation; exploration drilling in Thailand; further work-up of prospects and potential farmout in Ghana; drilling in WA-351 in early 2012 and a 2011 targetd FID for the Finucane discovery.
MONTHLY STRATEGIC OUTLOOK 19
All information and advice is confi dential and for the private information of the person to whom it is provided and is provided without any responsibility or liability on
any account whatsoever on the part of this fi rm or any member or employee thereof.
Valuation A$m A$/sh
Maari 178 0.16 Beibu Gulf - WZ6-12S + WZ12-8W 122 0.11 Stanley Condensate 85 0.08 Exploration & Appraisal 223 0.20 Corporate (25) (0.02)Cash - as at March Q 61 0.05 Debt as at June Q plus additional $40m (115) (0.10)Total @ 10% Discount Rate 529 0.47 Price Target 0.47
Valuation Sensitivity -10% 0% +10%
Oil Price Sensitivity (A$/sh) 0.43 0.47 0.51 Exchange Rate Sensitivity (A$/sh) 0.49 0.47 0.45
Valuation Summary of Operating Assets
Production Summary
Reserves & Resources
Net Reserves - Sep 2010 Oil/Cond Gas Total (mmbbl) (bcf) (mboe)2P Reserves Maari 6 0 6Block 22/12 Wei 6-12+12-8W 6 0 6Block 22/12 Wei 12-8E 5 0 5Total Group 17 0 17
Directors
Name PositionFraser Ainsworth Chariman Brent Emmett Managing Director & CEOMichael Sheridan Company Secretary & CFOJohn Humphrey Non-Executive DirectorRobert Laws Non-Executive DirectorGerrit J de Nys Non-Executive Director Substantial Shareholders Shares (m) %Acorn Capital Ltd 96.0 8.5CBA 72.1 7.4
Commodity Assumptions 2010A 2011F 2012F 2013F
A$:US$ 0.89 0.99 1.02 0.98Crude Oil - WTI (USD/bbl) 75.43 91.72 101.25 96.18
Production Summary 2010A 2011F 2012F 2013F
Maari Oil/Condensate (mmbl) 0.7 0.6 0.7 0.7Gas (PJ) 0.0 0.0 0.0 0.0Total (mmboe) 0.7 0.6 0.7 0.7Wei 6-12S Oil/Condensate (mmbl) 0.0 0.0 0.0 0.4Gas (PJ) 0.0 0.0 0.0 0.0Total (mmboe) 0.0 0.0 0.0 0.4Stanley Condensate Oil/Condensate (mmbl) 0.0 0.0 0.0 0.2Gas (PJ) 0.0 0.0 0.0 0.0Total (mmboe) 0.0 0.0 0.0 0.2Total (mmboe) 0.7 0.6 0.7 1.3Total (mboepd) 1.92 1.60 1.83 3.46
Profi t & Loss (US$m) 2010A 2011F 2012F 2013F
Sales Revenue 48.0 59.4 67.5 117.0 Other Income 0.2 23.3 2.2 0.3 Operating Costs 2.8 9.4 3.4 13.4 Royalties 0.1 1.5 0.0 1.9 Exploration Exp. 0.2 0.0 0.0 0.0 Corporate/Admin 5.7 6.3 5.7 5.8 EBITDA 39.4 65.4 60.6 96.2 Depn & Amort 12.1 11.0 13.5 26.9 EBIT 27.3 54.4 47.2 69.2 Financing Cost 3.2 2.5 5.1 8.4 Operating Profi t 24.1 51.9 42.1 60.9 Abnormals - Pre Tax (32.6) (7.3) 0.0 0.0 Tax expense 4.3 17.7 18.6 29.4 Minorites 0.0 0.0 0.0 0.0 Abnormals - Post Tax 0.0 0.0 1.0 1.0 NPAT 52.3 26.8 24.5 32.5 Normalised NPAT 19.7 34.2 23.5 31.5
Unit Revenue / Costs 2010A 2011F 2012F 2013F
Sales Revenue / boe ($/boe) 68.5 101.5 101.1 92.5Cash OPEX / boe ($/boe) 14.4 28.6 16.0 16.4Non-cash OPEX / boe ($/boe) 15.3 19.8 17.7 21.6EBIT / boe ($/boe) 39.0 93.0 70.7 54.8 NPAT / boe ($/boe) 74.9 58.4 35.3 24.9
Cash Flow (US$m) 2010A 2011F 2012F 2013F
Adjusted Net Profi t 19.9 34.2 23.5 31.5 + Interest/Tax/Expl Exp 7.7 20.3 23.6 37.8 - Interest/Tax/Expl Inc 17.8 24.6 52.9 41.8 + Depn/Amort 12.1 11.0 13.5 26.9 +/- Other 0.8 9.2 (7.3) (7.3)Operating Cashfl ow 22.7 50.1 0.5 47.1 - Capex (+asset sales) 7.8 16.1 109.0 46.7 - Working Capital Increase 0.0 0.0 0.0 0.0 Free Cashfl ow 14.9 34.0 (108.5) 0.4 - Dividends (ords & pref) 0.0 0.0 0.0 0.0 + Equity raised 0.2 0.5 0.0 0.0 + Debt drawdown (repaid) (28.8) 55.6 45.0 35.0 + Other 29.6 (52.2) 0.0 0.0 Net Change in Cash 16.0 37.9 (63.5) 35.4 Cash at End Period 26.5 64.5 0.9 36.3 Net Cash/(Debt) 4.5 (15.5) (124.1) (123.7)
Balance Sheet (US$m) 2010A 2011F 2012F 2013F
Cash 26.5 64.5 0.9 36.3Total Assets 171.6 240.0 311.2 375.3Total Debt 40.5 80.0 127.6 156.4Total Liabilities 57.3 97.8 145.4 178.1Shareholders Funds 114.4 142.2 165.8 197.2 Ratios Net Debt/Equity (%) na 10.9 74.8 62.7Interest Cover (x) 8.5 22.0 9.3 8.3Return on Equity (%) 45.8 18.9 14.8 16.5
Year End June 30Horizon Oil Limited $0.33
Exploration andAppraisal
Beibu Gulf - WZ6-12S + WZ12-8WStanley Condensate
Maari
(mm
boe)
Maari Stanley Condensate
Wei 6-12S Oil Price (USD/bbl)
0.00
0.50
1.00
1.50
2.00
2010A 2011F 2012F 2013F50.00
60.00
70.00
80.00
90.00
100.00
110.00

MONTHLY STRATEGIC OUTLOOK 20
All information and advice is confi dential and for the private information of the person to whom it is provided and is provided without any responsibility or liability on
any account whatsoever on the part of this fi rm or any member or employee thereof.
Valuation A$m A$/sh
North San Ardo 69 0.15 Exploration & Appraisal 225 0.49 Other 7 0.02 Cash -est 26 0.06 Corporate (9) (0.02)Debt 0 0.00 Total @ 10% Discount Rate 318 0.69 Price Target 0.69
Valuation Sensitivity -10% 0% +10%
Oil Price Sensitivity (A$/sh) 0.66 0.69 0.72 Exchange Rate Sensitivity (A$/sh) 0.71 0.69 0.68
Valuation Summary of Operating Assets
Production Summary
Reserves & Resources
Reserves - Net NEN Oil/Cond Gas Totalas at June 2010 (mmbbl) (bcf) (mboe)2P Reserves North San Ardo 3.8 0.0 3.8Paris Valley 9.1 9.1Total Group 13.0 0.0 13.0
Directors
Name PositionAlan Stein Non-Executive ChairmanKen Charsinsky Managing DirectorJohn Lander Non-Executive Director Substantial Shareholders Shares (m) %BlueGold Global Fund 28.9 15.0
Commodity Assumptions 2010A 2011F 2012F 2013F
A$:US$ 0.89 0.99 1.05 1.00Crude Oil - WTI (USD/bbl) 75.43 91.72 101.25 96.18Crude Oil (Heavy) - Price Received 62.81 73.37 81.00 76.95
Production Summary 2010A 2011F 2012F 2013F
North San Ardo (kbbl) 103 158 245 226Other Total (kbbl) 103 158 245 226North San Ardo (bbl/day) 281.29 431.88 670.25 620.01Other Total (bbl/day) 281 432 670 620
Profi t & Loss (A$m) 2010A 2011F 2012F 2013F
Sales Revenue 7.4 13.6 18.8 17.4 Other Income 0.2 0.0 0.0 0.0 Operating Costs 2.6 2.5 3.5 3.5 Exploration Exp. 0.0 0.3 0.0 0.0 Corporate/Admin 4.3 4.5 3.2 3.3 Royalty 1.5 3.0 4.1 3.8 EBITDA (0.9) 3.3 7.9 6.8 Depn & Amort 1.4 1.9 3.0 2.9 EBIT (2.3) 1.4 5.0 3.9 Interest 0.0 0.0 0.0 0.0 Operating Profi t (2.3) 1.4 5.0 3.9 Tax expense 0.0 0.0 0.0 0.0 Minorites 0.0 0.0 0.0 0.0 FX Adjustment (1.7) (4.7) 0.0 0.0 NPAT (4.0) (3.3) 5.0 3.9 Normalised NPAT (4.0) (3.3) 5.0 3.9
Cash Flow (A$m) 2010A 2011F 2012F 2013F
Adjusted Net Profi t (1.5) 1.4 5.0 3.9 + Interest/Tax/Expl Exp 0.0 0.3 0.0 0.0 - Interest/Tax/Expl Inc 1.3 4.9 3.4 0.0 + Depn/Amort 1.4 1.9 3.0 2.9 +/- Other (1.4) (1.1) 0.0 0.0 Operating Cashfl ow (2.8) (2.4) 4.5 6.8 - Capex (+asset sales) 2.5 3.9 4.9 2.1 - Working Capital Increase 0.0 0.0 0.0 0.0 Free Cashfl ow (5.3) (6.3) (0.3) 4.7 - Dividends (ords & pref) 0.0 0.0 0.0 0.0 + Equity raised 5.3 24.7 0.0 0.0 + Debt drawdown (repaid) (0.1) 0.0 0.0 0.0 + Other (1.5) 5.6 0.0 0.0 Net Change in Cash (1.6) 24.1 (0.3) 4.7 Cash at End Period 1.8 25.8 25.5 30.2 Net Cash/(Debt) 1.8 25.3 25.5 30.2
Balance Sheet (A$m) 2010A 2011F 2012F 2013F
Cash 1.8 25.8 25.5 30.2Total Assets 46.8 68.8 73.7 77.6Total Debt 0.0 0.5 0.0 0.0Total Liabilities 5.2 5.5 5.5 5.4Shareholders Funds 41.6 63.3 68.2 72.2 Ratios Net Debt/Equity (%) na na na naInterest Cover (x) na na na naReturn on Equity (%) na na 7.3 5.4
Year End June 30Neon Energy Limited $0.41
Exploration & Appraisal
Other
Cash - est
North San Ardo
(kbbls
)
North San Ardo (kbbl) Crude Oil (Heavy) - Price Received
0
100
200
300
400
500
2010A 2011F 2012F 2013F0.00
20.00
40.00
60.00
80.00
100.00

MONTHLY STRATEGIC OUTLOOK 21
All information and advice is confi dential and for the private information of the person to whom it is provided and is provided without any responsibility or liability on
any account whatsoever on the part of this fi rm or any member or employee thereof.
Valuation A$m A$/sh
Kutubu 634 0.48 Greater Moran 583 0.44 Gobe Main 4 0.00 SE Gobe 18 0.01 Hides GTE 50 0.04 PNG LNG Trains 1 and 2 7925 5.98 PNG LNG Train 3 1456 1.10 Exploration and Other 818 0.62 Other Costs (299) (0.23)Corporate (150) (0.11)Debt (1242) (0.94)Cash 1144 0.86 Total @ 10% Discount Rate 10941 8.25 Price Target 8.25
Price Target Sensitivity -10% 0% +10%
Oil Price Sensitivity (A$/sh) 7.30 8.25 9.19 Exchange Rate Sensitivity (A$/sh) 9.12 8.25 7.55
Valuation Summary of Operating Assets
Production Summary
Reserves
2P Reserves - Net OSH Totalas at Dec 2010 (mmboe)Kutubu 19.4SE Mananda 0.6Greater Moran 21.5Gobe Main 0.3SE Gobe 0.8Hides 11.3PNG LNG Project 505.4Total Group 559.3
Management
Name PositionPeter Botten Managing DirectorBrian Horwood ChairmanAgu Kantsler Non-Executive DirectorZygmunt Switkowski Non-Executive DirectorMartin Kriewaldt Non-Executive DirectorGerea Aopi Non-Executive DirectorJohn Stitt Non-Executive DirectorRobert Igara Non-Executive DirectorKostas Constantinou Non-Executive Director
Commodity Assumptions 2010A 2011F 2012F 2013F
A$:US$ 0.89 0.99 1.02 0.98Oil Price 79.74 102.56 97.85 97.14
Production Summary (mmboe) 2010A 2011F 2012F 2013F
Kutubu & SE Mananda 3.7 2.9 2.9 2.7Greater Moran 2.63 2.23 2.16 1.96Gobe Main 0.06 0.04 0.04 0.04SE Gobe 0.25 0.20 0.19 0.17Hides GTE 1.03 0.93 0.93 0.93Total 7.7 6.3 6.3 5.8
Profi t & Loss (US$m) 2010A 2011F 2012F 2013F
Sales Revenue 557.0 675.2 542.2 494.0 Other Income 33.4 0.0 0.0 0.0 Opex 87.5 108.4 106.6 98.7 Royalty 9.8 9.4 8.2 7.5Corporate/Admin 16.6 19.0 18.8 17.4 EBITDAX 476.5 538.4 408.6 370.4 Exploration Exp. 131.2 94.4 112.2 0.0 EBITDA 345.3 444.0 296.4 370.4 Depn & Amort 44.7 60.2 59.2 49.6 EBIT 284.9 383.8 237.2 320.8 Interest 7.7 5.0 5.0 5.0 Operating Profi t 277.2 378.8 232.2 315.8 Tax expense 91.6 189.4 116.1 157.9 Minorities 0.0 0.0 0.0 0.0 -FX Adjustment (0.8) 0.0 0.0 0.0 NPAT 184.8 189.4 116.1 157.9 Normalised NPAT 144.1 189.4 116.1 157.9
Cash Flow (US$m) 2010A 2011F 2012F 2013F
Adjusted Net Profi t 185.6 189.4 116.1 157.9 + Interest/Tax/Expl Exp 246.3 288.8 233.3 162.9 - Interest/Tax/Expl Inc 518.1 371.2 350.1 248.9 + Depn/Amort 44.7 60.2 59.2 49.6 +/- Other 46.3 118.9 0.0 0.0 Operating Cashfl ow 4.6 286.1 58.5 121.5 - Capex (+asset sales) 908.7 1311.9 955.1 641.0 - Working Capital Increase 0.0 0.0 0.0 0.0 Free Cashfl ow (904.1) (1025.8) (896.6) (519.6)- Dividends (ords & pref) 33.8 0.0 0.0 0.0 + Equity raised 3.9 0.0 0.0 0.0 + Debt drawdown (repaid) 931.2 817.6 619.2 430.8 + Other (55.7) 0.0 0.0 0.0 + Dividend Reinvestment Plan 33.9 0.0 0.0 0.0 Net Change in Cash (24.5) (208.2) (277.4) (88.7)Cash at End Period 1263.6 1055.4 778.0 689.3 Net Cash/(Debt) 1263.6 (691.9) (1588.5) (2108.0)
Balance Sheet (US$m) 2010A 2011F 2012F 2013F
Cash 1,263.6 1,055.4 778.0 689.3Total Assets 4,288.7 5,461.3 6,236.6 6,736.1Total Debt 929.7 1,747.3 2,366.5 2,797.3Total Liabilities 1,490.2 2,449.2 3,072.6 3,384.4Shareholders Funds 2,798.5 3,012.2 3,164.0 3,351.7 Ratios Net Debt/Equity (%) na 23.0 50.2 62.9Interest Cover (x) 37.1 76.8 47.4 64.2Return on Equity (%) 6.6 6.3 3.7 4.7 Substantial Shareholders Shares (m) %Independent Public Business Corporation 196.6 14.9%The Capital Group Companies, Inc. 164.28 12.4%
Year End December 31Oil Search Limited $6.93
Kutubu
Greater Moran
Gobe Main
SE Gobe
Hides GTE
PNG LNG Trains 1 and 2
PNG LNG Train 3
Exploration and Other
(mm
boe)
Kutubu & SE Mananda Greater Moran Gobe MainSE Gobe Hides GTE Oil Price (USD/bbl)
0.00
1.00
2.00
3.00
4.00
5.00
6.00
7.00
8.00
9.00
2010A 2011F 2012F 2013F45.00
55.00
65.00
75.00
85.00
95.00
105.00
115.00

MONTHLY STRATEGIC OUTLOOK 22
All information and advice is confi dential and for the private information of the person to whom it is provided and is provided without any responsibility or liability on
any account whatsoever on the part of this fi rm or any member or employee thereof.
Year End December 31
Valuation A$m A$/sh
Harriet JV area 32 0.13 Woollybutt 7 0.03 John Brookes GSA 66 0.27 Manora Field 51 0.21 Exploration and Appraisal 122 0.51 Cash - estimate 53 0.22 Corporate (33) (0.14)Other 40 0.17 Total @ 10% Discount Rate 339 1.40 Price Target 1.40
Price Target Sensitivity -10% 0% +10%
Oil Price Sensitivity (A$/sh) 1.38 1.40 1.42 Exchange Rate Sensitivity (A$/sh) 1.42 1.40 1.38
Valuation Summary of Operating Assets
Production Summary
Reserves & Resources
Reserves - as at Dec 2010 Oil/Cond Gas Total (mmbbl) (bcf) (mboe)2P Reserves Harriet JV (est.) 1.1 9.1 2.6Woollybutt 0.2 0.0 0.2Total Group 1.3 9.1 2.8 John Brookes GSA Resource (est.) 0.0 22.0 3.7
Directors
Name PositionNeale Taylor Chariman / Non Exec DirectorTroy Hayden MD and CEOPeter Lane Non Executive DirectorMike Sandy Non Executive DirectorDouglas Bailey Non Executive Director
Commodity Assumptions 2010A 2011F 2012F 2013F
A$:US$ 0.93 1.03 1.01 0.94Crude Oil - WTI (USD/bbl) 79.74 102.56 97.85 97.14Gas Price - contracted ($/GJ) 1.80 1.81 1.84 1.88
Production Summary 2010A 2011F 2012F 2013F
Harriet JV Area (mmboe) 0.91 0.82 0.71 0.62Woollybutt (mmboe) 0.26 0.15 0.05 0.00Total (mmboe) 1.12 0.97 0.76 0.62Harriet JV Area (kboepd) 2.49 2.24 1.94 1.69Woollybutt (kboepd) 0.72 0.40 0.15 0.00Total (kboepd) 3.08 2.65 2.08 1.69
Profi t & Loss (A$m) 2010A 2011F 2012F 2013F
Sales Revenue 71.4 66.8 61.9 55.8 Other Income 5.5 17.9 4.5 3.4 Operating Costs 30.0 19.2 18.3 15.0 Exploration Exp. 70.5 7.9 18.7 15.0 Rolayties 1.2 1.6 1.5 1.4 Corporate/Admin 13.4 7.4 7.6 7.7 EBITDA (38.2) 48.5 20.3 20.1 Depn & Amort 27.8 16.8 13.1 10.6 EBIT (65.9) 31.8 7.2 9.4 Interest 1.3 0.0 0.0 0.0 Operating Profi t (67.3) 31.8 7.2 9.4 Abnormals Pre-Tax 9.1 0.0 0.0 0.0 Tax expense (15.0) 10.5 3.7 3.1 Minorites 0.0 0.0 0.0 0.0 Other 0.0 0.0 0.0 0.0 NPAT (61.4) 21.2 3.5 6.3 Normalised NPAT 2.9 21.2 3.5 6.3
Cash Flow (A$m) 2010A 2011F 2012F 2013F
Adjusted Net Profi t (61.4) 21.2 3.5 6.3 + Interest/Tax/Expl Exp 56.9 18.4 22.4 18.1 - Interest/Tax/Expl Inc 48.7 40.4 41.0 33.1 + Depn/Amort 27.8 16.8 13.1 10.6 +/- Other 13.3 (6.9) 0.0 0.0 Operating Cashfl ow (12.2) 9.1 (2.0) 2.0 - Capex (+asset sales) 2.2 2.8 4.7 1.7 - Working Capital Increase 0.0 0.0 0.0 0.0 Free Cashfl ow (14.4) 6.3 (6.7) 0.3 - Dividends (ords & pref) 0.0 0.0 0.0 0.0 + Equity raised 55.0 0.0 0.0 0.0 + Debt drawdown (repaid) 0.0 0.0 0.0 0.0 + Other 0.4 (15.7) (20.8) 0.0 Net Change in Cash 41.0 (9.4) (27.5) 0.3 Exchange rate effects (1.3) 0.0 0.0 0.0 Cash at End Period 99.1 89.8 62.3 62.6 Net Cash/(Debt) 99.1 89.8 62.3 62.6
Balance Sheet (A$m) 2010A 2011F 2012F 2013F
Cash 98.9 89.8 62.3 62.6Total Assets 325.1 324.0 326.6 332.9Total Debt 0.0 0.0 0.0 0.0Total Liabilities 94.6 72.2 71.3 71.3Shareholders Funds 230.5 251.8 255.3 261.6 Ratios Net Debt/Equity (%) na na na naInterest Cover (x) na na na naReturn on Equity (%) na 8.4 1.4 2.4 Substantial Shareholders Shares (m) %M&G Investment Management 37.5 15.6%Northern Gulf Petroleum Holdings Ltd 13.4 5.6%
Tap Oil Limited $0.85
Exploration andAppraisal
Cash - estimate
Harriet JV area
Manora Field
John Brookes GSA
Woollybutt
Harriet JV Area (mmboe) Woollybutt (mmboe)
Oil Price (USD/bbl)
0.000.200.400.600.801.001.201.401.601.802.00
2010F 2011F 2012F 2013F40.00
50.00
60.00
70.00
80.00
90.00
100.00
110.00

MONDAY 20 APRIL 2009
Industrials
August reporting season is almost upon us and it is always worth taking some time to examine potential outperformers and
underachievers from earnings results.
With the period for confessions now largely behind us the market is likely to be shifting attention towards those companies that are
best placed to exceed consensus forecasts.
Stocks that have consistently outperformed market expectations in the resource services sector include ASL, MND and RQL. While
other companies that we believe are well poised to post strong results relative to market expectations also include: MLD, TOX, RCR
and UGL.
As ever guidance statements from management will drive share prices immediately following the initial reaction to results with some
companies being more adept than others at providing a clear picture of the near and medium term outlook.
With global uncertainty affecting sentiment and sector earnings multiples the prevailing investment themes we are following over
the short term embrace quality and well-priced growth.
For exposure to oil and gas services, which has a longer investment cycle (can be viewed as less cyclical than mining-related services),
we prefer Mermaid Marine Australia Ltd (MRM).
The sector remains generally well capitalised and some companies have begun making bolt-on acquisitions however we believe
larger deals are being hampered by valuation and a low appetite for integration risk.
Stocks currently offering relatively high dividend yields in the sector include BKN (5.3% ff), FWD (6.1% ff), MND (5.3% ff) and UGL
(6.2% ff).
HIGHLIGHTED STOCKS
SECTOR WEIGHTING Index Weight
COMPANY RECOMMENDATION COMMENT
Ausdrill Ltd (ASL) BUY Earnings linked to producing gold and iron ore mines offering strong size-adjusted earnings
growth.
MACA Ltd (MLD) BUY High margin contract miner with strong return on assets leveraged to production volume
growth.
Monadelphous Group
Ltd (MND)
BUY below $18.00/sh Seasoned performer with strong track record of beating market earnings expectations.
Mermaid Marine
Australia Ltd (MRM)
BUY Preferred exposure to WA oil and gas investment. Currently cheap historically.
RCR Tomlinson Ltd
(RCR)
BUY Strong order book with above average growth anticipated in FY12 driven by improving
margins and cheap acquisitive earnings.
Resource Equipment Ltd
(RQL)
BUY Track record of beating expectations, high growth niche offering leveraged to dewatering.
Tox Free Solutions Ltd
(TOX)
BUY Leveraged to resources waste treatment. Looking to overcome mixed interim result.
UGL Ltd (UGL) BUY Improving earnings momentum with clear funding headroom and a well-proven business
model.
AUGUST 2011
All information and advice is confi dential and for the private information of the person to whom it is provided and is provided without any responsibility or liability on
any account whatsoever on the part of this fi rm or any member or employee thereof.
MONTHLY STRATEGIC OUTLOOK 23
RESOURCE SERVICESDavid Gibson - Industrial Analyst
REPORTING SEASON PREVIEW
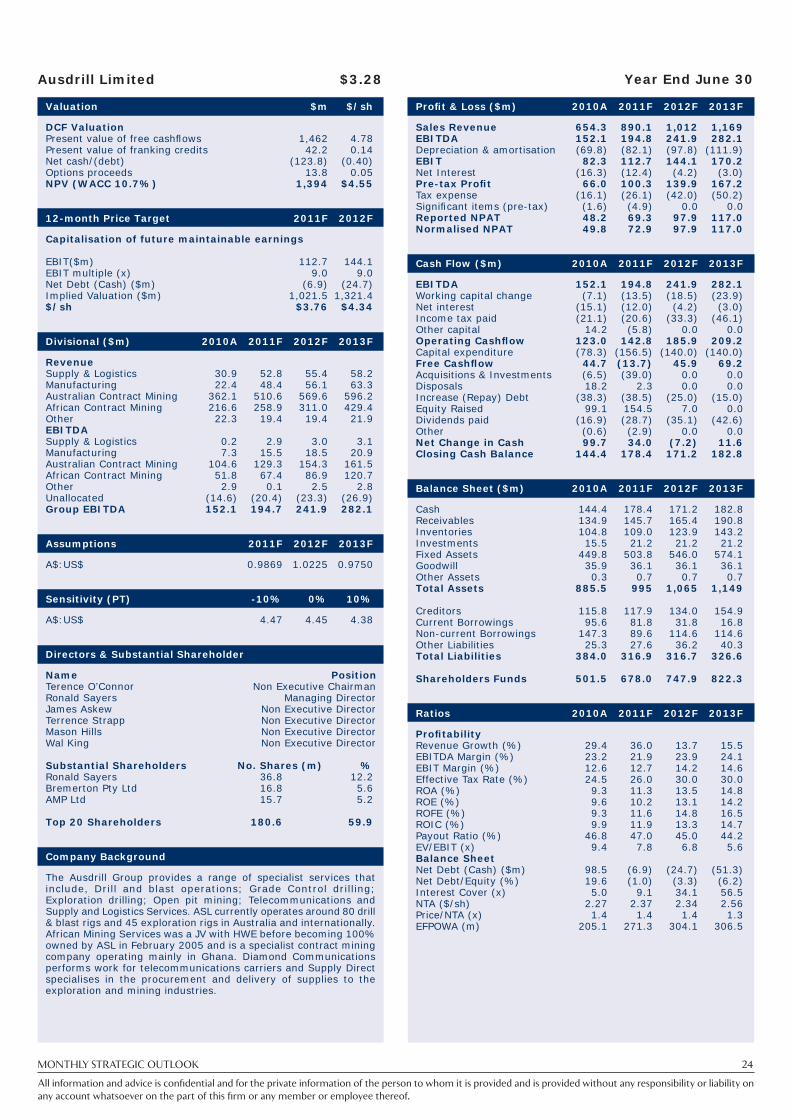
MONTHLY STRATEGIC OUTLOOK 24
All information and advice is confi dential and for the private information of the person to whom it is provided and is provided without any responsibility or liability on
any account whatsoever on the part of this fi rm or any member or employee thereof.
Ausdrill Limited $3.28 Year End June 30
Valuation $m $/sh
DCF Valuation Present value of free cashfl ows 1,462 4.78Present value of franking credits 42.2 0.14Net cash/(debt) (123.8) (0.40)Options proceeds 13.8 0.05NPV (WACC 10.7%) 1,394 $4.55
12-month Price Target 2011F 2012F
Capitalisation of future maintainable earnings EBIT($m) 112.7 144.1EBIT multiple (x) 9.0 9.0Net Debt (Cash) ($m) (6.9) (24.7)Implied Valuation ($m) 1,021.5 1,321.4 $/sh $3.76 $4.34
Divisional ($m) 2010A 2011F 2012F 2013F
Revenue Supply & Logistics 30.9 52.8 55.4 58.2 Manufacturing 22.4 48.4 56.1 63.3 Australian Contract Mining 362.1 510.6 569.6 596.2 African Contract Mining 216.6 258.9 311.0 429.4 Other 22.3 19.4 19.4 21.9 EBITDA Supply & Logistics 0.2 2.9 3.0 3.1 Manufacturing 7.3 15.5 18.5 20.9 Australian Contract Mining 104.6 129.3 154.3 161.5 African Contract Mining 51.8 67.4 86.9 120.7 Other 2.9 0.1 2.5 2.8 Unallocated (14.6) (20.4) (23.3) (26.9)Group EBITDA 152.1 194.7 241.9 282.1
Assumptions 2011F 2012F 2013F
A$:US$ 0.9869 1.0225 0.9750
Sensitivity (PT) -10% 0% 10%
A$:US$ 4.47 4.45 4.38
Directors & Substantial Shareholder
Name PositionTerence O’Connor Non Executive ChairmanRonald Sayers Managing DirectorJames Askew Non Executive DirectorTerrence Strapp Non Executive DirectorMason Hills Non Executive DirectorWal King Non Executive Director Substantial Shareholders No. Shares (m) %Ronald Sayers 36.8 12.2Bremerton Pty Ltd 16.8 5.6AMP Ltd 15.7 5.2 Top 20 Shareholders 180.6 59.9
Company Background
The Ausdrill Group provides a range of specialist services that include, Drill and blast operations; Grade Control drilling; Exploration drilling; Open pit mining; Telecommunications and Supply and Logistics Services. ASL currently operates around 80 drill & blast rigs and 45 exploration rigs in Australia and internationally. African Mining Services was a JV with HWE before becoming 100% owned by ASL in February 2005 and is a specialist contract mining company operating mainly in Ghana. Diamond Communications performs work for telecommunications carriers and Supply Direct specialises in the procurement and delivery of supplies to the exploration and mining industries.
Profi t & Loss ($m) 2010A 2011F 2012F 2013F
Sales Revenue 654.3 890.1 1,012 1,169 EBITDA 152.1 194.8 241.9 282.1 Depreciation & amortisation (69.8) (82.1) (97.8) (111.9)EBIT 82.3 112.7 144.1 170.2 Net Interest (16.3) (12.4) (4.2) (3.0)Pre-tax Profi t 66.0 100.3 139.9 167.2 Tax expense (16.1) (26.1) (42.0) (50.2)Signifi cant items (pre-tax) (1.6) (4.9) 0.0 0.0 Reported NPAT 48.2 69.3 97.9 117.0 Normalised NPAT 49.8 72.9 97.9 117.0
Cash Flow ($m) 2010A 2011F 2012F 2013F
EBITDA 152.1 194.8 241.9 282.1 Working capital change (7.1) (13.5) (18.5) (23.9)Net interest (15.1) (12.0) (4.2) (3.0)Income tax paid (21.1) (20.6) (33.3) (46.1)Other capital 14.2 (5.8) 0.0 0.0 Operating Cashfl ow 123.0 142.8 185.9 209.2 Capital expenditure (78.3) (156.5) (140.0) (140.0)Free Cashfl ow 44.7 (13.7) 45.9 69.2 Acquisitions & Investments (6.5) (39.0) 0.0 0.0 Disposals 18.2 2.3 0.0 0.0 Increase (Repay) Debt (38.3) (38.5) (25.0) (15.0)Equity Raised 99.1 154.5 7.0 0.0 Dividends paid (16.9) (28.7) (35.1) (42.6)Other (0.6) (2.9) 0.0 0.0 Net Change in Cash 99.7 34.0 (7.2) 11.6 Closing Cash Balance 144.4 178.4 171.2 182.8
Balance Sheet ($m) 2010A 2011F 2012F 2013F
Cash 144.4 178.4 171.2 182.8 Receivables 134.9 145.7 165.4 190.8 Inventories 104.8 109.0 123.9 143.2 Investments 15.5 21.2 21.2 21.2 Fixed Assets 449.8 503.8 546.0 574.1 Goodwill 35.9 36.1 36.1 36.1 Other Assets 0.3 0.7 0.7 0.7 Total Assets 885.5 995 1,065 1,149 Creditors 115.8 117.9 134.0 154.9 Current Borrowings 95.6 81.8 31.8 16.8 Non-current Borrowings 147.3 89.6 114.6 114.6 Other Liabilities 25.3 27.6 36.2 40.3 Total Liabilities 384.0 316.9 316.7 326.6 Shareholders Funds 501.5 678.0 747.9 822.3
Ratios 2010A 2011F 2012F 2013F
Profi tability Revenue Growth (%) 29.4 36.0 13.7 15.5 EBITDA Margin (%) 23.2 21.9 23.9 24.1 EBIT Margin (%) 12.6 12.7 14.2 14.6 Effective Tax Rate (%) 24.5 26.0 30.0 30.0 ROA (%) 9.3 11.3 13.5 14.8 ROE (%) 9.6 10.2 13.1 14.2 ROFE (%) 9.3 11.6 14.8 16.5 ROIC (%) 9.9 11.9 13.3 14.7 Payout Ratio (%) 46.8 47.0 45.0 44.2 EV/EBIT (x) 9.4 7.8 6.8 5.6 Balance Sheet Net Debt (Cash) ($m) 98.5 (6.9) (24.7) (51.3)Net Debt/Equity (%) 19.6 (1.0) (3.3) (6.2)Interest Cover (x) 5.0 9.1 34.1 56.5 NTA ($/sh) 2.27 2.37 2.34 2.56Price/NTA (x) 1.4 1.4 1.4 1.3EFPOWA (m) 205.1 271.3 304.1 306.5

MONTHLY STRATEGIC OUTLOOK 25
All information and advice is confi dential and for the private information of the person to whom it is provided and is provided without any responsibility or liability on
any account whatsoever on the part of this fi rm or any member or employee thereof.
MACA Limited $2.54 Year End June 30
Valuation $m $/sh
DCF Valuation Present value of free cashfl ows 476.8 3.18Present value of franking credits 14.1 0.09Net cash/(debt) 9.6 0.06 Options proceeds 0.0 0.00NPV (WACC 12.5%) 500.5 $3.34
12-month Price Target 2011F 2012F
Capitalisation of future maintainable earnings EBIT($m) 43.5 56.7EBIT multiple (x) 9.0 9.0Net Debt (Cash) ($m) 20.8 13.5 Implied Valuation ($m) 370.2 496.9 $/sh $2.47 $3.31
Commodity Profi le (2010A Revenue)
Order Book Run-Off
Directors & Substantial Shareholders
Name PositionAndrew Edwards Non Executive ChairmanChris Tuckwell Managing DirectorRoss Williams Executive DirectorGeoff Baker Executive DirectorJoseph Sweet Non Executive Director Substantial Shareholders No. Shares (m) %David Edwards 21.0 14.0Geoff Baker 21.0 14.0James & Julia Moore 19.0 12.7Francis & Sharon Maher 19.0 12.7Ross Williams 9.0 6.0Top 20 Shareholders 127.7 85.1
Company Background
MACA Ltd is an open pit contract miner operating a fl eet of mining equipment in WA for mid-tier iron ore, gold and base metals mining clients. MLD specialises in the provision of load & haul, drill & blast and crushing & screening services. Contracts are generally structured on a rates basis with rise and fall provisions. The company also operates a small civil infrastructure business. Earnings are primarily infl uenced by mine production volumes which are a function of prevailing commodity prices. Key risks include competition for contract mining services, contractual disputes and litigation as well as reliance on key personnel. The current order book includes contracts at the following WA mining projects: Jack Hills iron ore, Magellan lead, Duketon gold, Pardoo iron ore, Plutonic gold, Koolanooka iron ore, Laverton gold and Spotted Quoll nickel.
Profi t & Loss ($m) 2010A 2011F 2012F 2013F
Sales Revenue 150.1 249.1 326.3 388.3 EBITDA 37.5 65.0 86.8 104.1 Depreciation & amortisation (13.4) (21.5) (30.1) (35.9)EBIT 24.1 43.5 56.7 68.2 Net Interest (1.4) (1.3) (2.0) (1.8)Pre-tax Profi t 22.8 42.2 54.7 66.4 Tax expense (6.3) (12.6) (16.4) (19.9)Signifi cant items (pre-tax) 0.0 (0.2) 0.0 0.0 Reported NPAT 16.4 29.4 38.3 46.5 Normalised NPAT 16.4 29.7 38.3 46.5
Cash Flow ($m) 2010A 2011F 2012F 2013F
EBITDA 37.5 65.0 86.8 104.1 Working capital change (9.3) (11.5) 10.9 (2.5)Net interest (1.4) (1.3) (2.0) (1.8)Income tax paid (7.2) (13.1) (14.4) (18.2)Other capital 4.6 (2.8) 0.0 0.0 Operating Cashfl ow 24.2 36.3 81.3 81.6 Capital expenditure (19.7) (34.0) (65.0) (25.0)Free Cashfl ow 4.5 2.3 16.3 56.6 Acquisitions & Investments (0.5) 0.0 0.0 0.0 Disposals 0.9 0.9 0.0 0.0 Increase (Repay) Debt (8.0) (8.7) 0.0 0.0 Equity Raised 0.0 33.4 0.0 0.0 Dividends paid (5.0) (11.0) (9.0) (16.5)Other 0.2 1.0 0.0 0.0 Net Change in Cash (8.0) 17.9 7.3 40.1 Closing Cash Balance 6.0 23.8 31.1 71.2
Balance Sheet ($m) 2010A 2011F 2012F 2013F
Cash 6.0 23.8 31.1 71.2 Receivables 35.3 62.1 80.2 94.8 Inventories 2.9 5.0 6.5 7.7 Investments 0.0 0.0 0.0 0.0 Fixed Assets 58.7 84.7 119.6 108.7 Goodwill 0.0 0.0 0.0 0.0 Other Assets 0.5 5.3 5.3 5.3 Total Assets 103.4 180.9 242.8 287.8 Creditors 25.2 42.6 73.2 86.5 Current Borrowings 15.2 18.2 18.2 18.2 Non-current Borrowings 23.2 26.4 26.4 26.4 Other Liabilities 4.1 4.4 6.5 8.2 Total Liabilities 67.7 91.7 124.2 139.3 Shareholders Funds 35.7 89.3 118.5 148.5
Ratios 2010A 2011F 2012F 2013F
Profi tability Revenue Growth (%) 90.7 66.0 31.0 19.0 EBITDA Margin (%) 25.0 26.1 26.6 26.8 EBIT Margin (%) 16.1 17.4 17.4 17.6 Effective Tax Rate (%) 27.8 29.9 30.0 30.0 ROE (%) 46.1 32.9 32.3 31.3 ROA (%) 23.4 24.0 23.4 23.7 Payout Ratio (%) nm 30.7 35.3 38.7 EV/EBIT (x) 17.1 9.2 7.0 5.2 Balance Sheet Net Debt (Cash) ($m) 32.4 20.8 13.5 (26.6)Net Debt/Equity (%) 90.9 23.3 11.4 nmInterest Cover (x) 17.4 33.5 28.1 37.5 NTA ($/sh) 0.24 0.60 0.79 0.99Price/NTA (x) 10.7 4.3 3.2 2.6EFPOWA (m) 150.0 150.0 150.0 150.0
Iron ore42%
Base metals20%
Gold38%
-
100
200
300
400
500
2011F 2012F 2013F
Revenue (
A$m
)
Work-in-hand Work required to meet forecast

MONTHLY STRATEGIC OUTLOOK 26
All information and advice is confi dential and for the private information of the person to whom it is provided and is provided without any responsibility or liability on
any account whatsoever on the part of this fi rm or any member or employee thereof.
Monadelphous Group Limited $17.90 Year End June 30
Valuation $m $/sh
DCF Valuation PV of cash fl ows 1698.1 $18.74PV of Franking Credits 132.8 $1.47Net cash/(debt) 129.1 $1.43Investment in NFK 25.2 $0.28Options proceeds 40.4 $0.45NPV (WACC 10.2%) 2,026 $22.36
12-month Price Target 2011F 2012F
Capitalisation of future maintainable earnings EBIT ($m) 126.4 141.1EBIT multiple (x) 12.1 12.1Net Debt (Cash) ($m) (141.8) (157.1)Investment in NFK 25.2 25.2 Options proceeds 40.4 40.4 Implied Valuation ($m) 1,737 1,930 $/sh $18.98 $21.09
Divisional Revenue Summary (2010A)
Engineering Construction
70%
Skystar1%
Maintenance & IS
29%
Historical EV/EBIT (12 month forward)
Board of Directors & Substantial Shareholders
Name PositionGiovanni Rubino Executive Chairman Robert Velletri Managing DirectorIrwin Tollman Non-Executive DirectorPeter Dempsey Non-Executive DirectorChristopher Michelmore Non-Executive Director Substantial Shareholders No. shares (m) % Top 20 Shareholders 34.1 38.9
Company Background
Monadelphous is an established engineering group providing extensive project management, construction, asset management and maintenance services to the resources, energy and infrastructure industry sectors. Monadelphous has a decentralised network of operations, strategically located near mining and energy related resource precincts around Australia. The Group’s competitive advantages arise from attributes including a superior safety performance, an impeccable industrial relations record, an excellent delivery record, a fl at corporate structure and a workforce of over 4,000 personnel.
Profi t & Loss ($m) 2010A 2011F 2012F 2013F
Sales Revenue 1,275.4 1,399.9 1,530.5 1,683.5 EBITDA 129.4 147.7 164.1 182.2 Depreciation (16.8) (21.2) (23.0) (23.5)Amortisation 0.0 0.0 0.0 0.0 EBIT 112.6 126.4 141.1 158.6 Net Interest 2.5 2.3 3.1 3.6 Operating Profi t 115.1 128.7 144.2 162.2 Tax expense (31.9) (37.3) (41.8) (47.0)Signifi cant Items (net) 0.0 0.0 0.0 0.0 Reported NPAT 83.2 91.4 102.4 115.2 Normalised NPAT 83.2 91.4 102.4 115.2
Cash Flow ($m) 2010A 2011F 2012F 2013F
EBITDA 129.4 147.7 164.1 182.2 Net interest 2.4 2.4 3.1 3.6 Income tax paid (32.8) (37.4) (39.7) (44.4)Working capital change (21.3) 2.2 2.4 10.8 Other capital 18.2 15.6 0.0 0.0 Operating Cashfl ow 96.0 130.5 129.9 152.1 Capital expenditure (17.1) (16.8) (12.0) (12.4)Free Cashfl ow 78.9 113.8 117.9 139.7 Acquisitions & Investments (4.3) (7.2) 0.0 0.0 Disposals 1.7 10.8 0.0 0.0 Increase (Repay) Debt (0.6) (0.0) 0.0 0.0 Equity Raised 1.1 10.6 0.0 0.0 Dividends paid (67.9) (86.7) (89.3) (94.6)Other (12.0) (15.8) (13.3) (13.3)Net Change in Cash (3.0) 25.4 15.3 31.9 Closing Cash Balance 149.2 174.6 189.9 221.8
Balance Sheet ($m) 2010A 2011F 2012F 2013F
Cash 149.2 174.6 189.9 221.8 Receivables 121.4 133.2 145.7 160.2 Inventories 23.5 25.8 28.3 23.1 Investments 16.9 0.0 0.0 0.0 Fixed Assets 91.2 98.8 101.1 103.1 Intangibles 2.6 5.9 5.9 5.9 Other Assets 16.0 46.5 46.5 46.5 Total Assets 420.7 484.9 517.3 560.6 Creditors 168.0 184.4 201.6 221.7 Current Borrowings 11.5 12.2 12.2 12.2 Non-current Borrowings 21.1 20.6 20.6 20.6 Other Liabilities 75.9 88.7 90.9 93.5 Total Liabilities 276.4 305.9 325.2 348.0 Shareholders Funds 144.3 179.0 192.1 212.7
Ratios 2010A 2011F 2012F 2013F
Profi tability Revenue Growth (%) 13.6 9.8 9.3 10.0 EBITDA Margin (%) 10.1 10.5 10.7 10.8 EBIT Margin (%) 8.8 9.0 9.2 9.4 Effective Tax Rate (%) 27.7 29.0 29.0 29.0 ROE (%) 57.7 51.1 53.3 54.2 ROA (%) 26.8 26.1 27.3 28.3 Payout Ratio (%) 86.9 86.9 86.9 86.9 EV/EBIT (x) 12.2 11.3 10.0 8.7 Balance Sheet Net Debt (Cash) ($m) (116.6) (141.8) (157.1) (189.0)Net Debt / Equity (%) nm nm nm nmInterest Cover (x) (44.9) (55.1) (45.6) (44.2)NTA ($/share) 1.63 1.89 2.03 2.26Price/NTA (x) 11.0 9.5 8.8 7.9 EFPOWA (m) 87.2 91.5 91.5 91.5
0
2.5
5
7.5
10
12.5
15
17.5
20
'94'95'96'97'98'99'99'00'01'02'03'04'05'06'07'08'09'10'10
EV/E
BIT
(x)
Sector median Composite EVEBIT MND

MONTHLY STRATEGIC OUTLOOK 27
All information and advice is confi dential and for the private information of the person to whom it is provided and is provided without any responsibility or liability on
any account whatsoever on the part of this fi rm or any member or employee thereof.
Mermaid Marine Australia Limited $3.06 Year End June 30
Valuation $m $/sh
DCF Valuation PV of cash fl ows 1021.6 $4.77PV of Franking Credits 30.4 $0.14Net cash/(debt) (131.4) -$0.61Options proceeds 6.9 $0.03NPV (WACC 8.8%) 927.5 $4.33
12-month Price Target 2011F 2012F
Capitalisation of future maintainable earnings EBIT ($m) 67.2 81.2EBIT multiple (x) 11.0 11.0Net Debt (Cash) ($m) 100.3 81.0Implied Valuation ($m) 638.6 811.8$/sh $3.37 $3.84
Divisional ($m) 2010A 2011F 2012F 2013F
Revenue Vessels 149.9 209.0 248.0 265.9 Supply Base 38.7 54.2 63.0 70.6 Slipway 5.4 16.3 17.9 18.8 EBITDA Vessels 47.5 59.5 70.6 75.7 Supply Base 23.4 33.8 39.5 44.3 Slipway 1.4 2.6 2.9 3.0 Toll JV 1.1 (0.0) 1.2 1.4 Unallocated (7.6) (10.2) (10.2) (10.2)
Historical EV/EBIT (12 month forward)
EV/E
BIT
(x)
0
5
10
15
20
'94'95'96'96'97'98'99'00'01'01'02'03'04'05'06'06'07'08'09'10
Sector median Composite EVEBIT MRM
Directors & Substantial Shareholders
Name PositionTony Howarth Chairman Jeff Weber Managing DirectorMark Bradley Non-Executive DirectorJames Carver Non-Executive DirectorAndrew Edwards Non-Executive Director Substantial Shareholders No. shares (m) %Acorn Capital 11.6 5.4 Top 20 Shareholders 115.6 54.1
Company Background
Mermaid Marine Australia Ltd (MRM) provides a diverse range of marine related services to major oil and gas exploration and production companies on the North West Shelf. MRM operates an extensive charter vessel fl eet including tugs, pipe laying platforms, supply vessels and diver support vessels. MRM also provides slipway and onshore support facilities. Revenues refl ect asset utilisation levels and day rates, which are a function of industry demand and supply forces. MRM’s Dampier Supply Base is underpinned by a fi ve year Sublease agreement with Chevron for the Gorgon Project.
Profi t & Loss ($m) 2010A 2011F 2012F 2013F
Sales Revenue 194.0 280.3 329.7 356.1 EBITDA 64.6 85.7 104.0 114.2 Depreciation & amortisation (14.4) (18.5) (22.9) (23.7)EBIT 50.1 67.2 81.2 90.5 Net Interest (9.0) (8.4) (7.9) (6.4)Pre-tax profi t 41.2 58.8 73.3 84.1 Tax expense (3.9) (14.7) (18.4) (21.1)Signifi cant Items (net) 0.0 0.0 0.0 0.0 Reported NPAT 37.2 44.1 54.9 63.0 Normalised NPAT 31.3 43.8 54.9 63.0
Cash Flow ($m) 2010A 2011F 2012F 2013F
EBITDA 64.6 84.5 102.7 112.8 Net interest (9.0) (8.4) (7.9) (6.4)Income tax paid (5.2) (9.4) (17.2) (18.4)Working capital change (6.1) (4.0) (5.8) (3.1)Other capital 7.4 7.1 0.0 0.0 Operating Cashfl ow 51.7 69.7 71.7 84.9 Capital expenditure (97.1) (95.2) (40.0) (40.0)Free Cashfl ow (45.4) (25.5) 31.7 44.9 Acquisitions & Investments 0.0 0.0 0.0 0.0 Disposals 0.4 0.0 0.0 0.0 Increase (Repay) Debt 41.6 (8.9) 0.0 0.0 Equity Raised 0.8 67.9 8.8 0.0 Dividends paid (9.3) (11.6) (21.9) (20.5)Other 0.4 (0.8) 0.0 0.0 Net Change in Cash (11.5) 21.1 18.7 24.4 Closing Cash Balance 26.8 47.9 66.6 92.1
Balance Sheet ($m) 2010A 2011F 2012F 2013F
Cash 26.8 48.8 67.7 92.1 Receivables 42.8 60.2 70.8 76.4 Inventories 2.2 2.5 2.9 3.2 Investments 4.7 4.7 5.9 7.3 Fixed Assets 303.6 358.7 375.8 392.1 Intangibles 0.0 0.0 0.0 0.0 Other Assets 4.1 6.9 6.9 6.9 Total Assets 384.2 481.8 530.0 578.1 Creditors 16.2 29.9 35.2 38.0 Current Borrowings 26.9 26.6 26.6 26.6 Non-current Borrowings 131.4 122.8 122.8 122.8 Other Liabilities 12.7 22.2 23.4 26.1 Total Liabilities 187.2 201.5 207.9 213.4 Shareholders Funds 197.1 280.2 322.1 364.6
Ratios 2010A 2011F 2012F 2013F
Profi tability Revenue Growth (%) 18.4 44.5 17.6 8.0 EBITDA Margin (%) 33.3 30.6 31.6 32.1 EBIT Margin (%) 25.8 24.0 24.6 25.4 Effective Tax Rate (%) 9.6 25.1 25.1 25.1 ROE (%) 18.9 15.7 17.1 17.3 ROA (%) 13.0 13.9 15.3 15.7 EV/EBIT (x) 14.2 11.1 9.8 8.5 Cash Flow Op Cashfl ow/EBITDA (%) 80.1 81.4 69.0 74.4 Capex/Depreciation (x) 6.7 5.2 1.7 1.7 Payout Ratio (%) 40.7 48.0 46.8 48.2 Balance Sheet Net Debt (Cash) ($m) 131.4 100.5 81.7 57.3 Net debt / equity (%) 66.7 35.9 25.4 15.7 Interest Cover (x) 5.6 8.0 10.3 14.0 NTA ($/share) 1.04 1.32 1.38 1.56Price/NTA (x) 2.9 2.3 2.2 2.0 EFPOWA (m) 189.5 211.6 233.8 233.8

MONTHLY STRATEGIC OUTLOOK 28
All information and advice is confi dential and for the private information of the person to whom it is provided and is provided without any responsibility or liability on
any account whatsoever on the part of this fi rm or any member or employee thereof.
RCR Tomlinson Limited $1.74 Year End June 30
Valuation $m $/sh
DCF Valuation Present value of free cashfl ows 318.7 2.26 Present value of franking credits 10.1 0.07 Net cash/(debt) (21.5) (0.15)Options proceeds 4.7 0.03 NPV (WACC 12.3%) 312.0 $2.21
12-month Price Target 2011F 2012F
Capitalisation of future maintainable earnings Normalised EBIT ($m) 25.2 30.8EBIT multiple (x) 9.5 9.5Net Debt (Cash) ($m) (3.6) (12.6)Implied Valuation ($m) 242.7 305.2 $/sh $1.72 $2.16
Divisional ($m) 2010A 2011F 2012F 2013F
Revenue Mining 166.5 186.5 198.6 213.5 Energy 159.3 199.1 209.1 219.5 Resources 188.1 203.1 233.6 252.3 Power 74.7 74.7 82.1 84.6 Inter-segment eliminations (42.9) (48.4) (52.8) (56.2)EBIT Mining 8.0 8.7 9.5 10.2 Energy 6.1 8.0 8.9 9.3 Resources 1.4 8.3 9.9 11.4 Power 0.0 2.6 3.4 4.2 Eliminations (1.0) (1.0) (1.0) (1.0)
Historical EV/EBIT (x) (12 month forward)
Directors & Substantial Shareholders
Name PositionRoderick Brown Non-Executive ChairmanPaul Dalgleish CEOCharles Birmingham Non-Executive DirectorKevin Edwards Non-Executive DirectorEva Skira Non-Executive DirectorDavid Dippie Non-Executive Director Substantial Shareholders No. Shares (m) %Perpetual 13.2 10.0Jeff Hogan 11.8 9.0Hunter Hall 7.5 5.7Celeste Funds Management 6.9 5.2Invesco 6.7 5.1
Top 20 Shareholders 82.8 62.8
Company Background
RCR is a multi-disciplinary engineering company specialising in the design, manufacture and maintenance of heavy equipment and industrial boiler systems and site maintenance and construction. RCR is headquartered in Perth, Western Australia, with facilities in Queensland, New South Wales, Victoria and South Australia.
Profi t & Loss ($m) 2010A 2011F 2012F 2013F
Sales Revenue 545.6 614.9 670.6 713.7 EBITDA 31.1 39.4 45.1 48.6 Depreciation & amortisation (16.7) (14.3) (14.3) (14.4)EBIT 14.4 25.2 30.8 34.2 Net Interest (3.8) (3.4) (0.7) (0.3)Pre-tax Profi t 10.6 21.8 30.1 33.9 Tax expense 6.9 (5.5) (7.5) (8.5)Signifi cant Items (pre-tax) 0.0 0.0 0.0 1.0 Reported NPAT 17.5 16.3 22.6 26.4 Normalised NPAT 9.0 16.4 22.6 25.4
Cash Flow ($m) 2010A 2011F 2012F 2013F
EBITDA 31.1 39.4 45.1 48.6 Working capital change (4.3) (4.4) (6.6) (5.1)Net interest (3.9) (3.6) (0.7) (0.3)Income tax paid 3.8 (1.6) (7.6) (7.5)Other (2.6) 3.9 0.0 0.0 Operating Cashfl ow 24.2 33.7 30.2 35.7 Capital expenditure (8.5) (11.2) (14.0) (14.2)Free Cashfl ow 15.7 22.5 16.2 21.5 Acquisitions & Investments 0.0 0.0 0.0 0.0 Disposals 11.9 8.1 0.0 0.0 Increase (Repay) Debt (6.5) (16.2) 0.0 0.0 Equity Raised 1.0 0.0 0.0 0.0 Dividends paid (2.3) (4.0) (7.3) (10.6)Other 0.0 0.1 0.0 0.0 Net Change in Cash 19.8 10.6 9.0 10.9 Closing Cash Balance 30.0 40.6 49.6 60.5
Balance Sheet ($m) 2010A 2011F 2012F 2013F
Cash 30.0 40.6 49.6 60.5 Receivables 112.7 122.7 133.8 142.4 Inventories 30.6 34.5 37.7 40.1 Investments 1.5 0.0 0.0 0.0 Fixed Assets 85.7 66.6 66.3 66.0 Intangibles 74.3 72.5 72.5 72.5 Other Assets 21.0 21.0 9.8 9.8 Total Assets 355.8 357.9 369.6 391.3 Creditors 74.7 84.2 91.8 97.7 Current Borrowings 2.7 1.7 1.7 1.7 Non-current Borrowings 50.4 35.2 35.2 35.2 Other Liabilities 23.4 23.0 23.0 23.9 Total Liabilities 151.2 144.2 151.8 158.6 Shareholders Funds 204.6 202.5 217.9 232.7
Ratios 2010A 2011F 2012F 2013F
Profi tability Revenue Growth (%) (7.4) 12.7 9.0 6.4 EBITDA Margin (%) 5.7 6.4 6.7 6.8 EBIT Margin (%) 2.6 4.1 4.6 4.8 Effective Tax Rate (%) (64.8) 25.1 25.0 25.0 ROE (%) 8.5 8.1 10.4 11.3 ROA (%) 4.9 4.6 6.1 6.7 Payout Ratio (%) 22.6 28.3 29.2 31.1 EV/EBIT (x) 18.6 9.6 7.6 6.5 Balance Sheet Net Debt (Cash) ($m) 23.1 (3.6) (12.6) (23.5)Net Debt/Equity (%) 11.3 (1.8) (5.8) (10.1)Interest Cover (x) 3.8 7.5 46.1 122.2 NTA ($/sh) 0.92 0.92 1.03 1.13Price/NTA (x) 1.9 1.9 1.7 1.5EFPOWA (m) 141.0 141.3 141.3 141.3
0
2.5
5
7.5
10
12.5
15
17.5
20
EV/E
BIT
(x)
Sector median Composite EVEBIT RCR
94959596979898990001010203040405060707080910

MONTHLY STRATEGIC OUTLOOK 29
All information and advice is confi dential and for the private information of the person to whom it is provided and is provided without any responsibility or liability on
any account whatsoever on the part of this fi rm or any member or employee thereof.
Resource Equipment Limted $0.73 Year End June 30
Company Background
Resource Equipment Ltd commenced operations in 2003 and listed on the ASX in July 2009. The business supplies designed ‘fi t for purpose’, high quality pumping and associated rental equipment to the Mining, Offshore, Oil & Gas and Heavy Engineering markets in Australia. The recent acquisition of Dewatering Services Australia diversifi es RQL’s offerings into specialist contracting for HDPE pipelines (polythene pipe) and related services.
Ratios 2010A 2011F 2012F 2013F
Profi tability Revenue Growth (%) na 64.8 42.3 23.4 EBITDA Margin (%) 39.5 36.0 35.2 35.9 EBIT Margin (%) 30.1 27.0 27.3 28.6 Effective Tax Rate (%) 1.0 0.0 14.6 30.0 ROE (%) 33.0 20.4 18.2 16.4 ROA (%) 26.2 16.9 17.8 19.5 Payout Ratio (%) 0.0 0.0 0.0 0.0 EV/EBIT (x) 16.8 12.7 10.0 7.5
Balance Sheet
Net Debt (Cash) ($m) 8.0 14.6 12.7 6.5 Net Debt/Equity (%) 20.1 20.2 14.2 6.2 Interest Cover (x) 10.7 7.8 11.2 15.1 NTA ($/share) 0.15 0.28 0.31 0.37Price/NTA (x) 4.8 2.6 2.4 2.0 EFPOWA fully diluted (m) 194.1 209.0 242.7 243.8
Board of Directors
Name PositionJohn Saleeba Non Executive ChairmanJames Cullen Chief Executive Offi cerAnthony Ryder Executive DirectorKeith Lucas Non Executive DirectorWilliam Ryan Non Executive Director Substantial Shareholders No. Shares %Anthony Ryder 23.0 10.3Keith Lucas 23.0 10.3Mr WG Martin & Mrs M Martin 11.0 4.9Hunter Hall IM Ltd 9.7 4.3 Top 20 Shareholders 116.4 52.0
EBIT/REVENUE
Total Revenue EBIT
20.0
30.0
40.0
50.0
60.0
70.0
80.0
90.0
100.0
2010A 2011F 2012F 2013F
6.0
9.0
12.0
15.0
18.0
21.0
24.0
27.0
30.0
Profi t & Loss ($m) 2010A 2011F 2012F 2013F
Total Revenue 29.6 48.8 69.4 85.6 EBITDA 11.7 17.5 24.4 30.8 Depreciation & amortisation (2.8) (4.3) (5.5) (6.3)EBIT 8.9 13.2 18.9 24.5 Net interest (0.8) (1.7) (1.7) (1.6)Operating Profi t 8.1 11.5 17.2 22.9 Tax expense” (0.1) 0.0 (2.5) (6.9)Signifi cant items 0.0 0.0 0.0 0.0 NPAT 8.0 11.5 14.7 16.0 Normalised NPAT 5.6 8.0 12.1 16.0
Cash Flow ($m) 2010A 2011F 2012F 2013F
EBITDA 11.7 17.5 24.4 30.8 Net interest (0.8) (1.7) (1.7) (1.6)Income tax paid (0.8) (0.0) (1.3) (4.7)Working capital change (0.9) (1.4) (0.3) (0.7)Other 1.2 0.0 0.0 0.0 Operating Cashfl ow 10.4 14.4 21.1 23.7 Capital expenditure (17.7) (28.5) (21.5) (17.5)Free Cashfl ow (7.3) (14.1) (0.4) 6.2 Acquisitions & investments (4.3) (7.5) (1.5) 0.0 Disposals 0.9 0.1 0.0 0.0 Increase (repay) debt 0.6 4.1 0.0 0.0 Equity raised 8.2 17.6 3.8 0.0 Dividends paid 0.0 0.0 0.0 0.0 Other (1.8) (1.5) 0.0 0.0 Net Change in Cash (3.6) (1.3) 1.9 6.2 Closing Cash Balance 3.0 1.8 3.7 9.9
Balance Sheet ($m) 2010A 2011F 2012F 2013F
Cash 3.0 1.8 3.7 9.9 Receivables 4.6 10.6 10.9 13.4 Investments 0.0 0.0 0.0 0.0 Inventories 0.0 0.0 0.0 0.0 Fixed Assets 39.7 67.9 83.9 95.1 Intangibles 10.7 14.8 14.8 14.8 Other Assets 0.7 2.3 2.3 2.3 Total Assets 58.8 97.4 115.6 135.6 Creditors 3.4 7.9 7.9 9.7 Current Borrowings 4.9 6.1 6.1 6.1 Non-current Borrowings 6.2 10.3 10.3 10.3 Other Liabilities 4.3 0.4 1.7 3.9 Total Liabilities 18.8 24.8 26.0 30.0 Shareholders Funds 40.0 72.6 89.6 105.6
Valuation 2010A 2011F 2012F 2013F
Normalised EBIT Multiple EBIT ($m) 8.9 13.2 18.9 24.5EBIT (x) 10.0 10.0 10.0 10.0Net Debt (Cash) ($m) 8.0 14.6 12.7 6.5 Implied Valuation ($m) 81 117 177 238 Per Share $0.42 $0.56 $0.73 $0.98 Target PE Multiple EPS - normalised for tax 2.9 3.8 5.0 6.6PE Target (x) 14.0 14.0 14.0 14.0Per Share $0.41 $0.54 $0.70 $0.92 Discounted Cash Flow Cost of Equity 12.7% WACC 11.5%Cost of Debt 7.7% Terminal Growth 3.0%Target Equity/Debt 75/25 DCF Valuation/Share $0.90Current Share Price Discount (Premium) to DCF valuation 23.6%

MONTHLY STRATEGIC OUTLOOK 30
All information and advice is confi dential and for the private information of the person to whom it is provided and is provided without any responsibility or liability on
any account whatsoever on the part of this fi rm or any member or employee thereof.
Tox Free Solutions Limited $2.01 Year End June 30
Profi t & Loss ($m) 2010A 2011E 2012E 2013E
Total Income 98.7 139.7 161.6 175.9Cost of sales (56.3) (89.0) (102.8) (115.0)Other costs (16.8) (9.7) (20.5) (21.4)EBITDA 25.6 31.0 38.2 39.5Depreciation (9.0) (11.2) (11.6) (11.5)EBIT 16.6 19.7 26.6 28.0Net Interest (2.3) (1.5) (1.9) (2.1)Share based expenses (1.3) (1.3) (1.3) (1.3)Non recurring (1.2) (2.6) 0.0 0.0Pretax 11.8 14.4 23.4 24.6Tax expense (3.9) (4.3) (7.0) (7.4)Reported NPAT 8.0 10.1 16.4 17.2Recurrent NPAT 8.8 11.9 16.4 17.2
Cash Flow ($m) 2010A 2011E 2012E 2013E
Cash from customers 97.8 138.4 160.0 174.2Cash to suppliers (73.7) (116.4) (131.5) (147.1)Net Interest (2.3) (1.5) (1.9) (2.1)Income tax paid (4.2) (4.3) (7.0) (7.4)Other 0.0 0.0 0.0 0.0Operating Cashfl ow 17.6 16.1 19.6 17.7Capital expenditure (21.8) (21.0) (16.0) (12.0)Free Cashfl ow (4.2) (4.9) 3.6 5.7 Net Acquisitions (2.8) 0.0 (18.0) 0.0Disposals 0.8 0.0 0.0 0.0Increase (Repay) Debt (6.4) 0.0 10.0 0.0Equity Raised 25.9 0.0 8.0 0.0Dividends paid 0.0 (1.7) (2.0) (3.3)Other 0.0 0.0 0.0 0.0Net Change in Cash 13.3 (6.6) 1.6 2.4Closing Cash Balance 17.9 11.3 12.9 15.3
Balance Sheet ($m) 2010A 2011E 2012E 2013E
Cash 17.9 11.3 12.9 15.3Receivables 25.2 35.7 41.3 44.9Inventories 0.4 0.6 0.7 1.0Fixed Assets 58.6 75.6 84.9 81.4Intangibles 27.5 27.5 59.5 59.5Deferred tax assets 0.79 0.88 1.44 1.51Other Assets 1.3 1.9 4.4 18.0Total Assets 131.8 153.5 205.1 221.6 Creditors 9.9 13.9 16.1 17.6Current Borrowings 17.6 17.6 17.6 17.6Non-current Borrowings 13.4 13.4 23.4 23.4Other Liabilities 2.3 13.8 34.0 39.4Total Liabilities 43.2 58.8 91.2 98.0Net Assets 88.5 94.7 114.0 123.7 Shareholders Funds 88.5 94.7 114.0 123.7
Ratios 2010A 2011E 2012E 2013E
Profi tability Revenue Growth (%) 11.9 41.5 15.7 8.9EBITDA Margin (%) 25.9 22.2 23.6 22.4EBIT Margin (%) 16.8 14.1 16.5 15.9Effective Tax Rate (%) 32.7 30.0 30.0 30.0Payout Ratio (%) 22% 20% 20% 20%ROE (%) 11.2% 11.0% 15.7% 14.4%ROA (%) 6.8% 7.1% 9.1% 8.1%EPS 10.1 12.5 16.6 17.4EPS Growth (0.4%) 23.6% 33.0% 4.9%PER 19.9 16.1 12.1 11.6Dividend Yield 1.0% 1.1% 1.7% 1.8%EV/EBITDA (x) 7.7 6.6 5.6 5.3Balance Sheet Net Debt (Cash) ($m) 13.2 19.8 28.2 25.8Net Debt/Equity (%) 14.9 20.9 24.7 20.8Interest Cover (x) 7.3 13.3 14.0 13.3Book ($/share) 0.97 1.02 1.18 1.29Price/Book (x) 2.1 2.0 1.7 1.6EFPOWA (m) 86.1 92.6 96.5 96.5
Divisional 2010A 2011E 2012E 2013E
Revenues Liquid Waste 10.5 12.1 13.0 13.9Hazardous Waste 14.3 16.0 19.1 22.0Solid Waste 21.1 40.3 50.8 55.9Industrial Services 52.7 71.2 78.7 84.2Total Revenues 98.7 139.7 161.6 175.9 EBIT Liquid Waste 3.8 4.2 4.5 4.8Hazardous Waste 6.4 7.2 8.6 9.9Solid Waste 6.1 9.7 14.2 13.4Industrial Services 6.9 10.0 11.0 11.8Corporate -7.2 -11.3 -11.7 -11.9Total 16.1 19.7 26.6 28.0
Valuation 2011E 2012E 2013E
Normalised EBITDA Multiple FY11e FY12e FY13eEBITDA ($m) 31.0 38.2 39.5EV/EBITDA 7.5 7.5 7.5Net Debt (Cash) ($m) 19.8 28.2 25.8Implied Valuation ($m) 212.7 258.5 270.4Per Share $2.30 $2.68 $2.80 Target PE Multiple FY11e FY12e FY13eEPS (cents) 11.9 16.4 17.2PE Target 18.0 18.0 18.0Per Share $2.13 $2.95 $3.09

MONTHLY STRATEGIC OUTLOOK 31
All information and advice is confi dential and for the private information of the person to whom it is provided and is provided without any responsibility or liability on
any account whatsoever on the part of this fi rm or any member or employee thereof.
UGL Limited $13.21 Year End June 30
Profi t and Loss 2010A 2011F 2012F 2013F
Sales revenue 4358.8 4747.5 5103.0 5446.7EBITDA 288.5 312.3 358.9 388.2D&A 29.6 31.5 33.8 35.9EBIT 229.3 253.8 297.2 323.3Interest Expense 26.7 22.0 20.8 18.7Pre-tax profi t 196.3 231.8 276.3 304.6Tax 52.3 67.2 80.1 88.3 NPAT (Reported) 144.5 164.6 196.2 216.2Adjustments 7.0 0.0 0.0 0.0 Patersons NPAT (adj) 151.6 164.6 196.2 216.2
Cashfl ow 2010A 2011F 2012F 2013F
Reported pre-tax profi t 196.3 231.8 276.3 304.6Depn and amortisation 59.2 58.5 61.8 64.9Tax paid (56.0) (67.2) (80.1) (88.3)(inc)/dec in wk’g cap 77.8 (23.3) (21.3) (20.6)Other (47.9) 0.0 0.0 0.0Operating cashfl ow 229.4 199.8 236.6 260.6 Capex (38.8) (48.0) (49.4) (50.9)Acquisitions/investments (3.3) 0.0 0.0 0.0(inc)/Dec in intangibles (11.6) (10.0) 1.0 2.0Investing cashfl ow (53.7) (58.0) (48.4) (48.9) Equity raised 5.4 0.0 0.0 0.0Dividends paid (105.9) (113.5) (135.3) (149.1)Net change in borrowings (23.4) 0.0 0.0 0.0Other 0.0 0.0 0.0 0.0Financing cashfl ow (124.0) (113.5) (135.3) (149.1) Net change in cash 44.5 28.3 52.9 62.5
Balance sheet 2010A 2011F 2012F 2013F
Cash 297.8 326.1 379.1 441.6Receivables 442.9 482.4 518.5 553.4Inventories 342.5 373.1 401.0 428.0Other 2.3 4.3 4.7 6.6Current assets 1085.6 1185.9 1303.3 1429.7PPE 161.4 218.8 234.5 249.4Investments 12.7 12.7 12.7 12.7Intangibles 1174.9 1170.3 1174.7 1177.1Other 19.8 19.8 19.8 19.8Non-current assets 1419.6 1472.4 1492.5 1509.9Total assets 2505.2 2658.3 2795.8 2939.5Current acc. Payable 524.1 570.8 613.5 654.9current borrowings 2.2 2.2 2.2 2.2other current liabilities 16.3 49.6 57.9 65.7Total current liabilities 748.8 828.8 879.9 929.0NC borrowings 529.2 524.1 524.1 524.1other nc liabilities 16.9 44.1 69.7 97.2Total nc. Liabilities 597.2 619.3 644.9 672.4Total Liabilities 1346.0 1448.1 1524.7 1601.4 Net Assets 1159.1 1210.2 1271.0 1338.2 Ordinary share capital 904.9 904.9 904.9 904.9Reserves (1.1) (1.1) (1.1) (1.1)Retained profi ts 254.6 305.6 366.5 433.6Total Shareholders Equity 1159.1 1210.2 1271.1 1338.2
Valuation data 2010A 2011F 2012F 2013F
Net profi t adj ($m) 151.6 164.6 196.2 216.2EPS (c) 91.6 99.3 118.3 130.4EPS growth (%) (0.2) 8.4 19.2 10.2P/E ratio (x) 14.4 13.3 11.2 10.1CFPS (c) 120.4 134.5 155.6 169.6Price/CF (x) 11.0 9.8 8.5 7.8DPS (c) ordinary 64.0 68.8 82.0 90.3Franking (%) 100.0 100.0 100.0 100.0Yield (%) 4.8 5.2 6.2 6.8EV/EBITDA 8.4 7.6 6.5 5.8EV/EBIT 10.5 9.4 7.8 7.0
Per share valuation
DCF Valuation $m $/sharePresent Value of free cashfl ow 2916.940509 17.6Net debt/(cash) 233.6 1.4NPV 2683.385509 16.20 (WACC) 11% Rel PER (blended) Valuation Multiple (x) 15.5Forward EPS (FY12 and FY13) 124.4
12 Mth PE Price Target ($) 17.98
Blended Valuation ($ per share) 17.09
Ratios 2010A 2011F 2012F 2013F
EBITDA/sales (%) 6.6 6.6 7.0 7.1EBIT/sales (%) 5.3 5.3 5.8 5.9Return on assets (%) 10.2 11.2 12.5 13.2Return on equity (%) 12.7 13.9 15.8 16.6Return on funds empl’d (%) 16.2 18.1 21.0 22.8Dividend cover (x) 1.4 1.4 1.4 1.4Effective tax rate (%) 29.0 29.0 29.0 29.0Net debt/(cash) ($m) 233.6 200.1 147.2 84.7Net debt/equity (%) 20.1 16.5 11.6 6.3Net interest cover (x) 8.6 11.5 14.3 17.3
Segmentals 2010A 2011F 2012F 2013F
Revenue Infrastructure 1096.0 1024.4 1101.3 1183.9Rail 1135.4 1414.7 1556.1 1672.8Resources 785.9 924.5 923.4 992.6Services 1361.9 1400.2 1540.1 1617.1Total revenue 4358.8 4747.5 5103.0 5103.0 Underlying EBIT Infrastructure 78.9 79.4 81.5 87.6Rail 55.2 84.9 93.4 100.4Resources 59.4 52.5 78.5 89.3Services 71.5 74.4 83.2 87.3Corporate (35.7) (37.5) (39.4) (41.3)Total EBIT 229.3 253.8 297.2 323.3
Company Profi le
United Group (UGL) is a broad based infrastructure services company delivering industrial maintenance, manufacturing, engineering and business process outsourcing services for both public and private sector companies and the governments throughout Australia, NZ, parts of Asia and the US. UGL provides services through its four main operating divisions of Infrastructure, Rail, Resources and Services.

MONDAY 20 APRIL 2009
All information and advice is confi dential and for the private information of the person to whom it is provided and is provided without any responsibility or liability on
any account whatsoever on the part of this fi rm or any member or employee thereof.
MONTHLY STRATEGIC OUTLOOK 32
INTRODUCTION
The recent Diggers and Dealers 2011 conference highlighted to us that the current market malaise is creating signifi cant opportunities
for companies in the sector. The conference held in Kalgoorlie, Western Australia was well attended with 38 companies presenting,
2400 attendees and 135 booth displays.
The buzz coming from the sidelines of the conference centered on the Federal Government’s unpopular Carbon Tax and the Mineral
Resources Rent Tax for iron ore and coal companies (concerns which are unnecessary negatives for a market which is currently risk
averse and looking for reasons to sell rather than buy).
With the macro picture spooking the market (US debt ceiling negotiations recently concluded, ongoing fears over debt levels of
Greek, Spanish and Italian governments) the ASX Small Resources index is down 21.5% to 5,500 points since the end of January 2011
and traded value per month (sum of the turnover for the 87 companies in the Small Resources Index) peaking at $8bn in February
2011 and now at $5bn per month leaving many companies with high margin, quality projects presenting very good value.
So with market volumes down, assets values lower and a diffi cult environment in which to raise exploration and development
funding the time for deals is now! Companies that are cashed up and looking for growth will move to set themselves up for the next
upswing in prices.
We recommend investors focus on well funded, companies with projects that can weather the downswing of the cycle yet may
present attractive plays for more aggressive corporates looking for growth. Our highlighted stocks with this investment thesis in
mind are outlined below.
AUGUST 2011
Mining and Metals
Alex Passmore - Head of Research
Simon Tonkin - Senior Resources Analyst
FLIGHT TO QUALITY WITH M&A ACTIVITY PENDING
HIGHLIGHTED STOCKS
SECTOR WEIGHTING Index Weight
COMPANY RECOMMENDATION COMMENT
Atlas Iron Ltd (AGO) BUY AGO has a short term plan of achieving 15Mtpa from existing operations (horizon 1).
Horizon 2 is for increased production to 46Mtpa, and horizon 3 will involve the company
exploring overseas options. David Flanagan mentioned that AGO is not a pilbara only
company, and they will look at other international projects. AGO is satisfi ed that their
model works, having shipped 60 vessels since commencing production, and believe
increasing production from current levels will be easier than it has been achieving current
production. David also added that the company is making $700 a minute.
Going forward the company needs to look at rail options as road is not practical over
15Mtpa. As an option rail will be more appealing with >600Mt of resources. Retain our
$4.80/sh
Altona Mining Ltd
(AOH)
SPEC BUY Altona Mining Ltd (AOH) was formed through the merger of Vulcan Resources Limited
and Universal Resources Limited. AOH is a copper explorer and developer with a strategy
to build production from its two 100% assets: Outokumpu in Finland and Roseby in
Australia. AOH expects to commence production at Outokumpu from early 2012 at the
rate of 8ktpa, with annual production building towards 35ktpa Cu and 15koz Au by 2014
when Roseby is expected to come online. The Outokumpu Project has low capital costs
of A$46m, is fully funded, and has good potential to extend the planned 8 year mine life
by inclusion of regional satellite deposits. A DFS update has commenced at the Roseby
Project which will evaluate upgrading the processing capacity from 5Mtpa to 8Mtpa, and
ongoing drilling is expected to substantially upgrade the current 900kt Cu and 250koz
Au resource base. We see AOH becoming a mid-tier copper producer over the next 3
years and given the signifi cant discount to its peers (A$50/t vs $150/t), we will continue to
monitor its progress toward achieving its production targets which could see a signifi cant
re-rating of the stock. We rate AOH as a Speculative BUY.

All information and advice is confi dential and for the private information of the person to whom it is provided and is provided without any responsibility or liability on
any account whatsoever on the part of this fi rm or any member or employee thereof.
MONTHLY STRATEGIC OUTLOOK 33
SECTOR WEIGHTING Index Weight
COMPANY RECOMMENDATION COMMENT
Alacer Gold Corp.
(AQG)
BUY The much anticipated merger between Avoca Resources (AVO) and TSX listed Anatolia
Minerals (ANO) to create Alacer Gold (AQG) was completed on 18 February 2011 with
overwhelming shareholder support. AQG has emerged as a leading intermediate gold
producer with a diversifi ed asset portfolio in Australia and Turkey. Large, long mine life
operations with strong inherent value enhance the company’s growth prospects, with
AQG forecasting production ramp up to 600koz Au by CY2013 then 800koz Au by
CY2015. With the company looking to increase its inventory base in line with production
depletion and has 5.7Moz Au in reserves and a resource position of 13Moz Au. April 1 2011
marked the beginning of commercial production from the Çöpler operation in Turkey with
AQG targeting 135koz Au in 2011 at cash operating costs of US$460/oz. Long term viability
of the Çöpler operation is underpinned by the development of its sulphide project which
is currently in the detailed feasibility phase. Overall we see AQG as a robust mid-tier gold
producer. BUY, Price target $9.75/sh.
Independence Group
NL (IGO)
BUY IGO won the Digger of the Year award for 2011. IGO’s goal is to become the next mid-tier
miner in Australia and they have an excellent development pipeline to achieve their goal.
The long nickel mine continues to produce good cash fl ow with 2011 production expected
to be between 8.8-9.2kt Ni. At Jaguar 2011 production is expected to be 8.5-9.5kt Cu, 15.5-
16.5kt Zn and 0.4-0.5moz Ag. At Tropicana (IGO 30%) production is expected to begin
in late 2013 and ramp up to 120kozpa (IGO’s share). Other prospective projects include;
Duketon (some +9% Ni hits), Orrbacden Ni project in Sweden, Kalawibda project near
Newman 220koz Au resource. IGO has a couple of advantages to other companies they
have an extensive diamond database as well as a powerful EM system to assist to locate
mineralisation. IGO have $220m in cash and receivables. Catalysts: 1) Bentley mining in
Q1 FY2012. 2) Reserve resource upgrades at Jaguar and extension of mine life. 3) Boston
Shaker and Havana Deeps feasibility and pre-feasibility. 4) Successful integration of JML
and IGO. Retain our $8.52/sh price target.
Lynas Corp. Ltd (LYC) BUY LYC is now the 65th largest stock on ASX and in the top ten by value of trading. (It
traded more than Telstra by value recently) Rare Earth market is in structural defi cit
with production tightening in China as well as China restricting exports while modern
technology needs more and more REO. LYC aims to supply over 20% of the market. They
see the total supply of 150ktpa by 2015, of which China is 100kt, and the majority of the
remainder is split between Lynas and Molycorp. This compares to estimated demand of
170ktpa. Curtis stated that he expects the longer term price to range between $90/kg and
the current record prices of $220/kg well above PSL forecasts of $40/kg.
Lynas recently held the offi cial opening of the Mt Weld mine. Final commissioning is close
to completion and concentrate grade has been as planned at 36% and recoveries well
ahead of plan at 68.7%.
The local opponents of the plant have managed to delay commissioning of the Malaysian
plant by about 3 months and Lynas will now be in production before the end of 2011.
The independent review has confi rmed that the plant is fully compliant with international
standards and the safety is at best practice.
Recently signed a JV with Siemens for the manufacture of Neodymium magnets for
gearless windmills.
Progressing exploration and feasibility on Malawi REO project and expect that it could be
as big as MtWeld in production capacity. We retain our $3.15/sh price target.
Troy Resources NL
(TRY)
BUY Troy has now closed its sandstone operations and is producing from Andorinhas (Brazil)
and Casposo (Argentina). TRY is a dividend paying producer, the company paid out its 11th
dividend this year.
TRY is expecting to maintain production above 100kozpa additional exploration at the
Casposo project. Drill results to date have returned the highest grades the company has
seen. Cash costs at Casposo will be negative from 2013 due to signifi cant silver credits and
will be the lowest on the ASX. Also many of the results from its exploration program were
done at a Au:Ag ratio of 70:1 but ratio is more like 50:1 so there is signifi cant leverage to
increase Au eq grade by around 33%. At Casposo I was very impressed with the exploration
upside with a 9km structural corridor with the resources less than 1km in strike. Retain our
$4.74/sh price target.

MONTHLY STRATEGIC OUTLOOK 34
All information and advice is confi dential and for the private information of the person to whom it is provided and is provided without any responsibility or liability on
any account whatsoever on the part of this fi rm or any member or employee thereof.
Atlas Iron Limited $3.67 Year End June 30
Valuation A$m A$/sh
Pardoo 290 0.34 Wodgina 1,051 1.24 Abydos 387 0.46 Mt Webber 1,308 1.54 Exploration 540 0.64 Listed Investments 41 0.05 Forwards 0 0.00 Corporate -60 (0.07)Unpaid Capital 47 0.06 Cash 365 0.43 Debt 0 0.00 NPV 3,969 4.68 Price Target 3,969 4.80 (100% NPV)
Sensitivities to Iron Ore Price -10% 0% +10%
NPV 3.93 4.68 5.42
Valuation Summary of Operating Assets
Iron Ore Production Summary
0
2000
4000
6000
8000
10000
12000
14000
16000
2010A 2011F 2012F 2013F 2014F 2015F
(kt)
0
40
80
120
160
200
(A$/t
)
Group Sales (kt) Weighted Ave Cash CostsAve Price Received (FOB)
Reserves & Resources (attributable)
Reserves Mt % Fe % Al+Si % PhosPilbara 53,691 57.7% 7.8% 0.8% Resources Mt % Fe % Al+Si % PhosNorth Pilbara 444 56.4% 9.2% 0.1%Southeast Pilbara 158 56.7% 10.2% 0.1%West Pilbara 38 53.6% 12.3% 0.0%Midwest 12 60.1% 9.2% 0.1%
Directors
Name PositionGeoff Clifford Non Executive Chairman (retiring 31 July 11)David Flanagan Managing DirectorDavid Hannon Non Executive Director & Acting ChairmanTai Sook Yee Non Executive DirectorDavid Smith Non Executive Director Substantial Shareholders Shares (m) %IMC Group 66.7 8.1Blackrock 41.2 5.0Schroder 41.2 5.0
Commodity Assumptions 2010A 2011F 2012F 2013F
A$:US$ 0.89 0.99 1.02 0.98Iron Ore Fines (US$/t) 76.44 145.17 178.54 178.54Iron Ore Lump (US$/t) 89.72 170.13 205.32 209.78
Production Summary 2010A 2011F 2012F 2013F
Pardoo - Fines 1,259 1,672 1,725 1,800Turner River Hub: Wodgina - Fines 0 2,810 4,027 4,200Abydos 0 0 0 2,000Mt Webber 0 0 2,000 3,000 Group Production (kt) 1,259 4,483 7,752 11,000 Group Sales (kt) 1,259 4,836 7,835 11,050 Cost Summary (A$/t): Pardoo Cash Costs 56.48 60.63 57.72 58.88Wodgina Cash Costs 0.00 47.57 56.22 57.61Project C Cash Costs 0.00 0.00 0.00 63.36Weighted Ave Cash Costs 56.48 52.09 56.67 59.32Ave Price Received (FOB) 67.35 125.40 153.64 162.28
Profi t & Loss (A$m) 2010A 2011F 2012F 2013F
Sales Revenue 84.8 606.5 896.6 1,306.3Other Income 7.0 12.4 21.2 0.0 Operating Costs 74.4 246.1 286.3 405.0 Exploration Exp. 24.2 21.2 24.3 24.8 Corporate/Admin 17.5 40.5 36.6 37.3 EBITDA (24.4) 311.1 570.6 839.2 Depn & Amort 16.9 14.2 2.9 19.0EBIT (41.3) 296.9 567.6 820.1 Interest 0.0 3.9 0.0 0.0 Abnormals 0.4 (7.1) 0.0 0.0 Operating Profi t (40.8) 285.8 567.6 820.1 Tax expense 0.0 76.7 170.3 246.0 Minorities 0.0 0.0 0.0 0.0 NPAT (40.8) 209.1 397.4 574.1 Normalised NPAT (28.6) 209.1 397.4 574.1
Cash Flow (A$m) 2010A 2011F 2012F 2013F
Adjusted Net Profi t (40.8) 209.1 397.4 574.1 + Interest/Tax/Expl Exp 24.2 98.0 194.6 270.8 - Interest/Tax/Expl Inc 70.5 78.2 87.6 111.1 + Depn/Amort 16.9 14.2 2.9 19.0 - Deferred Waste 39.5 47.2 43.1 195.0 Operating Cashfl ow (109.8) 195.8 464.1 557.9 - Capex (+asset sales) 31.8 47.1 34.0 143.1- Working Capital Increase -41.5 -64.2 0.0 0.0Free Cashfl ow (100.1) 212.9 430.1 414.7 - Dividends (ords & pref) 0.0 0.0 0.0 0.0 + Equity raised 127.9 2.7 0.0 0.0 + Debt drawdown (repaid) (14.3) (7.7) 0.0 0.0 Net Change in Cash 30.6 210.1 430.1 414.7 Cash at End Period 154.9 365.0 795.1 1209.8 Net Cash/(Debt) 154.9 365.0 795.1 1209.8
Balance Sheet (A$m) 2010A 2011F 2012F 2013F
Cash 154.9 365.0 795.1 1209.8 Total Assets 388.6 593.4 990.7 1564.8 Total Debt 0.0 0.0 0.0 0.0 Total Liabilities 29.6 22.6 22.6 22.6 Shareholders Funds 359.0 570.8 968.1 1542.2 Ratios Debt/Equity (%) na na na naInterest Cover (x) na na na naReturn on Equity (%) na 36.6 41.0 37.2
Listed Investments1%
Exploration15%
Wodgina29%
Abydos11%
Pardoo8%
Mt Webber36%

MONTHLY STRATEGIC OUTLOOK 35
All information and advice is confi dential and for the private information of the person to whom it is provided and is provided without any responsibility or liability on
any account whatsoever on the part of this fi rm or any member or employee thereof.
Alacer Gold Corp. $8.69 Year End June 30
Valuation A$m A$/sh
Higginsville Gold 455.4 1.50 Frogs Leg 103.4 0.34 South Kal 306.8 1.01 Copler Gold Mine 934.4 3.08 Exploration 189.1 0.62 Unpaid Capital 31.6 0.10 Corporate (3.2) (0.01)Forwards 0.0 0.00 Listed Investments 6.0 0.02 Cash est 137.0 0.45 Debt est (48.3) (0.16)NAV 2112 6.97 (@ 8% Discount rate) Price Target (1.4 x NAV) 9.75
Hedging koz Strike Cover
Put Options 287 A$830 to CY11
Valuation Summary of Operating Assets
Copler Gold Mine47%
Exploration 10%
Frogs Leg5%
South Kal15%
Higginsville Gold23%
Gold Production Summary
0
100
200
300
400
500
600
700
2010A 2011F 2012F 2013F 2014F0
200
400
600
800
1000
Total Production (koz) Group Cash Cost (A$/oz)
Reserves & Resources
Reserves Equity Mt Au g/t Au kozHigginsville 100% 6.0 4.16 803Frogs Leg 49% 5.0 5.06 399South Kal 100% 2.0 1.63 106Copler 100% 40.8 1.65 2,169Total 6.0 4.12 3,477Resources Mt Au g/t Au kozHigginsville 100% 14.3 3.42 1,572Frogs Leg 49% 2.3 6.34 230South Kal 100% 68.7 2.04 4,516Copler 95% 125.0 1.50 5,739Cevizlidere 100% 445.7 0.11 1,576Karakartal 100% 31.6 0.38 386Total 687.6 0.66 14,019
Directors
Name PositionRobert Reynolds Non-Executive ChairmanEd Dowling Managing DirectorRohan Williams Chief Strategic DirectorDavid Quinlivan Non-Executive DirectorStephanie Unwin Non-Executive DirectorJan Castro Non-Executive DirectorTimothy Haddon Non-Executive DirectorRichard Graff Non-Executive DirectorJay Kellerman Non-Executive DirectorSubstantial Shareholders Shares(m) (%)Pala Investments AG 47.7 17.2
Commodity Assumptions 2010A 2011F 2012F 2013F
A$:US$ 0.93 1.03 1.01 0.94Gold (US$/oz) 1227 1481 1529 1550Silver (US$/oz) 20.13 35.68 36.26 36.00Gold (A$/oz) 1321 1433 1513 1649Silver (A$/oz) 21.67 34.51 35.90 38.30
Sensitivity -10% 0% +10% Delta +10%
FX (A$:US$) 9.77 9.76 9.76 0%Gold Price 8.35 9.76 11.17 14%Grade 9.29 9.76 10.23 5%Operating Costs 9.99 9.76 9.52 -2%
Production Summary 2010A 2011F 2012F 2013F
Gold Production Higginsville Gold 168 157 159 181Frogs Leg 52 28 28 28South Kal 43 29 140 153Copler Gold Mine 0 179 247 247Total Production (koz) 264 392 574 609 Cost Summary H’ville Cash Cost (A$/oz) 496 544 569 580Group Cash Cost (A$/oz) 621 543 464 481Group Total Cost (A$/oz) 871 707 639 664 Price Received (A$/oz) 1,316 1,481 1,529 1,550
Profi t & Loss (US$m) 2010A 2011F 2012F 2013F
Sales Revenue 351.8 618.3 914.6 980.1 Other Income 8.7 6.5 17.0 38.3 Operating Costs 173.3 228.5 289.0 320.1 Exploration Exp. 6.2 4.0 4.1 4.2 Corporate/Admin 0.2 2.0 2.0 2.1 EBITDA 180.8 390.3 636.4 692.0 Depn & Amort 81.9 69.8 96.3 103.3 EBIT 98.9 320.5 540.2 588.7 Interest 5.6 3.4 0.1 0.0 RSPT 0.0 0.0 0.0 0.0 Operating Profi t 93.3 317.1 540.1 588.7 Signifi cant Items 5.2 0.0 0.0 0.0 FX Adjustment 0.0 0.0 0.0 0.0 Tax expense 17.8 95.1 159.3 167.7 Reported NPAT 80.7 222.0 380.8 421.0 Normalised NPAT 65.3 222.0 378.1 412.1
Cash Flow (US$m) 2010A 2011F 2012F 2013F
Adjusted Net Profi t 80.7 222.0 380.8 421.0 + Interest/Tax/Expl Exp 29.6 102.5 163.4 171.9 - Interest/Tax/Expl Inc 25.8 125.8 178.7 184.4 + Depn/Amort 81.9 69.8 96.3 103.3 +/- Other 0.0 0.0 0.0 0.0 Operating Cashfl ow 166.5 268.5 461.8 511.8 - Capex (+asset sales) 36.3 44.2 89.9 23.9 - Working Capital Increase 43.8 66.1 0.0 0.0 Free Cashfl ow 86.4 158.2 371.9 487.9 - Dividends (ords & pref) 0.0 0.0 0.0 0.0 + Equity raised 0.4 0.0 0.0 0.0 + Debt drawdown (repaid) (30.8) (28.2) (18.3) 0.0 Net Change in Cash 26.4 130.0 353.6 487.9 Cash at End Period 102.2 232.2 585.8 1073.7 Net Cash/(LT Debt) 55.7 213.9 585.8 1073.7
Balance Sheet (A$m) 2010A 2011F 2012F 2013F
Cash 102.2 232.2 585.8 1073.7Total Assets 414.2 770.8 1139.5 1562.2Total Debt 47.0 18.3 0.0 0.0Total Liabilities 145.4 280.0 270.6 281.2Shareholders Funds 268.9 490.8 868.9 1281.0Ratios Net Debt/Equity (%) na na na naInterest Cover (x) 17.6 95.3 7944.3 naReturn on Equity (%) 30.0 45.2 43.8 32.9

MONTHLY STRATEGIC OUTLOOK 36
All information and advice is confi dential and for the private information of the person to whom it is provided and is provided without any responsibility or liability on
any account whatsoever on the part of this fi rm or any member or employee thereof.
Independence Group NL $5.63 Year End June 30
Valuation A$m A$/sh
Victor/Long 189 0.94 Tropicana 517 2.56 Jaguar/Bentley 336 1.66 Stockman 122 0.61 Forward Sales 0 0.00 Corporate (28) (0.14)Exploration 201 1.00 Unpaid Capital 4 0.02 Cash (est post raise) 221 1.09 Debt est 0 0.00 DCF 1561 7.75 @ 8% Discount Rate Price Target 1,717 8.5210% Premium to NPV
Sensitivity Price Target +10% 0% -10%
Nickel Price $8.80 $8.52 $8.27 Gold Price $9.45 $8.52 $7.59 A$ : $US $6.96 $8.52 $10.45
Valuation Summary of Assets
Nickel Production Summary
Reserves & Resources as June 10
Reserves Mt % kt /Moz Long Ni 1.32 4.1 53.9Tropicana (100%) Au 45.00 2.3 3.33 IGO (30%) 13.50 2.30 1.00Jaguar/Bentley Zn 3.23 7.9 255.6 Cu 3.2349 1.8 58.2 Ag 3.2349 0.99 0.10Resources Long Ni 1.70 5.4 91.9Tropicana (100%) Au 75.3 2.07 5.01 IGO (30%) 22.59 2.07 1.50Jaguar/Bentley Zn 4.68 7.2 337.0 Cu 4.68 2.1 98.3 Ag 4.68 0.98 0.15Stockman Zn 12.50 4.4 550.0
Directors
Name PositionRodney Marston Non Executive DirectorChristopher Bonwick Managing DirectorKelly Ross Executive DirectorJohn Christie Non Executive DirectorPeter Bilbe Non Executive ChairmanSubstantial Shareholders Shares(m) %JCP Capital 19.1 10%NAB 10.1 5%
Commodity Assumptions 2010A 2011F 2012F 2013F
A$:US$ $0.89 $0.99 $1.02 $0.98 Gold (US$/oz) $1,093 $1,369 $1,523 $1,537 Copper (US$/lb) $3.04 $3.95 $4.10 $4.02 Nickel (US$/lb) $8.75 $10.89 $10.13 $10.03 Zinc(US$/lb) $0.94 $1.02 $1.04 $1.05
Production Summary 2010A 2011F 2012F 2013F
Victor/Long Nickel Production (t) Nickel in Concentrate 8,615 9,753 9,766 11,116Copper in Concentrate 643 684 720 840Per Pound of Payable Nickel Net Nickel Cash Cost (A$/lb) $4.00 $4.05 $4.39 $4.12 Nickel Total Cost (A$/lb) $5.58 $5.88 $6.27 $5.98 Net Nickel Cash Cost (US$/lb) $3.57 $4.00 $4.49 $4.02 Nickel Price Received (US$/lb) $8.29 $10.43 $10.23 $10.01 Tropicana Gold Production (koz) Tropicana Gold Production (IGO) Gold Cash Costs (A$/oz) Gold Cash Costs (US$/oz) Gold Price Received (US$/oz) Jaguar/Bentley Zn in Concentrate (kt) 26.8 17.7 14.6 14.6Cu in Concentrate (kt) 9.2 9.0 9.0 8.8Silver in Cu Concentrate (moz) 0.6 0.7 0.8 0.8Zn Cash Costs (US$/lb)** $0.13 ($0.47) ($0.87) ($0.88)**(Net of copper and silver credits) Stockman Zn in Concentrate (kt) 0.0 0.0 0.0 7.5Cu in Concentrate (kt) 0.0 0.0 0.0 10.0Silver in Cu Concentrate (moz) 0.0 0.0 0.0 0.0Zn Cash Costs (US$/lb)** $- $- $- -$4.18 **(Net of copper and silver credits)
Profi t & Loss (A$m) 2010A 2011F 2012F 2013F
Sales Revenue 111.1 161.8 281.2 311.2Other Income 5.6 11.3 10.2 7.5Operating Costs 45.5 74.4 119.1 125.8Exploration Exp. 7.3 9.9 13.9 14.1Corporate/Admin 5.8 19.0 6.1 6.2EBITDA 58.2 69.8 152.3 172.6 Depn & Amort 18.8 22.7 26.3 29.5EBIT 39.4 47.1 126.0 143.1 Interest 0.0 0.0 2.3 2.2 Operating Profi t 39.4 47.1 123.7 140.9 Tax expense 11.7 15.9 37.1 42.3 Abnormal Losses / Minorities 0.6 (1.1) 0.0 0.0 NPAT 27.1 32.4 86.6 98.6 Normalised NPAT 27.8 31.3 86.6 98.6
Cash Flow (A$m) 2010A 2011F 2012F 2013F
Adjusted Net Profi t 27.7 31.3 86.6 98.6 + Interest/Tax/Expl Exp 18.9 25.7 53.3 58.6 - Interest/Tax/Expl Inc 28.1 36.2 62.2 67.3 + Depn/Amort 18.8 22.7 26.3 29.5 +/- Other 0.0 0.0 0.0 0.0 Operating Cashfl ow 37.4 43.5 104.0 119.5 - Capex (+asset sales) 31.1 66.5 120.5 111.6 - Working Capital Increase (15.6) 44.3 0.0 0.0 Free Cashfl ow 21.9 (67.4) (16.5) 7.9 - Dividends (ords) 5.7 14.6 16.1 18.1 + Equity raised 0.5 158.6 0.0 0.0 + Debt drawdown (repaid) 0.0 0.0 (15.0) (40.0)Net Change in Cash 16.7 76.6 (47.5) (50.1)Cash at End Period 144.0 220.6 173.1 122.9 Net Cash/(LT Debt) 144.0 220.6 133.1 122.9
Balance Sheet (A$m) 2010A 2011F 2012F 2013F
Cash 144.0 220.6 173.1 122.9Total Assets 273.5 448.7 571.2 614.8Total Debt 0.0 0.0 40.0 0.0Total Liabilities 58.8 58.6 110.6 73.6Shareholders Funds 214.8 390.1 460.6 541.2Ratios Net Debt/Equity (%) na na na naInterest Cover (x) na na 55.1 65.7Return on Equity (%) 12.6 8.3 18.8 18.2
Exploration13%
Cash (est post raise)14%
Stockman8%
Victor/Long12%
Jaguar/Bentley21%
Tropicana32%
0
2,500
5,000
7,500
10,000
12,500
Nic
kel in
conc
(t)
$0.00
$2.50
$5.00
$7.50
$10.00
$12.50
(US$/l
b)
Nickel in Concentrate Net Nickel Cash Cost (US$/lb)
Nickel Price Received (US$/lb)

MONTHLY STRATEGIC OUTLOOK 37
All information and advice is confi dential and for the private information of the person to whom it is provided and is provided without any responsibility or liability on
any account whatsoever on the part of this fi rm or any member or employee thereof.
Lynas Corporation Limited $1.85 Year End June 30
Valuation A$m A$/sh
Mt Weld 5431 $3.04 Crown Polymetallic 25 $0.01 Kangankunde- Malawi 56 $0.03 Exploration remainder of Mt Weld 0 $- Exploration Crown poly-metallic 5 $0.00 Forwards 0 $- Corporate (191) ($0.11)Unpaid Capital 68 $0.04 Cash 434 $0.24 Debt (212) ($0.12)DCF 5,616 $3.15 @ 10% Discount Rate Price Target 5,616 $3.15
Sensitivities -10% 0% +10%
Rare Earth Prices $2.77 $3.15 $3.52 Neodymium Price $3.01 $3.15 $3.29 A$ : US$ $3.56 $3.15 $2.81
Valuation Summary of Operating Assets
Mt Weld99%
Production Summary
Reserves & Resources
Reserves Mt Grade (%) REO (kt)Mt Weld 2.08 15.5 322Resources Mt Grade (%) REO (kt)Mt Weld - CLD 9.9 10.7 1,057Mt Weld - Duncan 7.6 4.8 366Kangankunde- Malawi 2.5 4.2 107Crown Tantalum & Niobium Deposit 37.7 1.2 437Total 57.7 3.4 1,968
Directors
Name PositionNick Curtis Executive ChairmanDavid Davidson Non Executive DirectorJacob Klein Non Executive DirectorLiam Forde Non Executive Director
Substantial Shareholders Shares (m) %Morgan Stanley 172.9 10.2%Mistsubishi UFJ 170.1 10.0%JP Morgan Chase 76.5 4.5%JP Morgan Asset Mgmt 24.0 1.4%Carmignac Gestion 22.0 1.3%Van Eck Associates 17.6 1.0%General Electric 16.9 1.0%
Commodity Assumptions 2010A 2011F 2012F 2013F
A$:US$ 0.89 0.99 1.02 0.98Mt Weld suite of REO (US$/t) 12976 89625 80908 41318Mt Weld suite of REO (US$/kg) 12.98 89.63 80.91 41.32Lanthanum (US$/kg) 6.62 71.76 69.88 26.51Cerium (US$/kg) 5.39 72.87 67.06 13.25Neodymium (US$/kg) 24.84 130.89 110.76 82.46Praseodymium (US$/kg) 24.64 118.18 107.43 82.46Samarium (US$/kg) 4.09 62.33 50.79 13.99Dyprosium (US$/kg) 155.48 475.87 371.31 338.68Europium (US$/kg) 503.75 936.46 733.24 1531.41Terbium (US$/kg) 449.25 897.64 995.77 1767.01
Production Summary 2010A 2011F 2012F 2013
Lanthanum 0 1,468 4,672Cerium 0 2,691 8,563Neodymium 0 1,065 3,389Praseodymium 0 306 975Samarium 0 131 416Dyprosium 0 7 23Europium 0 26 81Terbium 0 4 12Total REO Production (t) 0 5,758 18,320Cash Cost (US$/kg) $20.25 $18.19 $9.64
Profi t & Loss (A$m) 2010A 2011F 2012F 2013F
Sales Revenue 0.0 0.0 368.1 783.4 Other Income 9.1 13.0 26.2 41.0 Operating Costs 16.4 0.0 77.5 164.0 Exploration Exp. 0.0 0.2 0.0 0.0 Corporate/Admin 9.2 37.6 28.4 28.9 EBITDA (16.5) (24.8) 288.4 631.5 Depn & Amort 1.2 0.0 5.8 18.3 EBIT (17.6) (24.8) 282.7 613.2 Interest 0.0 0.0 21.5 31.9 Operating Profi t (17.6) (24.8) 261.1 581.3 Tax expense 0.0 0.0 0.0 0.0 Minorities 0.0 0.0 0.0 0.0 NPAT (17.6) (24.8) 261.1 581.3 Signifi cant item gains / (losses) (25.4) 0.0 0.0 0.0 Normalised NPAT (43.0) (24.8) 261.1 581.3
Cash Flow (A$m) 2010A 2011F 2012F 2013F
Adjusted Net Profi t (43.0) (24.8) 261.1 581.3 + Interest/Tax/Expl Exp 0.4 0.2 21.6 31.9 - Interest/Tax/Expl Inc 0.7 0.4 21.6 31.9 + Depn/Amort 1.2 0.0 5.8 18.3 +/- Other 0.0 (8.4) 0.0 0.0 Operating Cashfl ow (42.2) (33.4) 266.9 599.6 - Capex (+asset sales) 36.0 218.3 152.8 256.2 - Working Capital Increase (39.3) 0.0 0.0 0.0 Free Cashfl ow (38.8) (251.7) 114.0 343.4 - Dividends (ords & pref) 0.0 0.0 0.0 0.0 + Equity raised 431.5 99.8 0.0 0.0 + Debt drawdown (repaid) 0.0 212.4 152.8 (0.1)Net Change in Cash 388.5 28.7 266.9 343.4 Cash at End Period 405.2 434.0 700.8 1044.2 Net Cash/(Debt) 405.2 221.6 335.6 679.1
Balance Sheet (A$m) 2010A 2011F 2012F 2013F
Cash 405.2 434.0 700.8 1044.2 Total Assets 640.7 889.9 1349.5 2032.1Total Debt 0.0 212.4 365.2 365.1Total Liabilities 21.5 235.1 433.5 534.8Shareholders Funds 619.1 654.8 916.0 1497.3 Ratios Net Debt/Equity (%) na na na naInterest Cover (x) na na 13.1 19.2 Return on Equity (%) na na 28.5 38.8 Gearing (%) (9.2) (189.5) (51.1) (57.8)
0
5000
10000
15000
20000
25000
2010A 2011F 2012F 2013F 2014F$0.00$10.00$20.00$30.00$40.00$50.00$60.00$70.00$80.00$90.00$100.00
(t)
(US$/k
g)
Total REO Production (t) Cash Cost (US$/kg)
Mt Weld suite of REO (US$/kg)

MONTHLY STRATEGIC OUTLOOK 38
All information and advice is confi dential and for the private information of the person to whom it is provided and is provided without any responsibility or liability on
any account whatsoever on the part of this fi rm or any member or employee thereof.
Troy Resources NL $3.80 Year End June 30
Valuation A$m A$/sh
Sandstone 0.0 0.00Andorinhas 73.8 0.80Casposo 243.2 2.63Listed Investments 0.0 0.00Exploration 138.4 1.50Unpaid Capital 11.1 0.12Corporate (13.0) (0.14)Cash (est.) 14.7 0.16Debt (30.0) (0.32)NAV 438 4.74 (@ 8% Discount Rate) Price Target 4.74
Valuation Summary of Operating Assets
Gold Production Summary
Reserves & Resources (as at 30 June 2010)
Reserves (Gold/Silver) Mt Au (g/t) Ag (g/t) Au kozAndorinhas (Brazil) 1.0 7.00 224Casposo (Argentina) 2.0 5.22 171 829Sandstone (Australia) 0.7 1.70 36Total 3.0 5.81 171 1,053Resources (Gold/Silver) Mt Au g/t Ag (g/t) Au kozAndorinhas (Brazil) 2.3 5.1 369Casposo (Argentina) 2.6 5.22 189 1,139Sandstone (Australia) 15.5 1.49 739Total 4.9 5.16 189 1,508Reserve (Iron Ore) Mt Fe% ktAndorinhas (Brazil) 2.8 64% 1.79Total 2.8 1.79Resources (Iron Ore) Mt Fe% ktAndorinhas (Brazil) 6.5 51% 3.30Total 6.5 3.30
Directors
Name PositionDavid Dix Non-Executive ChairmanPaul Benson CEO & MDKen Nilsson Executive DirectorFred Grimwade Non-Executive DirectorRobin Parish Non-Executive DirectorJohn Jones Non-Executive DirectorGordon Chambers Non-Executive Director Substantial Shareholders Shares (m) %Warrigal Pty Ltd 6.0 9%John Jones & Ass. 3.5 5%Robin Parish 3.8 5%Fidelity 3.5 5%Top 20 34%
Commodity Assumptions 2010A 2011F 2012F 2013F
A$:US$ 0.89 0.99 1.02 0.98Gold (US$/oz) 1093 1369 1523 1537Silver (US$/oz) 17.28 28.71 36.30 36.14Gold (A$/oz) 1222 1387 1490 1577Silver (A$/oz) 19.33 29.09 35.50 37.07
Sensitivity +0% +10% Delta 10%
A$:US$ 4.74 4.30 -9% Gold Price 4.74 5.24 11% Silver Price 4.74 4.84 2% Operating Costs 4.74 4.60 -3% Grade 4.74 5.16 9%
Production Summary 2010A 2011F 2012F 2013F
Gold production (koz) Sandstone 30 5 0 0Andorinhas 32 49 50 50Casposo 0 16 80 89Total Production 61 70 130 139
Silver Production (koz) Casposo (Ag) 0 212 547 775Casposo (Au.eq) 0 4 13 18Total Production Au.eq (Koz) 61 75 143 157
Cost summary Wtd Ave Cash Costs (US$/oz) 808 489 316 302Wtd Ave Cash Costs (A$/oz) 904 496 309 309Wtd Ave Total Costs (A$/oz) 1,113 863 651 648Realised price (A$/oz) 1,215 1,391 1,490 1,579
Profi t & Loss (A$m) 2010A 2011F 2012F 2013F
Sales Revenue 75.2 110.4 213.0 247.9 Other Income 6.2 0.6 1.8 5.7 Operating Costs 60.1 45.2 59.6 71.7 Exploration Exp. 7.0 5.7 15.2 6.7 Corporate/Admin 13.3 9.7 9.1 9.3 EBITDA 1.1 50.3 130.9 166.0 Depn & Amort 7.9 21.4 44.4 47.0 EBIT (6.8) 28.9 86.5 119.0 Interest 0.1 2.4 1.8 0.9 Operating Profi t (6.9) 26.5 84.7 118.2 Tax expense (0.1) 7.2 28.2 39.4 Abnormals 0.0 0.0 0.0 0.0 Minorities (0.1) 0.0 0.0 0.0 NPAT (6.9) 19.3 56.5 78.8 Normalised NPAT (4.9) 18.5 59.3 82.7
Cash Flow (A$m) 2010A 2011F 2012F 2013F
Adjusted Net Profi t (4.6) 17.7 56.5 78.8 + Interest/Tax/Expl Exp 7.0 15.1 45.2 46.9 - Interest/Tax/Expl Inc 6.9 15.1 45.2 46.9 + Depn/Amort 7.9 21.4 44.4 47.0 +/- Other 0.0 0.0 0.0 0.0 Operating Cashfl ow 3.4 39.0 100.9 125.7 - Capex (+asset sales) 43.3 41.5 16.1 18.0 - Working Capital Increase 6.2 25.6 0.0 0.0 Free Cashfl ow (46.1) (28.1) 84.8 107.8 - Dividends (ords & pref) 4.4 5.2 7.0 7.0 + Equity raised 26.0 0.0 0.0 0.0 + Debt drawdown (repaid) 4.3 28.7 (8.8) (21.3) Net Change in Cash (21.2) (1.7) 69.0 79.5 Cash at End Period 16.4 14.7 83.7 163.2 Net Cash/(LT Debt) 15.1 (15.3) 62.5 163.2
Balance Sheet (A$m) 2010A 2011F 2012F 2013F
Cash 16.4 14.7 83.7 163.2Total Assets 150.8 191.0 231.7 276.9Total Debt 1.3 30.0 21.3 0.0Total Liabilities 21.6 49.6 40.8 14.0Shareholders Funds 129.2 141.4 190.9 262.8 Ratios Net Debt/Equity (%) na 10.8 na naInterest Cover (x) na 11.9 49.4 135.9Return on Equity (%) na 13.6 29.6 30.0
Casposo
77%
Andorinhas23%
0
25
50
75
100
125
150
175
2009A 2010A 2011F 2012F 2013F 2014F 2015F 2016F-600
-400
-200
0
200
400
600
800
1000
1200
Andorinhas SandstoneCasposo Casposo Silver (Au.eq)Wtd Ave Cash Costs (A$/oz)

MONDAY 20 APRIL 2009
All information and advice is confi dential and for the private information of the person to whom it is provided and is provided without any responsibility or liability on
any account whatsoever on the part of this fi rm or any member or employee thereof.
MONTHLY STRATEGIC OUTLOOK 39
WDC’s share price has been on a downward trajectory since January, having fallen roughly 20% from its $10.00 level. Previously we
have been quite vocal about our view that WDC was expensive, however given the recent fall we now examine whether the current
share price is justifi ed.
The two main factors impacting WDC negatively at present are the rise in the AUD/USD and the deterioration in the domestic retail
sector.
Since January the AUD has appreciated 10% versus the USD. WDC has roughly half of its assets in the US which means its earnings
and NTA will be negatively impacted by a rise in the AUD/USD. This impact however will be lessened by US gearing and additional
hedging. We estimate the recent rise in the AUD/USD will lead to a 1-2% drop in operating earnings and NTA, hardly a major worry.
Figure 1: AUD/USD Figure 2:WDC Asset Value $bn (AUD Constant)
Source: Patersons Source: Patersons
Of more concern is the rapid deterioration in the domestic retail sector, although the effect could have been worse if it weren’t for
the recent divestment into WRT.
While a drop off in government stimulus and higher interest rates have been a major cause of retail sector deterioration, we also note
the rapid increase in shoppers using online retail, particularly from offshore given the higher AUD/USD. Recent surveys have shown
that 70% of shoppers are now shopping online and mostly from overseas retailers.
We believe the Australian retail sector is undergoing a structural shift which will lead to lower retail occupancy levels and retail growth,
and ultimately lower demand for retail space. Recent data (Figure 4) shows an increase in vacancy rates to support this view, and the
recent Productivity Commission Inquiry into the Retail Sector forecasts (Figures 5, 6) lower sales growth over the next fi ve years.
Figure 3: Retail shopper sentiment Figure 4: Retail Vacancy Rates
Source: SMH Source: AFR 21 July 11
Jonathan Kriska - REIT Analyst
IS WESTFIELD’S CURRENT SHARE PRICE JUSTIFIED?
AUGUST 2011
REITs
0.90
0.92
0.94
0.96
0.98
1.00
1.02
1.04
1.06
1.08
1.10
1.12
January February March April May June July
0%
10%
20%
30%
40%
50%
60%
70%
80%
90%
100%
1H06 2H06 1H07 2H07 1H08 2H08 1H09 2H09 1H10 2H10
Australia New Zealand United States United Kingdom

All information and advice is confi dential and for the private information of the person to whom it is provided and is provided without any responsibility or liability on
any account whatsoever on the part of this fi rm or any member or employee thereof.
MONTHLY STRATEGIC OUTLOOK 40
Figure 5: Australian Food & Liquor Sales Growth (pa) Figure 6: Australian Non- Food Sales Growth (pa)
Source: Productivity Commission Inquiry into the Retail Sector Source: Productivity Commission Inquiry into the Retail Sector
So far WDC’s domestic portfolio remains robust. The
group reported an unchanged 99.5% occupancy in 1Q11,
and the last reported rental growth numbers in December
were 4.0%. However these numbers typically lag what goes
on at the retailer level and so we expect deterioration in
these numbers in future reporting seasons.
It’s also fair to assume that if occupancy falls property values
could also fall. For the past 10 years the retail sector has
been the darling of the REIT sector. However we believe
cap rates on Australian retail assets are too low given the
current state of the retail sector, and it’s therefore possible
we will see slight falls in retail and WDC’s assets in coming
years.
At current levels WDC offers investors a 6.2% yield and trades at an 11% premium to its NTA. Fundamentally we see no reason for
passive REITs like WDC to trade much beyond their NTA. Yes we acknowledge the fact that it’s the largest REIT in the world and
therefore is a proxy for Australian property for global fund managers, and Yes we appreciate that WDC can add value by its internal
development (which goes some way to explaining why 10 of the 13 analysts covering the stock have a BUY recommendation with
an average price target of $9.70). However let’s examine what investors currently get. The yield is far from compelling, as is the
pedestrian eps growth of 6%, and it trades at a premium to its NTA.
WDC’s new strategy of divesting full stakes into joint venture arrangements, like it did with WRT, makes sense and may drive
improved earnings growth into new markets like continental Europe. However this strategy has only been partly executed with the
U.S. portfolio still to be sold down.
WDC’s earnings yield of 8.8% also looks attractive and indicates it could provide a much better yield if it were to lift its payout ratio.
However this looks unlikely given its expansion plans and desire to benchmark its payout ratio against U.S. peers.
Clearly an improvement in the US economy and appreciation of the USD would also be positive for WDC but recent economic data
out of the US suggest things are getting worse, not better.
Therefore WDC looks set for a continuation of weak US occupancy and rental growth, with deteriorating domestic occupancy and
rental growth, and possibly slight falls in the value of its domestic assets. As a result we believe the current share price is justifi ed and
see little reason for investors to either BUY or SELL the stock at present. We will be closely monitoring their August result portfolio
data, AUD/USD, US economy, and domestic retail sentiment in determining our future view on the stock.
WRT
One quick word on WRT, which of course was formed in 2010 and has a 50% ownership of WDC’s Australian and New Zealand
assets. Clearly the AUD/USD has no impact but the state of domestic retail has more of an impact. While its plausible to expect
a slight reduction in NTA going forward WRT’s current 18% discount to NTA and better yield of 6.7% more than compensates
investors at present. Accordingly we maintain our BUY recommendation on the stock.
Figure 7: Australian Commercial Property Cap Rates
Source: Patersons
0%
2%
4%
6%
8%
10%
12%
1985 1987 1989 1991 1993 1995 1997 1999 2001 2003 2005 2007 2009 2011
Industrial
Retail
Off ice

All information and advice is confi dential and for the private information of the person to whom it is provided and is provided without any responsibility or liability on
any account whatsoever on the part of this fi rm or any member or employee thereof.
MONTHLY STRATEGIC OUTLOOK 41
HIGHLIGHTED STOCKS
SECTOR WEIGHTING Index Weight
COMPANY RECOMMENDATION COMMENT
Aspen Group (APZ) BUY APZ is ideal for total return investors with a more aggressive risk profi le. The group derives
circa 45% of its earnings from WA commercial property and so is a good play on the
strength of the WA economy. There is also above average potential for earnings growth
given the retail funds management platform. The group is in a sound debt position having
been recapitalized. The stock is trading ~30% discount to its NTA and also provides a very
attractive yield of ~10%.
BWP Trust (BWP) BUY With low gearing and long leases to Wesfarmers BWP has traditionally been one of the
most defensive REITs. That certainly was the case during the last credit crisis. Late last year
BWP made an acquisition that we and the market did not like, given it was slightly dilutive.
However we believe the subsequent weakness in the share price provides a good entry
position. Current yield of 7.7%, 10% discount to NTA.
Challenger Diversifi ed
Property Group (CDI)
BUY CDI is ideal for defensive yield orientated investors. The balance sheet is in good shape post
the recapitalization. Earnings are all based on rent and only 8% of the portfolio is exposed
to offshore French assets. However these have already been written down by 25% and will
be sold shortly. While FY11 guidance is lower due to some vacancy we expect upside to this
given managements conservative estimates. The current yield of 7.8% and 20% discount
to NTA are compelling.
Your Personal Financial OutlookPatersons national seminar series commences 22 August.
Hear a market update from our expert in world financial markets, plus the latest in
superannuation news and strategies.
Join our Economist Tony Farnham to hear Patersons outlook on the sharemarket and
our superannuation specialist Stephen Blackhall to discover how you can maximise your
superannuation by taking full advantage of all the generous concessions that are available by
investing through your super fund.
If you have, or are considering a self managed superannuation fund, this is an event you will not
want to miss.
Proudly sponsored by
T H E AU ST R AL I A N STO C KB RO KE R
Patersons Securities Limited ABN 69 008 896 311 AFSL No. 239 052
Visit psl.com.au to register today.

MONTHLY STRATEGIC OUTLOOK 42
All information and advice is confi dential and for the private information of the person to whom it is provided and is provided without any responsibility or liability on
any account whatsoever on the part of this fi rm or any member or employee thereof.
Year End June 30
Profi t & Loss ($m) 2010A 2011F 2012F 2013F
Property NOI 34.9 35.9 34.1 35.4Funds Management 22.3 28.6 33.3 35.1Operating Expenses (16.8) (17.1) (18.1) (19.1)EBITDA 40.4 47.4 49.3 51.4Depn & Ammort 0.0 0.0 0.0 0.0EBIT 40.4 47.4 49.3 51.4Net Interest (12.2) (14.4) (12.3) (12.4)Asset Sales 0.00 (0.12) 0.00 0.00Unrealised gains (12.1) 1.9 0.0 0.0Profi t Before Tax 5.7 24.7 37.0 39.0Tax expense 6.8 2.3 (0.4) (0.4)Minority Interests 0.0 0.0 0.0 0.0NPAT (Reported) 12.6 27.0 36.6 38.6NPAT (Adjusted) 33.6 35.7 36.6 38.6
Balance Sheet ($m) 2010A 2011F 2012F 2013F
Cash 4.4 36.8 8.8 7.2Derivatives 3.8 2.8 2.8 2.8Fund Loans 76.5 94.1 94.1 94.1Investment Properties 379.2 299.8 392.8 401.0Investments 44.6 48.4 44.1 49.9Associates 83.1 61.1 79.1 79.1Intangibles 6.0 5.9 5.9 5.9Other Assets 49.3 42.9 52.9 52.8Total Assets 646.9 591.8 680.5 692.8Interest Bearing Liabilities 225.3 171.6 230.5 230.5Derivatives 3.8 2.8 2.8 2.8Other liabilities 29.2 28.5 28.5 28.5Total Liabilities 258.3 202.9 261.8 261.8 Minority Interests 0.0 0.0 0.0 0.0Shareholders Funds 388.6 388.9 418.7 431.0
EPS/DPS 2010A 2011F 2012F 2013F
EPU (Reported) 2.3 4.7 6.4 6.8EPU (Adjusted) 6.0 6.2 6.4 6.8EPS growth (%) (49.3) 3.4 2.5 5.5 DPS 4.2 4.2 4.5 4.7AFFO 5.0 (0.4) (9.9) 5.3Payout Ratio (%) 69.5 67.2 70.0 70.0DPS growth (%) (53.3) 0.0 6.7 5.5Distribution Yield (%) 9.7 9.7 10.3 10.9
Ratios 2010A 2011F 2012F 2013F
Profi tability Revenue Growth (%) (1.1) 12.8 4.4 4.6NPAT Growth (%) 1.3 6.1 2.5 5.5ROA (%) 5.2 6.0 5.4 5.6ROE (%) 8.7 9.2 8.7 9.0Tax Rate (%) (20.4) (6.6) 1.0 1.0 Valuation Price/Earnings (x) 7.2 7.0 6.8 6.4EV/EBITDA (x) 11.7 8.1 9.5 9.2Price/NTA (%) (34.1) (35.1) (39.8) (41.5) Balance Sheet Net Debt/Equity (%) 56.8 34.7 53.0 51.8Net Debt/Assets (%) 34.1 22.8 32.6 32.2Interest Cover (x) 3.3 3.3 4.0 4.2NTA ($/share) 0.66 0.67 0.72 0.74Shares (m) 580.0 571.5 571.5 571.5
Cash Flow ($m) 2010A 2011F 2012F 2013F
Operating Cashfl ow 31.1 27.9 30.9 33.0Capex (6.0) (37.9) (93.0) (8.2)Disposals 0.1 117.4 0.0 0.0Acquisitions (36.8) (7.1) 0.0 0.0Other 0.0 0.0 0.0 0.0Investing Cashfl ow (42.7) 72.4 (93.0) (8.2)Equity Raised 0.0 0.0 0.0 0.0Increase (Repay) Debt 33.8 (53.7) 58.9 0.0Distributions Paid (23.3) (19.5) (24.8) (26.3)Other 0.9 5.2 0.0 0.0Financing Cashfl ow 11.3 (67.9) 34.1 (26.3)Net change in Cash Held (0.2) 32.4 (28.0) (1.5)Closing Cash Balance 4.4 36.8 8.8 7.2Op CF/Dividend (%) 75.0 69.9 80.3 79.8
Divisional EBIT ($m)
Board of Directors & Sub. Shareholders
Name PositionReginald Norman Gillard ChairmanGavin R Hawkins Managing Director/CEOTerry Budge Non-Executive DirectorMatthew McCann Non-Executive DirectorFrank Zipfi nger Non-Executive Director Shareholder %Orbis 8.3%CBA 3.6%Paradice Investment 6.2%Entrust 5.0%Acorn 4.9% Subtotal 28.0%
Valuation
NAV DCF Current Cap rate 9.4% Beta 0.9 Assumed Cap rate 9.4% WACC 9.2%Corporate EBIT 8x
Valuation: $0.74 Valuation: $0.41
Aspen Group $0.44
-
5.0
10.0
15.0
20.0
25.0
30.0
35.0
40.0
2008A 2009A 2010A 2011FProperty NOI Corporate EBIT

MONTHLY STRATEGIC OUTLOOK 43
All information and advice is confi dential and for the private information of the person to whom it is provided and is provided without any responsibility or liability on
any account whatsoever on the part of this fi rm or any member or employee thereof.
Cash Flow ($m) 2010A 2011F 2012F 2012F
Operating Cashfl ow 48.3 58.2 70.0 74.7Capex (5.8) (3.4) (1.4) (1.4)Disposals 0.0 7.4 0.0 0.0Acquisitions 0.0 (267.1) 0.0 0.0Other 0.0 0.0 0.0 0.0Investing Cashfl ow (5.8) (263.1) (1.4) (1.4)Equity Raised 0.0 150.0 0.0 0.0Increase (Repay) Debt (32.5) 91.1 0.0 0.0Distributions Paid (27.2) (33.6) (48.6) (54.4)Other 0.1 0.0 0.0 0.0Financing Cashfl ow (59.6) 207.5 (48.6) (54.4)Net change in Cash Held (17.0) 2.6 20.0 18.8Closing Cash Balance 21.7 24.3 44.3 63.2Op CF/Dividend (%) 56.3 57.6 69.4 72.9
Dividends (Cents)
Valuation
NAV DCF Current Cap rate 7.62% Beta 0.70 Assumed Cap rate 7.62% WACC 9.0% Valuation: $1.96 Valuation: $1.75
Overview
Bunnings Warehouse Property Trust (BWP) is focused on bulky goods retailing properties, in particular, Bunnings Warehouses. Board of Directors John Austin Non-Executive DirectorPeter Mansell Non-Executive DirectorPeter Johnston Non-Executive DirectorRichard Higgins Non-Executive Director Substantial Shareholders %Wesfarmers 23.1%ING 5.3%CBA 3.6% Subtotal 32.0%
Profi t & Loss ($m) 2010A 2011F 2012F 2013F
Property NOI 73.2 77.4 94.8 99.0EBITDA 69.0 73.1 90.4 93.9Depn & Ammort 0.0 0.0 0.0 0.0EBIT 69.0 73.1 90.4 93.9Net Interest (18.6) (17.1) (20.4) (19.2)Asset Sales 0.00 0.00 0.00 0.00Unrealised gains 41.8 28.2 0.0 0.0Profi t Before Tax 92.2 84.2 70.0 74.7Tax expense 0.0 0.0 0.0 0.0Minority Interests 0.0 0.0 0.0 0.0NPAT (Reported) 92.2 84.2 70.0 74.7NPAT (Adjusted) 50.4 56.0 70.0 74.7
Balance Sheet ($m) 2010A 2011F 2012F 2013F
Assets Cash 21.7 24.3 44.3 63.2Receivables 4.1 3.2 3.2 3.2Inventories 0.0 0.0 0.0 0.0Property, plant, equipment 0.0 0.0 0.0 0.0Investment Properties 1000.1 1298.0 1299.4 1300.8Derivatives 0.5 2.7 2.7 2.7Equity Accounted Assets 0.0 0.0 0.0 0.0Intangibles 0.0 0.0 0.0 0.0Other Assets 0.0 0.0 0.0 0.0Total Assets 1026.4 1328.2 1349.6 1369.8 Liabilities Interest Bearing Liabilities 193.5 284.6 284.6 284.6Other liabilities 40.1 46.0 46.0 46.0Total Liabilities 233.6 330.5 330.5 330.5 Minority Interests 0.0 0.0 0.0 0.0Shareholders Funds 792.8 997.7 1019.1 1039.3
EPS/DPS 2010A 2011F 2012F 2013F
EPU (Reported) 22.2 17.9 13.4 14.0EPU (Adjusted) 12.1 11.9 13.4 14.0EPS growth (%) (6.3) (1.8) 12.1 4.9 DPS 12.1 11.9 13.4 14.0AFFO 10.2 11.6 13.1 13.7Payout Ratio (%) 100.0 100.0 100.0 100.0DPS growth (%) 4.4 (1.4) 12.1 4.9Distribution Yield (%) 7.0 6.9 7.7 8.1
Ratios 2010A 2011F 2012F 2013F
Profi tability NOI Growth (%) 6.6 5.7 22.6 4.4NPAT Growth (%) 24.6 11.1 24.9 6.7ROA (%) 4.9 4.2 5.2 5.5ROE (%) 6.4 5.6 6.9 7.2Tax Rate (%) 0.0 0.0 0.0 0.0 Valuation Price/Earnings (x) 14.3 14.6 13.0 12.4EV/EBITDA (x) 13.1 15.9 12.8 12.3Price/NTA (%) (7.9) (9.6) (10.1) (10.1) Balance Sheet Net Debt/Equity (%) 21.7 26.1 23.6 21.3Net Debt/Assets (%) 16.7 19.6 17.8 16.2Interest Cover (x) 3.7 4.3 4.4 4.9NTA ($/share) 1.88 1.92 1.93 1.93Shares (m) 420.7 520.0 528.1 538.2
Year End June 30BWP Trust $1.74
10.5
11.0
11.5
12.0
12.5
13.0
13.5
FY08 FY09 FY10 FY11 FY12
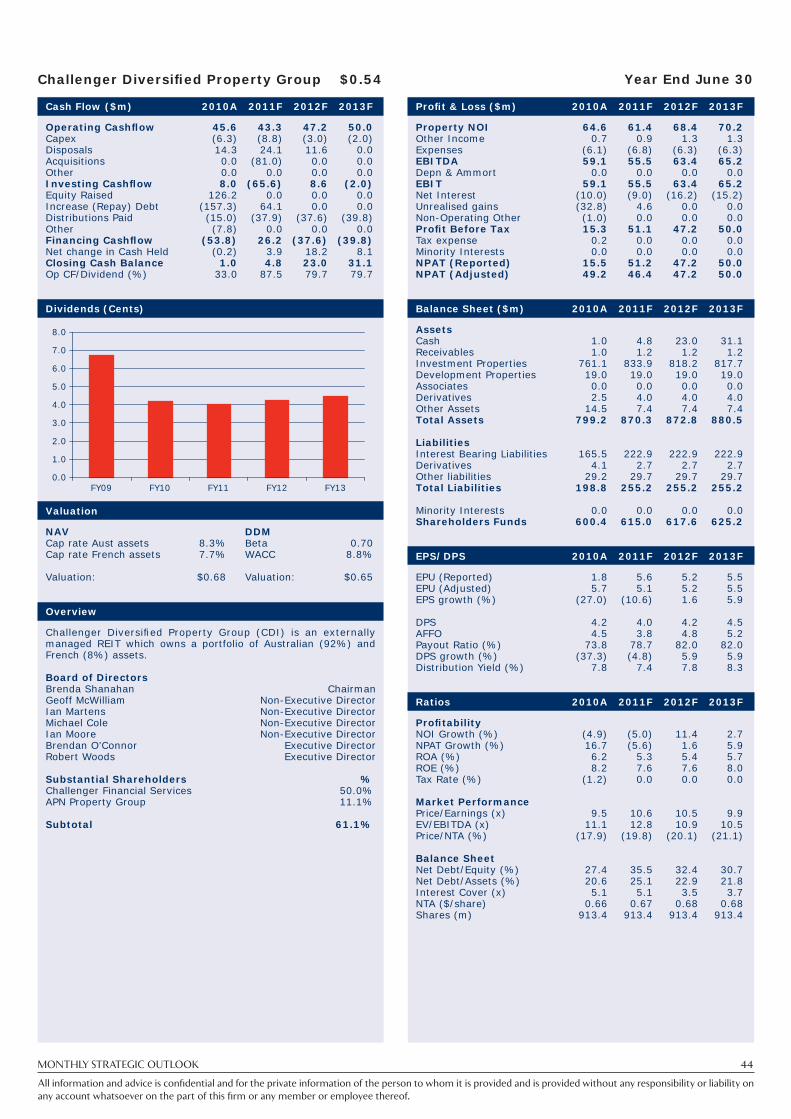
MONTHLY STRATEGIC OUTLOOK 44
All information and advice is confi dential and for the private information of the person to whom it is provided and is provided without any responsibility or liability on
any account whatsoever on the part of this fi rm or any member or employee thereof.
Profi t & Loss ($m) 2010A 2011F 2012F 2013F
Property NOI 64.6 61.4 68.4 70.2Other Income 0.7 0.9 1.3 1.3Expenses (6.1) (6.8) (6.3) (6.3)EBITDA 59.1 55.5 63.4 65.2Depn & Ammort 0.0 0.0 0.0 0.0EBIT 59.1 55.5 63.4 65.2Net Interest (10.0) (9.0) (16.2) (15.2)Unrealised gains (32.8) 4.6 0.0 0.0Non-Operating Other (1.0) 0.0 0.0 0.0Profi t Before Tax 15.3 51.1 47.2 50.0Tax expense 0.2 0.0 0.0 0.0Minority Interests 0.0 0.0 0.0 0.0NPAT (Reported) 15.5 51.2 47.2 50.0NPAT (Adjusted) 49.2 46.4 47.2 50.0
Balance Sheet ($m) 2010A 2011F 2012F 2013F
Assets Cash 1.0 4.8 23.0 31.1Receivables 1.0 1.2 1.2 1.2Investment Properties 761.1 833.9 818.2 817.7Development Properties 19.0 19.0 19.0 19.0Associates 0.0 0.0 0.0 0.0Derivatives 2.5 4.0 4.0 4.0Other Assets 14.5 7.4 7.4 7.4Total Assets 799.2 870.3 872.8 880.5 Liabilities Interest Bearing Liabilities 165.5 222.9 222.9 222.9Derivatives 4.1 2.7 2.7 2.7Other liabilities 29.2 29.7 29.7 29.7Total Liabilities 198.8 255.2 255.2 255.2 Minority Interests 0.0 0.0 0.0 0.0Shareholders Funds 600.4 615.0 617.6 625.2
EPS/DPS 2010A 2011F 2012F 2013F
EPU (Reported) 1.8 5.6 5.2 5.5EPU (Adjusted) 5.7 5.1 5.2 5.5EPS growth (%) (27.0) (10.6) 1.6 5.9 DPS 4.2 4.0 4.2 4.5AFFO 4.5 3.8 4.8 5.2Payout Ratio (%) 73.8 78.7 82.0 82.0DPS growth (%) (37.3) (4.8) 5.9 5.9Distribution Yield (%) 7.8 7.4 7.8 8.3
Ratios 2010A 2011F 2012F 2013F
Profi tability NOI Growth (%) (4.9) (5.0) 11.4 2.7NPAT Growth (%) 16.7 (5.6) 1.6 5.9ROA (%) 6.2 5.3 5.4 5.7ROE (%) 8.2 7.6 7.6 8.0Tax Rate (%) (1.2) 0.0 0.0 0.0 Market Performance Price/Earnings (x) 9.5 10.6 10.5 9.9EV/EBITDA (x) 11.1 12.8 10.9 10.5Price/NTA (%) (17.9) (19.8) (20.1) (21.1) Balance Sheet Net Debt/Equity (%) 27.4 35.5 32.4 30.7Net Debt/Assets (%) 20.6 25.1 22.9 21.8Interest Cover (x) 5.1 5.1 3.5 3.7NTA ($/share) 0.66 0.67 0.68 0.68Shares (m) 913.4 913.4 913.4 913.4
Year End June 30Challenger Diversifi ed Property Group $0.54
Cash Flow ($m) 2010A 2011F 2012F 2013F
Operating Cashfl ow 45.6 43.3 47.2 50.0Capex (6.3) (8.8) (3.0) (2.0)Disposals 14.3 24.1 11.6 0.0Acquisitions 0.0 (81.0) 0.0 0.0Other 0.0 0.0 0.0 0.0Investing Cashfl ow 8.0 (65.6) 8.6 (2.0)Equity Raised 126.2 0.0 0.0 0.0Increase (Repay) Debt (157.3) 64.1 0.0 0.0Distributions Paid (15.0) (37.9) (37.6) (39.8)Other (7.8) 0.0 0.0 0.0Financing Cashfl ow (53.8) 26.2 (37.6) (39.8)Net change in Cash Held (0.2) 3.9 18.2 8.1Closing Cash Balance 1.0 4.8 23.0 31.1Op CF/Dividend (%) 33.0 87.5 79.7 79.7
Dividends (Cents)
Valuation
NAV DDM Cap rate Aust assets 8.3% Beta 0.70 Cap rate French assets 7.7% WACC 8.8% Valuation: $0.68 Valuation: $0.65
Overview
Challenger Diversifi ed Property Group (CDI) is an externally managed REIT which owns a portfolio of Australian (92%) and French (8%) assets. Board of Directors Brenda Shanahan ChairmanGeoff McWilliam Non-Executive DirectorIan Martens Non-Executive DirectorMichael Cole Non-Executive DirectorIan Moore Non-Executive DirectorBrendan O’Connor Executive DirectorRobert Woods Executive Director Substantial Shareholders %Challenger Financial Services 50.0%APN Property Group 11.1% Subtotal 61.1%
0.0
1.0
2.0
3.0
4.0
5.0
6.0
7.0
8.0
FY09 FY10 FY11 FY12 FY13

MONDAY 20 APRIL 2009
All information and advice is confi dential and for the private information of the person to whom it is provided and is provided without any responsibility or liability on
any account whatsoever on the part of this fi rm or any member or employee thereof.
MONTHLY STRATEGIC OUTLOOK 45
HIGHLIGHTED STOCKS
SECTOR WEIGHTING Under Weight
COMPANY RECOMMENDATION COMMENT
JB Hi-Fi Ltd ( JBH) BUY Reported 16% NPAT growth for 1H11 despite a subdued and highly competitive retail
environment. Capable of growing very strongly until 2015.
… Both the upturns and downturns in any typical economic cycle.
In fact the category which is the fi rst to show signs of improvement is the one known as “clubs, hotels and licensed premises”.
Intuitively, it makes sense, consumers experience greater disposable income from: new employment; wage increases; tax reductions;
or increases in assets that can be leveraged; etc. So they celebrate fi rst.
Then when the greater disposable income becomes a more permanent feature they increasingly purchase more durable goods,
initially from department stores.
So department stores like to think of themselves of being the harbingers of both the upturns and downturns in typical economic
cycles.
However, back in January 2011, MYR was at a loss to explain where 10% of its customers vanished.
Our previous analysis (reported subsequently in this report June 2011) highlighted that more consumers than ever before were fl ying
away from Australia on holidays – 800,000 more passengers who typically spend $6,1117 per person, equivalent to AUD$4.9 billion.
Also, our previous analysis (subsequently reported in this report May 2011) highlighted the growth in on-line spending, especially to
off-shore sites, equivalent to AUD$1.25 billion.
Department stores are at serious risk from both these phenomena plus the increase in the savings ratio.
We can also argue that these factors constitute secular, rather than cyclical, change.
On 13 July 2011, DJS advised that it had been experiencing a decline in sales of approximately 11% during the July quarter- with some
days being down as much as 23% on last year. It also indicated it was equally fearful about these same sales conditions continuing
into the fi rst half 2012.
Under these retail conditions it would be inappropriate to own retail stocks unless there were compelling reasons otherwise to do so.
Only two stocks fi t such criteria – both have stronger new store roll-outs than any potential organic sales declines: JBH and TRS.
JBH is also our only highlighted stock in the retail sector.
Russell Wright - Retail Analyst
RETAILERS ARE THE FIRST TO EXPERIENCE…
AUGUST 2011
Retail
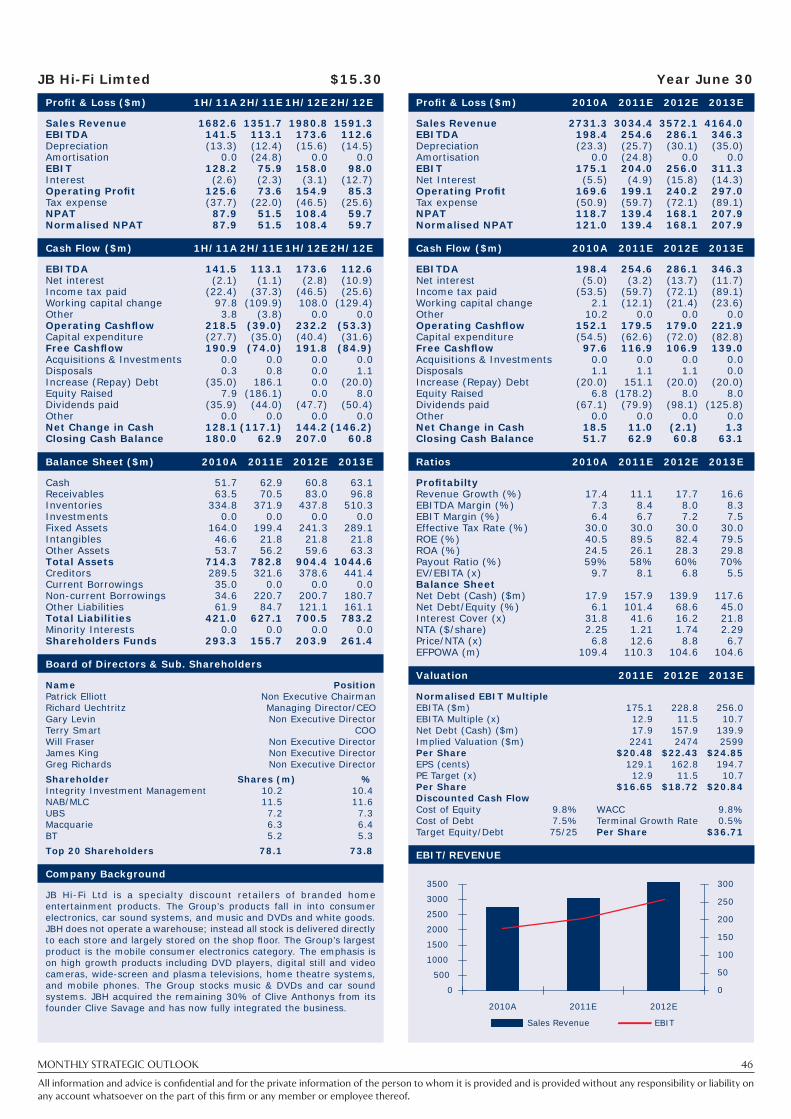
MONTHLY STRATEGIC OUTLOOK 46
All information and advice is confi dential and for the private information of the person to whom it is provided and is provided without any responsibility or liability on
any account whatsoever on the part of this fi rm or any member or employee thereof.
Year June 30JB Hi-Fi Limted $15.30
Profi t & Loss ($m) 1H/11A 2H/11E 1H/12E 2H/12E
Sales Revenue 1682.6 1351.7 1980.8 1591.3EBITDA 141.5 113.1 173.6 112.6Depreciation (13.3) (12.4) (15.6) (14.5)Amortisation 0.0 (24.8) 0.0 0.0EBIT 128.2 75.9 158.0 98.0Interest (2.6) (2.3) (3.1) (12.7)Operating Profi t 125.6 73.6 154.9 85.3Tax expense (37.7) (22.0) (46.5) (25.6)NPAT 87.9 51.5 108.4 59.7Normalised NPAT 87.9 51.5 108.4 59.7
Cash Flow ($m) 1H/11A 2H/11E 1H/12E 2H/12E
EBITDA 141.5 113.1 173.6 112.6Net interest (2.1) (1.1) (2.8) (10.9)Income tax paid (22.4) (37.3) (46.5) (25.6)Working capital change 97.8 (109.9) 108.0 (129.4)Other 3.8 (3.8) 0.0 0.0Operating Cashfl ow 218.5 (39.0) 232.2 (53.3)Capital expenditure (27.7) (35.0) (40.4) (31.6)Free Cashfl ow 190.9 (74.0) 191.8 (84.9)Acquisitions & Investments 0.0 0.0 0.0 0.0Disposals 0.3 0.8 0.0 1.1Increase (Repay) Debt (35.0) 186.1 0.0 (20.0)Equity Raised 7.9 (186.1) 0.0 8.0Dividends paid (35.9) (44.0) (47.7) (50.4)Other 0.0 0.0 0.0 0.0Net Change in Cash 128.1 (117.1) 144.2 (146.2)Closing Cash Balance 180.0 62.9 207.0 60.8
Balance Sheet ($m) 2010A 2011E 2012E 2013E
Cash 51.7 62.9 60.8 63.1Receivables 63.5 70.5 83.0 96.8Inventories 334.8 371.9 437.8 510.3Investments 0.0 0.0 0.0 0.0Fixed Assets 164.0 199.4 241.3 289.1Intangibles 46.6 21.8 21.8 21.8Other Assets 53.7 56.2 59.6 63.3Total Assets 714.3 782.8 904.4 1044.6Creditors 289.5 321.6 378.6 441.4Current Borrowings 35.0 0.0 0.0 0.0Non-current Borrowings 34.6 220.7 200.7 180.7Other Liabilities 61.9 84.7 121.1 161.1Total Liabilities 421.0 627.1 700.5 783.2Minority Interests 0.0 0.0 0.0 0.0Shareholders Funds 293.3 155.7 203.9 261.4
Board of Directors & Sub. Shareholders
Name PositionPatrick Elliott Non Executive ChairmanRichard Uechtritz Managing Director/CEOGary Levin Non Executive DirectorTerry Smart COOWill Fraser Non Executive DirectorJames King Non Executive DirectorGreg Richards Non Executive Director
Shareholder Shares (m) %Integrity Investment Management 10.2 10.4NAB/MLC 11.5 11.6UBS 7.2 7.3Macquarie 6.3 6.4BT 5.2 5.3
Top 20 Shareholders 78.1 73.8
Company Background
JB Hi-Fi Ltd is a specialty discount retailers of branded home entertainment products. The Group’s products fall in into consumer electronics, car sound systems, and music and DVDs and white goods. JBH does not operate a warehouse; instead all stock is delivered directly to each store and largely stored on the shop fl oor. The Group’s largest product is the mobile consumer electronics category. The emphasis is on high growth products including DVD players, digital still and video cameras, wide-screen and plasma televisions, home theatre systems, and mobile phones. The Group stocks music & DVDs and car sound systems. JBH acquired the remaining 30% of Clive Anthonys from its founder Clive Savage and has now fully integrated the business.
Profi t & Loss ($m) 2010A 2011E 2012E 2013E
Sales Revenue 2731.3 3034.4 3572.1 4164.0EBITDA 198.4 254.6 286.1 346.3Depreciation (23.3) (25.7) (30.1) (35.0)Amortisation 0.0 (24.8) 0.0 0.0EBIT 175.1 204.0 256.0 311.3Net Interest (5.5) (4.9) (15.8) (14.3)Operating Profi t 169.6 199.1 240.2 297.0Tax expense (50.9) (59.7) (72.1) (89.1)NPAT 118.7 139.4 168.1 207.9Normalised NPAT 121.0 139.4 168.1 207.9
Cash Flow ($m) 2010A 2011E 2012E 2013E
EBITDA 198.4 254.6 286.1 346.3Net interest (5.0) (3.2) (13.7) (11.7)Income tax paid (53.5) (59.7) (72.1) (89.1)Working capital change 2.1 (12.1) (21.4) (23.6)Other 10.2 0.0 0.0 0.0Operating Cashfl ow 152.1 179.5 179.0 221.9Capital expenditure (54.5) (62.6) (72.0) (82.8)Free Cashfl ow 97.6 116.9 106.9 139.0Acquisitions & Investments 0.0 0.0 0.0 0.0Disposals 1.1 1.1 1.1 0.0Increase (Repay) Debt (20.0) 151.1 (20.0) (20.0)Equity Raised 6.8 (178.2) 8.0 8.0Dividends paid (67.1) (79.9) (98.1) (125.8)Other 0.0 0.0 0.0 0.0Net Change in Cash 18.5 11.0 (2.1) 1.3Closing Cash Balance 51.7 62.9 60.8 63.1
Ratios 2010A 2011E 2012E 2013E
Profi tabilty Revenue Growth (%) 17.4 11.1 17.7 16.6EBITDA Margin (%) 7.3 8.4 8.0 8.3EBIT Margin (%) 6.4 6.7 7.2 7.5Effective Tax Rate (%) 30.0 30.0 30.0 30.0ROE (%) 40.5 89.5 82.4 79.5ROA (%) 24.5 26.1 28.3 29.8Payout Ratio (%) 59% 58% 60% 70%EV/EBITA (x) 9.7 8.1 6.8 5.5Balance Sheet Net Debt (Cash) ($m) 17.9 157.9 139.9 117.6Net Debt/Equity (%) 6.1 101.4 68.6 45.0Interest Cover (x) 31.8 41.6 16.2 21.8NTA ($/share) 2.25 1.21 1.74 2.29Price/NTA (x) 6.8 12.6 8.8 6.7EFPOWA (m) 109.4 110.3 104.6 104.6
Valuation 2011E 2012E 2013E
Normalised EBIT Multiple EBITA ($m) 175.1 228.8 256.0 EBITA Multiple (x) 12.9 11.5 10.7 Net Debt (Cash) ($m) 17.9 157.9 139.9 Implied Valuation ($m) 2241 2474 2599 Per Share $20.48 $22.43 $24.85EPS (cents) 129.1 162.8 194.7PE Target (x) 12.9 11.5 10.7Per Share $16.65 $18.72 $20.84Discounted Cash Flow Cost of Equity 9.8% WACC 9.8%Cost of Debt 7.5% Terminal Growth Rate 0.5%Target Equity/Debt 75/25 Per Share $36.71
EBIT/REVENUE
Sales Revenue EBIT
0
500
1000
1500
2000
2500
3000
3500
2010A 2011E 2012E
0
50
100
150
200
250
300

services team today at [email protected].
Patersons Accolade service will improve your tax planning and
make managing investments easier.
investment decisions
Calculate your Capital Gains position using
and investment sectors
all dividends and income generated by
types
be sent directly to your Accountant

Patersons Securities Limited ABN 69 008 896 311 AFSL No. 239 052
Participant of ASX Group; Stockbrokers Association of Australia Principal Member; Financial Planning Association Principal Member
Effective Date: 1 August 2011
Western Australia
Victoria
New South Wales
Queensland
Australian Capital Territory
South Australia
Northern Territory
1300 582 256 [email protected]
www.psl.com.au
T H E AU ST R AL I A N STO C KB RO KE R
IMPORTANT WARNING AND DISCLAIMER
Important Notice: © Patersons Securities Limited 2011. The contents contained in this report are owned by Patersons Securities Limited (‘Patersons’)
and are protected by the Copyright Act 1968 and the copyright laws of other countries. The material contained in this report may not be copied,
reproduced, republished, posted, transmitted or distributed in any way without prior written permission from Patersons. Modifi cation of the materials
or use of the materials for any other purpose is a violation of the copyrights and other proprietary rights of Patersons.
Disclaimer: Patersons believes that the information or advice (including any fi nancial product advice) contained in this report has been obtained
from sources that are accurate at the time of issue, but it has not independently checked or verifi ed that information and as such does not warrant its
accuracy or reliability. Except to the extent that liability cannot be excluded, Patersons accepts no liability or responsibility for any direct or indirect
loss or damage caused by any error in or omission from this report. You should make and rely on your own independent inquiries. If not specifi cally
disclosed otherwise, investors should assume that Patersons is seeking or will seek corporate fi nance business from the companies disclosed in this
report.
Warning: This report is intended to provide general securities advice, and does not purport to make any recommendation that any securities transaction
is appropriate to your particular investment objectives, fi nancial situation or particular needs. Prior to making any investment decision, you should
assess, or seek advice from your adviser, on whether any relevant part of this report is appropriate to your individual fi nancial circumstances and
investment objectives.
Disclosure: Patersons, its directors and/or employees may earn brokerage, fees, commissions and other benefi ts as a result of a transaction arising from
any advice mentioned in this report. Patersons as principal, its directors and/or employees and their associates may hold securities in the companies
the subject of this report, as at the date of publication. These interests did not infl uence Patersons in giving the advice contained in this report.
Details of any interests, which is relevant to any personal advice to you, may be obtained from your adviser. Patersons as principal, its directors and/
or employees and their associates may trade in these securities in a manner which may be contrary to recommendations given by an authorised
representative of Patersons to clients. They may sell shares the subject of a general ‘Buy’ recommendation, or buy shares the subject of a general ‘Sell’
recommendation.
Stock recommendations: Investment ratings are a function of Patersons expectation of total return (forecast price appreciation plus dividend yield)
within the next 12 months. The investment ratings are Buy (expected total return of 10% or more), Hold (-10% to +10% total return) and Sell (> 10%
negative total return). In addition, we have a Speculative Buy rating covering higher risk stocks that may not be of investment grade due to low market
capitalisation, high debt levels, or signifi cant risks in the business model. Investment ratings are determined at the time of initiation of coverage, or a
change in target price. At other times the expected total return may fall outside of these ranges because of price movements and/or market volatility.
This Document is not to be passed on to any third party without our prior written consent.