Embed Size (px)
Citation preview

A MERGERMARKET REPORT ON GLOBAL M&A ACTIVITY
MONTHLY M&A INSIDERDECEMBER 2015

CONTENTS
55 MERRILL CORPORATION CONTACTS
53 ABOUT MERRILL CORPORATION & MERRILL DATASITE
18 C&S AMERICA
11 NORTH AMERICA
39 ASIA-PACIFIC (excluding Japan)
46 JAPAN
25 EUROPE
32 MIDDLE EAST & AFRICA
03 GLOBAL OVERVIEW

GLOBAL OVERVIEW

4ASIA-
PACIFICEUROPE MIDDLE EAST & AFRICA
ABOUT MERRILL
CONTACT MERRILL
GLOBAL OVERVIEW NORTH
AMERICAC&S
AMERICA JAPAN
GLOBAL OVERVIEW
November 2015 has been anything but ordinary. By the end of the month, global M&A worth US$3.9tn across 14,740 transactions in the year-to-date had broken 2007’s full-year record value of US$3.7tn across 16,093 transactions by 5.9%, setting a new global record in terms of value – despite a drop in volume by 1,228 – and with one month still left in the year.
November also saw the largest pharmaceutical and de facto inversion transaction ever, US-based Pfizer Inc.’s US$183.7bn bid for Ireland-based Allergan Plc. The agreement was the latest in a string of high-value transactions this year, and was one of two deals valued at more than US$100bn which took place within a two-week period. The other was Belgium-based Anheuser-Busch InBev’s agreement to acquire UK-based SAB Miller for US$120.3bn, making it the largest Consumer transaction on record. Finally, all top 10 transactions for the month qualified as megadeals, defined to be transactions worth at least US$10bn.
As a result of the former transaction, Pharma, Medical & Biotech (PMB) was the best-performing sector this November with 84 transactions worth US$201.3bn, representing 33% of global market share; however, the Pfizer/Allergan deal alone accounted for 91.3% of PMB’s total value. Similarly, the Anheuser-Busch InBev/SAB Miller deal, along with another megadeal from the beer industry announced on the same day, UK-based Molson Coors
Brewing Company’s US$12bn acquisition of US-based MillerCoors LLC, were together worth US$132.3bn and accounted for 86.9% of Consumer’s 133 transactions worth US$152.8bn.
Both cross-border and domestic M&A were up this November, by 156.2% and 24.8%, respectively, compared to the same period last year. Cross-border transactions accounted for 67.8% of global market share while domestic transactions accounted for less than half, at 32.2%. Europe was the most heavily-targeted geography this month, with 356 transactions worth US$368.8bn, representing 60.4% of global market share, up from November 2014, while North America fell to 343 transactions worth US$149.6bn. Europe also had three transactions in the top 10 deals of November, which, altogether, were worth US$322.2bn.
Private equity was relatively quiet after last year’s punch out. November saw 147 buyouts worth a total of US$34.6bn, down 20.1% in value compared to November 2014’s US$43.4bn, and down in volume by
97 transactions. Exits were also down this month by more than half, from US$52.4bn in November 2014 to US$26bn over the same period this year.
Goldman Sachs continued to rank as the number one financial advisor globally, with 30 deals valued at US$393.1bn, up 167.9% by value compared to four fewer deals worth a total of US$146.7bn in November of last year. Cravath, Swaine & Moore ranked as the number one legal advisor globally, with 12 deals worth a total of US$347.9bn, up 358.6% in terms of value compared to the same number of deals worth US$75.9bn in November 2014.
As 2015 winds down, the business world appears ready to take advantage of a few promising indicators, including declining unemployment, increased corporate confidence fueling a drive toward growth via acquisitions, and a possible change in US monetary policy by the end of the year. With one more month left, the jury is still out as to whether or not an even larger deal is around the corner.
Key Stats
1,050 deals valued at US$610.5bn up 91.3% by value with 358 more deals compared to 1,408 deals worth US$319.2bn in November ‘14
Top Legal Adviser
PMB saw 84 deals worth US$201.3bn, up 157.7% by value compared to 111 deals worth US$78.1bn in November ‘14
Top sector
Goldman Sachs ranked first with 30 deals worth US$393.1bn, compared to 34 deals worth US$146.7bn in November ‘14
Cravath, Swain & Moore ranked first with 12 deals worth US$347.9bn, compared to 12 deals worth US$75.9bn in November ‘14
Top Financial Adviser

5ASIA-
PACIFICEUROPE MIDDLE EAST & AFRICA
ABOUT MERRILL
CONTACT MERRILL
GLOBAL OVERVIEW NORTH
AMERICAC&S
AMERICA JAPAN
GLOBAL M&A TREND GLOBAL PRIVATE EQUITY TREND
0
500
1,000
1,500
2,000
2,500
3,000
3,500
4,000
YTD 2015201420142012201120100
2,000
4,000
6,000
8,000
10,000
12,000
14,000
16,000
18,000
Valu
e (U
S$bn
)
Num
ber of deals
US$711.2bn
US$492.9bn
US$432.8bn
US$460.9bn
US$478.2bn
US$599.3bn
US$585.8bn
US$613.8bn
US$756.4bn
US$523.2bn
US$565.6bn
US$464.0bn
US$446.8bn
US$559.3bn
US$644.8bn
US$571.6bn
US$568.6bn
US$962.9bn
US$845.1bn
US$899.3bn
US$788.9bn
US$1,045.4bn
US$1,049.9bn
US$997.4bn
0
100
200
300
400
500
600
0
500
1,000
1,500
2,000
2,500
3,000
YTD 201520142013201220112010
Valu
e (U
S$bn
)
Num
ber of deals
US$248.5bn
US$279.8bn
US$292.3bn
US$330.7bn
US$277.3bn
US$312.4bn US$
295.6bnUS$
282.3bn
US$397.5bn
US$513.3bn
US$372.1bn
US$392.7bn
TREND GRAPHS
Buyout value Exit value Buyout volume Exit Volume Q1 Q2 Q3 Q4 Volume

6ASIA-
PACIFICEUROPE MIDDLE EAST & AFRICA
ABOUT MERRILL
CONTACT MERRILL
GLOBAL OVERVIEW NORTH
AMERICAC&S
AMERICA JAPAN
REGIONAL BREAKDOWN AS A PROPORTION OF GLOBAL TOTAL M&A VALUE GLOBAL M&A SECTOR BREAKDOWN NOVEMBER 2015
Pharma, Medical & BiotechValue: US$201.3bnNumber of deals: 84Market share: 33.0%
ConsumerValue: US$152.8bnNumber of deals: 133Market share: 25.0%
Financial ServicesValue: US$64.8bnNumber of deals: 104Market share: 10.6%
TMTValue: US$55.1bnNumber of deals: 180Market share: 9.0%
Energy, Mining & UtilitiesValue: US$50.1bnNumber of deals: 87Market share: 8.2%
TREND GRAPHS
C&S AmericaUS$4.7bn 25 deals 0.8%
EuropeUS$368.8bn
356 deals 60.4%
JapanUS$6.1bn 36 deals
1.0%
North AmericaUS$149.6bn
343 deals 24.5%
Asia (excl. Japan)US$78.9bn 263 deals
12.9%
Value (US$bn) Up/Down Value %
change
Cross-border $413.7 156.2%
Domestic $196.8 24.8%
RegionValue
VolumeValue market share
Key
Africa & Middle EastUS$2.4bn 27 deals 0.4%

7ASIA-
PACIFICEUROPE MIDDLE EAST & AFRICA
ABOUT MERRILL
CONTACT MERRILL
GLOBAL OVERVIEW NORTH
AMERICAC&S
AMERICA JAPAN
Announced 23-Nov-15
Bidder companyPfizer Inc
Target companyAllergan Plc
Dominant sectorPharma, Medical & Biotech
Announced 16-Nov-15
Bidder companyMarriott International Inc
Target companyStarwood Hotels & Resorts Worldwide Inc
Dominant sectorLeisure
Announced 11-Nov-15
Bidder companyAnheuser-Busch InBev NV
Target companySABMiller Plc
Dominant sectorConsumer
Announced 7-Nov-15
Bidder companyChina Yangtze Power Co Ltd
Target companySanxia Jinshajiang Chuanyun Hydroelectric Power Co Ltd
Seller companyChina Three Gorges Corporation; Sichuan Energy Investment Group Co Ltd; Yunan Energy Investment Group Co Ltd
Dominant sectorEnergy, Mining & Utilities
Announced 12-Nov-15
Bidder companyGeneral Electric Company (Shareholders)
Target companySynchrony Financial (84.6% Stake)
Seller companyGeneral Electric Company
Dominant sectorFinancial Services
Announced 11-Nov-15
Bidder companyMolson Coors Brewing Company
Target companyMillerCoors LLC (58% Stake)
Dominant sectorConsumer
Announced 2-Nov-15
Bidder companyVisa Inc
Target companyVisa Europe Ltd
Seller companyHSBC; Lloyds Banking Group Plc; Barclays Plc; Royal Bank of Scotland Group Plc; Worldpay Limited; PKO BP SA
Dominant sectorFinancial Services
Announced 3-Nov-15
Bidder companyTarga Resources Corp
Target companyTarga Resources Partners LP (91.2% Stake)
Dominant sectorEnergy, Mining & Utilities
Announced 17-Nov-15
Bidder companyAir Liquide SA
Target companyAirgas Inc
Dominant sectorIndustrials & Chemicals
Announced 8-Nov-15
Bidder companyWeyerhaeuser Company
Target companyPlum Creek Timber Company Co Inc
Dominant sectorReal Estate
Deal value US$10.8bn
Deal value US$11.3bn
Deal value US$12.0bn
Deal value US$183.7bn
Deal value US$120.3bn
Deal value US$21.8bn
Deal value US$18.2bn
Deal value US$13.4bn
Deal value US$12.9bn
Deal value US$12.5bn
TOP 10 ANNOUNCED DEALS FOR NOVEMBER 2015
TREND GRAPHS

8ASIA-
PACIFICEUROPE MIDDLE EAST & AFRICA
ABOUT MERRILL
CONTACT MERRILL
GLOBAL OVERVIEW NORTH
AMERICAC&S
AMERICA JAPAN
TOP 20 GLOBAL FINANCIAL ADVISERS TOP 20 GLOBAL FINANCIAL ADVISERS
LEAGUE TABLES
VALUE VOLUME
Ranking November 2015
November 2014
November 2015
November 2014 Company Name Value
(US$m) Deal count Value (US$m)
% Val. Change
1 1 Goldman Sachs 393,061 30 146,740 167.9%
2 4 JPMorgan 383,733 35 91,652 318.7%
3 7 Morgan Stanley 367,638 32 37,344 884.5%
4 12 Centerview Partners 192,356 4 18,659 930.9%
5 20 Moelis & Company 189,848 7 6,443 2846.6%
6 2 Bank of America Merrill Lynch 184,721 19 136,299 35.5%
7 68 Guggenheim Partners 184,504 2 977 18,784.7%
8 11 Barclays 158,343 14 22,439 605.7%
9 8 Lazard 156,087 16 27,455 468.5%
10 9 Deutsche Bank 147,354 14 25,393 480.3%
11 14 BNP Paribas 134,126 7 10,852 1,136.0%
12= - Robey Warshaw 120,334 1 - -
12= 296 Standard Bank Group 120,334 1 - -
14 5 Citi 59,009 20 42,004 40.5%
15 29 UBS Investment Bank 43,171 14 5,069 751.7%
16 3 Credit Suisse 42,393 13 120,584 -64.8%
17 103 Perella Weinberg Partners 35,660 4 436 8,078.9%
18 18 Evercore Partners 30,048 13 6,964 331.5%
19 41 Huatai United Securities 17,334 8 3,116 456.3%
20 45 CITIC Securities 16,576 3 2,729 507.4%
Ranking November 2015
November 2014
November 2015
November 2014 Company Name Value
(US$m) Deal count Deal count Deal count Change
1 4 JPMorgan 383,733 35 25 10
2 8 Morgan Stanley 367,638 32 21 11
3 1 Goldman Sachs 393,061 30 34 -4
4 14 Citi 59,009 20 15 5
5 7 Bank of America Merrill Lynch 184,721 19 22 -3
6 3 Rothschild 8,303 17 28 -11
7 11 Lazard 156,087 16 17 -1
8 10 KPMG 1,913 15 18 -3
9 9 Barclays 158,343 14 18 -4
10 12 Deutsche Bank 147,354 14 16 -2
11 35 UBS Investment Bank 43,171 14 6 8
12 13 Credit Suisse 42,393 13 15 -2
13 22 Evercore Partners 30,048 13 9 4
14 5 PwC 636 12 25 -13
15 2 EY 429 12 31 -19
16 53 Guotai Junan Securities 2,578 11 4 7
17 6 Deloitte 2,534 11 23 -12
18 15 Jefferies 3,072 10 13 -3
19 27 Sandler O'Neill & Partners 1,873 10 8 2
20 26 RBC Capital Markets 5,775 9 8 1

9ASIA-
PACIFICEUROPE MIDDLE EAST & AFRICA
ABOUT MERRILL
CONTACT MERRILL
GLOBAL OVERVIEW NORTH
AMERICAC&S
AMERICA JAPAN
TOP 20 GLOBAL LEGAL ADVISERS TOP 20 GLOBAL LEGAL ADVISERS
LEAGUE TABLES
VALUE VOLUME
Ranking November 2015
November 2014
November 2015
November 2014 Company Name Value
(US$m) Deal count Value (US$m)
% Val. Change
1 6 Cravath, Swaine & Moore 347,927 12 75,866 358.6%
2 5 Cleary Gottlieb Steen & Hamilton 340,454 13 77,285 340.5%
3 26 Clifford Chance 305,920 7 21,548 1,319.7%
4 1 Wachtell, Lipton, Rosen & Katz 258,567 20 109,709 135.7%
5 22 Skadden Arps Slate Meagher & Flom 236,765 15 29,889 692.1%
6 4 Latham & Watkins 224,282 18 79,778 181.1%
7 2 Weil Gotshal & Manges 209,683 10 82,172 155.2%
8 31 White & Case 206,087 13 16,215 1,171.0%
9 41 Debevoise & Plimpton 203,019 7 8,244 2,362.6%
10 61 Willkie Farr & Gallagher 188,339 12 3,827 4,821.3%
11 38 Morgan Lewis & Bockius 184,278 9 9,322 1,876.8%
12= 53 A&L Goodbody 183,739 1 5,207 3,428.7%
12= 13 Arthur Cox 183,739 1 63,599 188.9%
14 15 Sullivan & Cromwell 170,138 15 55,741 205.2%
15 25 Linklaters 143,665 10 23,409 513.7%
16 24 Freshfields Bruckhaus Deringer 136,085 11 23,629 475.9%
17 42 Hogan Lovells International 120,497 4 7,603 1,484.9%
18 82 Webber Wentzel 120,334 2 2,672 4,403.5%
19 331 Macfarlanes 51,265 3 32 160,103.1%
20 154 Simpson Thacher & Bartlett 38,986 16 689 5,558.3%
Ranking November 2015
November 2014
November 2015
November 2014 Company Name Value
(US$m) Deal count Deal count Deal count Change
1 40 Wachtell, Lipton, Rosen & Katz 258,567 20 8 12
2 1 Latham & Watkins 224,282 18 36 -18
3 95 Simpson Thacher & Bartlett 38,986 16 5 11
4 6 Kirkland & Ellis 20,209 16 26 -10
5 25 King & Wood Mallesons 4,797 16 12 4
6 7 Skadden Arps Slate Meagher & Flom 236,765 15 24 -9
7 18 Sullivan & Cromwell 170,138 15 13 2
8 36 Shearman & Sterling 37,572 15 9 6
9 21 Cleary Gottlieb Steen & Hamilton 340,454 13 12 1
10 3 White & Case 206,087 13 30 -17
11 22 Cravath, Swaine & Moore 347,927 12 12 0
12 62 Willkie Farr & Gallagher 188,339 12 6 6
13 14 Davis Polk & Wardwell 22,727 12 16 -4
14 2 DLA Piper 965 12 36 -24
15 8 Freshfields Bruckhaus Deringer 136,085 11 24 -13
16 19 Herbert Smith Freehills 30,633 11 13 -2
17 42 Ropes & Gray 12,851 11 8 3
18 13 Allen & Overy 7,837 11 21 -10
19 26 CMS 729 11 12 -1
20 12 Weil Gotshal & Manges 209,683 10 21 -11

Simple.There is an art to due diligence. Simply portray your asset in the best light with Merrill DataSite - the smart, simple, secure virtual data room for your deal.
datasite.com
Smart, Simple, Secure (ART) Mergermarket-LANDSCAPE.indd 2 14/10/2015 14:57

NORTH AMERICA

12GLOBAL
OVERVIEW
NORTH AMERICA ASIA-
PACIFICEUROPE MIDDLE EAST & AFRICA
ABOUT MERRILL
CONTACT MERRILL
C&S AMERICA JAPAN
NORTH AMERICA
November 2015 was record-breaking in many respects. First and foremost, with the addition of November deals, North America saw the highest annual deal value (US$1.9tn) compared to any other year in the past, including the previous high of 2007 (US$1.5tn).
Another record was set by Pfizer’s agreement to acquire Allergan for a total deal value of US$183.7bn, the largest North American outbound deal in history. As a result of this transaction, the region registered the highest outbound value ever at US$455.1bn. The previous largest outbound deal had a much lower deal value but involved an Ireland-based pharmaceutical target as well, AbbVie’s acquisition of Shire for US$54.4b in July 2014. The Shire/AbbVie deal, which was also presented as a tax inversion, lapsed in October of the same year due to changes in US taxation regulations. It remains to be seen whether the Pfizer/Allergan deal will succeed to go through.
Understandably, the Pfizer/Allergan transaction has increased M&A flow from North America into Ireland. However, Ireland was not the only European country to experience record-breaking inbound M&A from US and Canada. Germany, for example, registered US$26.1bn-worth of deals from North America in the first 11 months of 2015, the highest deal value on Mergermarket record and a 36.4% increase from all 12 months of 2014. The purchase
of Germany-based Elster Group by US-based Honeywell, valued at US$5.1bn, was the biggest such deal this year. Similarly, UK had a significant influx of North American investments: US$82.3bn-worth of deals was higher than the 2007 record (US$65.5bn) by 25.7%. The November acquisition of Visa Europe by its American counterpart Visa for US$18.2bn was the most prominent transaction in this space.
At the same time, inbound M&A into US and Canada was also very strong (707 deals worth US$347.8bn). While it was not record-breaking, it was on par with two of the best-performing years, 2007 (US$390.1bn, 690 deals) and 2014 (US$320.5bn, 714 deals). The acquisition of Airgas by France-based Air Liquide for US$13.4bn was the largest inbound transaction announced in November. This transaction, in the Industrials & Chemicals sector, was completed at a 2.5x revenue and a 13.8x EBITDA multiple.
With regards to Industrials & Chemicals, the sector saw US$159bn-worth of deals so far in 2015, its second-highest deal value on Mergermarket record. While Industrials
& Chemicals is unlikely to break the 2007 record (US$244bn), it has already surpassed the value of deals in 2014 (US$156.3bn).
Financial Services (US$248bn), at the same time, has more than tripled its value since 2014 (US$72.4bn) and has increased by 38.8% since 2007 (US$178.6bn). The top deal in November was in the Financial Services sector, the demerger of an 84.6% stake in Synchrony Financial from General Electric Company, valued at US$21.8bn.
With the books for the year almost closed and only one month left to account for, we already know that 2015 will end on a high note in terms of its M&A activity. It is still unclear, however, how many of the jumbo deals announced in 2015 will actually be able to close. It is also unclear how long the upward pattern will be able to sustain itself. The way it stands at the moment, nonetheless, there is a lot to look forward to in 2016.
Key Stats
340 deals valued at US$149.6bn down 7.3% by value with 109 fewer deals compared to 449 deals worth US$161.4bn in November ‘14
Top Legal Adviser
Financial Services saw 44 deals worth US$30.4bn, up 454.8% by value compared to 31 deals worth US$5.5bn in November ‘14
Top sector
Goldman Sachs ranked first with 22 deals worth US$257.7bn, compared to 26 deals worth US$140.6bn in November ‘14
Cravath, Swaine & Moore ranked first with 11 deals worth US$227.6bn, compared to 6 deals worth US$73.6bn in November ‘14
Top Financial Adviser

13GLOBAL
OVERVIEW
NORTH AMERICA ASIA-
PACIFICEUROPE MIDDLE EAST & AFRICA
ABOUT MERRILL
CONTACT MERRILL
C&S AMERICA JAPAN
NORTH AMERICA M&A TREND NORTH AMERICA PRIVATE EQUITY TREND
0
500
1,000
1,500
2,000
YTD 2015201420132012201120100
1,000
2,000
3,000
4,000
5,000
6,000
Valu
e (U
S$bn
)
Num
ber of deals
US$271.5bn
US$176.7bn
US$202.6bn
US$159.2bn
US$376.5bn
US$627.9bn
US$505.2bn
US$368.5bn
US$405.6bn
US$452.2bn
US$414.0bn
US$233.9bn
US$212.4bn
US$226.1bn
US$218.7bn
US$264.8bn
US$249.1bn
US$336.5bn
US$193.7bn
US$196.5bn
US$347.3bn
US$264.2bn
US$208.5bn
US$164.2bn
0
50
100
150
200
250
300
0
100
200
300
400
500
600
700
800
900
1,000
1,100
YTD 201520142013201220112010
Valu
e (U
S$bn
)
Num
ber of deals
US$107.1bn
US$154.5bn
US$112.9bn
US$144.1bn US$
130.4bn
US$171.6bn
US$142.5bn
US$155.1bn
US$169.3bn
US$274.5bn
US$173.1bn
US$ 191.4bn
TREND GRAPHS
Buyout value Exit value Buyout volume Exit Volume Q1 Q2 Q3 Q4 Volume

14GLOBAL
OVERVIEW
NORTH AMERICA ASIA-
PACIFICEUROPE MIDDLE EAST & AFRICA
ABOUT MERRILL
CONTACT MERRILL
C&S AMERICA JAPAN
United StatesUS$146.2bn
308 deals 97.7%
CanadaUS$3.4bn 32 deals
2.3%
COUNTRY BREAKDOWN AS A PROPORTION OF NORTH AMERICA TOTAL M&A VALUE NORTH AMERICA M&A SECTOR BREAKDOWN NOVEMBER 2015
Financial ServicesValue: US$30.4bnNumber of deals: 44Market share: 20.3%
ConsumerValue: US$24.7bnNumber of deals: 36Market share: 16.5%
Energy, Mining & UtilitiesValue: US$19.1bnNumber of deals: 36Market share: 12.8%
Industrials & ChemicalsValue: US$17.3bnNumber of deals: 58Market share: 11.6%
TMTValue: US$16.9bnNumber of deals: 65Market share: 11.3%
TREND GRAPHS
RegionValue
VolumeValue market share
Key
Value (US$bn) Up/Down Value %
change
Domestic $93.2 17.8%
Inbound $37.5 -50.1%
Outbound $222.7 452.3%

15GLOBAL
OVERVIEW
NORTH AMERICA ASIA-
PACIFICEUROPE MIDDLE EAST & AFRICA
ABOUT MERRILL
CONTACT MERRILL
C&S AMERICA JAPAN
Announced 12-Nov-15
Bidder companyGeneral Electric Company (Shareholders)
Target companySynchrony Financial (84.6% Stake)
Seller companyGeneral Electric Company
Dominant sectorFinancial Services
Announced 8-Nov-15
Bidder companyWeyerhaeuser Company
Target companyPlum Creek Timber Company Co Inc
Dominant sectorReal Estate
Announced 17-Nov-15
Bidder companyAir Liquide SA
Target companyAirgas Inc
Dominant sectorIndustrials & Chemicals
Announced 2-Nov-15
Bidder companyShire Plc
Target companyDyax Corp
Dominant sectorPharma, Medical & Biotech
Announced 16-Nov-15
Bidder companyMarriott International Inc
Target companyStarwood Hotels & Resorts Worldwide Inc
Dominant sectorLeisure
Announced 23-Nov-15
Bidder companyCVC Capital Partners Limited; Canada Pension Plan Investment Board
Target companyPETCO Animal Supplies Inc
Seller companyTPG Capital LP; Leonard Green & Partners LP
Dominant sectorConsumer
Announced 11-Nov-15
Bidder companyMolson Coors Brewing Company
Target companyMillerCoors LLC (58% Stake)
Seller companySABMiller Plc
Dominant sectorConsumer
Announced 4-Nov-15
Bidder companyExpedia Inc
Target companyHomeAway Inc
Dominant sectorTMT
Announced 3-Nov-15
Bidder companyTarga Resources Corp
Target companyTarga Resources Partners LP (91.2% Stake)
Dominant sectorEnergy, Mining & Utilities
Announced 9-Nov-15
Bidder companyTriton Container International Limited
Target companyTAL International Group Inc
Dominant sectorFinancial Services
Deal value US$3.7bn
Deal value US$3.9bn
Deal value US$4.6bn
TOP 10 ANNOUNCED DEALS FOR NOVEMBER 2015
Deal value US$21.8bn
Deal value US$13.4bn
Deal value US$12.9bn
Deal value US$12.0bn
Deal value US$11.3bn
Deal value US$10.8bn
Deal value US$5.1bn
TREND GRAPHS

16GLOBAL
OVERVIEW
NORTH AMERICA ASIA-
PACIFICEUROPE MIDDLE EAST & AFRICA
ABOUT MERRILL
CONTACT MERRILL
C&S AMERICA JAPAN
TOP 20 NORTH AMERICA FINANCIAL ADVISERS TOP 20 NORTH AMERICA FINANCIAL ADVISERS
LEAGUE TABLES
VALUE VOLUME
Ranking November 2015
November 2014
November 2015
November 2014 Company Name Value
(US$m) Deal count Value (US$m)
% Val. Change
1 1 Goldman Sachs 257,688 22 140,612 83.3%
2 4 JPMorgan 244,848 22 75,739 223.3%
3 6 Morgan Stanley 228,665 18 24,479 834.1%
4 10 Centerview Partners 191,585 3 18,659 926.8%
5 24 Moelis & Company 189,337 6 2,724 6,850.7%
6 36 Guggenheim Partners 184,504 2 977 18,784.7%
7 2 Bank of America Merrill Lynch 64,387 18 129,192 -50.2%
8 7 Citi 55,055 15 24,212 127.4%
9 11 Barclays 34,606 11 11,236 208.0%
10 63 UBS Investment Bank 33,721 7 376 8,868.4%
11 8 Lazard 27,026 6 22,091 22.3%
12 12 Deutsche Bank 24,903 8 8,256 201.6%
13 45 Evercore Partners 19,582 9 816 2,299.8%
14 13 BNP Paribas 13,765 3 7,735 78.0%
15 43 Qatalyst Group 6,222 2 835 645.1%
16 32 RBC Capital Markets 5,126 7 1,400 266.1%
17 3 Credit Suisse 4,827 6 117,406 -95.9%
18 40 Macquarie Group 4,822 3 889 442.4%
19 14 Wells Fargo Securities 3,749 3 5,827 -35.7%
20 72 Perella Weinberg Partners 3,170 3 155 1,945.2%
Ranking November 2015
November 2014
November 2015
November 2014 Company Name Value
(US$m) Deal count Deal count Deal count Change
1 1 Goldman Sachs 257,688 22 26 -4
2 3 JPMorgan 244,848 22 14 8
3 7 Morgan Stanley 228,665 18 10 8
4 2 Bank of America Merrill Lynch 64,387 18 15 3
5 8 Citi 55,055 15 9 6
6 4 Barclays 34,606 11 14 -3
7 16 Sandler O'Neill & Partners 1,873 10 8 2
8 18 Evercore Partners 19,582 9 7 2
9 14 Deutsche Bank 24,903 8 8 0
10 5 Jefferies 2,366 8 11 -3
11 17 Piper Jaffray & Co 559 8 8 0
12 82 UBS Investment Bank 33,721 7 1 6
13 23 RBC Capital Markets 5,126 7 6 1
14 9 Lincoln International 290 7 9 -2
15 15 Moelis & Company 189,337 6 8 -2
16 13 Lazard 27,026 6 8 -2
17 12 Credit Suisse 4,827 6 8 -2
18 30 BMO Capital Markets 996 6 5 1
19 19 William Blair & Company 2,092 5 7 -2
20 11 Houlihan Lokey 309 5 9 -4

17GLOBAL
OVERVIEW
NORTH AMERICA ASIA-
PACIFICEUROPE MIDDLE EAST & AFRICA
ABOUT MERRILL
CONTACT MERRILL
C&S AMERICA JAPAN
TOP 20 NORTH AMERICA LEGAL ADVISERS TOP 20 NORTH AMERICA LEGAL ADVISERS
LEAGUE TABLES
VALUE VOLUME
Ranking November 2015
November 2014
November 2015
November 2014 Company Name Value
(US$m) Deal count Value (US$m)
% Val. Change
1 6 Cravath, Swaine & Moore 227,593 11 73,602 209.2%
2 1 Wachtell, Lipton, Rosen & Katz 226,077 19 107,822 109.7%
3 22 Skadden Arps Slate Meagher & Flom 221,622 11 24,489 805.0%
4 5 Latham & Watkins 220,995 13 74,572 196.4%
5 4 Cleary Gottlieb Steen & Hamilton 216,399 7 77,054 180.8%
6 2 Weil Gotshal & Manges 209,683 10 82,162 155.2%
7 30 White & Case 204,289 10 12,354 1,553.6%
8 33 Debevoise & Plimpton 203,019 7 8,244 2,362.6%
9 62 Willkie Farr & Gallagher 188,233 8 1,940 9,602.7%
10 26 Clifford Chance 183,950 3 15,768 1,066.6%
11= - A&L Goodbody 183,739 1 - -
11= 14 Arthur Cox 183,739 1 63,199 190.7%
13 15 Sullivan & Cromwell 49,029 13 53,854 -9.0%
14 17 Shearman & Sterling 22,192 10 42,867 -48.2%
15 100 Gibson Dunn & Crutcher 19,174 7 571 3,258.0%
16 36 Linklaters 18,373 4 6,659 175.9%
17 154 Milbank Tweed Hadley & McCloy 18,152 2 130 13863.1%
18 194 Macfarlanes 18,152 1 32 56,625.0%
19 16 Davis Polk & Wardwell 17,373 10 48,603 -64.3%
20 92 Simpson Thacher & Bartlett 17,173 13 689 2,392.5%
Ranking November 2015
November 2014
November 2015
November 2014 Company Name Value
(US$m) Deal count Deal count Deal count Change
1 25 Wachtell, Lipton, Rosen & Katz 226,077 19 7 12
2 1 Kirkland & Ellis 16,340 15 25 -10
3 2 Latham & Watkins 220,995 13 23 -10
4 12 Sullivan & Cromwell 49,029 13 11 2
5 46 Simpson Thacher & Bartlett 17,173 13 5 8
6 32 Cravath, Swaine & Moore 227,593 11 6 5
7 4 Skadden Arps Slate Meagher & Flom 221,622 11 20 -9
8 6 Weil Gotshal & Manges 209,683 10 18 -8
9 7 White & Case 204,289 10 16 -6
10 18 Shearman & Sterling 22,192 10 9 1
11 13 Davis Polk & Wardwell 17,373 10 11 -1
12 16 Paul Weiss Rifkind Wharton & Garrison 15,569 10 10 0
13 21 Ropes & Gray 12,843 10 8 2
14 30 Cooley 1,473 10 7 3
15 5 DLA Piper 951 9 19 -10
16 52 Willkie Farr & Gallagher 188,233 8 4 4
17 35 Vinson & Elkins 12,508 8 6 2
18 17 Morgan Lewis & Bockius 539 8 10 -2
19 11 Cleary Gottlieb Steen & Hamilton 216,399 7 11 -4
20 27 Debevoise & Plimpton 203,019 7 7 0

C&S AMERICA

19C&S AMERICA ASIA-
PACIFICEUROPE MIDDLE EAST & AFRICA
ABOUT MERRILL
CONTACT MERRILLJAPANGLOBAL
OVERVIEWNORTH
AMERICA
C&S AMERICA
The M&A activity in Central & South America (C&S America) continues to show weaker signs partially due to deteriorating economic forecasts, and increasing political risks associated with certain emerging markets. Latin American countries saw total of 25 deals worth US$4.7bn in the month of November, increasing the overall year-to-day deal value (US$54.4bn) by 8.6%. Compared to November 2014, which accounted for 46 deals worth US$10.8bn, deal value in the current month experienced a substantial decline, dropping by 67.6% with 27 fewer deals.
In November, C&S America saw total of 3 buyouts worth US$638m, increased five-fold in comparison to the same month of last year, which accounted for a total of 6 deals worth US$100m. Exits, on the other hand, experienced an opposite trend, decreasing in overall value 88.1% from US$3bn to US$356m.
The Consumer sector has been the leading sector in Latin America in November, accounting for 57.7% of the total market share with 9 deals worth US$2.2bn. Compared to November 2014 with 9 deals worth US$275m, the Consumer sector increased its value seven-fold. This impressive increase in the consumer sector’s value is mainly due to the top deal worth US$1bn, where US-based beauty product manufacturer Coty Inc. acquired the personal care and beauty business from Brazilian consumer goods company Hypermarcas SA. The second largest deal worth US$721m is also under the consumer sector, in which J&F Participacoes Financeiras SA acquired 44.1% stake in a Brazil-based footwear company Alpargatas
SA. Four out of nine consumer sector’s deals ended up in the top deals rankings, accounting for 46.7% of the total market share.
The Transportation sector landed in second place with one deal for US$450m, in which Brazilian airline company Azul Linhas Aereas Brasileiras SA agreed to sell a 24% stake to Chinese multi-business conglomerate HNA Group, ended up being the third largest deal in the top deals rankings for the current month.
Even though Brazil, Latin America’s largest economy, remains to be held by a prolonged recession, it continues to have a major impact on the regional M&A activity. In November, Brazil was the dominant country in C&S America with 14 deals worth US$3.3bn, accounted for 79.2% of the total regional value, and decreased in value by 42.8% compared to the same month of last year. Mexico ended up being the second leading destination for M&A activity this current month with 5 deals worth
US$828bn, aggregating a total regional value of 20%, but decreasing in value by 66.5% in comparison to November 2014. Mexico, however, slowly becomes the best performing emerging economy in Latin America, mainly due to growing trading opportunities, and decreasing unemployment. Positive government regulations imposed in 2012, as well as having the US as their key trading partner, may have a major impact on future M&A activity.
Key Stats
24 deals valued at US$4.1bn down 67.6% by value with 27 fewer deals compared to 46 deals worth US$10.8bn in November ‘14
Top Legal Adviser
Consumer saw 9 deals worth US$2.2bn, up 704.6% by value compared to 9 deals worth US$275m in November ‘14
Top sector
Bank of America Merrill Lynch ranked first with 2 deals worth US$1.4bn
Mattos Filho, Veiga Filho, Marrey Jr. e Quiroga Advogados ranked first with 1 deal worth US$721m
Top Financial Adviser

20C&S AMERICA ASIA-
PACIFICEUROPE MIDDLE EAST & AFRICA
ABOUT MERRILL
CONTACT MERRILLJAPANGLOBAL
OVERVIEWNORTH
AMERICA
C&S AMERICA M&A TREND C&S AMERICA PRIVATE EQUITY TREND
0
50
100
150
200
YTD 2015201420132012201120100
100
200
300
400
500
600
700
Valu
e (U
S$bn
)
Num
ber of dealsUS$
65.4bn
US$27.6bn
US$28.8bn
US$45.1bn
US$40.4bn
US$18.3bn
US$46.0bn
US$28.7bn
US$21.8bn
US$47.1bn
US$16.5bn
US$32.4bn
US$17.8bn
US$21.4bn
US$23.0bn
US$24.6bn
US$24.8bn US$
10.9bn
US$11.4bn
US$22.9bn
US$8.7bnUS$
39.9bn
US$37.8bn
US$28.4bn
0
2
4
6
8
10
12
0
10
20
30
40
50
60
70
80
YTD 201520142013201220112010
Valu
e (U
S$bn
)
Num
ber of deals
US$7.6bn
US$X.Xbn
US$3.3bn
US$3.6bn US$
2.9bn
US$6.8bn
US$2.8bn
US$8.5bn
US$1.3bn
US$7.6bn
US$3.1bn
US$10.3bn
US$1.5bn
TREND GRAPHS
Buyout value Exit value Buyout volume Exit Volume Q1 Q2 Q3 Q4 Volume

21C&S AMERICA ASIA-
PACIFICEUROPE MIDDLE EAST & AFRICA
ABOUT MERRILL
CONTACT MERRILLJAPANGLOBAL
OVERVIEWNORTH
AMERICA
COUNTRY BREAKDOWN AS A PROPORTION OF C&S AMERICA TOTAL M&A VALUE C&S AMERICA M&A SECTOR BREAKDOWN NOVEMBER 2015
ConsumerValue: US$2.2bnNumber of deals: 9Market share: 53.7%
TransportationValue: US$450.0mNumber of deals: 1Market share: 10.8%
Energy, Mining & UtilitiesValue: US$415.6mNumber of deals: 2Market share: 10.0%
ConstructionValue: US$357.7mNumber of deals: 1Market share: 8.6%
Pharma, Medical & BiotechValue: US$350.0mNumber of deals: 1Market share: 8.4%
TREND GRAPHS
ALL SECTORS
BrazilUS$3,286m
14 deals 79.2%
PeruUS$26m 1 deals
0.6%
MexicoUS$828m
5 deals 20.0%
ArgentinaUS$9m 3 deals
0.2%
RegionValue
VolumeValue market share
Key
Value (US$bn) Up/Down Value %
change
Domestic $1.2 -70.8%
Inbound $4.5 -61.7%
Outbound $1.5 -70.6%

22C&S AMERICA ASIA-
PACIFICEUROPE MIDDLE EAST & AFRICA
ABOUT MERRILL
CONTACT MERRILLJAPANGLOBAL
OVERVIEWNORTH
AMERICA
Announced 2-Nov-15
Bidder companyCoty Inc
Target companyHypermarcas SA (personal care and beauty business)
Seller companyHypermarcas SA
Dominant sectorConsumer
Announced 10-Nov-15
Bidder companyBrookfield Asset Management Inc
Target companyInvestimentos e Participacoes em Infra-Estrutura SA (24.4% Stake)
Seller companyOAS Engenharia e Participações SA
Dominant sectorConstruction
Announced 23-Nov-15
Bidder companyJ&F Participacoes Financeiras SA
Target companyAlpargatas SA (44.12% Stake)
Seller companyCamargo Correa SA
Dominant sectorConsumer
Announced 26-Nov-15
Bidder companyAmil Participacoes SA
Target companySociedade Hospital Samaritano
Dominant sectorPharma, Medical & Biotech
Announced 24-Nov-15
Bidder companyHNA Group Co Ltd
Target companyAzul Linhas Aereas Brasileiras SA (23.7% Stake)
Dominant sectorTransportation
Announced 20-Nov-15
Bidder companyOmnicom Group Inc
Target companyGrupo ABC Ltda
Seller companyKinea Investimentos Ltda
Dominant sectorTMT
Announced 5-Nov-15
Bidder companyOntex Group NV
Target companyGrupo PI Mabe
Dominant sectorConsumer
Announced 9-Nov-15
Bidder companyThe Carlyle Group
Target companyTempo Participacoes SA (51.13% Stake)
Seller companyGP Investments Limited
Dominant sectorBusiness Services
Announced 11-Nov-15
Bidder companyShell Midstream Partners LP
Target companyPecten Midstream LLC
Seller companyShell Pipeline Company LP
Dominant sectorEnergy, Mining & Utilities
Announced 16-Nov-15
Bidder companyProfarma Distribuidora de Produtos Farmaceuticos SA
Target companyDrogarias Tamoio (50% Stake)
Dominant sectorConsumer
Deal value US$34m
Deal value US$92m
Deal value US$263m
TOP 10 ANNOUNCED DEALS FOR NOVEMBER 2015
Deal value US$1bn
Deal value US$721m
Deal value US$450m
Deal value US$438m
Deal value US$390m
Deal value US$358m
Deal value US$350m
TREND GRAPHS

23C&S AMERICA ASIA-
PACIFICEUROPE MIDDLE EAST & AFRICA
ABOUT MERRILL
CONTACT MERRILLJAPANGLOBAL
OVERVIEWNORTH
AMERICA
TOP 10 C&S AMERICA FINANCIAL ADVISERS TOP 10 C&S AMERICA FINANCIAL ADVISERS
LEAGUE TABLES
VALUE VOLUME
Ranking November 2015
November 2014
November 2015
November 2014 Company Name Value
(US$m) Deal count Value (US$m)
% Val. Change
1 - Bank of America Merrill Lynch 1,350 2 - -
2 3 Goldman Sachs 1,071 2 3,435 -68.8%
3 18 BR Partners 1,000 3 8 12,400.0%
4 - UBS Investment Bank 888 2 - -
5 6 Banco Bradesco BBI 813 2 3,117 -73.9%
6= - Bravia Capital Hong Kong 450 1 - -
6= - Seabury Group 450 1 - -
8 10 Evercore Partners 390 1 3,025 -87.1%
9 13 Lazard 350 1 200 75.0%
Ranking November 2015
November 2014
November 2015
November 2014 Company Name Value
(US$m) Deal count Deal count Deal count Change
1 18 BR Partners 1,000 3 1 2
2 - Bank of America Merrill Lynch 1,350 2 - -
3 4 Goldman Sachs 1,071 2 3 -1
4 - UBS Investment Bank 888 2 - -
5 8 Banco Bradesco BBI 813 2 1 1
6= - Bravia Capital Hong Kong 450 1 - -
6= - Seabury Group 450 1 - -
8 12 Evercore Partners 390 1 1 0
9 14 Lazard 350 1 1 0

24C&S AMERICA ASIA-
PACIFICEUROPE MIDDLE EAST & AFRICA
ABOUT MERRILL
CONTACT MERRILLJAPANGLOBAL
OVERVIEWNORTH
AMERICA
LEAGUE TABLES
VALUE VOLUME
TOP 10 C&S AMERICA LEGAL ADVISERS TOP 10 C&S AMERICA LEGAL ADVISERS
Ranking November 2015
November 2014
November 2015
November 2014 Company Name Value
(US$m) Deal count Value (US$m)
% Val. Change
1 4 Mattos Filho, Veiga Filho, Marrey Jr. e Quiroga Advogados 721 1 3,317 -78.3%
2 7 Barbosa, Mussnich & Aragao 638 2 3,117 -79.5%
3 17 Pinheiro Guimaraes Advogados 546 1 935 -41.6%
4 - Shearman & Sterling 450 1 - -
5= - Cleary Gottlieb Steen & Hamilton 438 1 - -
5= - Covington & Burling 438 1 - -
5= 49 Creel, Garcia-Cuellar, Aiza y Enriquez 438 1 - -
5= - Garrigues 438 1 - -
5= 23 Gomez-Acebo & Pombo Abogados 438 1 183 139.3%
5= - Haynes and Boone 438 1 - -
Ranking November 2015
November 2014
November 2015
November 2014 Company Name Value
(US$m) Deal count Deal count Deal count Change
1 22 Barbosa, Mussnich & Aragao 638 2 1 1
2 1 Mattos Filho, Veiga Filho, Marrey Jr. e Quiroga Advogados 721 1 9 -8
3 30 Pinheiro Guimaraes Advogados 546 1 1 0
4 - Shearman & Sterling 450 1 - -
5= - Cleary Gottlieb Steen & Hamilton 438 1 - -
5= - Covington & Burling 438 1 - -
5= 8 Creel, Garcia-Cuellar, Aiza y Enriquez 438 1 3 -2
5= - Garrigues 438 1 - -
5= 34 Gomez-Acebo & Pombo Abogados 438 1 1 0
5= - Haynes and Boone 438 1 - -

EUROPE

26EUROPE ASIA-
PACIFICMIDDLE EAST
& AFRICAABOUT
MERRILL CONTACT MERRILLJAPANGLOBAL
OVERVIEWNORTH
AMERICAC&S
AMERICA
EUROPE
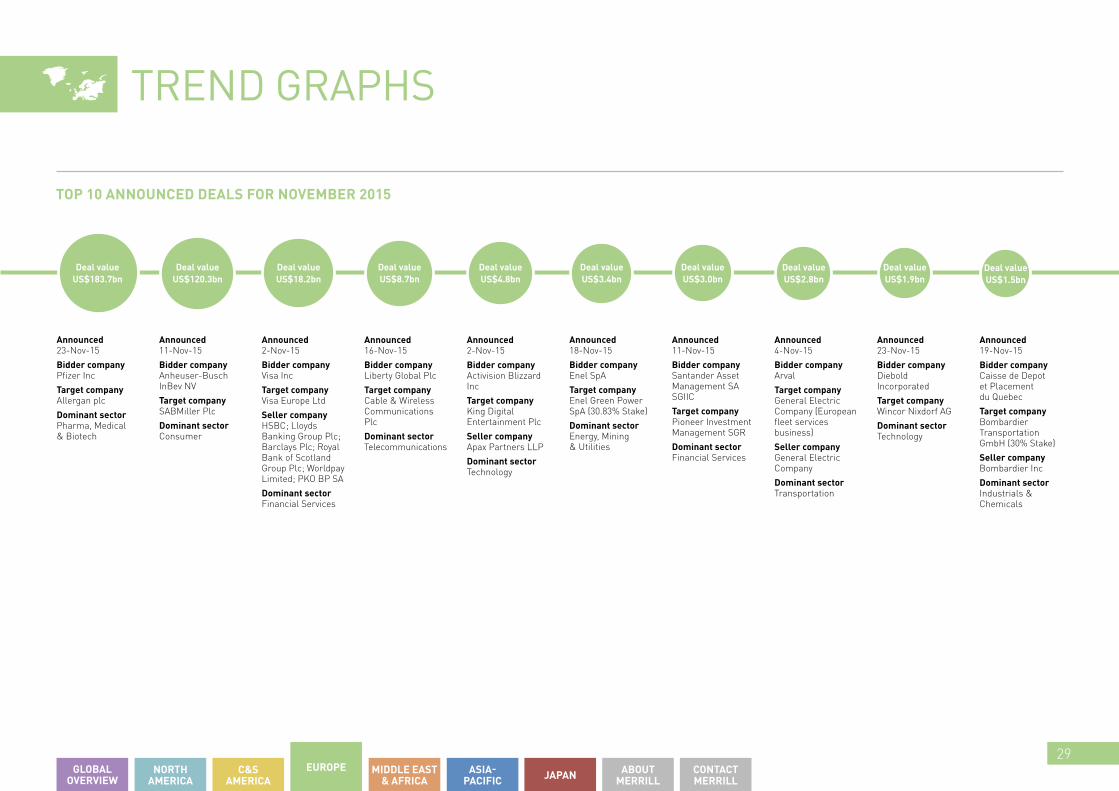
Europe has reached the highest monthly value on Mergermarket record in November 2015, with a total deal value of US$369.2bn, representing a 400.4% increase in comparison to November 2014. Two major deals have contributed to 82.4% of the total European M&A activity in November, the first being Pfizer Inc acquisition by Allergan plc for US$183.7bn and SABMiller Plc acquisition by Anheuser-Busch InBev NV for US$120.3bn.
November has confirmed the positive trend of 2015 in terms of M&A activity in Europe, which has been reinforced by the high level of foreign investments, with a total M&A deal value surging from US$187.8bn in Q1 this year to US$423.6bn in Q4, representing an increase of 126%. In terms of private equity however, the level of buyouts dropped by 72.3%, from US$19.5bn to US$5.4bn in November this year. Same trend for exits, with November 2015 totalling 52 deals valued at US$5.9bn, compared to 64 deals worth US$18.9bn in November last year.
Europe’s most active country was the Republic of Ireland, with total deal value reaching US$189.2bn and 6 deals, followed by the United Kingdom, which had a total deal value worth US$153.6bn with 84 deals. The Republic of Ireland contributed 51.2% of total M&A activity in Europe in November and was driven by Pfizer acquisition of Allergan plc for US$183.7bn.
Inbound deals into Europe saw a large increase of 472% compared to November
last year with a total of US$219.1bn. This was mainly from US companies investing in Europe, with a total deal value of US$212.7bn, compared to November 2014 (US$21.6bn).
Outbound deals announced by European companies decreased by 54.4% in November 2015 compared to the same month last year, reaching US$32.5bn, compared to US$71.3bn in November 2014. The decrease in deal value might be related to Quantitative Easing program that caused the strong devaluation of the Euro. Most of the deals executed by European companies in November 2015 were targeting US companies, for a total investment of US$30.7bn, representing a slump of 56.9% in terms of deal value, with respect to November 2014, which accounted for US$71.3bn.
The most active sectors in Europe were Pharma, Medical & Biotech, Consumer and Financial Services, each totalling US$185bn, US$123.8bn and US$23.3bn respectively in November 2015. The Financial Services sector was mainly driven by the acquisition
of Visa Europe Ltd announced by Visa Inc, for a total deal value of US$18.2bn. Overall, Europe has seen a trend of consolidation in each sector that might continue in 2016, paving the way for further large deals.
Finally, the European M&A value increased by 17% so far in 2015 compared to US$897.4bn in 2014, with a considerable total of 1,190 less deals.
This month, Goldman Sachs managed to maintain its first position in the Financial Advisors league table by value, with 14 deals valued at US$364.4bn. Cleary Gottlieb Steen & Hamilton topped the legal advisors league table by value, totalling 10 deals worth US$335.8bn, 349.2% higher than November 2014.
Key Stats
342 deals valued at US$369.2bn up 400.4% by value with 190 fewer deals compared to 532 deals worth US$73.8bn in November ‘14
Top Legal Adviser
Pharma, Medical & Biotech saw 18 deals worth US$185.0bn, compared to 36 deals worth US$7.1bn in November ‘14
Top sector
Goldman Sachs ranked first with 14 deals worth US$364.4bn, compared to 14 deals worth US$87.7bn in November ‘14
Cleary Gottlieb Steen & Hamilton ranked first with 10 deals worth US$335.8bn, compared to 7 deals worth US$74.8bn in November ‘14
Top Financial Adviser

27EUROPE ASIA-
PACIFICMIDDLE EAST
& AFRICAABOUT
MERRILL CONTACT MERRILLJAPANGLOBAL
OVERVIEWNORTH
AMERICAC&S
AMERICA
EUROPE M&A TREND EUROPE PRIVATE EQUITY TREND
0
200
400
600
800
1,000
1,200
YTD 2015201420132012201120100
1,000
2,000
3,000
4,000
5,000
6,000
7,000
8,000
Valu
e (U
S$bn
)
Num
ber of dealsUS$
114.8bn
US$152.2bn
US$243.3bn
US$127.6bn
US$243.4bn
US$167.0bn
US$134.5bn
US$184.5bn
US$187.8bn
US$112.0bn
US$251.1bn
US$171.9bn
US$199.0bn
US$147.9bn
US$158.3bn
US$136.2bn
US$309.0bn
US$199.7bn
US$210.0bn
US$178.5bn
US$256.4bn
US$183.2bn
US$423.7bn
US$187.8bn
0
50
100
150
200
0
200
400
600
800
1,000
1,200
YTD 201520142013201220112010
Valu
e (U
S$bn
)
Num
ber of deals
US$96.2bn
US$94.0bn
US$114.0bn
US$130.4bn
US$97.7bn
US$111.5bn
US$94.4bn US$
87.0bn
US$141.0bn
US$174.2bn
US$120.3bn
US$142.6bn
TREND GRAPHS
Buyout value Exit value Buyout volume Exit Volume Q1 Q2 Q3 Q4 Volume

28EUROPE ASIA-
PACIFICMIDDLE EAST
& AFRICAABOUT
MERRILL CONTACT MERRILLJAPANGLOBAL
OVERVIEWNORTH
AMERICAC&S
AMERICA
COUNTRY BREAKDOWN AS A PROPORTION OF EUROPE TOTAL M&A VALUE EUROPE M&A SECTOR BREAKDOWN NOVEMBER 2015
TREND GRAPHS
FranceUS$3.9bn
41 deals 1.1%
SwedenUS$1.9bn 19 deals 0.5%
Ireland (Rep)US$189.2bn
6 deals 51.2%
GermanyUS$7.9bn 52 deals
2.1%
UKUS$153.6bn
84 deals 41.6%
RegionValue
VolumeValue market share
Key
Pharma, Medical & BiotechValue: US$185.0bnNumber of deals: 18Market share: 50.1%
ConsumerValue: US$123.8bnNumber of deals: 54Market share: 33.5%
Financial ServicesValue: US$23.3bnNumber of deals: 28Market share: 6.3%
TechnologyValue: US$10.4bnNumber of deals: 32Market share: 2.8%
TelecommunicationsValue: US$8.8bnNumber of deals: 3Market share: 2.4%
Czech RepublicUS$1.3bn 6 deals 0.3%
NorwayUS$1.2bn
13 deals 0%
Value (US$bn) Up/Down Value %
change
Domestic $150.1 324.0%
Inbound $219.1 472.0%
Outbound $32.5 -60.0%
ItalyUS$7.2bn 24 deals
1.9%
29EUROPE ASIA-
PACIFICMIDDLE EAST
& AFRICAABOUT
MERRILL CONTACT MERRILLJAPANGLOBAL
OVERVIEWNORTH
AMERICAC&S
AMERICA
Announced 23-Nov-15
Bidder companyPfizer Inc
Target companyAllergan plc
Dominant sectorPharma, Medical & Biotech
Announced 18-Nov-15
Bidder companyEnel SpA
Target companyEnel Green Power SpA (30.83% Stake)
Dominant sectorEnergy, Mining & Utilities
Announced 11-Nov-15
Bidder companyAnheuser-Busch InBev NV
Target companySABMiller Plc
Dominant sectorConsumer
Announced 11-Nov-15
Bidder companySantander Asset Management SA SGIIC
Target companyPioneer Investment Management SGR
Dominant sectorFinancial Services
Announced 2-Nov-15
Bidder companyVisa Inc
Target companyVisa Europe Ltd
Seller companyHSBC; Lloyds Banking Group Plc; Barclays Plc; Royal Bank of Scotland Group Plc; Worldpay Limited; PKO BP SA
Dominant sectorFinancial Services
Announced 4-Nov-15
Bidder companyArval
Target companyGeneral Electric Company (European fleet services business)
Seller companyGeneral Electric Company
Dominant sectorTransportation
Announced 16-Nov-15
Bidder companyLiberty Global Plc
Target companyCable & Wireless Communications Plc
Dominant sectorTelecommunications
Announced 23-Nov-15
Bidder companyDiebold Incorporated
Target companyWincor Nixdorf AG
Dominant sectorTechnology
Announced 2-Nov-15
Bidder companyActivision Blizzard Inc
Target companyKing Digital Entertainment Plc
Seller companyApax Partners LLP
Dominant sectorTechnology
Announced 19-Nov-15
Bidder companyCaisse de Depot et Placement du Quebec
Target companyBombardier Transportation GmbH (30% Stake)
Seller companyBombardier Inc
Dominant sectorIndustrials & Chemicals
Deal value US$1.5bn
Deal value US$1.9bn
Deal value US$2.8bn
TOP 10 ANNOUNCED DEALS FOR NOVEMBER 2015
Deal value US$183.7bn
Deal value US$120.3bn
Deal value US$18.2bn
Deal value US$8.7bn
Deal value US$4.8bn
Deal value US$3.4bn
Deal value US$3.0bn
TREND GRAPHS

30EUROPE ASIA-
PACIFICMIDDLE EAST
& AFRICAABOUT
MERRILL CONTACT MERRILLJAPANGLOBAL
OVERVIEWNORTH
AMERICAC&S
AMERICA
TOP 20 EUROPE FINANCIAL ADVISERS TOP 20 EUROPE FINANCIAL ADVISERS
LEAGUE TABLES
VALUE VOLUME
Ranking November 2015
November 2014
November 2015
November 2014 Company Name Value
(US$m) Deal count Value (US$m)
% Val. Change
1 1 Goldman Sachs 364,400 14 87,688 315.6%
2 4 JPMorgan 353,163 16 79,033 346.9%
3 6 Morgan Stanley 331,846 12 30,183 999.4%
4 10 Centerview Partners 189,656 3 18,659 916.4%
5 - Moelis & Company 189,168 4 - -
6 87 Guggenheim Partners 184,504 2 107 172,333.6%
7 11 Barclays 156,556 9 13,635 1,048.2%
8 2 Bank of America Merrill Lynch 139,958 6 87,652 59.7%
9 8 Lazard 138,957 9 20,256 586.0%
10 12 BNP Paribas 134,126 7 7,735 1,634.0%
11 13 Deutsche Bank 128,742 5 7,161 1,697.8%
12= - Robey Warshaw 120,334 1 - -
12= 230 Standard Bank Group 120,334 1 0 -
14 3 Credit Suisse 39,533 7 79,447 -50.2%
15 69 Perella Weinberg Partners 32,490 1 281 11,462.3%
16 23 UBS Investment Bank 32,458 6 2,768 1,072.6%
17 14 Evercore Partners 15,577 5 6,148 153.4%
18 - LionTree Advisors 8,853 2 - -
19 7 Citi 6,027 6 26,722 -77.4%
20 17 RBC Capital Markets 4,018 5 3,964 1.4%
Ranking November 2015
November 2014
November 2015
November 2014 Company Name Value
(US$m) Deal count Deal count Deal count Change
1 8 JPMorgan 353,163 16 13 3
2 5 Goldman Sachs 364,400 14 14 0
3 11 Morgan Stanley 331,846 12 9 3
4 1 Rothschild 3,631 10 23 -13
5 10 Barclays 156,556 9 10 -1
6 9 Lazard 138,957 9 10 -1
7 3 EY 429 9 21 -12
8 36 BNP Paribas 134,126 7 3 4
9 16 Credit Suisse 39,533 7 6 1
10 4 Deloitte 989 7 15 -8
11 2 PwC 191 7 21 -14
12 6 KPMG 49 7 14 -7
13 7 Bank of America Merrill Lynch 139,958 6 13 -7
14 53 UBS Investment Bank 32,458 6 2 4
15 13 Citi 6,027 6 7 -1
16 15 Deutsche Bank 128,742 5 7 -2
17 52 Evercore Partners 15,577 5 2 3
18 37 RBC Capital Markets 4,018 5 3 2
19 - Moelis & Company 189,168 4 - -
20 23 UniCredit Group 3,343 4 5 -1

31EUROPE ASIA-
PACIFICMIDDLE EAST
& AFRICAABOUT
MERRILL CONTACT MERRILLJAPANGLOBAL
OVERVIEWNORTH
AMERICAC&S
AMERICA
TOP 20 EUROPE LEGAL ADVISERS TOP 20 EUROPE LEGAL ADVISERS
LEAGUE TABLES
VALUE VOLUME
Ranking November 2015
November 2014
November 2015
November 2014 Company Name Value
(US$m) Deal count Value (US$m)
% Val. Change
1 3 Cleary Gottlieb Steen & Hamilton 335,827 10 74,754 349.2%
2 5 Cravath, Swaine & Moore 320,914 5 68,758 366.7%
3 19 Clifford Chance 305,920 7 17,316 1,666.7%
4 7 Wachtell, Lipton, Rosen & Katz 249,730 8 66,494 275.6%
5 16 Skadden Arps Slate Meagher & Flom 211,314 4 24,188 773.6%
6 4 Latham & Watkins 210,649 12 74,574 182.5%
7 35 Debevoise & Plimpton 188,498 2 4,993 3,675.2%
8 373 Willkie Farr & Gallagher 187,108 7 0 -
9 1 Weil Gotshal & Manges 186,758 4 80,324 132.5%
10= 33 A&L Goodbody 183,739 1 5,207 3,428.7%
10= 11 Arthur Cox 183,739 1 63,599 188.9%
12 25 Linklaters 143,665 10 11,921 1,105.1%
13 17 Freshfields Bruckhaus Deringer 136,119 8 19,920 583.3%
14= 58 Hogan Lovells International 120,334 2 1,957 6,048.9%
14= 165 Webber Wentzel 120,334 2 65 185,029.2%
16 188 Macfarlanes 51,265 3 32 160,103.1%
17 9 Loyens & Loeff 35,290 4 64,487 -45.3%
18 169 McDermott Will & Emery 32,490 1 62 52,303.2%
19 - Simpson Thacher & Bartlett 31,000 8 - -
20 42 Sullivan & Cromwell 29,385 6 4,440 561.8%
Ranking November 2015
November 2014
November 2015
November 2014 Company Name Value
(US$m) Deal count Deal count Deal count Change
1 1 Latham & Watkins 210,649 12 21 -9
2 22 Cleary Gottlieb Steen & Hamilton 335,827 10 7 3
3 3 Linklaters 143,665 10 19 -9
4 13 Allen & Overy 7,648 10 11 -1
5 12 CMS 713 10 12 -2
6 105 Wachtell, Lipton, Rosen & Katz 249,730 8 2 6
7 2 Freshfields Bruckhaus Deringer 136,119 8 21 -13
8 - Simpson Thacher & Bartlett 31,000 8 - -
9 7 Slaughter and May 17,852 8 14 -6
10 5 DLA Piper 799 8 18 -10
11 6 Clifford Chance 305,920 7 17 -10
12 373 Willkie Farr & Gallagher 187,108 7 1 6
13 9 Jones Day 3,409 7 13 -6
14 62 BA-HR 1,656 7 4 3
15 113 Sullivan & Cromwell 29,385 6 2 4
16 55 Davis Polk & Wardwell 13,913 6 4 2
17 11 Baker & McKenzie 523 6 12 -6
18 14 Eversheds 295 6 10 -4
19 76 King & Wood Mallesons 128 6 3 3
20 29 Cravath, Swaine & Moore 320,914 5 6 -1

MIDDLE EAST & AFRICA

33MIDDLE EAST & AFRICA ASIA-
PACIFICABOUT
MERRILL CONTACT MERRILLJAPANGLOBAL
OVERVIEWNORTH
AMERICAC&S
AMERICA EUROPE
MIDDLE EAST & AFRICA
With 27 deals worth US$2.4bn announced, M&A activity targeting the Middle East and Africa during November was subdued compared to a strong October (19 deals, US$12.8bn), despite eight more deals being announced. Deal value was also down compared to November 2014 (US$14.4bn, 43 deals), which was the highest November value on record.
Energy, Mining & Utilities (EMU) continued to be the most targeted sector for the month, attracting six deals worth US$660m, a considerable increase by value compared to just four deals worth US$6m announced in November 2014. The highest valued deal targeting the sector was Africa Oil Corporation’s sale of a 50% stake in its Kenya-based oil blocks to Denmark-based conglomerate AP Moller, valued at US$365m. This deal highlights interest from large-cap international bidders in the region’s oil and gas sector, a trend fueled by the prolonged drop in oil prices, resulting in attractive valuations as companies struggle to raise funds.
The highest valued deal of the month, however, was a domestic acquisition within Saudi Arabia’s media sector: Saudi Arabia-based Fund NCB Capital’s US$412m acquisition of Saudi Research & Marketing Group (SRMG) from Kingdom Holding Company. SRMG, the publisher of pan-Arab newspaper Asharq al-Awsat, is one of the Middle East’s largest media companies, and the sale resulted in the Media sector accounting for 17.2% of November’s total market share.
Total outbound activity for the region reached US$1.1bn in November, up 25% by value compared to the 11 deals worth US$887m announced in November 2014. South Africa has continued its acquisitive streak outside of its borders, investing in three deals worth US$869m this month, up 213.6% by value compared to the two deals worth US$277m announced in November 2014.
The highest valued of these deals was the US$385m acquisition of UK-based retailer Office Holdings by fashion retailer Truworths, the latest in a spate of deals in which a South African company has searched abroad for growth. This trend can be expected moving into 2016, as local market conditions such as slow economic growth, a decreased demand for exports and unfavorable exchange rate movements push South African companies to favor overseas acquisitions in place of domestic.
Moving into 2016, consolidation within the region’s EMU sector will continue to be a key theme, as companies seek to rationalize costs and streamline operations. According
to Mergermarket intelligence, Coal of Africa, the listed South Africa-focused coal miner, is on the lookout for further acquisition opportunities following its plans to make an offer for UK-based Universal Coal. Furthermore, EBJ Mining Construction, a private South African firm developing mines and mining infrastructure, is looking for multiple acquisitions in sub-Saharan Africa.
Key Stats
27 deals valued at US$2.4bn down 83.4% by value with 16 fewer deals compared to 43 deals worth US$14.4bn in November ‘14
Top Legal Adviser
Energy, Mining & Utilities saw 6 deals worth US$660m, up 10,902% by value compared to 4 deals worth US$6m in November ‘14
Top sector
JP Morgan ranked first with 2 deals worth US$750m
Clifford Chance ranked first with 1 deal worth US$1m, compared to 4 deals worth US$4m in November ‘14
Top Financial Adviser

34MIDDLE EAST & AFRICA ASIA-
PACIFICABOUT
MERRILL CONTACT MERRILLJAPANGLOBAL
OVERVIEWNORTH
AMERICAC&S
AMERICA EUROPE
MIDDLE EAST & AFRICA M&A TREND MIDDLE EAST & AFRICA PRIVATE EQUITY TREND
0
10
20
30
40
50
60
70
YTD 201520142013201220112010
0
100
200
300
400
500
Valu
e (U
S$bn
)
Num
ber of deals
US$25.4bn US$
19.8bn
US$6.6bn
US$11.5bn
US$7.3bn
US$20.7bn
US$10.5bn
US$13.5bn
US$8.8bn
US$12.3bn
US$21.6bn
US$13.6bn
US$15.4bn
US$24.3bn
US$9.1bn
US$19.3bn
US$7.2bn
US$9.0bn
US$10.2bn
US$8.1bn
US$15.2bn
US$8.0bn
US$8.2bn
US$12.8bn
0
2
4
6
8
10
12
0
10
20
30
40
50
60
70
YTD 201520142013201220112010
Valu
e (U
S$bn
)
Num
ber of deals
US$2.0bn US$
1.5bn
US$3.9bn
US$4.0bn
US$4.8bn
US$2.0bn
US$2.4bn
US$3.7bn
US$7.1bn
US$11.8bn
US$3.3bn
US$4.8bn
TREND GRAPHS
Buyout value Exit value Buyout volume Exit Volume Q1 Q2 Q3 Q4 Volume

35MIDDLE EAST & AFRICA ASIA-
PACIFICABOUT
MERRILL CONTACT MERRILLJAPANGLOBAL
OVERVIEWNORTH
AMERICAC&S
AMERICA EUROPE
COUNTRY BREAKDOWN AS A PROPORTION OF MIDDLE EAST & AFRICA TOTAL M&A VALUE MIDDLE EAST & AFRICA M&A SECTOR BREAKDOWN NOVEMBER 2015
TREND GRAPHS
KenyaUS$365m
2 deals 15.3%
MoroccoUS$375m
1 deal 15.7%
RegionValue
VolumeValue market share
Key
Energy, Mining & UtilitiesValue: US$660mNumber of deals: 6Market share: 27.6%
Financial ServicesValue: US$458mNumber of deals: 4Market share: 19.1%
MediaValue: US$412mNumber of deals: 1Market share: 17.2%
TelecommunicationsValue: US$298mNumber of deals: 3Market share: 12.5%
Pharma, Medical & BiotechValue: US$213mNumber of deals: 2Market share: 8.9%
Value (US$bn) Up/Down Value %
change
Domestic $1.7 -83.8%
Inbound $1.0 -73.5%
Outbound $1.1 25.0%
Saudi ArabiaUS$412m
1 deal 17.2%

36MIDDLE EAST & AFRICA ASIA-
PACIFICABOUT
MERRILL CONTACT MERRILLJAPANGLOBAL
OVERVIEWNORTH
AMERICAC&S
AMERICA EUROPE
Announced 1-Nov-15
Bidder companyNCB Capital Fund 13; and NCB Capital Fund 4
Target companySaudi Research & Marketing Group (55.21% Stake)
Seller companyKingdom Holding Company
Dominant sectorMedia
Announced 21-Nov-15
Bidder companyEndiama EP
Target companySociedade Mineira de Lucapa Ltd (49% Stake)
Seller companySociedade Portuguesa de Empreendimentos SA
Dominant sectorEnergy, Mining & Utilities
Announced 24-Nov-15
Bidder companySanlam Ltd; and Santam Limited
Target companySaham Finances SA (30% Stake)
Seller companyInternational Finance Corporation; and Abraaj Capital Holdings Limited
Dominant sectorFinancial Services
Announced 1-Nov-15
Bidder companyMisr Cement Qena
Target companyASEC Minya Cement (46.5% Stake); and ASEC Ready Mix Co. (55% Stake)
Seller companyASEC Cement Company SAE.
Dominant sectorConstruction
Announced 9-Nov-15
Bidder companyAP Moller - Maersk A/S
Target companyAfrica Oil Corp (Kenya blocks10BB, 13T and 10BA) (50% Stake)
Seller companyAfrica Oil Corporation
Dominant sectorEnergy, Mining & Utilities
Announced 11-Nov-15
Bidder companyHelios Investment Partners LLP; Egyptian-American Enterprise Fund; and MENA Long-Term Value Fund
Target companyFawry Banking & Payment Technology Services Ltd (85% Stake)
Seller companyInternational Finance Corporation; Bank of Alexandria Sanpaolo; Raya Holdings for Tech & Communications; and Arab African International Bank SAE
Dominant sectorBusiness Services
Announced 5-Nov-15
Bidder companyCellcom Israel Ltd
Target companyGolan Telecom Ltd
Dominant sectorTelecommunications
Announced 6-Nov-15
Bidder companySichuan Road & Bridge Co Ltd
Target companyAsmara Mining Share Company (60% Stake)
Seller companySunridge Gold Corp
Dominant sectorEnergy, Mining & Utilities
Announced 24-Nov-15
Bidder companyNMC Health Plc
Target companyFakih IVF Group (51% Stake)
Seller companyDr. Michael Fakih (Private Investor)
Dominant sectorPharma, Medical & Biotech
Announced 2-Nov-15
Bidder companyAtlas Mara Limited
Target companyFinance Bank Zambia Limited
Seller companyRajan Lekhraj Mahtani (Private Investor)
Dominant sectorFinancial Services
Deal value US$76m
Deal value US$78m
Deal value US$82m
TOP 10 ANNOUNCED DEALS FOR NOVEMBER 2015
Deal value US$412m
Deal value US$375m
Deal value US$365m
Deal value US$258m
Deal value US$189m
Deal value US$130m
Deal value US$125m
TREND GRAPHS

37MIDDLE EAST & AFRICA ASIA-
PACIFICABOUT
MERRILL CONTACT MERRILLJAPANGLOBAL
OVERVIEWNORTH
AMERICAC&S
AMERICA EUROPE
TOP 20 MIDDLE EAST & AFRICA FINANCIAL ADVISERS TOP 20 MIDDLE EAST & AFRICA FINANCIAL ADVISERS
LEAGUE TABLES
VALUE VOLUME
Ranking November 2015
November 2014
November 2015
November 2014 Company Name Value
(US$m) Deal count Value (US$m)
% Val. Change
1 - JPMorgan 750 2 - -
2 41 Rothschild 643 2 0 -
3= 14 Credit Agricole 528 1 347 52.2%
3= - Edmond de Rothschild Corporate Finance 528 1 - -
5 - BNP Paribas 365 1 - -
6 - CI Capital Holding 190 2 - -
7= - Evercore Partners 189 1 - -
7= - First Gulf Bank 189 1 - -
9 38 EFG-Hermes Holding SAE 147 2 0 -
10= 9 Deloitte 78 1 3,459 -97.7%
10= - Tempest Capital AG 78 1 - -
12= 3 Barclays 40 1 5,990 -99.3%
12= - CBZ Holdings 40 1 - -
14 5 KPMG 17 1 5,744 -99.7%
15= - AM|Capital (Africa & Middle East Capital) 0 1 - -
15= - Capitalmind Corporate Finance Advisory 0 1 - -
15= 1 Citi 0 1 9,203 -100.0%
15= 12 Lazard 0 1 594 -100.0%
15= 8 Moelis & Company 0 1 3500 -1
15= - Morgan Stanley 0 1 - -
15= - Perella Weinberg Partners 0 1 - -
Ranking November 2015
November 2014
November 2015
November 2014 Company Name Value
(US$m) Deal count Deal count Deal count Change
1 - JPMorgan 750 2 - -
2 41 Rothschild 643 2 1 1
3 - CI Capital Holding 190 2 - -
4 38 EFG-Hermes Holding SAE 147 2 1 1
5= 16 Credit Agricole 528 1 1 0
5= - Edmond de Rothschild Corporate Finance 528 1 - -
7 - BNP Paribas 365 1 - -
8= - Evercore Partners 189 1 - -
8= - First Gulf Bank 189 1 - -
10= 13 Deloitte 78 1 1 0
10= - Tempest Capital AG 78 1 - -
12= 4 Barclays 40 1 2 -1
12= - CBZ Holdings 40 1 - -
14 6 KPMG 17 1 2 -1
15= - AM|Capital (Africa & Middle East Capital) 0 1 - -
15= - Capitalmind Corporate Finance Advisory 0 1 - -
15= 2 Citi 0 1 2 -1
15= 8 Lazard 0 1 2 -1
15= 7 Moelis & Company 0 1 2 -1
15= - Morgan Stanley 0 1 - -
15= - Perella Weinberg Partners 0 1 - -

38MIDDLE EAST & AFRICA ASIA-
PACIFICABOUT
MERRILL CONTACT MERRILLJAPANGLOBAL
OVERVIEWNORTH
AMERICAC&S
AMERICA EUROPE
TOP 20 MIDDLE EAST & AFRICA LEGAL ADVISERS TOP 20 MIDDLE EAST & AFRICA LEGAL ADVISERS
LEAGUE TABLES
VALUE VOLUME
Ranking November 2015
November 2014
November 2015
November 2014 Company Name Value
(US$m) Deal count Value (US$m)
% Val. Change
1= 7 Clifford Chance 1 1 4 -87.1%
1= - Cohen Amir-Aslani 1 1 - -
1= - Dentons 1 1 - -
1= - Dethomas Peltier Kopf Juvigny 1 1 - -
1= - White & Case 1 1 - -
6 46 Simpson Thacher & Bartlett 0 2 0 -
7 - Vinson & Elkins 0 1 - -
8 - Arab Legal Consultants 0 2 - -
9= 2 Allen & Overy 0 1 7 -97.2%
9= - Clyde & Co 0 1 - -
11= - Cyril Amarchand Mangaldas 0 1 - -
11= 30 J Sagar Associates 0 1 0 182.9%
11= - Khaitan & Co 0 1 - -
11= - Ropes & Gray 0 1 - -
15= 42 Herbert Smith Freehills 0 1 0 -
15= - HWL Ebsworth Lawyers 0 1 - -
15= - Lewis King Blumberg 0 1 - -
18= - Al Tamimi & Partners 0 1 - -
18= - Ibrachy Law Firm 0.082 1 - -
18= 3 Norton Rose Fulbright 0.082 1 6.56 -0.9875
18= - Zaki Hashem & Partners 0.082 1 - -
Ranking November 2015
November 2014
November 2015
November 2014 Company Name Value
(US$m) Deal count Deal count Deal count Change
1 46 Simpson Thacher & Bartlett 0 2 1 1
2 - Arab Legal Consultants 0 2 - -
3= 7 Clifford Chance 1 1 4 -3
3= - Cohen Amir-Aslani 1 1 - -
3= - Dentons 1 1 - -
3= - Dethomas Peltier Kopf Juvigny 1 1 - -
3= - White & Case 1 1 - -
8 - Vinson & Elkins 0 1 - -
9= 1 Allen & Overy 0 1 5 -4
9= - Clyde & Co 0 1 - -
11= - Cyril Amarchand Mangaldas 0 1 - -
11= 32 J Sagar Associates 0 1 1 0
11= - Khaitan & Co 0 1 - -
11= - Ropes & Gray 0 1 - -
15= 42 Herbert Smith Freehills 0 1 1 0
15= - HWL Ebsworth Lawyers 0 1 - -
15= - Lewis King Blumberg 0 1 - -
18= - Al Tamimi & Partners 0 1 - -
18= - Ibrachy Law Firm 0.082 1 - -
18= 2 Norton Rose Fulbright 0.082 1 5 -4
18= - Zaki Hashem & Partners 0.082 1 - -

ASIA-PACIFIC (excluding Japan)

40ASIA- PACIFIC ABOUT
MERRILL CONTACT MERRILLJAPANGLOBAL
OVERVIEWNORTH
AMERICAC&S
AMERICA EUROPE MIDDLE EAST & AFRICA
ASIA-PACIFIC (excluding Japan)
M&A in Asia-Pacific (excl. Japan) continued to grow steadily each month since July 2015. November 2015 was the highest-valued November on Mergermarket record (since 2001). A total of 262 deals worth US$78.9bn were announced, up 52.3% by value with 43 fewer deals compared to same period last year.
The strong M&A activity in the region was greatly influenced by robust dealmaking activity in China. Transactions targeting Chinese companies recorded a year-on-year (YoY) increase of US$28.7bn, which surpassed the total YoY increase in Asia-Pacific (US$27.1bn). China, despite reports of continued economic slowdown, still dominates the M&A market in November with 165 deals valued at US$57.1bn, the highest monthly value this year. It is followed by Australia (28 deals, US$7bn) and South Korea (9 deals, US$3.9bn). China’s share of value in Asia-Pacific (excl. Japan) jumped to 72.3% from 54.8% in November 2014. Out of the top 10 largest deals in Asia-Pacific, seven deals targeted Chinese companies.
Energy, Mining & Utilities was predominantly the most active sector in this past month, mainly due to hosting the largest deal of the period, electricity generation company China Yangtze Power’s US$12.5bn acquisition of hydropower generation company Sanxia Jinshajiang Chuanyun Hydroelectric Power. It is also the second-largest alternative energy deal in the region on Mergermarket
record (since 2001). As a result, the Energy, Mining & Utilities sector accounted for 31.7% of total regional value, with 21 deals worth US$25bn, increasing 161.4% by value compared to the same period last year.
Telecommunications is the second-leading sector in the region with six deals worth US$8.4bn, representing 10.7% of total market share for the region. The high Telecommunications deal value can be attributed primarily to the continuation of China’s State-Owned Enterprises (SOEs) reforms in the sector. Following the restructuring of US$33.7bn wireless tower assets under China Mobile, China Telecom and China Unicom in October, China Mobile’s US$5.3bn purchase of the fixed line telecom and broad band business of China TieTong Telecommunications is the largest Telecommunications deal and the second-largest transaction in November.
Contrary to the prosperous domestic transactions, outbound and inbound deals announced by Asian companies both decreased in value compared to the
previous November. Outbound deals reached US$3.9bn, decreasing by 63.1% compared to US$10.5bn in November 2014. Inbound deals decreased by 33.4% to US$6bn compared to US$8.9bn in November 2014. Whereas, Australia continued to attract a growing amount of investments from outside Asia, which has been observed throughout 2015.
Total value to-date (US$780.6bn) has already surpassed the annual value of any other previous year. Since December is traditionally one of the strongest months for dealmaking in China and Asia-Pacific (excl. Japan), the annual performance of the M&A market in the region will be even more promising.
Key Stats
262 deals valued at US$78.9bn up 52.3% by value with 43 more deals compared to 305 deals worth US$51.8bn in November ‘14
Top Legal Adviser
Energy, Mining & Utilities saw 21 deals worth US$25bn, up 161.4% by value compared to 25 deals worth US$9.6bn in November ‘14
Top sector
Huatai United Securities ranked first with 8 deals worth US$17.3bn, compared to 4 deals worth US$3.1bn in November ‘14
Dacheng Law Offices ranked first with 3 deals worth US$12.6bn, compared to 0 deals in November ‘14
Top Financial Adviser

41ASIA- PACIFIC ABOUT
MERRILL CONTACT MERRILLJAPANGLOBAL
OVERVIEWNORTH
AMERICAC&S
AMERICA EUROPE MIDDLE EAST & AFRICA
ASIA-PACIFIC M&A TREND ASIA-PACIFIC PRIVATE EQUITY TREND
0
100
200
300
400
500
600
700
800
YTD 2015201420132012201120100
500
1,000
1,500
2,000
2,500
3,000
3,500
4,000
Valu
e (U
S$bn
)
Num
ber of deals
US$66.7bn
US$72.1bn
US$131.3bn
US$92.8bn
US$87.5bn
US$79.4bn
US$73.1bn
US$115.9bn
US$82.7bn
US$81.1bn
US$85.2bn
US$105.0bn
US$69.1bn
US$107.8bn
US$116.5bn
US$116.9bn
US$117.0bn
US$169.9bn
US$217.8bn
US$140.4bn
US$197.6bn
US$251.0bn
US$157.6bn
US$174.4bn
0
10
20
30
40
50
60
70
0
50
100
150
200
250
300
350
400
YTD 201520142013201220112010
Valu
e (U
S$bn
)
Num
ber of deals
US$31.1bn
US$20.1bn
US$42.7bn
US$29.4bn
US$27.9bn
US$18.8bn
US$43.0bn
US$29.9bn
US$66.7bn
US$35.8bn
US$62.2bn
US$37.5bn
TREND GRAPHS
Buyout value Exit value Buyout volume Exit Volume Q1 Q2 Q3 Q4 Volume

42ASIA- PACIFIC ABOUT
MERRILL CONTACT MERRILLJAPANGLOBAL
OVERVIEWNORTH
AMERICAC&S
AMERICA EUROPE MIDDLE EAST & AFRICA
COUNTRY BREAKDOWN AS A PROPORTION OF ASIA-PACIFIC TOTAL M&A VALUE ASIA-PACIFIC M&A SECTOR BREAKDOWN NOVEMBER 2015
Energy, Mining & UtilitiesValue: US$25bnNumber of deals: 21Market share: 31.7%
TelecommunicationsValue: US$8.4bnNumber of deals: 6Market share: 10.7%
Industrials & ChemicalsValue: US$7.4bnNumber of deals: 52Market share: 9.4%
ConstructionValue: US$6.7bnNumber of deals: 11Market share: 8.5%
Financial ServicesValue: US$6.5bnNumber of deals: 22Market share: 8.3%
RegionValue
VolumeValue market share
Key
China US$57.1bn 165 deals
72.3%South KoreaUS$3.9bn
9 deals 4.9%
AustraliaUS$7bn 28 deals
8.9%
IndiaUS$2bn 15 deals
2.5%
Singapore US$1.3bn
7 deals 1.7%
Value (US$bn) Up/Down Value %
change
Domestic $72.9 70.2%
Inbound $6 -33.4%
Outbound $3.9 -63.1%
TREND GRAPHS
Hong KongUS$0.7bn 8 deals 0.8%

43ASIA- PACIFIC ABOUT
MERRILL CONTACT MERRILLJAPANGLOBAL
OVERVIEWNORTH
AMERICAC&S
AMERICA EUROPE MIDDLE EAST & AFRICA
Announced 7-Nov-15
Bidder companyChina Yangtze Power Co Ltd
Target companySanxia Jinshajiang Chuanyun Hydroelectric Power Co Ltd
Seller companyChina Three Gorges Corporation; Sichuan Energy Investment Group Co Ltd; and Yunan Energy Investment Group Co Ltd
Dominant sectorEnergy, Mining & Utilities
Announced 2-Nov-15
Bidder companyCJ HelloVision Co Ltd
Target companySK Broadband Co Ltd
Dominant sectorTelecommunications
Announced 27-Nov-15
Bidder companyChina Mobile Limited
Target companyChina TieTong Telecommunications Corporation (Fixed line telecom and broad band business)
Seller companyChina Mobile Communications Corporation
Dominant sectorTelecommunications
Announced 4-Nov-15
Bidder companyConsortium led by Mr Li Xiting
Target companyMindray Medical International Limited (72.3% Stake)
Dominant sectorPharma, Medical & Biotech
Announced 30-Nov-15
Bidder companyHainan Island Construction Co Ltd
Target companyHNA Infrastructure Industry Group Co Ltd
Seller companyHNA Group Co Ltd
Dominant sectorConstruction
Announced 23-Nov-15
Bidder companyChina General Nuclear Power Corporation Ltd
Target companyEdra Global Energy Berhad
Seller company1Malaysia Development Berhad
Dominant sectorEnergy, Mining & Utilities
Announced 6-Nov-15
Bidder companyAlibaba Group Holding Ltd
Target companyYouku Tudou Inc (79.55% Stake)
Dominant sectorMedia
Announced 23-Nov-15
Bidder companyEquifax Inc
Target companyVeda Group Limited
Dominant sectorBusiness Services
Announced 7-Nov-15
Bidder companyAn investment group led by Ping An Asset Management Co Ltd
Target companyChina Yangtze Power Co Ltd (9.09% Stake)
Dominant sectorEnergy, Mining & Utilities
Announced 10-Nov-15
Bidder companyZhejiang Chint Electrics Co Ltd
Target companyZhejiang Zhengtai New Energy Co Ltd
Seller companyInvestor group led by Chint Group Co Ltd
Dominant sectorEnergy, Mining & Utilities
Deal value US$1.5bn
Deal value US$1.9bn
Deal value US$2.3bn
TOP 10 ANNOUNCED DEALS FOR NOVEMBER 2015
Deal value US$12.5bn
Deal value US$5.3bn
Deal value US$4.1bn
Deal value US$3.8bn
Deal value US$3.8bn
Deal value US$2.7bn
Deal value US$2.4bn
TREND GRAPHS

44ASIA- PACIFIC ABOUT
MERRILL CONTACT MERRILLJAPANGLOBAL
OVERVIEWNORTH
AMERICAC&S
AMERICA EUROPE MIDDLE EAST & AFRICA
TOP 20 ASIA-PACIFIC FINANCIAL ADVISERS TOP 20 ASIA-PACIFIC FINANCIAL ADVISERS
LEAGUE TABLES
VALUE VOLUME
Ranking November 2015
November 2014
November 2015
November 2014 Company Name Value
(US$m) Deal count Value (US$m)
% Val. Change
1 15 Huatai United Securities 17,334 8 3,116 456.3%
2 17 CITIC Securities 16,576 3 2,729 507.4%
3 28 Morgan Stanley 14,692 10 1,494 883.4%
4 7 UBS Investment Bank 9,378 5 4,982 88.2%
5 6 JPMorgan 5,963 9 5,549 7.5%
6 3 Goldman Sachs 5,710 6 8,108 -29.6%
7 5 Rothschild 3,623 5 7,374 -50.9%
8 9 Macquarie Group 3,618 5 4,262 -15.1%
9 37 Lazard 3,121 3 649 380.9%
10 4 Deutsche Bank 2,937 5 7,658 -61.6%
11 24 Credit Suisse 2,730 5 2,224 22.8%
12 49 Maybank Investment Bank 2,632 3 348 656.3%
13 1 Guotai Junan Securities 2,572 10 10,950 -76.5%
14 53 Everbright Securities 2,316 6 196 1081.6%
15 41 HSBC 2,290 2 524 337.0%
16 - Hengtai Changcai Securities 2,216 2 - -
17 - Ping An Securities 2,110 2 - -
18 12 ING 1,772 2 3,184 -44.3%
19= 14 Evercore Partners 1,578 1 3,123 -49.5%
19= 51 Jefferies 1,578 1 240 557.5%
Ranking November 2015
November 2014
November 2015
November 2014 Company Name Value
(US$m) Deal count Deal count Deal count Change
1 17 Morgan Stanley 14,692 10 4 6
2 12 Guotai Junan Securities 2,572 10 4 6
3 1 JPMorgan 5,963 9 7 2
4 15 Huatai United Securities 17,334 8 4 4
5 3 Goldman Sachs 5,710 6 6 0
6 60 Everbright Securities 2,316 6 1 5
7 25 KPMG 378 6 3 3
8 8 UBS Investment Bank 9,378 5 5 0
9 7 Rothschild 3,623 5 5 0
10 19 Macquarie Group 3,618 5 3 2
11 4 Deutsche Bank 2,937 5 6 -1
12 9 Credit Suisse 2,730 5 5 0
13 - China Securities 956 5 - -
14 - Dongxing Securities 411 5 - -
15 - New Times Securities 1,235 4 - -
16 - Citi Orient Securities 522 4 - -
17 6 Deloitte 143 4 6 -2
18 5 CITIC Securities 16,576 3 6 -3
19 50 Lazard 3,121 3 1 2
20 57 Maybank Investment Bank 2,632 3 1 2

45ASIA- PACIFIC ABOUT
MERRILL CONTACT MERRILLJAPANGLOBAL
OVERVIEWNORTH
AMERICAC&S
AMERICA EUROPE MIDDLE EAST & AFRICA
TOP 20 ASIA-PACIFIC LEGAL ADVISERS TOP 20 ASIA-PACIFIC LEGAL ADVISERS
LEAGUE TABLES
VALUE VOLUME
Ranking November 2015
November 2014
November 2015
November 2014 Company Name Value
(US$m) Deal count Value (US$m)
% Val. Change
1 17 Dacheng Law Offices 12,564 3 3,055 311.3%
2 163 Skadden Arps Slate Meagher & Flom 8,097 6 0 -
3 29 Fangda Partners 6,731 3 2,169 210.3%
4 34 Shearman & Sterling 6,722 3 1,869 259.7%
5 58 Simpson Thacher & Bartlett 5,795 4 649 792.9%
6 105 Kirkland & Ellis 5,206 2 39 13,248.7%
7 36 Herbert Smith Freehills 5,140 8 1,728 197.5%
8 12 King & Wood Mallesons 4,669 11 3,418 36.6%
9 128 O'Melveny & Myers 4,104 2 12 34,100.0%
10 - TransAsia Lawyers 3,869 1 - -
11 39 Lee & Ko 3,571 4 1,589 124.7%
12 56 Shin & Kim 3,571 3 681 424.4%
13 2 Grandall Law Firm 3,444 9 8,331 -58.7%
14 96 Kim & Chang 3,145 3 70 4,392.9%
15= - Conyers Dill & Pearman 2,403 1 - -
15= 24 Davis Polk & Wardwell 2,403 1 2,396 0.3%
17 44 Norton Rose Fulbright 2,290 2 993 130.6%
18 37 Allens 2,108 2 1,708 23.4%
19 - King & Spalding 1,864 1 - -
20 52 Ashurst 1,703 3 780 118.3%
Ranking November 2015
November 2014
November 2015
November 2014 Company Name Value
(US$m) Deal count Deal count Deal count Change
1 1 King & Wood Mallesons 4,669 11 11 0
2 13 Grandall Law Firm 3,444 9 5 4
3 17 Herbert Smith Freehills 5,140 8 5 3
4 163 Skadden Arps Slate Meagher & Flom 8,097 6 1 5
5 59 AllBright Law Offices 568 6 2 4
6 3 J Sagar Associates 1,344 5 10 -5
7 52 Simpson Thacher & Bartlett 5,795 4 2 2
8 30 Lee & Ko 3,571 4 3 1
9 132 DeHeng Law Offices 983 4 1 3
10 32 Khaitan & Co 856 4 3 1
11 118 Chen & Co Law Firm 663 4 1 3
12 37 Zhong Lun Law Firm 517 4 3 1
13 - JunZeJun Law Offices 304 4 - -
14 10 AZB & Partners 261 4 6 -2
15 - Deheng Law Firm 194 4 - -
16 5 Dacheng Law Offices 12,564 3 8 -5
17 27 Fangda Partners 6,731 3 3 0
18 79 Shearman & Sterling 6,722 3 1 2
19 12 Shin & Kim 3,571 3 6 -3
20 62 Kim & Chang 3,145 3 2 1

JAPAN

47JAPANGLOBAL
OVERVIEWNORTH
AMERICAC&S
AMERICA EUROPE MIDDLE EAST & AFRICA
ASIA- PACIFIC
ABOUT MERRILL
CONTACT MERRILL
JAPAN
Deal value to-date surged to US$52.9bn, up 73.4% in comparison to YTD value 2014, where the US$6.1bn worth of 36 deals announced in November represented a 21.9% increase compare to US$5bn from last November.
Deals in November were dominated by transactions in the Financial Service sector. Three deals worth US$4.2bn in the sector accounted for 68.7% of the total market share.
Contracting the multi-billion-dollar outbound takeovers by Japanese insurers earlier this year, November witnessed a US$2.7bn merger between two national insurance giants, Nippon Life and Mitsui Life. This was also the largest deal announced in November and the fifth largest insurance deal led by Japanese buyer this year.
The Consumer sector experienced strong deal activity this year, resulting in the sector topping the value ranking with 75 deals worth US$13.1bn, a 165% growth compared to US$4.9bn with 76 deals announced in the same period 2014. The booming in this sector is largely due to a growing trend of retail consolidation of supermarkets, drugstores, and specialty chains.
FamilyMart, who has successfully added the total number of stores up to over 20,000 via the US$4bn acquisitions this year will push
itself from third to second market position as a convenient chain store operator.
According to Mergermarket, Tsuruha Holdings, a Japan-based drugstore chain operator, who currently owns roughly 1,600 stores, has revealed a plan of reaching 2,000 store threshold by 2019 through acquisitions.
Japan’s outbound M&A transactions kept ramping up after reaching the momentum of exceeding the 2014 annual total earlier this September.
Deals worth of US$82.7bn announced to- date represented a 71.2% growth compare to the same period prior, and was the second highest YTD value on Mergermareket record, following US$110.4bn in 2012.
While the US continued to be the most predominant investment destiny for Japanese companies, 2015 witnessed some heavy capital injections to its neighbor countries by Corporate Japan. YTD investment value in Asia reached US$21.7bn, almost tripling the amount of the same period in 2014 (US$7.8bn),
accounting for a 33.5% of outbound transaction values so far in the year.
By sector, outbound deal volume YTD have centered on acquisitions in Industrials and Chemicals. The sector saw 82 announcements worth of US$9bn deals, represented a 25% value growth with 13 more announcements from the previous same period of time.
The emerging of billion-dollar mega deals as of late brought domestic transactions into the spotlight of the country’s M&A scene. Deal value increased by 172.8% to US$5.1bn in November compared to US$1.9bn in November 2014, in conjunction with a 43.7% year-on-year growth from the same period in 2014. While Japan still has a long way to go in its economic recovery, a rejuvenating domestic market has made it more attainable for 2015 to become a new momentum year for M&A.
Key Stats
36 deals valued at US$6.1bn up 21.9% by value with 5 more deals compared to 31 deals worth US$5bn in November ‘14
Top Legal Adviser
Financial Services saw 3 deals worth US$4.2bn, compared to 2 deals worth US$9m in November ‘14
Top sector
Morgan Stanley ranked first with 4 deals worth US$4.6bn, compared to 6 deals worth US$3bn in November ‘14
Mori Hamada & Matsumoto ranked first with 5 deals worth US$4.5bn, compared to 10 deals worth US$1.4bn in November ‘14
Top Financial Adviser

48JAPANGLOBAL
OVERVIEWNORTH
AMERICAC&S
AMERICA EUROPE MIDDLE EAST & AFRICA
ASIA- PACIFIC
ABOUT MERRILL
CONTACT MERRILL
JAPAN M&A TREND JAPAN M&A PRIVATE EQUITY TREND
0
10
20
30
40
50
60
70
80
90
YTD 2015201420132012201120100
100
200
300
400
500
Valu
e (U
S$bn
)
Num
ber of deals
US$13.9bn
US$7.3bn
US$33.3bn
US$6.8bn
US$12.3bn
US$17.2bn
US$32.6bn
US$21.5bn
US$14.1bn
US$26.3bn
US$13.9bn
US$16.2bn
US$8.1bn
US$15.2bn
US$4.8bn
US$7.3bn
US$7.1bn
US$10.8bn
US$5.0bn
US$9.3bn
US$9.1bn
US$9.0bn
US$21.6bn
US$13.2bn
0
5
10
15
20
YTD 2015201420132012201120100
10
20
30
40
50
Valu
e (U
S$bn
)
Num
ber of deals
US$2.8bn
US$6.1bn
US$11.2bn
US$19.6bn
US$8.9bn
US$5.0bn US$
4.0bn
US$4.7bn
US$5.3bn
US$6.4bn
US$7.4bn
US$10.5bn
TREND GRAPHS
Buyout value Exit value Buyout volume Exit Volume Q1 Q2 Q3 Q4 Volume

49JAPANGLOBAL
OVERVIEWNORTH
AMERICAC&S
AMERICA EUROPE MIDDLE EAST & AFRICA
ASIA- PACIFIC
ABOUT MERRILL
CONTACT MERRILL
COUNTRY BREAKDOWN AS A PROPORTION OF JAPAN TOTAL M&A VALUE JAPAN M&A SECTOR BREAKDOWN NOVEMBER 2015
TREND GRAPHS
Financial ServicesValue: US$4.2bnNumber of deals: 3Market share: 68.7%
Pharma, Medical & BiotechValue: US$1.0bnNumber of deals: 3Market share: 16.5%
ConstructionValue: US$291.6mNumber of deals: 3Market share: 4.8%
LeisureValue: US$190.6mNumber of deals: 2Market share:3.1%
Industrials & ChemicalsValue: US$178.9bnNumber of deals: 7Market share: 2.9%
Key
Cross-borderValue
Value change
DomesticUS$5.1bn
172.8%
InboundUS$965.4m
-69.1%
OutboundUS$1.5bn
33.0%

50JAPANGLOBAL
OVERVIEWNORTH
AMERICAC&S
AMERICA EUROPE MIDDLE EAST & AFRICA
ASIA- PACIFIC
ABOUT MERRILL
CONTACT MERRILL
Announced 06-Nov-2015
Bidder companyNippon Life Insurance Company
Target companyMitsui Life Insurance Company Limited
Seller companyMitsui & Co Ltd; Sumitomo Mitsui Trust Bank Limited; Daiwa Securities SMBC Principal Investment Co Ltd; Sumitomo Mitsui Banking Corporation; Mitsui Fudosan Co Ltd; Citibank Singapore; Mitsui Sumitomo Insurance Co Ltd; and Nomura Financial Partners Co Ltd
Dominant sectorFinancial Services
Announced 11-Nov-2015
Bidder companyShanghai Yuyuan Tourist Mart Co Ltd
Target companyHoshino Resort Tomamu Co Ltd
Seller companyHoshino Resort Co Ltd; and Matakite BV
Dominant sectorLeisure
Announced 02-Nov-2015
Bidder companyThe Joyo Bank Ltd
Target companyAshikaga Holdings Co Ltd
Seller companyORIX Corporation; and Nomura Holdings Inc
Dominant sectorFinancial Services
Announced 10-Nov-2015
Bidder companyTAMAX
Target companyTama Home Co Ltd (35.02% Stake)
Dominant sectorConstruction
Announced 11-Nov-2015
Bidder companyLEO Pharma AS
Target companyAstellas Pharma Inc (global dermatology business)
Seller companyAstellas Pharma Inc
Dominant sectorMedical
Announced 16-Nov-2015
Bidder companyInfocom Corporation; Daito Trust Construction Co Ltd; and Toho Holdings Co Ltd
Target companySolasto Corporation (45.5% Stake)
Seller companyThe Carlyle Group
Dominant sectorMedical
Announced 20-Nov-2015
Bidder companySekisui Chemical Co Ltd
Target companyEIDIA Co Ltd
Seller companyEisai Co Ltd
Dominant sectorMedical
Announced 26-Nov-2015
Bidder companyMitsubishi Kagaku Foods Corporation
Target companyEisai Food & Chemical Co Ltd
Seller companyEisai Co Ltd
Dominant sectorIndustrials and Chemicals
Announced 30-Nov-2015
Bidder companyPanasonic Corporation
Target companyPanaHome Reform (49% Stake)
Dominant sectorConstruction
Announced 17-Nov-2015
Bidder companyM/A-COM Technology Solutions Holdings Inc
Target companyFiBest Limited
Dominant sectorIndustrials and Chemicals
Deal value US$60m
Deal value US$74m
Deal value US$99m
TOP 10 ANNOUNCED DEALS FOR NOVEMBER 2015
Deal value US$2.7bn
Deal value US$1.4bn
Deal value US$724m
Deal value US$182m
Deal value US$157m
Deal value US$149m
Deal value US$126m
TREND GRAPHS

51JAPANGLOBAL
OVERVIEWNORTH
AMERICAC&S
AMERICA EUROPE MIDDLE EAST & AFRICA
ASIA- PACIFIC
ABOUT MERRILL
CONTACT MERRILL
TOP 15 JAPAN LEGAL ADVISERS TOP 15 JAPAN LEGAL ADVISERS
LEAGUE TABLES
VALUE VOLUME
Ranking November 2015
November 2014
November 2015
November 2014 Company Name Value
(US$m) Deal count Value (US$m)
% Val. Change
1 1 Morgan Stanley 4,562 4 2,960 54.1%
2 2 Nomura Holdings 4,418 4 1,265 249.2%
3 - Citi 3,076 2 - -
4 12 Sumitomo Mitsui Financial Group 2,894 5 123 2,252.8%
5 5 Daiwa Securities Group 2,840 5 489 480.8%
6 20 Deloitte 2,346 3 34 6,800.0%
7 15 KPMG 1,486 4 95 1,464.2%
8 - JPMorgan 724 1 - -
9= - Deutsche Bank 366 1 - -
9= 8 Lazard 366 1 200 83.0%
9= 9 Rothschild 366 1 155 136.1%
12 - Jefferies 333 1 - -
13= 4 Bank of America Merrill Lynch 218 1 677 -67.8%
13= - Janes Capital Partners 218 1 - -
15 3 Mizuho Financial Group 191 3 904 -78.9%
Ranking November 2015
November 2014
November 2015
November 2014 Company Name Value
(US$m) Deal count Deal count Deal count Change
1 5 Sumitomo Mitsui Financial Group 2,894 5 4 1
2 4 Daiwa Securities Group 2,840 5 4 1
3 2 Morgan Stanley 4,562 4 6 -2
4 1 Nomura Holdings 4,418 4 8 -4
5 10 KPMG 1,486 4 2 2
6 7 Deloitte 2,346 3 3 0
7 3 Mizuho Financial Group 191 3 6 -3
8 - Citi 3,076 2 - -
9 11 PwC 56 2 2 0
10 - JPMorgan 724 1 - -
11= - Deutsche Bank 366 1 - -
11= 14 Lazard 366 1 1 0
11= 9 Rothschild 366 1 2 -1
14 - Jefferies 333 1 - -
15= 8 Bank of America Merrill Lynch 218 1 2 -1
15= - Janes Capital Partners 218 1 - -

52JAPANGLOBAL
OVERVIEWNORTH
AMERICAC&S
AMERICA EUROPE MIDDLE EAST & AFRICA
ASIA- PACIFIC
ABOUT MERRILL
CONTACT MERRILL
TOP 15 JAPAN FINANCIAL ADVISERS TOP 15 JAPAN FINANCIAL ADVISERS
LEAGUE TABLES
VALUE VOLUME
Ranking November 2015
November 2014
November 2015
November 2014 Company Name Value
(US$m) Deal count Value (US$m)
% Val. Change
1 1 Mori Hamada & Matsumoto 4,470 5 1,375 225.1%
2 3 Nagashima Ohno & Tsunematsu 4,187 3 983 325.9%
3 - Latham & Watkins 902 2 - -
4 - Gleiss Lutz 724 3 - -
5 - Kromann Reumert 724 1 - -
6= 22 Ashurst 366 1 39 838.5%
6= - King & Wood Mallesons 366 1 - -
8= 19 J Sagar Associates 342 1 75 356.0%
8= 16 Khaitan & Co 342 1 106 222.6%
10 36 White & Case 341 2 14 2,335.7%
11= - Covington & Burling 333 1 - -
11= - Goodwin Procter 333 1 - -
13= - Faegre Baker Daniels 218 1 - -
13= - Nixon Peabody 218 1 - -
13= - Shearman & Sterling 218 1 - -
Ranking November 2015
November 2014
November 2015
November 2014 Company Name Value
(US$m) Deal count Deal count Deal count Change
1 1 Mori Hamada & Matsumoto 4,470 5 10 -5
2 3 Nagashima Ohno & Tsunematsu 4,187 3 4 -1
3 - Gleiss Lutz 724 3 - -
4 - Latham & Watkins 902 2 - -
5 8 White & Case 341 2 2 0
6 9 Anderson Mori & Tomotsune 212 2 1 1
7 26 Oh-Ebashi LPC & Partners 39 2 1 1
8 - Kromann Reumert 724 1 - -
9= 24 Ashurst 366 1 1 0
9= - King & Wood Mallesons 366 1 - -
11= 21 J Sagar Associates 342 1 1 0
11= 18 Khaitan & Co 342 1 1 0
13= - Covington & Burling 333 1 - -
13= - Goodwin Procter 333 1 - -
15= - Faegre Baker Daniels 218 1 - -
15= - Nixon Peabody 218 1 - -
15= - Shearman & Sterling 218 1 - -

2HRSTO OPEN A PROJECT
There is an Art to due diligence
[email protected] www.datasite.com
1DEDICATED PROJECTMANAGEMENT TEAM
150PROJECT MANAGERS
WORLDWIDE
LOCAL SUPPORT FROM
47GLOBAL LOCATIONS
#1VIRTUAL DATA ROOM
24HR
MULTILINGUAL
SERVICE

[email protected] www.datasite.com
Smart.Simple.Secure.
WINNERS OF5 MAJOR AWARDS
IN 2015
1ST VDR TO ACHIEVEISO27001 CERTIFICATION
1 CHAIN OFCUSTODY OVER DATA
4,446
VIRTUAL DATA ROOMSOPENED WORLDWIDE
LAST YEAR
850 MILLIONPAGES OF CONFIDENTIAL
DATA PROTECTED
35,000
VIRTUAL DATA ROOMPROJECTS SECURED
SINCE 2003

55
MERRILL CORPORATION CONTACTS
CONTACT MERRILLJAPAN ABOUT
MERRILL GLOBAL
OVERVIEWNORTH
AMERICAC&S
AMERICA EUROPE MIDDLE EAST & AFRICA
ASIA- PACIFIC
EXECUTIVE MANAGEMENTEd BifulkPresident Tel: +1 212 229 6563
EXECUTIVE SALESChris Beckmann Regional Director, Germany, Switzerland & Poland Tel: +49 69 244 321 480
Martin Alamri Regional Director, Germany Tel: +49 69 244 321 471
Jérôme Pottier Regional Director, France, Luxembourg & Switzerland Tel: +33 1 40 06 13 12
Hakema El-Hadad Regional Director, France & Northern Africa Tel: +33 1 40 06 13 10
Paul Victoor Regional Director, France Tel: +33 1 40 06 13 02
Mike Hinchliffe Regional Director, Europe Tel: +44 20 7422 6256
Adam Pang Regional Director, Europe Tel: +44 20 7422 6268
Merlin J. Piscitelli Regional Director, International Tel: +44 20 7422 6266
Mary Walsh Regional Director, Europe Tel: +44 20 7422 6270
Bryan Brighton Regional Director, Europe Tel: +44 20 7422 6212
Jonathan Hughes Regional Director, Europe Tel: +44 20 7422 6267
Sean Dainty Regional Director, UK Tel: +44 78157 61142
Alex Gross Regional Director, Eastern Europe & Middle East Tel: +49 69 7593 7148
Alvaro Ortega Regional Director, Southern Europe Tel: +39 27 636 2314 Tel: +34 91 769 1022
Nertila Asani Account Manager, UK & Africa Tel: +44 20 7422 6272
David McDonald Account Manager, Europe Tel: +44 20 7422 6127
Laura Smith Account Manager, Nordics & UK Tel: +44 20 7422 6271
Desmond Chua Regional Director, SE Asia, Australia and New Zealand Tel: +65 6653 1666
Chhin Lee Regional Director, Asia-Pacific Tel: +852 5686 5803
Jacey Paik Regional Director, Asia-Pacific Tel: +852 2536 2288
Max Leroy Regional Director, Asia-Pacific Tel: +852 2536 2288
Manuel Bentosinos Regional Director, Mexico, Columbia & Caribbean Tel: +52 55 9171 2237
Luis Felipe Salles Cunha Regional Director, Latin America Tel: +55 11 3895 8545
Ana Paula Macêdo Távora de Castro Vice President, South America Tel: +55 (11) 3895 8542
Alex Purificacao Regional Director, Brazil Tel: +55 11 3568 2429
Brian Gilbreath Vice President, Northwest Tel: +1 404 934 8085
Hank Gregory SVP, Western Canada & Pacific Northwest Tel: +1 604 603 4360
Todd Caven Northern California, Pacific Northwest & Western Canada Tel: +1 651 632 4369
Ryan MacMillan Regional Director, Canada Tel: +1 416 214 2448
Michael Kennedy Regional Director, New England Tel: +1 207 829 4369
Carla Rainho Regional Director, Boston Tel: +1 617 535 1647
Donald Davis Vice President, New York Tel: +1 212 229 6684
Steve Piccone Vice President, New York Tel: +1 212 229 6883
Forrest R. Doane Regional Director, New York Tel: +1 212 229 6620
Bill Polese Regional Director, New York Tel: +1 212 229 6612
John McElrone Regional Director, New York Tel: +1 212 229 6656
Tom Kade Regional Director, New York Tel: +1 516 404 2163

56
MERRILL CORPORATION CONTACTS
CONTACT MERRILLJAPAN ABOUT
MERRILL GLOBAL
OVERVIEWNORTH
AMERICAC&S
AMERICA EUROPE MIDDLE EAST & AFRICA
ASIA- PACIFIC
Connor Nicosia Regional Director, New York Tel: +1 212 229 6677
James Viglione Regional Director, New York Tel: +1 212 229 6890
Frank Bradley Business Development Associate, New York Tel: +1 212 367 6124
Rosie Corcoran Account Executive, New York Tel: +1 212 229 6618
Kelly Mahn Account Executive, New York Tel: +1 212 229 6683
Joseph Solano Regional Director, New York Tel: +1 212 229 6576
Meiken Castillo Regional Director, New York Tel: +1 212 229 6879
Dana Fennessey Regional Director, New York Tel: +1 212 229 6681
Hillary Pryor Regional Director, Mid Atlantic Tel: +1 212 367 5924
Colin Schopbach Regional Director, Southeast Tel: +1 404 796 1478
Michail Sidorov Regional Director, Northwest, Ohio & Michigan Tel: +1 216 333 1274
Scott Haugen Regional Director, Minnesota & Wisconsin Tel: +1 651 632 4375
Anthony Crosby Regional Director, Chicago Tel: +1 312 674 6511
Mark Plaehn Regional Director, Chicago Tel: +1 312 674 6527
Kelly-Leigh Keefe Regional Director, Chicago Tel: +1 312 386 2229
Ted Sengpiel Regional Director, Missouri, Kansas, Nebraska & Iowa Tel: +1 314 315 2909
Nicholas Renter Regional Director, Texas Tel: +1 214 754 2100
Angela Pedersen Account Executive, Greater Texas Region Tel: +1 651 632 4394
Andrew Buonincontro Regional Director, Bay Area Tel: +1 650 493 1400
Jay Loyola Regional Director, Bay Area Tel: +1 949 622 0663
Dan Phelan Regional Director, Los Angeles Tel: +1 213 253 2139
Aleshia Hlivka Account Executive, California Tel: +1 651 632 4967

Head of Research: Elias LatsisHead of Production: Laura Resetar
For advertising opportunities contact: Erik Wickman Tel: + (1) 212 686 3329 [email protected]
Global overview: Elizabeth Lim North America: Lana Vilner C&S America: Aleksandra Duda Europe: Sabzina Oshikova and Visham Teeluck Middle East & Africa: Katharine DennysAsia-Pacific: Susie XiaoJapan: Susie Xiao
The following notes pertain to data contained in this publication:
Deals are included where the deal value is greater than or equal to US$5m.
Where no deal value has been disclosed, deals are included if the turnover of the target is greater than or equal to US$10m.
Deals are included in the graphs and Top Deals in each section based on thedominant geography and dominant sector of the target company. Data underlying the League Tables are based on deals where the bidder, target or parent geography of either is that of the geography in focus.
Mid-market is defined as US$10m - US$250m.
For a full version of the Mergermarket M&A deal database inclusion and league table criteria, go to http://www.Mergermarket.com/pdf/deal_criteria.pdf.
Remark, the events and publications arm of The Mergermarket Group, offers a range of publishing, research and events services that enable clients to enhance their own profile, and to develop new business opportunities with their target audience.
Part of The Mergermarket Group
www.mergermarket.comUSA: 330 Hudson Street, 4th floor, New York, NY 10013, USA
t: +1 212 686-5606 f: +1 212 686-2664 [email protected]
United Kingdom: 10 Queen Street Place, London, EC4R 1BE, United Kingdom
t: +44 (0)20 7059 6100 f: +44 (0)20 7059 6101 [email protected]
Hong Kong: Suite 1602-06, Grand Millennium Plaza, 181 Queen’s Road, Central, Hong Kong
t: +852 2158 9700 f: +852 2158 9701 [email protected]
Disclaimer This publication contains general information and is not intended to be comprehensive nor to provide financial, investment, legal, tax or other professional advice or services. This publication is not a substitute for such professional advice or services, and it should not be acted on or relied upon or used as a basis for any investment or other decision or action that may affect you or your business. Before taking any such decision, you should consult a qualified professional adviser. While reasonable effort has been made to ensure the accuracy of the information contained in this publication, this cannot be guaranteed and neither Merrill DataSite nor Mergermarket nor any of its subsidiaries or any affiliate thereof or other related entity shall have any liability to any person or entity which relies on the information contained in this publication, including incidental or consequential damages arising from errors or omissions. Any such reliance is solely at the user’s risk.