Embed Size (px)
Citation preview

Page 1 of 18
Next release: 10 December 2021
Release date: 11 November 2021
Contact: Ellis Best [email protected] +44 1633 455284
Statistical bulletin
GDP monthly estimate, UK: September 2021Gross domestic product (GDP) measures the value of goods and services produced in the UK. It estimates the size of and growth in the economy.
Table of contents
1. Main points
2. Monthly gross domestic product
3. The services sector
4. The production sector
5. The construction sector
6. Cross-industry themes
7. Monthly GDP data
8. Glossary
9. Measuring the data
10. Strengths and limitations
11. Related links

Page 2 of 18
1 . Main points
Gross domestic product (GDP) is estimated to have grown by 0.6% in September 2021 but remains 0.6% below its pre-coronavirus (COVID-19) pandemic level (February 2020).
Services output grew by 0.7% in September 2021 as human health activities grew by 6.4%, mainly because of a large rise in face-to-face appointments at GP surgeries in England.
Output in consumer-facing services fell by 0.6% mainly because of a 13.3% fall in the wholesale and retail trade and repair of motor vehicles and motorcycles, while all other services rose by 1.0%.
Consumer-facing services are 5.5% below their pre-coronavirus (COVID-19) pandemic levels, while all other services are now 1.0% above.
Production output decreased by 0.4% in September 2021, mainly because of a 4.1% fall in the distribution of gas, its fourth consecutive monthly fall following exceptionally high output levels in May 2021 when adverse weather conditions boosted supply.
Construction output increased by 1.3% in September 2021 following two consecutive months of contraction, and the sector is now 1.0% below its pre-coronavirus pandemic level; growth in construction was driven by growth in repair and maintenance (1.2%) and new work (1.3%).
GDP growth for July 2021 has been revised from a 0.1% fall to a 0.2% fall, while August 2021 has been revised from 0.4% growth to 0.2% growth; these revisions were mainly because of late survey data for the services industries.

Page 3 of 18
2 . Monthly gross domestic product
Figure 1: UK GDP is estimated to have grown by 0.6% in September 2021, but remains 0.6% below its pre-coronavirus pandemic level (February 2020)
Monthly index, UK, January 2007 to September 2021
Source: Office for National Statistics – GDP monthly estimate
Monthly real gross domestic product (GDP) grew by 0.6% in September 2021, and follows a revised 0.2% growth in August 2021 (down from 0.4% growth) and a revised 0.2% fall in July 2021 (down from a 0.1% fall).

Page 4 of 18
1.
Table 1: UK GDP in September 2021 was 0.6% below its pre-coronavirus pandemic level, with all sectors remaining below their pre-coronavirus pandemic level
Change in output, percentage change, UK, February 2020 to September 2021
Change in output June to July 2021July to August 2021
August toSeptember 2021
February 2020 toSeptember 2021
GDP -0.2 0.2 0.6 -0.6
Services -0.2 0.1 0.7 -0.3
Production 0.4 1.0 -0.4 -1.4
Manufacturing -0.4 0.3 -0.1 -2.5
Construction -1.2 -0.7 1.3 -1.0
Source: Office for National Statistics – GDP monthly estimate
Notes
This table uses data from the output measure of GDP. Figures from this approach may differ from those calculated from the average measure of GDP which reflects balanced estimates from the expenditure, income, and output approaches.
Construction output grew by 1.3% in September 2021, following two consecutive months of contraction. Services output also grew in September 2021, increasing by 0.7% following broadly flat movements in July and August 2021. Production output fell by 0.4% in September 2021, after two consecutive months of growth. Overall, GDP remained 0.6% below its pre-coronavirus pandemic level (February 2020) in September 2021.

Page 5 of 18
1.
Figure 2: Services were the main contributor to GDP’s 0.6% growth in September 2021
Contributions to monthly GDP growth, UK, January to September 2021
Source: Office for National Statistics – GDP monthly estimate
Notes:
Sum of component contributions may not sum to total growth because of rounding.
Overall, gross domestic product (GDP) grew by 1.3% in the three months to September 2021, mainly reflecting the performance of the services sector in September 2021. This growth largely reflects the gradual easing of coronavirus (COVID-19) restrictions to varying degrees in , and , including the reopening England Scotland Walesof accommodation and food service activities and arts, entertainment and recreation services, as well as a rise in underlying human health activities (for example, a rise in GP appointments) compared with the previous three months (April to June 2021).
More detail on the quarterly path can also be found in .GDP first quarterly estimate, UK: July to September 2021
More about economy, business and jobs
All ONS analysis, summarised in our .economy, business and jobs roundupExplore the latest trends in employment, prices and trade in our .economic dashboardView .all economic data

Page 6 of 18
3 . The services sector
Services output grew by 0.7% in September 2021 but remains 0.3% below its pre-coronavirus (COVID-19) pandemic level. This follows growth of 0.1% in August 2021 (revised down from 0.3% growth), and negative growth of 0.2% in July 2021 (revised down from negative 0.1% growth).
Human health and social work activities grew by 4.7% in September 2021 and was the main contributor to September’s growth in services (Figure 3). Human health activities grew strongly in September 2021, by 6.4%, mainly because of a large rise in face-to-face appointments at GP surgeries in England, following falls in July and August 2021. Human health activities remain at historically high levels, with June and July 2021 the only other occasions where output has been higher than September 2021. The NHS Test and Trace and vaccine programmes had a positive 0.2 percentage point impact on September’s gross domestic product (GDP) growth (see later in the section for more information on how we measure health).
Professional, scientific, and technical activities grew by 2.1% and was the second largest contributor to September’s growth in services. Growth in this industry was widespread in September 2021, with output growing in seven of its eight sub-industries. The main drivers to growth were legal activities (growing by 3.1%) with some businesses citing a rush to complete work before further changes to the stamp duty holiday, while accounting, bookkeeping, and auditing activities also saw strong growth of 3.0%.
Administrative and support activities grew by 2.2% and was the third largest contributor to September’s growth in services. Services to building and landscape activities was the main driver to growth in this industry (growing by 8.0%), partly because of strong demand from offices and schools. There was also strong output growth in office administrative, office support and other business support activities (3.2%).

Page 7 of 18
1.
Figure 3: Human health activities was the main contributor to growth in services output in September 2021, mainly because of a large rise in face-to-face appointments at GP surgeries in England
Monthly services contributions to GDP, UK, September 2021
Source: Office for National Statistics – GDP monthly estimate
Notes:
Sum of component contributions may not sum to total services growth because of rounding.
Downward contributions to services growth included a 1.5% fall in wholesale and retail trade, driven by a 13.3% fall in the wholesale and retail trade and repair of motor vehicles and motorcycles. External indicators also suggest a weak car market in September, with the new car market recording its lowest September sales since at least 1998, according to the .Society of Motor Manufacturers and Traders (SMMT)

Page 8 of 18
There was also a downward contribution from a 2.3% fall in information and communication. There were falls in output in computer programming, consultancy and related activities (down 4.4%), in motion picture, video and TV programme production, sound recording and music publishing activities (down 11.9%) and in information service activities (down 8.6%).
Elsewhere, air transport continued to expand as coronavirus (COVID-19)-related travel restrictions eased, growing by 23.9% in September 2021, but remaining 73.3% below its pre-coronavirus pandemic level.

Page 9 of 18
1.
2.
Consumer-facing services
Output in consumer-facing services fell by 0.6% in September 2021, following revised growth of 1.3% in August (Figure 4). The main drivers were a 13.3% fall in the wholesale and retail trade and repair of motor vehicles and motorcycles, and a 0.3% fall in retail trade. These falls were partially offset by growth in food and beverage service activities (3.8%), travel agency, tour operator and other related reservation services (18.4%, but growing from historically low levels), and rail transport (9.1%). Rail transport output remains 31.5% below its pre-coronavirus pandemic level.
Consumer-facing services are 5.5% below their pre-coronavirus pandemic levels (February 2020), while all other services are now 1.0% above them.
Figure 4: Output in consumer-facing services fell by 0.6% in September 2021, and remains 5.5% below its pre-coronavirus pandemic levels
Monthly index of services, UK, February 2020 to September 2021
Source: Office for National Statistics - GDP monthly estimate
Notes:
Consumer-facing services refer to retail trade, food and beverage serving activities, travel and transport, and entertainment and recreation (Standard Industrial Classification 2007 codes 45, 47, 49.1-2, 56, 68.1-2, 75, 79, 92, 93, 94, 96 and 97).
Vertical grey lines represent (from left to right): Hospitality reopening on 1 June 2020, outdoor hospitality reopening on 12 April 2021, indoor hospitality reopening on 17 May 2021, and social distancing restrictions easing on 19 July 2021.
Overall, services grew by 1.6% in the three months to September 2021, mainly reflecting the gradual reopening of accommodation and food service activities and arts, entertainment and recreation services, as well as a rise in underlying human health activities (for example, a rise in GP appointments) compared with the previous three months (April to June 2021).
Page 10 of 18
The downward revisions to headline GDP in July and August 2021 were because of small downward revisions in the output of services. These were because of information and communication growing at a slower rate than previously estimated, with July 2021 growth revised to 1.8% growth (down from 3.0% growth) and August 2021 growth revised to 0.4% (down from 2.1%), as later data were incorporated.
More detailed breakdowns on services are available in the , while detail Index of Services, UK: September 2021on the quarterly path can also be found in .GDP first quarterly estimate, UK: July to September 2021
Taking into account NHS Test and Trace services and vaccine programmes
Coverage adjustments have been applied to the volume data to estimate the impact on GDP from the NHS Test and Trace services and COVID-19 vaccine programmes, by incorporating new cost-weighted activity indicators.
The NHS Test and Trace adjustment for September 2021 was £1,400 million, up from £1,200 million in August as the number of increased by approximately 30%. The vaccine programme’s adjustment for coronavirus testsSeptember 2021 was £200 million, down from £300 million in August as the number of coronavirus vaccinationsfell by approximately 40%. Note that published adjustments are rounded to the nearest £100 million.
Overall, the total adjustment increased by £200 million in September 2021, to £1,700 million, and had a positive 0.2 percentage point impact on GDP growth.
For further information on the methodology behind these adjustments, please refer to the Measuring the economic , and a full record of health volume adjustments and their output of COVID-19 testing, tracing and vaccinations
contribution to GDP growth can be found in the .accompanying dataset

Page 11 of 18
1.
4 . The production sector
Production output decreased by 0.4% in September 2021, with a fall across the four sectors (Figure 5). This follows two consecutive months of growth, with growth of 1.0% in August 2021 (revised up from 0.8%), and growth of 0.4% in July 2021 (revised up from 0.3% growth).
Figure 5: Production output decreased by 0.4% in September 2021, as the distribution of gas fell for the fourth consecutive month, following exceptionally high levels in May 2021
Monthly index, UK, February 2020 to September 2021
Source: Office for National Statistics – GDP monthly estimate
Notes:
Indexes are rounded to one decimal place.
Electricity, gas, steam and air conditioning supply fell by 1.6% in September 2021 and was the main contributor to production’s fall. The distribution of gas fell for a fourth consecutive month, following exceptionally high levels in May 2021 (last higher in December 2001), mainly resulting from adverse weather conditions boosting demand for energy.

Page 12 of 18
1.
The manufacturing sector fell by 0.1% in September 2021, following revised 0.3% growth in August 2021 (down from 0.5% growth), with output decreasing in 6 out of the 13 manufacturing sub-sectors. Most of the contribution to manufacturing falling was because of a 5.1% decrease in the manufacture of transport equipment.
Output in the manufacture of motor vehicles fell by 8.2% in September 2021 (Figure 6), the largest fall since May 2021, following a revised 5.9% growth in August 2021 (down from 6.6%). There was also a fall in the sales and repair of motor vehicles (13.3%), the largest fall since January 2021, following a revised 0.1% fall in August 2021 (up from a 1.9% fall).
Figure 6: The manufacture and sales of motor vehicles both saw large falls in September 2021
Monthly index, UK, February 2020 to September 2021
Source: Office for National Statistics – GDP monthly estimate
Notes:
Indexes are rounded to one decimal place.
Mining and quarrying fell by 0.8% in September 2021. The extraction of crude petroleum and natural gas also fell slightly, by 0.9%, in September 2021, following strong growth in recent months because of the reopening of oil field production sites previously temporarily closed for planned maintenance. The extraction of crude petroleum and natural gas remains low by historical standards, with output 17.6% below its September 2019 level. Water supply also fell in September 2021, by 0.4%.
Overall, production grew by 0.8% in the three months to September 2021, mainly because of a 26.3% growth in mining and quarrying and a 1.5% increase in water supply. These increases were partially offset by a fall of 0.3% in manufacturing and a fall of 4.0% in electricity, gas, steam and air conditioning supply.

Page 13 of 18
Revisions
July 2021 growth was revised up to 0.4% (from 0.3%) because of upward revisions to manufacturing and mining and quarrying. These revisions were mainly because of new data.
August 2021 growth was revised up to 1.0% (from 0.8%) because of upward revisions to the electric power generation, transmission and distribution, extraction of crude petroleum and natural gas, and the manufacture of basic pharmaceuticals and pharmaceutical preparations. These revisions were also mainly because of new data.
More detailed breakdowns on production are available in the , while Index of Production, UK: September 2021detail on the quarterly path can also be found in . GDP first quarterly estimate, UK: July to September 2021

Page 14 of 18
1.
2.
5 . The construction sector
Construction output increased by 1.3% in September 2021 following two consecutive months of contraction. Output in August fell by 0.7% (revised down from a 0.2% fall) and July output fell by 1.2% (revised down from a 1.0% fall). These downward revisions were mainly because of late survey data.
The growth in monthly construction output in September 2021 was driven by an increase in repair and maintenance (1.2%) and new work (1.3%). At the sector level, the main drivers were non-housing repair and maintenance (increasing by 2.6%) and public other new work (increasing by 7.2%). These increases were partially offset by falls in public housing new work (falling by 6.5%) and public housing repair and maintenance (falling by 2.7%).
Construction output recently peaked to be 0.9% above its pre-coronavirus (COVID-19) pandemic level in April 2021 but in September 2021 is now 1.0% below its pre-coronavirus pandemic level (Figure 6). This reflects recent challenges faced by the construction industry from rising input prices and in delays to the availability of some construction products (notably steel, concrete, timber and glass).
Figure 7: Construction output increased by 1.3% in September 2021 and is 1.0% below its pre-coronavirus pandemic level (February 2020)
Monthly index, UK, February 2020 to September 2021
Source: Office for National Statistics – GDP monthly estimate and Construction output in Great Britain
Notes:
Indexes are rounded to one decimal place.
Construction indexes in this release are aligned to those published in Construction output in Great Britain: , but may September 2021, new orders and Construction Output Price Indices, July to September 2021
differ slightly because of rounding.

Page 15 of 18
In contrast to the monthly growth, construction output fell by 1.5% in the three months to September 2021. This was because of a 3.6% fall in repair and maintenance (mainly because of a 5.9% fall in non-housing repair and maintenance) and a fall of 0.3% in new work (with housing (both public and private), public other new work, and private commercial new work all falling).
Further detail on the contributions to construction growth can be found in Construction output in Great Britain: , while detail on the September 2021, new orders and Construction Output Price Indices, July to September 2021
quarterly path can also be found in .GDP first quarterly estimate, UK: July to September 2021
6 . Cross-industry themes
There were some common themes that were anecdotally reported to have played a part in performance across different industries, however, it is often difficult to quantify these effects.
Supply chain of motor-vehicles
In September 2021, car retailers reported supply challenges as a result of the ongoing semi-conductor shortage, coupled with a decrease to the usual level of demand for new cars (see Figure 6). The limited supply of new cars is likely have had an impact on used car sales, reflected in the continued increase in prices of used cars (see our
).consumer price inflation time series
More broadly, the supply chain issue initially caused by the semi-conductor shortage is now impacting other industries for example renting and leasing activities, which has seen a decrease in new car leases and lease renewals that would be typical of this time of year as a result of limited availability and price increases.
Overall, the trade and repair of motor vehicles is down 13.7% compared with pre-coronavirus pandemic level (February 2020).
CO2 challenges
In late September, there were external reports of challenges in the domestic production of carbon dioxide (CO2), with concern on what impact this may have across other industries that depend on it (for example, farming, the production of soft drinks, and food packaging). To determine whether any falls in output were from the widely reported CO2 shortage, we looked for evidence in industries that greatly depend on CO2 in their production chain and comments from the monthly business survey. Overall, our latest estimates do not suggest any obvious impact attributed to CO2 challenges in September 2021.
The manufacture of industrial gases, inorganics and fertilisers (that is, the sub-industry with main CO2 suppliers) fell by 1.3% in September 2021, though, this was its third consecutive monthly fall after exceptionally high levels of output in June 2021. Other industries dependent greatly on CO2 in their production chain did not show obvious signs of the impact of the CO2 challenges either. The manufacture of soft drinks, for example, increased in September by 2.4%, while the processing and preserving of meat and production of meat products was broadly flat. Furthermore, there were no comments in the monthly business survey citing CO2 challenges in September 2021.
Fuel sales
Automotive fuel sales volumes rose by 2.9% in September 2021 as demand towards the end of September increased sales. This is expected to be a short-term displacement of activity, with the bringing forward of consumer activity. September 2021 saw fuel sales volume surpass their pre-coronavirus pandemic levels (they are now 1.8% above their February 2020 levels). More information on retail sales can be found in Retail sales,
.Great Britain: September 2021
Page 16 of 18
7 . Monthly GDP data
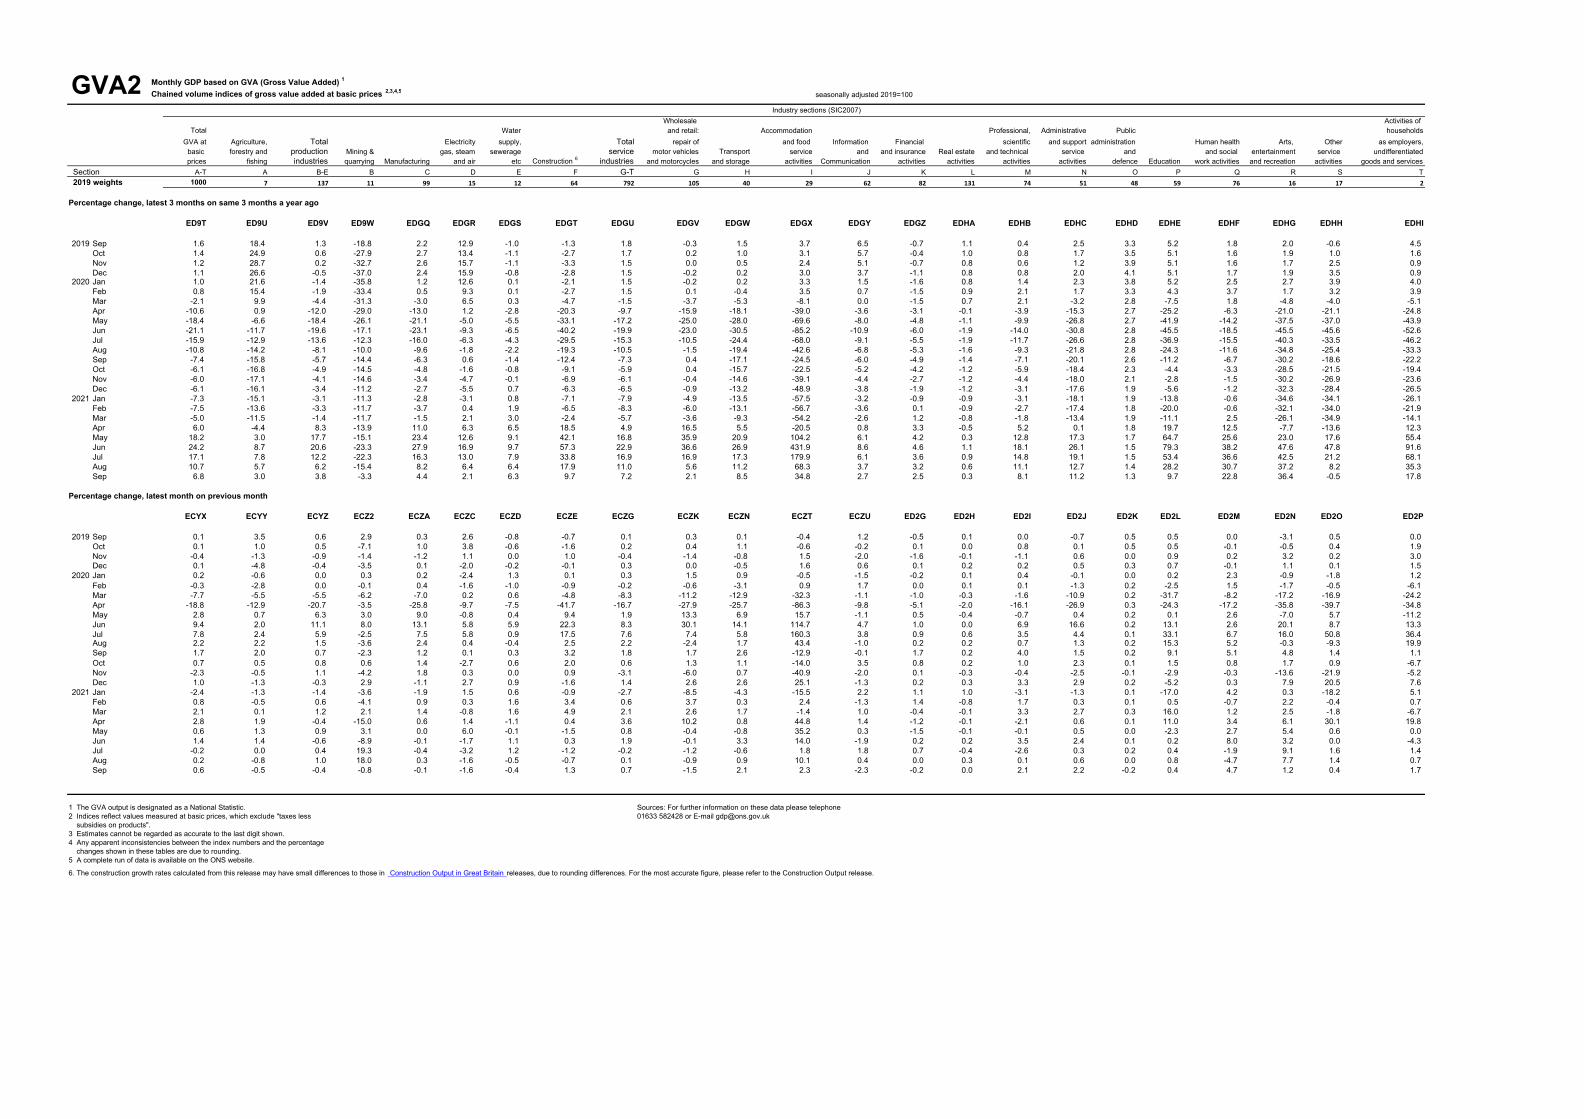
Monthly gross domestic product by gross value addedDataset | Released 11 November 2021The gross value added (GVA) tables showing the monthly and annual growths and indices as published within the monthly gross domestic product (GDP) statistical bulletin.
Contributions to monthly GDPDataset | Released 11 November 2021Contributions to growth within monthly gross domestic product (GDP), UK.
Monthly gross domestic product: time seriesDataset | Dataset ID: MGDP | Released 11 November 2021Monthly estimate of gross domestic product (GDP) containing constant price gross value added (GVA) data for the UK.
Monthly GDP and main sectors to four decimal placesDataset | Released 11 November 2021Monthly index values for monthly gross domestic product (GDP) and the main sectors in the UK to four decimal places.
Revisions triangles for monthly GDPDataset | Released 11 November 2021Comparison of gross domestic product (GDP) first estimates against estimates published later.
8 . Glossary
Contribution to growth
Contribution to growth indicates how many percentage points a sector or industry is adding or removing from a given growth rate, usually headline gross domestic product (GDP) growth.
Gross domestic product
A measure of the economic activity produced by a country or region. Gross domestic product (GDP) growth is the main indicator of economic performance. There are three approaches used to measure GDP:
the output approach
the expenditure approach
the income approach
Index numbers
Data relative to a given base value, which typically refers to a year.

Page 17 of 18
Rolling three-month growth
Rolling three-month growth takes the average level of three consecutive months (for example, April, May and June), and compares it with the average level of the previous three months (for example, January, February and March). The rolling three-month growth rate is often used alongside the monthly growth rate, as the latter can be more volatile.
For further definitions, please see the .Glossary of economic terms
9 . Measuring the data
This release captures the direct effects of the coronavirus (COVID-19) pandemic and the government measures taken to reduce transmission of the virus.
Early in the pandemic, we faced some challenges in receiving timely responses to the Monthly Business Survey (MBS) as businesses adapted to new conditions. In recent months, response rates have improved and further information on measuring the data across our main data sources is available in the following releases:
Construction output in Great Britain: September 2021, new orders and Construction Output Price Indices, July to September 2021
Index of Services, UK: September 2021
Index of Production, UK: September 2021
The was published on 29 October 2021 introducing various UK National Accounts, The Blue Book: 2021improvements to how we produce volume estimates of gross domestic product (GDP), and these changes were taken on for the first time in last month’s GDP monthly release, published on 13 October 2021.
Note that estimates for the construction industry from this new approach (double deflation) will differ to those published in the Construction output release as they account for both the outputs produced and inputs consumed by the industry. There are also some coverage differences given the use of the Annual Business Survey in their compilation.
Consultation on the Code of Practice for Statistics
On behalf of the UK Statistics Authority, the Office for Statistics Regulation (OSR) is conducting a consultation on . Please send comments by the Code of Practice for Statistics, proposing changes to the 9:30am release practice
21 December 2021 to: [email protected]
Update to the System of National Accounts
As part of an update to the System of National Accounts, the United Nations (UN) is in the process of consulting on several areas being considered for improvement. Previous and live consultations can be found on the UN
. If you would like to discuss any of these consultations with Office for National Statistics Statistics Division website(ONS), please contact us at . Bodies outside the UK National Statistical System [email protected] also free to respond to the consultations themselves.
Page 18 of 18
10 . Strengths and limitations
This release gives data for September 2021 for the first time, alongside revisions to July and August 2021.
Quality and methodology information on strengths, limitations, appropriate uses, and how the data were created is available in the .Gross domestic product (GDP) QMI
The monthly growth rate for GDP is volatile. It should therefore be used with caution and alongside other measures, such as the three-month growth rate, when looking for an indicator of the medium-term trend of the economy. However, it is useful in highlighting one-off changes that can be masked by three-month growth rates.
The latest comparisons of month on same month a year ago should be treated with caution given the impact of on growth rates because of the economic impact of the coronavirus (COVID-19) pandemic base effects
throughout 2020. Such comparisons and growth rates can nonetheless be found in our .accompanying dataset
Communicating gross domestic product
Recent analysis explains our latest position on , including how we will how we are looking to communicate GDPcontinue to acknowledge that “technical” recessions comprised at least two consecutive quarters of contracting GDP.
While it is still true that these early estimates are prone to revision, we prefer to focus on the magnitude of the contraction that has taken place following the coronavirus pandemic. It is clear that the contraction in GDP in Quarter 2 (Apr to June) 2020 was the largest recession on record. Our latest estimates show that the UK economy is now 0.6% smaller than it was in February 2020, the effects of which have been most pronounced in those industries that are most exposed to public health restrictions and the effects of social distancing.
11 . Related links
Construction output in Great Britain: September 2021, new orders and Construction Output Price Indices, July to September 2021Bulletin | Released 11 November 2021Short-term measures of output by the construction industry in Great Britain and contracts awarded for new construction work in Great Britain.
Index of Production, UK: September 2021Bulletin | Released 11 November 2021Movements in the volume of production for the UK production industries: manufacturing, mining and quarrying, energy supply, and water and waste management.
Index of Services, UK: September 2021Bulletin | Released 11 November 2021Monthly movements in output for the services industries.
GDP first quarterly estimate, UK: July to September 2021Bulletin | Released 11 November 2021First quarterly estimate of gross domestic product (GDP). Contains current and constant price data on the value of goods and services to indicate the economic performance of the UK.
Coronavirus and the effects on GDPArticle | Released 6 May 2020How the global coronavirus (COVID-19) pandemic and the wider containment efforts are expected to impact on UK gross domestic product (GDP) as well as some of the challenges that national statistical institutes are likely to face.

Monthly GDP based on GVA (Gross Value Added) 1
Chained volume indices of gross value added at basic prices 2,3,4,5 seasonally adjusted 2019=100
Wholesale Activities of Total Water and retail: Accommodation Professional, Administrative Public households
GVA at Agriculture, Total Electricity supply, Total repair of and food Information Financial scientific and support administration Human health Arts, Other as employers,basic forestry and production Mining & gas, steam sewerage service motor vehicles Transport service and and insurance Real estate and technical service and and social entertainment service undifferentiatedprices fishing industries quarrying Manufacturing and air etc Construction 6 industries and motorcycles and storage activities Communication activities activities activities activities defence Education work activities and recreation activities goods and services
Section A-T A B-E B C D E F G-T G H I J K L M N O P Q R S T 2019 weights 1000 7 137 11 99 15 12 64 792 105 40 29 62 82 131 74 51 48 59 76 16 17 2
YBFR L2KL L2KQ L2KR L2KX L2MW L2N2 L2N8 L2NC L2NE L2NI L2NQ L2NT L2O6 L2OC L2OI L2OX L2P8 L2PA L2PC L2PJ L2PP L2PT
2016 94.6 91.0 93.2 103.1 92.1 91.6 99.2 98.4 94.6 99.5 93.4 93.4 78.6 98.9 97.4 98.2 95.1 92.6 90.4 97.7 92.4 91.9 87.92017 96.7 97.0 93.3 94.0 93.3 86.9 100.0 102.2 96.9 101.6 95.0 97.8 82.1 102.2 97.2 99.8 99.6 95.6 90.5 100.6 98.1 97.3 86.62018 98.2 86.0 96.6 98.7 97.0 88.6 100.5 100.2 98.5 100.2 98.2 96.7 93.0 101.6 98.8 100.4 98.8 96.6 95.1 99.2 98.5 100.7 94.02019 100.0 100.0 100.0 100.0 100.0 100.0 100.0 100.0 100.0 100.0 100.0 100.0 100.0 100.0 100.0 100.0 100.0 100.0 100.0 100.0 100.0 100.0 100.02020 90.8 91.0 91.8 80.5 91.2 97.9 98.2 83.9 91.2 93.2 83.5 58.3 94.8 96.4 99.1 94.5 82.1 102.5 82.6 93.9 71.8 75.8 73.3
ECY2 ECY3 ECY4 ECY5 ECY6 ECY7 ECY8 ECY9 ECYC ECYD ECYG ECYH ECYI ECYJ ECYK ECYL ECYP ECYQ ECYR ECYS ECYT ECYU ECYV
2019 Sep 100.3 109.8 99.6 96.0 99.7 101.0 99.8 98.3 100.5 100.2 100.1 99.7 101.2 100.6 100.2 101.1 99.9 100.7 100.7 100.5 98.9 101.7 98.3 Oct 100.4 110.9 100.1 89.2 100.7 104.8 99.2 96.8 100.7 100.6 101.1 99.1 101.0 100.7 100.2 101.9 99.9 101.1 101.1 100.4 98.4 102.1 100.2 Nov 100.0 109.5 99.3 87.9 99.5 106.0 99.2 97.8 100.2 99.2 100.4 100.6 99.0 99.1 100.1 100.7 100.5 101.1 102.1 100.6 101.6 102.3 103.2 Dec 100.1 104.3 98.9 84.8 99.5 103.9 99.1 97.6 100.5 99.2 99.8 102.2 99.6 99.2 100.3 101.0 101.0 101.4 102.8 100.5 102.7 102.4 104.7
2020 Jan 100.4 103.6 98.8 85.1 99.7 101.4 100.3 97.7 100.8 100.7 100.7 101.7 98.1 99.0 100.4 101.4 100.9 101.5 103.1 102.8 101.7 100.5 106.0 Feb 100.1 100.8 98.8 84.9 100.1 99.7 99.3 96.9 100.6 100.0 97.6 102.7 99.7 98.9 100.5 101.5 99.6 101.6 100.5 104.4 100.1 100.0 99.5 Mar 92.4 95.2 93.4 79.7 93.1 99.9 99.8 92.3 92.2 88.9 85.0 69.5 98.5 97.9 100.3 99.9 88.7 101.8 68.6 95.8 82.9 83.1 75.4 Apr 75.0 83.0 74.1 76.9 69.1 90.3 92.3 53.8 76.8 64.1 63.2 9.5 88.9 92.9 98.3 83.8 64.9 102.2 52.0 79.3 53.2 50.2 49.2 May 77.1 83.6 78.7 79.2 75.4 89.5 92.7 58.9 78.2 72.6 67.5 11.0 87.9 93.4 97.9 83.2 65.2 102.4 52.0 81.3 49.5 53.0 43.7 Jun 84.3 85.2 87.5 85.6 85.3 94.7 98.2 72.0 84.8 94.5 77.0 23.7 92.0 94.3 97.9 88.9 76.0 102.6 58.9 83.4 59.5 57.7 49.5 Jul 90.9 87.3 92.6 83.4 91.7 100.3 99.1 84.6 91.2 101.5 81.5 61.6 95.5 95.1 98.5 92.0 79.3 102.7 78.3 89.1 69.0 87.0 67.5 Aug 92.9 89.2 94.0 80.4 93.9 100.6 98.7 86.7 93.2 99.1 82.9 88.4 94.5 95.3 98.7 92.6 80.3 102.9 90.3 93.7 68.8 78.9 80.9 Sep 94.5 91.0 94.7 78.5 95.0 100.7 99.0 89.5 94.9 100.7 85.0 77.0 94.4 96.9 98.9 96.3 81.5 103.1 98.5 98.5 72.1 80.0 81.8 Oct 95.2 91.5 95.5 79.0 96.4 98.0 99.5 91.2 95.5 102.0 86.0 66.2 97.7 97.6 99.1 97.3 83.4 103.2 99.9 99.4 73.3 80.6 76.3 Nov 93.0 91.0 96.5 75.7 98.1 98.3 99.5 92.0 92.5 95.9 86.6 39.1 95.8 97.7 98.9 96.9 81.3 103.1 97.0 99.1 63.3 63.0 72.4 Dec 93.9 89.8 96.3 77.9 97.0 101.0 100.4 90.6 93.8 98.4 88.8 49.0 94.6 97.9 99.2 100.0 83.7 103.3 92.0 99.4 68.3 75.9 77.9
2021 Jan 91.7 88.7 94.9 75.1 95.2 102.5 101.1 89.8 91.3 90.0 85.0 41.3 96.7 99.0 100.1 96.9 82.6 103.4 76.3 103.6 68.5 62.1 81.8 Feb 92.4 88.3 95.5 72.0 96.1 102.8 102.7 92.8 91.8 93.4 85.2 42.3 95.4 100.4 99.4 98.5 82.8 103.5 76.7 102.8 70.0 61.8 82.4 Mar 94.3 88.3 96.6 73.5 97.4 102.0 104.4 97.4 93.7 95.8 86.7 41.8 96.4 100.0 99.3 101.8 85.1 103.8 89.0 104.1 71.8 60.7 76.9 Apr 97.0 90.0 96.2 62.4 97.9 103.4 103.3 97.7 97.1 105.6 87.4 60.5 97.7 98.8 99.1 99.7 85.6 103.9 98.8 107.6 76.2 78.9 92.2 May 97.6 91.1 97.1 64.4 98.0 109.6 103.1 96.3 97.9 105.2 86.7 81.7 98.0 97.3 99.0 99.6 86.0 103.9 96.5 110.4 80.3 79.4 92.2 Jun 99.0 92.4 96.5 58.6 97.9 107.7 104.3 96.6 99.7 105.0 89.5 93.1 96.1 97.5 99.2 103.1 88.1 104.1 96.7 119.3 82.9 79.4 88.2 Jul 98.8 92.4 96.8 69.9 97.5 104.3 105.6 95.4 99.5 103.7 89.0 94.8 97.9 98.2 98.8 100.4 88.4 104.3 97.0 117.0 90.4 80.7 89.5 Aug 99.0 91.7 97.8 82.5 97.8 102.6 105.1 94.7 99.6 102.8 89.8 104.4 98.3 98.2 99.1 100.5 88.9 104.3 97.8 111.6 97.3 81.8 90.1 Sep 99.5 91.3 97.4 81.8 97.7 101.0 104.7 95.9 100.3 101.3 91.7 106.8 96.0 98.0 99.1 102.6 90.9 104.1 98.2 116.8 98.5 82.1 91.6
Percentage change, latest year on previous yearGDPQ L3BB L3BG L3BH L3BN L3DM L3DQ L3DW L3E2 L3E4 L3E8 L3EG L3EJ L3EU L3F2 L3F8 L3FN L3FW L3FY L3G2 L3G9 L3GF L3GJ
2016 2.4 -11.9 0.2 10.1 -0.7 -1.1 3.1 -1.7 3.2 1.7 1.9 5.8 10.9 7.6 2.2 1.6 1.6 3.1 -0.2 2.2 -2.8 3.4 21.12017 2.2 5.9 0.1 -8.8 1.4 -5.2 0.9 3.8 2.4 2.2 1.7 4.7 4.6 3.4 -0.2 1.6 4.8 3.3 0.0 3.0 6.2 5.8 -1.5 2018 1.6 -10.9 3.5 5.0 3.9 2.0 0.5 -2.0 1.6 -1.4 3.4 -1.1 13.2 -0.5 1.7 0.6 -0.8 1.1 5.1 -1.4 0.5 3.5 8.62019 1.8 15.9 3.6 1.3 3.1 12.9 -0.5 -0.1 1.6 -0.2 1.9 3.4 7.5 -1.6 1.2 -0.4 1.2 3.5 5.2 0.8 1.5 -0.6 6.42020 -9.2 -9.1 -8.3 -19.5 -8.8 -2.1 -1.8 -16.1 -8.8 -6.8 -16.5 -41.7 -5.2 -3.6 -0.9 -5.5 -17.9 2.5 -17.4 -6.1 -28.2 -24.2 -26.7
Percentage change, latest 3 months on previous 3 months
ED3H ED3I ED3J ED3K ED3L ED3M ED3N ED3O ED3P ED3Q ED3R ED3S ED3T ED3U ED3V ED3W ED3X ED3Y ED3Z ED42 ED43 ED44 ED9R
2019 Sep 0.3 11.5 -0.1 -2.9 0.2 -0.9 -0.7 -3.6 0.7 -0.1 0.7 0.4 0.3 1.2 0.1 1.7 1.3 0.7 0.7 0.7 0.9 2.1 -1.4 Oct 0.2 11.2 -0.3 -1.7 -0.2 0.2 -1.1 -3.8 0.5 0.2 0.8 -0.8 -0.2 1.1 0.1 1.6 0.1 0.9 0.7 0.4 0.3 2.6 -0.6 Nov 0.1 8.2 0.2 -1.5 0.1 3.5 -1.4 -2.9 0.2 0.1 0.7 -1.1 -0.5 -0.1 0.1 0.7 -0.3 1.0 1.2 0.2 -1.2 2.1 1.8 Dec 0.0 2.2 -0.1 -7.5 0.1 4.9 -1.2 -1.9 0.1 -0.4 0.2 0.5 -0.9 -1.0 0.1 0.3 -0.1 0.9 1.7 0.0 0.7 1.6 4.1
2020 Jan -0.1 -2.9 -0.6 -7.4 -0.3 2.3 -0.4 -0.3 0.0 -0.6 -0.1 1.9 -1.9 -1.7 0.1 -0.3 0.7 0.6 2.0 0.8 2.2 0.1 5.8 Feb 0.0 -6.5 -0.9 -6.7 -0.1 -2.2 0.1 -0.2 0.2 0.0 -1.1 2.4 -1.3 -1.1 0.3 0.0 0.4 0.5 0.8 2.0 1.9 -1.0 2.8 Mar -2.5 -7.7 -2.4 -4.6 -2.2 -4.4 0.6 -1.8 -2.6 -3.1 -6.0 -9.3 -1.1 -1.0 0.2 -0.3 -4.0 0.4 -11.1 0.5 -5.9 -7.5 -8.8 Apr -11.0 -12.1 -10.3 -6.3 -12.2 -6.9 -2.4 -17.1 -10.6 -15.4 -18.3 -40.3 -3.2 -2.5 -0.6 -5.9 -16.3 0.5 -28.2 -8.0 -22.8 -23.6 -28.6 May -18.7 -15.2 -16.9 -7.4 -20.6 -8.3 -4.6 -29.9 -18.1 -24.8 -27.7 -70.6 -7.4 -4.3 -1.6 -12.2 -27.5 0.6 -43.7 -16.6 -39.1 -38.5 -45.8 Jun -19.3 -16.0 -17.4 -3.2 -21.6 -8.8 -5.4 -35.6 -18.3 -20.2 -26.7 -83.8 -9.3 -5.1 -2.4 -15.4 -28.8 0.7 -40.2 -19.5 -43.0 -43.3 -49.3 Jul -5.7 -8.2 -2.8 2.8 -3.8 -1.9 -0.5 -11.3 -5.7 6.2 -8.0 -47.0 -4.1 -2.4 -1.6 -7.4 -13.0 0.7 -14.4 -9.2 -24.6 -15.3 -28.3 Aug 9.7 0.0 11.3 5.7 14.0 5.7 3.9 18.7 8.9 30.8 11.9 92.9 2.4 0.2 -0.5 2.5 7.7 0.6 31.8 3.8 6.3 20.0 17.6 Sep 17.7 6.3 17.1 0.3 22.1 9.9 4.7 41.2 16.5 30.4 20.1 413.1 5.9 2.4 0.7 9.8 17.1 0.5 64.0 15.3 29.4 52.8 61.8 Oct 12.0 6.1 9.8 -4.1 13.1 5.2 2.5 24.1 11.6 12.4 12.3 140.4 4.1 2.4 0.8 8.3 11.3 0.5 52.6 14.9 20.3 21.2 48.9 Nov 5.5 4.5 4.6 -6.5 6.9 0.5 0.7 12.1 5.1 1.2 6.7 4.9 2.1 2.6 0.6 6.1 4.5 0.4 29.9 11.5 5.8 0.0 16.5 Dec 1.4 1.8 2.5 -4.0 3.9 -1.4 0.9 5.0 0.9 -1.7 4.8 -32.0 1.3 2.1 0.3 4.7 3.0 0.3 8.2 5.9 -2.3 -10.7 -1.6
2021 Jan -1.4 -0.8 1.2 -3.9 1.8 0.8 1.3 1.8 -2.1 -5.8 2.6 -44.1 0.2 1.7 0.5 2.7 1.0 0.2 -8.1 3.6 -6.5 -16.0 -2.9 Feb -1.7 -2.5 0.0 -3.5 -0.4 3.1 2.1 0.1 -2.1 -5.6 0.6 -27.2 -0.4 1.7 0.6 1.7 1.2 0.3 -17.1 3.0 -0.8 -10.6 5.0 Mar -1.4 -2.6 -0.4 -5.2 -1.0 3.4 2.9 2.2 -1.8 -5.7 -1.7 -18.7 0.1 2.1 0.5 1.0 0.9 0.4 -16.2 4.2 2.6 -15.9 6.5 Apr 1.8 -1.1 0.2 -9.1 0.4 2.2 3.1 5.7 1.8 3.7 -0.4 11.7 0.8 1.5 -0.1 2.1 2.4 0.5 -0.3 4.1 8.9 0.2 8.4 May 4.0 1.0 1.1 -11.0 1.7 2.9 2.2 6.7 4.3 8.8 0.6 38.7 1.9 -0.4 -0.4 1.9 3.0 0.5 16.0 5.3 10.3 9.6 7.9 Jun 5.5 3.1 1.0 -15.9 1.8 4.4 0.8 3.8 6.5 13.1 2.6 87.6 1.2 -1.9 -0.5 1.7 3.7 0.4 20.6 8.6 13.8 28.8 13.0 Jul 4.2 3.5 0.7 -7.2 0.7 4.3 0.8 0.1 5.1 6.5 2.2 86.6 0.9 -2.1 -0.3 1.1 3.5 0.3 9.7 10.3 16.3 18.9 7.3 Aug 2.7 2.6 0.4 5.4 0.0 -0.2 1.3 -1.6 3.5 1.6 2.9 58.9 0.1 -0.8 -0.1 1.0 3.4 0.3 2.5 8.0 18.6 10.4 2.5 Sep 1.3 0.7 0.8 26.3 -0.3 -4.0 1.5 -1.5 1.6 -2.5 2.6 30.0 0.1 0.3 -0.1 0.4 3.3 0.2 0.4 2.4 19.6 2.8 -0.6
1 The GVA output is designated as a National Statistic. Sources: For further information on these data please telephone2 Indices reflect values measured at basic prices, which exclude "taxes less 01633 582428 or E-mail [email protected] subsidies on products".3 Estimates cannot be regarded as accurate to the last digit shown.4 Any apparent inconsistencies between the index numbers and the percentage changes shown in these tables are due to rounding.5 A complete run of data is available on the ONS website.
GVA1Industry sections (SIC2007)
6. The construction growth rates calculated from this release may have small differences to those in Construction Output in Great Britain releases, due to rounding differences. For the most accurate figure, please refer to the Construction Output release.
Monthly GDP based on GVA (Gross Value Added) 1
Chained volume indices of gross value added at basic prices 2,3,4,5 seasonally adjusted 2019=100
Wholesale Activities of Total Water and retail: Accommodation Professional, Administrative Public households
GVA at Agriculture, Total Electricity supply, Total repair of and food Information Financial scientific and support administration Human health Arts, Other as employers,basic forestry and production Mining & gas, steam sewerage service motor vehicles Transport service and and insurance Real estate and technical service and and social entertainment service undifferentiatedprices fishing industries quarrying Manufacturing and air etc Construction 6 industries and motorcycles and storage activities Communication activities activities activities activities defence Education work activities and recreation activities goods and services
Section A-T A B-E B C D E F G-T G H I J K L M N O P Q R S T 2019 weights 1000 7 137 11 99 15 12 64 792 105 40 29 62 82 131 74 51 48 59 76 16 17 2
Percentage change, latest 3 months on same 3 months a year ago
ED9T ED9U ED9V ED9W EDGQ EDGR EDGS EDGT EDGU EDGV EDGW EDGX EDGY EDGZ EDHA EDHB EDHC EDHD EDHE EDHF EDHG EDHH EDHI
2019 Sep 1.6 18.4 1.3 -18.8 2.2 12.9 -1.0 -1.3 1.8 -0.3 1.5 3.7 6.5 -0.7 1.1 0.4 2.5 3.3 5.2 1.8 2.0 -0.6 4.5 Oct 1.4 24.9 0.6 -27.9 2.7 13.4 -1.1 -2.7 1.7 0.2 1.0 3.1 5.7 -0.4 1.0 0.8 1.7 3.5 5.1 1.6 1.9 1.0 1.6 Nov 1.2 28.7 0.2 -32.7 2.6 15.7 -1.1 -3.3 1.5 0.0 0.5 2.4 5.1 -0.7 0.8 0.6 1.2 3.9 5.1 1.6 1.7 2.5 0.9 Dec 1.1 26.6 -0.5 -37.0 2.4 15.9 -0.8 -2.8 1.5 -0.2 0.2 3.0 3.7 -1.1 0.8 0.8 2.0 4.1 5.1 1.7 1.9 3.5 0.9
2020 Jan 1.0 21.6 -1.4 -35.8 1.2 12.6 0.1 -2.1 1.5 -0.2 0.2 3.3 1.5 -1.6 0.8 1.4 2.3 3.8 5.2 2.5 2.7 3.9 4.0 Feb 0.8 15.4 -1.9 -33.4 0.5 9.3 0.1 -2.7 1.5 0.1 -0.4 3.5 0.7 -1.5 0.9 2.1 1.7 3.3 4.3 3.7 1.7 3.2 3.9 Mar -2.1 9.9 -4.4 -31.3 -3.0 6.5 0.3 -4.7 -1.5 -3.7 -5.3 -8.1 0.0 -1.5 0.7 2.1 -3.2 2.8 -7.5 1.8 -4.8 -4.0 -5.1 Apr -10.6 0.9 -12.0 -29.0 -13.0 1.2 -2.8 -20.3 -9.7 -15.9 -18.1 -39.0 -3.6 -3.1 -0.1 -3.9 -15.3 2.7 -25.2 -6.3 -21.0 -21.1 -24.8 May -18.4 -6.6 -18.4 -26.1 -21.1 -5.0 -5.5 -33.1 -17.2 -25.0 -28.0 -69.6 -8.0 -4.8 -1.1 -9.9 -26.8 2.7 -41.9 -14.2 -37.5 -37.0 -43.9 Jun -21.1 -11.7 -19.6 -17.1 -23.1 -9.3 -6.5 -40.2 -19.9 -23.0 -30.5 -85.2 -10.9 -6.0 -1.9 -14.0 -30.8 2.8 -45.5 -18.5 -45.5 -45.6 -52.6 Jul -15.9 -12.9 -13.6 -12.3 -16.0 -6.3 -4.3 -29.5 -15.3 -10.5 -24.4 -68.0 -9.1 -5.5 -1.9 -11.7 -26.6 2.8 -36.9 -15.5 -40.3 -33.5 -46.2 Aug -10.8 -14.2 -8.1 -10.0 -9.6 -1.8 -2.2 -19.3 -10.5 -1.5 -19.4 -42.6 -6.8 -5.3 -1.6 -9.3 -21.8 2.8 -24.3 -11.6 -34.8 -25.4 -33.3 Sep -7.4 -15.8 -5.7 -14.4 -6.3 0.6 -1.4 -12.4 -7.3 0.4 -17.1 -24.5 -6.0 -4.9 -1.4 -7.1 -20.1 2.6 -11.2 -6.7 -30.2 -18.6 -22.2 Oct -6.1 -16.8 -4.9 -14.5 -4.8 -1.6 -0.8 -9.1 -5.9 0.4 -15.7 -22.5 -5.2 -4.2 -1.2 -5.9 -18.4 2.3 -4.4 -3.3 -28.5 -21.5 -19.4 Nov -6.0 -17.1 -4.1 -14.6 -3.4 -4.7 -0.1 -6.9 -6.1 -0.4 -14.6 -39.1 -4.4 -2.7 -1.2 -4.4 -18.0 2.1 -2.8 -1.5 -30.2 -26.9 -23.6 Dec -6.1 -16.1 -3.4 -11.2 -2.7 -5.5 0.7 -6.3 -6.5 -0.9 -13.2 -48.9 -3.8 -1.9 -1.2 -3.1 -17.6 1.9 -5.6 -1.2 -32.3 -28.4 -26.5
2021 Jan -7.3 -15.1 -3.1 -11.3 -2.8 -3.1 0.8 -7.1 -7.9 -4.9 -13.5 -57.5 -3.2 -0.9 -0.9 -3.1 -18.1 1.9 -13.8 -0.6 -34.6 -34.1 -26.1 Feb -7.5 -13.6 -3.3 -11.7 -3.7 0.4 1.9 -6.5 -8.3 -6.0 -13.1 -56.7 -3.6 0.1 -0.9 -2.7 -17.4 1.8 -20.0 -0.6 -32.1 -34.0 -21.9 Mar -5.0 -11.5 -1.4 -11.7 -1.5 2.1 3.0 -2.4 -5.7 -3.6 -9.3 -54.2 -2.6 1.2 -0.8 -1.8 -13.4 1.9 -11.1 2.5 -26.1 -34.9 -14.1 Apr 6.0 -4.4 8.3 -13.9 11.0 6.3 6.5 18.5 4.9 16.5 5.5 -20.5 0.8 3.3 -0.5 5.2 0.1 1.8 19.7 12.5 -7.7 -13.6 12.3 May 18.2 3.0 17.7 -15.1 23.4 12.6 9.1 42.1 16.8 35.9 20.9 104.2 6.1 4.2 0.3 12.8 17.3 1.7 64.7 25.6 23.0 17.6 55.4 Jun 24.2 8.7 20.6 -23.3 27.9 16.9 9.7 57.3 22.9 36.6 26.9 431.9 8.6 4.6 1.1 18.1 26.1 1.5 79.3 38.2 47.6 47.8 91.6 Jul 17.1 7.8 12.2 -22.3 16.3 13.0 7.9 33.8 16.9 16.9 17.3 179.9 6.1 3.6 0.9 14.8 19.1 1.5 53.4 36.6 42.5 21.2 68.1 Aug 10.7 5.7 6.2 -15.4 8.2 6.4 6.4 17.9 11.0 5.6 11.2 68.3 3.7 3.2 0.6 11.1 12.7 1.4 28.2 30.7 37.2 8.2 35.3 Sep 6.8 3.0 3.8 -3.3 4.4 2.1 6.3 9.7 7.2 2.1 8.5 34.8 2.7 2.5 0.3 8.1 11.2 1.3 9.7 22.8 36.4 -0.5 17.8
Percentage change, latest month on previous month
ECYX ECYY ECYZ ECZ2 ECZA ECZC ECZD ECZE ECZG ECZK ECZN ECZT ECZU ED2G ED2H ED2I ED2J ED2K ED2L ED2M ED2N ED2O ED2P
2019 Sep 0.1 3.5 0.6 2.9 0.3 2.6 -0.8 -0.7 0.1 0.3 0.1 -0.4 1.2 -0.5 0.1 0.0 -0.7 0.5 0.5 0.0 -3.1 0.5 0.0 Oct 0.1 1.0 0.5 -7.1 1.0 3.8 -0.6 -1.6 0.2 0.4 1.1 -0.6 -0.2 0.1 0.0 0.8 0.1 0.5 0.5 -0.1 -0.5 0.4 1.9 Nov -0.4 -1.3 -0.9 -1.4 -1.2 1.1 0.0 1.0 -0.4 -1.4 -0.8 1.5 -2.0 -1.6 -0.1 -1.1 0.6 0.0 0.9 0.2 3.2 0.2 3.0 Dec 0.1 -4.8 -0.4 -3.5 0.1 -2.0 -0.2 -0.1 0.3 0.0 -0.5 1.6 0.6 0.1 0.2 0.2 0.5 0.3 0.7 -0.1 1.1 0.1 1.5
2020 Jan 0.2 -0.6 0.0 0.3 0.2 -2.4 1.3 0.1 0.3 1.5 0.9 -0.5 -1.5 -0.2 0.1 0.4 -0.1 0.0 0.2 2.3 -0.9 -1.8 1.2 Feb -0.3 -2.8 0.0 -0.1 0.4 -1.6 -1.0 -0.9 -0.2 -0.6 -3.1 0.9 1.7 0.0 0.1 0.1 -1.3 0.2 -2.5 1.5 -1.7 -0.5 -6.1 Mar -7.7 -5.5 -5.5 -6.2 -7.0 0.2 0.6 -4.8 -8.3 -11.2 -12.9 -32.3 -1.1 -1.0 -0.3 -1.6 -10.9 0.2 -31.7 -8.2 -17.2 -16.9 -24.2 Apr -18.8 -12.9 -20.7 -3.5 -25.8 -9.7 -7.5 -41.7 -16.7 -27.9 -25.7 -86.3 -9.8 -5.1 -2.0 -16.1 -26.9 0.3 -24.3 -17.2 -35.8 -39.7 -34.8 May 2.8 0.7 6.3 3.0 9.0 -0.8 0.4 9.4 1.9 13.3 6.9 15.7 -1.1 0.5 -0.4 -0.7 0.4 0.2 0.1 2.6 -7.0 5.7 -11.2 Jun 9.4 2.0 11.1 8.0 13.1 5.8 5.9 22.3 8.3 30.1 14.1 114.7 4.7 1.0 0.0 6.9 16.6 0.2 13.1 2.6 20.1 8.7 13.3 Jul 7.8 2.4 5.9 -2.5 7.5 5.8 0.9 17.5 7.6 7.4 5.8 160.3 3.8 0.9 0.6 3.5 4.4 0.1 33.1 6.7 16.0 50.8 36.4 Aug 2.2 2.2 1.5 -3.6 2.4 0.4 -0.4 2.5 2.2 -2.4 1.7 43.4 -1.0 0.2 0.2 0.7 1.3 0.2 15.3 5.2 -0.3 -9.3 19.9 Sep 1.7 2.0 0.7 -2.3 1.2 0.1 0.3 3.2 1.8 1.7 2.6 -12.9 -0.1 1.7 0.2 4.0 1.5 0.2 9.1 5.1 4.8 1.4 1.1 Oct 0.7 0.5 0.8 0.6 1.4 -2.7 0.6 2.0 0.6 1.3 1.1 -14.0 3.5 0.8 0.2 1.0 2.3 0.1 1.5 0.8 1.7 0.9 -6.7 Nov -2.3 -0.5 1.1 -4.2 1.8 0.3 0.0 0.9 -3.1 -6.0 0.7 -40.9 -2.0 0.1 -0.3 -0.4 -2.5 -0.1 -2.9 -0.3 -13.6 -21.9 -5.2 Dec 1.0 -1.3 -0.3 2.9 -1.1 2.7 0.9 -1.6 1.4 2.6 2.6 25.1 -1.3 0.2 0.3 3.3 2.9 0.2 -5.2 0.3 7.9 20.5 7.6
2021 Jan -2.4 -1.3 -1.4 -3.6 -1.9 1.5 0.6 -0.9 -2.7 -8.5 -4.3 -15.5 2.2 1.1 1.0 -3.1 -1.3 0.1 -17.0 4.2 0.3 -18.2 5.1 Feb 0.8 -0.5 0.6 -4.1 0.9 0.3 1.6 3.4 0.6 3.7 0.3 2.4 -1.3 1.4 -0.8 1.7 0.3 0.1 0.5 -0.7 2.2 -0.4 0.7 Mar 2.1 0.1 1.2 2.1 1.4 -0.8 1.6 4.9 2.1 2.6 1.7 -1.4 1.0 -0.4 -0.1 3.3 2.7 0.3 16.0 1.2 2.5 -1.8 -6.7 Apr 2.8 1.9 -0.4 -15.0 0.6 1.4 -1.1 0.4 3.6 10.2 0.8 44.8 1.4 -1.2 -0.1 -2.1 0.6 0.1 11.0 3.4 6.1 30.1 19.8 May 0.6 1.3 0.9 3.1 0.0 6.0 -0.1 -1.5 0.8 -0.4 -0.8 35.2 0.3 -1.5 -0.1 -0.1 0.5 0.0 -2.3 2.7 5.4 0.6 0.0 Jun 1.4 1.4 -0.6 -8.9 -0.1 -1.7 1.1 0.3 1.9 -0.1 3.3 14.0 -1.9 0.2 0.2 3.5 2.4 0.1 0.2 8.0 3.2 0.0 -4.3 Jul -0.2 0.0 0.4 19.3 -0.4 -3.2 1.2 -1.2 -0.2 -1.2 -0.6 1.8 1.8 0.7 -0.4 -2.6 0.3 0.2 0.4 -1.9 9.1 1.6 1.4 Aug 0.2 -0.8 1.0 18.0 0.3 -1.6 -0.5 -0.7 0.1 -0.9 0.9 10.1 0.4 0.0 0.3 0.1 0.6 0.0 0.8 -4.7 7.7 1.4 0.7 Sep 0.6 -0.5 -0.4 -0.8 -0.1 -1.6 -0.4 1.3 0.7 -1.5 2.1 2.3 -2.3 -0.2 0.0 2.1 2.2 -0.2 0.4 4.7 1.2 0.4 1.7
1 The GVA output is designated as a National Statistic. Sources: For further information on these data please telephone2 Indices reflect values measured at basic prices, which exclude "taxes less 01633 582428 or E-mail [email protected] subsidies on products".3 Estimates cannot be regarded as accurate to the last digit shown.4 Any apparent inconsistencies between the index numbers and the percentage changes shown in these tables are due to rounding.5 A complete run of data is available on the ONS website.
GVA2Industry sections (SIC2007)
6. The construction growth rates calculated from this release may have small differences to those in Construction Output in Great Britain releases, due to rounding differences. For the most accurate figure, please refer to the Construction Output release.

Monthly GDP based on GVA (Gross Value Added) 1
Chained volume indices of gross value added at basic prices 2,3,4,5 seasonally adjusted 2019=100
Wholesale Activities of Total Water and retail: Accommodation Professional, Administrative Public households
GVA at Agriculture, Total Electricity supply, Total repair of and food Information Financial scientific and support administration Human health Arts, Other as employers,basic forestry and production Mining & gas, steam sewerage service motor vehicles Transport service and and insurance Real estate and technical service and and social entertainment service undifferentiatedprices fishing industries quarrying Manufacturing and air etc Construction 6 industries and motorcycles and storage activities Communication activities activities activities activities defence Education work activities and recreation activities goods and services
Section A-T A B-E B C D E F G-T G H I J K L M N O P Q R S T 2019 weights 1000 7 137 11 99 15 12 64 792 105 40 29 62 82 131 74 51 48 59 76 16 17 2
Percentage change, latest month on same month a year ago
ED2R ED2S ED2T ED2U ED2V ED2W ED2X ED2Y ED2Z ED32 ED33 ED34 ED35 ED36 ED37 ED38 ED39 ED3A ED3B ED3C ED3D ED3E ED3F
2019 Sep 1.5 25.8 0.8 -24.1 2.2 13.9 -1.4 -2.5 1.8 0.5 0.9 3.4 5.8 -0.5 1.1 0.5 1.0 3.6 5.1 1.8 1.4 1.6 3.2Oct 1.3 31.0 0.5 -36.5 3.9 15.4 -1.5 -4.5 1.7 0.6 0.9 1.6 6.3 -0.2 0.7 1.2 1.0 4.1 5.0 1.3 0.3 2.2 -2.1 Nov 0.8 29.4 -0.8 -36.8 1.7 17.7 -0.3 -2.9 1.2 -1.2 -0.3 2.3 3.3 -1.5 0.5 0.1 1.7 4.1 5.4 1.8 3.4 3.7 1.8Dec 1.1 19.7 -1.3 -37.9 1.6 14.7 -0.6 -1.1 1.6 0.0 0.0 5.0 1.7 -1.5 1.1 1.1 3.3 4.2 5.0 1.9 2.1 4.7 3.0
2020 Jan 1.0 16.1 -2.1 -32.4 0.3 6.0 1.2 -2.3 1.7 0.6 1.0 2.7 -0.4 -1.8 0.8 3.1 2.1 3.1 5.3 4.0 2.7 3.3 7.4Feb 0.3 10.7 -2.2 -29.5 -0.3 7.3 -0.2 -4.6 1.1 -0.2 -2.3 2.9 0.6 -1.2 0.8 2.2 -0.2 2.7 2.7 5.1 0.2 1.5 1.2Mar -7.5 3.1 -8.7 -32.2 -8.9 6.2 -0.1 -7.3 -7.3 -11.4 -14.7 -30.0 -0.3 -1.6 0.4 1.0 -11.5 2.5 -30.3 -3.7 -17.3 -16.5 -23.8 Apr -24.8 -10.8 -25.3 -24.8 -30.0 -9.1 -8.1 -48.1 -22.8 -36.1 -37.1 -90.3 -11.2 -6.6 -1.5 -15.0 -34.4 2.7 -47.5 -20.4 -46.2 -48.7 -51.2 May -22.8 -11.9 -21.4 -20.2 -24.7 -11.4 -8.3 -42.9 -21.5 -27.6 -32.1 -88.8 -12.4 -6.2 -2.2 -15.6 -34.6 2.8 -47.8 -18.4 -49.4 -46.2 -56.5 Jun -15.7 -12.3 -12.1 -5.0 -14.7 -7.4 -3.2 -29.5 -15.3 -5.3 -22.1 -76.8 -9.3 -5.1 -2.1 -11.3 -23.6 2.9 -41.3 -16.6 -41.1 -41.9 -50.0 Jul -9.3 -14.3 -7.2 -11.1 -8.6 -0.2 -1.4 -15.8 -9.1 1.6 -19.0 -38.8 -5.7 -5.1 -1.5 -8.3 -21.6 2.7 -21.7 -11.4 -30.7 -12.3 -32.0 Aug -7.3 -15.9 -5.0 -13.8 -5.5 2.2 -1.9 -12.5 -7.2 -0.8 -17.2 -11.7 -5.5 -5.8 -1.3 -8.4 -20.1 2.6 -9.9 -6.8 -32.6 -22.0 -17.7 Sep -5.8 -17.1 -5.0 -18.2 -4.7 -0.3 -0.9 -9.0 -5.5 0.5 -15.0 -22.8 -6.7 -3.7 -1.2 -4.7 -18.4 2.4 -2.2 -2.0 -27.1 -21.4 -16.8 Oct -5.2 -17.5 -4.7 -11.4 -4.3 -6.5 0.4 -5.7 -5.1 1.4 -15.0 -33.2 -3.3 -3.1 -1.1 -4.5 -16.6 2.0 -1.2 -1.0 -25.5 -21.0 -23.8 Nov -7.0 -16.8 -2.8 -13.9 -1.4 -7.2 0.3 -5.9 -7.7 -3.3 -13.7 -61.1 -3.2 -1.4 -1.2 -3.8 -19.1 1.9 -5.0 -1.5 -37.6 -38.4 -29.9 Dec -6.2 -13.8 -2.6 -8.1 -2.5 -2.8 1.4 -7.2 -6.6 -0.8 -11.0 -52.1 -5.0 -1.2 -1.1 -0.9 -17.1 1.8 -10.5 -1.0 -33.5 -25.8 -25.7
2021 Jan -8.7 -14.4 -3.9 -11.7 -4.6 1.1 0.8 -8.2 -9.5 -10.6 -15.6 -59.4 -1.4 0.0 -0.3 -4.4 -18.1 1.9 -25.9 0.7 -32.7 -38.2 -22.8 Feb -7.7 -12.4 -3.4 -15.3 -4.1 3.1 3.5 -4.2 -8.7 -6.6 -12.6 -58.8 -4.3 1.5 -1.2 -2.9 -16.9 1.8 -23.7 -1.5 -30.0 -38.2 -17.2 Mar 2.1 -7.2 3.4 -7.8 4.5 2.1 4.6 5.5 1.6 7.8 2.0 -39.9 -2.2 2.1 -1.0 1.9 -4.1 1.9 29.7 8.6 -13.4 -27.0 2.0Apr 29.4 8.5 29.9 -18.8 41.7 14.6 11.8 81.5 26.5 64.8 38.3 534.2 10.0 6.4 0.8 18.9 31.9 1.7 90.2 35.6 43.2 57.4 87.6May 26.6 9.1 23.3 -18.7 30.0 22.4 11.2 63.5 25.1 44.8 28.4 640.9 11.6 4.2 1.1 19.7 32.0 1.5 85.5 35.8 62.2 49.8 111.2Jun 17.4 8.5 10.3 -31.5 14.8 13.7 6.2 34.1 17.6 11.1 16.2 293.3 4.5 3.3 1.3 15.9 16.0 1.4 64.3 42.9 39.4 37.7 78.4Jul 8.7 5.9 4.5 -16.1 6.4 4.0 6.6 12.8 9.1 2.2 9.2 53.9 2.6 3.2 0.3 9.1 11.4 1.5 23.9 31.4 31.0 -7.2 32.6Aug 6.6 2.8 4.0 2.6 4.1 2.0 6.4 9.3 6.9 3.7 8.4 18.0 3.9 3.0 0.3 8.5 10.7 1.4 8.4 19.0 41.5 3.7 11.3Sep 5.3 0.3 2.9 4.2 2.8 0.3 5.8 7.2 5.7 0.5 7.8 38.8 1.7 1.2 0.1 6.6 11.5 1.0 -0.3 18.5 36.7 2.7 11.9
1 The GVA output is designated as a National Statistic. Sources: For further information on these data please telephone2 Indices reflect values measured at basic prices, which exclude "taxes less 01633 582428 or E-mail [email protected] subsidies on products".3 Estimates cannot be regarded as accurate to the last digit shown.4 Any apparent inconsistencies between the index numbers and the percentage changes shown in these tables are due to rounding.5 A complete run of data is available on the ONS website.
GVA3Industry sections (SIC2007)
6. The construction growth rates calculated from this release may have small differences to those in Construction Output in Great Britain releases, due to rounding differences. For the most accurate figure, please refer to the Construction Output release.

Monthly GDP based on GVA (Gross Value Added) 1
Revisions to growth of gross value added at basic prices 2 seasonally adjusted 2019=100 Periods open for revision: 2021 July - 2021 August
Wholesale Activities of Total Water and retail: Accommodation Professional, Administrative Public households
GVA at Agriculture, Total Electricity supply, Total repair of and food Information Financial scientific and support administration Human health Arts, Other as employers,basic forestry and production Mining & gas, steam sewerage service motor vehicles Transport service and and insurance Real estate and technical service and and social entertainment service undifferentiatedprices fishing industries quarrying Manufacturing and air etc Construction 4 industries and motorcycles and storage activities Communication activities activities activities activities defence Education work activities and recreation activities goods and services
Section A-T A B-E B C D E F G-T G H I J K L M N O P Q R S T 2019 weights 1000 7 137 11 99 15 12 64 792 105 40 29 62 82 131 74 51 48 59 76 16 17 2
Percentage change, latest 3 months on previous 3 months 3,5
2019 Aug 0.0 0.0 0.0 0.0 0.0 0.0 0.0 0.0 0.0 0.0 0.0 0.0 0.0 0.0 0.0 0.0 0.0 0.0 0.0 0.0 0.0 0.0 0.02019 Sep 0.0 0.0 0.0 0.0 0.0 0.0 0.0 0.0 0.0 0.0 0.0 0.0 0.0 0.0 0.0 0.0 0.0 0.0 0.0 0.0 0.0 0.0 0.0
Oct 0.0 0.0 0.0 0.0 0.0 0.0 0.0 0.0 0.0 0.0 0.0 0.0 0.0 0.0 0.0 0.0 0.0 0.0 0.0 0.0 0.0 0.0 0.0 Nov 0.0 0.0 0.0 0.0 0.0 0.0 0.0 0.0 0.0 0.0 0.0 0.0 0.0 0.0 0.0 0.0 0.0 0.0 0.0 0.0 0.0 0.0 0.0 Dec 0.0 0.0 0.0 0.0 0.0 0.0 0.0 0.0 0.0 0.0 0.0 0.0 0.0 0.0 0.0 0.0 0.0 0.0 0.0 0.0 0.0 0.0 0.0
2020 Jan 0.0 0.0 0.0 0.0 0.0 0.0 0.0 0.0 0.0 0.0 0.0 0.0 0.0 0.0 0.0 0.0 0.0 0.0 0.0 0.0 0.0 0.0 0.0 Feb 0.0 0.0 0.0 0.0 0.0 0.0 0.0 0.0 0.0 0.0 0.0 0.0 0.0 0.0 0.0 0.0 0.0 0.0 0.0 0.0 0.0 0.0 0.0 Mar 0.0 0.0 0.0 0.0 0.0 0.0 0.0 0.0 0.0 0.0 0.0 0.0 0.0 0.0 0.0 0.0 0.0 0.0 0.0 0.0 0.0 0.0 0.0 Apr 0.0 0.0 0.0 0.0 0.0 0.0 0.0 0.0 0.0 0.0 0.0 0.0 0.0 0.0 0.0 0.0 0.0 0.0 0.0 0.0 0.0 0.0 0.0 May 0.0 0.0 0.0 0.0 0.0 0.0 0.0 0.0 0.0 0.0 0.0 0.0 0.0 0.0 0.0 0.0 0.0 0.0 0.0 0.0 0.0 0.0 0.0 Jun 0.0 0.0 0.0 0.0 0.0 0.0 0.0 0.0 0.0 0.0 0.0 0.0 0.0 0.0 0.0 0.0 0.0 0.0 0.0 0.0 0.0 0.0 0.0 Jul 0.0 0.0 0.0 0.0 0.0 0.0 0.0 0.0 0.0 0.0 0.0 0.0 0.0 0.0 0.0 0.0 0.0 0.0 0.0 0.0 0.0 0.0 0.0 Aug 0.0 0.0 0.0 0.0 0.0 0.0 0.0 0.0 0.0 0.0 0.0 0.0 0.0 0.0 0.0 0.0 0.0 0.0 0.0 0.0 0.0 0.0 0.0 Sep 0.0 0.0 0.0 0.0 0.0 0.0 0.0 0.0 0.0 0.0 0.0 0.0 0.0 0.0 0.0 0.0 0.0 0.0 0.0 0.0 0.0 0.0 0.0 Oct 0.0 0.0 0.0 0.0 0.0 0.0 0.0 0.0 0.0 0.0 0.0 0.0 0.0 0.0 0.0 0.0 0.0 0.0 0.0 0.0 0.0 0.0 0.0 Nov 0.0 0.0 0.0 0.0 0.0 0.0 0.0 0.0 0.0 0.0 0.0 0.0 0.0 0.0 0.0 0.0 0.0 0.0 0.0 0.0 0.0 0.0 0.0 Dec 0.0 0.0 0.0 0.0 0.0 0.0 0.0 0.0 0.0 0.0 0.0 0.0 0.0 0.0 0.0 0.0 0.0 0.0 0.0 0.0 0.0 0.0 0.0
2021 Jan 0.0 0.0 0.0 0.0 0.0 0.0 0.0 0.0 0.0 0.0 0.0 0.0 0.0 0.0 0.0 0.0 0.0 0.0 0.0 0.0 0.0 0.0 0.0 Feb 0.0 0.0 0.0 0.0 0.0 0.0 0.0 0.0 0.0 0.0 0.0 0.0 0.0 0.0 0.0 0.0 0.0 0.0 0.0 0.0 0.0 0.0 0.0 Mar 0.0 0.0 0.0 0.0 0.0 0.0 0.0 0.0 0.0 0.0 0.0 0.0 0.0 0.0 0.0 0.0 0.0 0.0 0.0 0.0 0.0 0.0 0.0 Apr 0.0 0.0 0.0 0.0 0.0 0.0 0.0 0.0 0.0 0.0 0.0 0.0 0.0 0.0 0.0 0.0 0.0 0.0 0.0 0.0 0.0 0.0 0.0 May 0.0 0.0 0.0 0.0 0.0 0.0 0.0 0.0 0.0 0.0 0.0 0.0 0.0 0.0 0.0 0.0 0.0 0.0 0.0 0.0 0.0 0.0 0.0 Jun 0.0 0.0 0.0 0.0 0.0 0.0 0.0 0.0 0.0 0.0 0.0 0.0 0.0 0.0 0.0 0.0 0.0 0.0 0.0 0.0 0.0 0.0 0.0 Jul 0.0 0.0 0.0 0.4 0.1 -0.5 0.0 -0.1 -0.1 0.0 -0.3 -0.5 -0.4 0.0 0.0 0.2 -0.3 0.0 0.3 -0.2 -0.5 0.1 0.1 Aug -0.2 0.0 0.1 1.7 0.1 -0.5 0.2 -0.3 -0.2 0.2 -0.9 -1.0 -1.4 -0.1 0.0 0.4 -0.8 0.1 0.6 -0.6 -1.3 0.1 -0.2
Percentage change, latest 3 months on same 3 months a year ago 3,5
2019 Aug 0.0 0.0 0.0 0.0 0.0 0.0 0.0 0.0 0.0 0.0 0.0 0.0 0.0 0.0 0.0 0.0 0.0 0.0 0.0 0.0 0.0 0.0 0.02019 Sep 0.0 0.0 0.0 0.0 0.0 0.0 0.0 0.0 0.0 0.0 0.0 0.0 0.0 0.0 0.0 0.0 0.0 0.0 0.0 0.0 0.0 0.0 0.0
Oct 0.0 0.0 0.0 0.0 0.0 0.0 0.0 0.0 0.0 0.0 0.0 0.0 0.0 0.0 0.0 0.0 0.0 0.0 0.0 0.0 0.0 0.0 0.0 Nov 0.0 0.0 0.0 0.0 0.0 0.0 0.0 0.0 0.0 0.0 0.0 0.0 0.0 0.0 0.0 0.0 0.0 0.0 0.0 0.0 0.0 0.0 0.0 Dec 0.0 0.0 0.0 0.0 0.0 0.0 0.0 0.0 0.0 0.0 0.0 0.0 0.0 0.0 0.0 0.0 0.0 0.0 0.0 0.0 0.0 0.0 0.0
2020 Jan 0.0 0.0 0.0 0.0 0.0 0.0 0.0 0.0 0.0 0.0 0.0 0.0 0.0 0.0 0.0 0.0 0.0 0.0 0.0 0.0 0.0 0.0 0.0 Feb 0.0 0.0 0.0 0.0 0.0 0.0 0.0 0.0 0.0 0.0 0.0 0.0 0.0 0.0 0.0 0.0 0.0 0.0 0.0 0.0 0.0 0.0 0.0 Mar 0.0 0.0 0.0 0.0 0.0 0.0 0.0 0.0 0.0 0.0 0.0 0.0 0.0 0.0 0.0 0.0 0.0 0.0 0.0 0.0 0.0 0.0 0.0 Apr 0.0 0.0 0.0 0.0 0.0 0.0 0.0 0.0 0.0 0.0 0.0 0.0 0.0 0.0 0.0 0.0 0.0 0.0 0.0 0.0 0.0 0.0 0.0 May 0.0 0.0 0.0 0.0 0.0 0.0 0.0 0.0 0.0 0.0 0.0 0.0 0.0 0.0 0.0 0.0 0.0 0.0 0.0 0.0 0.0 0.0 0.0 Jun 0.0 0.0 0.0 0.0 0.0 0.0 0.0 0.0 0.0 0.0 0.0 0.0 0.0 0.0 0.0 0.0 0.0 0.0 0.0 0.0 0.0 0.0 0.0 Jul 0.0 0.0 0.0 0.0 0.0 0.0 0.0 0.0 0.0 0.0 0.0 0.0 0.0 0.0 0.0 0.0 0.0 0.0 0.0 0.0 0.0 0.0 0.0 Aug 0.0 0.0 0.0 0.0 0.0 0.0 0.0 0.0 0.0 0.0 0.0 0.0 0.0 0.0 0.0 0.0 0.0 0.0 0.0 0.0 0.0 0.0 0.0 Sep 0.0 0.0 0.0 0.0 0.0 0.0 0.0 0.0 0.0 0.0 0.0 0.0 0.0 0.0 0.0 0.0 0.0 0.0 0.0 0.0 0.0 0.0 0.0 Oct 0.0 0.0 0.0 0.0 0.0 0.0 0.0 0.0 0.0 0.0 0.0 0.0 0.0 0.0 0.0 0.0 0.0 0.0 0.0 0.0 0.0 0.0 0.0 Nov 0.0 0.0 0.0 0.0 0.0 0.0 0.0 0.0 0.0 0.0 0.0 0.0 0.0 0.0 0.0 0.0 0.0 0.0 0.0 0.0 0.0 0.0 0.0 Dec 0.0 0.0 0.0 0.0 0.0 0.0 0.0 0.0 0.0 0.0 0.0 0.0 0.0 0.0 0.0 0.0 0.0 0.0 0.0 0.0 0.0 0.0 0.0
2021 Jan 0.0 0.0 0.0 0.0 0.0 0.0 0.0 0.0 0.0 0.0 0.0 0.0 0.0 0.0 0.0 0.0 0.0 0.0 0.0 0.0 0.0 0.0 0.0 Feb 0.0 0.0 0.0 0.0 0.0 0.0 0.0 0.0 0.0 0.0 0.0 0.0 0.0 0.0 0.0 0.0 0.0 0.0 0.0 0.0 0.0 0.0 0.0 Mar 0.0 0.0 0.0 0.0 0.0 0.0 0.0 0.0 0.0 0.0 0.0 0.0 0.0 0.0 0.0 0.0 0.0 0.0 0.0 0.0 0.0 0.0 0.0 Apr 0.0 0.0 0.0 0.0 0.0 0.0 0.0 0.0 0.0 0.0 0.0 0.0 0.0 0.0 0.0 0.0 0.0 0.0 0.0 0.0 0.0 0.0 0.0 May 0.0 0.0 0.0 0.0 0.0 0.0 0.0 0.0 0.0 0.0 0.0 0.0 0.0 0.0 0.0 0.0 0.0 0.0 0.0 0.0 0.0 0.0 0.0 Jun 0.0 0.0 0.0 0.0 0.0 0.0 0.0 0.0 0.0 0.0 0.0 0.0 0.0 0.0 0.0 0.0 0.0 0.0 0.0 0.0 0.0 0.0 0.0 Jul 0.0 0.1 0.1 0.3 0.1 -0.5 0.1 -0.1 -0.1 0.0 -0.3 -0.8 -0.4 0.0 0.0 0.2 -0.3 0.1 0.5 -0.3 -0.6 0.1 0.2 Aug -0.2 0.1 0.2 1.3 0.0 -0.5 0.3 -0.4 -0.2 0.3 -0.9 -1.0 -1.4 -0.1 0.0 0.4 -0.8 0.1 0.8 -0.7 -1.6 0.1 -0.3
1 The GVA output is designated as a National Statistic. Sources: For further information on these data please telephone2 Estimates cannot be regarded as accurate to the last digit shown. 01633 582428 or E-mail [email protected] Any apparent inconsistencies between the index numbers and the percentage changes shown in these tables are due to rounding.4 Monthly data from the construction survey are only available from January 2010, therefore the data prior to this period are derived using statistical methods from the available quarterly data, and should therefore be treated with some caution.5 Revisions to periods highlighted in Grey are consistent with the Quarterly National Accounts published on 30 September 2021
REV1Industry sections (SIC2007)

Monthly GDP based on GVA (Gross Value Added) 1
Revisions to growth of gross value added at basic prices 2,3 seasonally adjusted 2019=100 Periods open for revision: 2021 July - 2021 August
Wholesale Activities of Total Water and retail: Accommodation Professional, Administrative Public households
GVA at Agriculture, Total Electricity supply, Total repair of and food Information Financial scientific and support administration Human health Arts, Other as employers,basic forestry and production Mining & gas, steam sewerage service motor vehicles Transport service and and insurance Real estate and technical service and and social entertainment service undifferentiatedprices fishing industries quarrying Manufacturing and air etc Construction 4 industries and motorcycles and storage activities Communication activities activities activities activities defence Education work activities and recreation activities goods and services
Section A-T A B-E B C D E F G-T G H I J K L M N O P Q R S T 2019 weights 1000 7 137 11 99 15 12 64 792 105 40 29 62 82 131 74 51 48 59 76 16 17 2
Percentage change, latest month on previous month 3,5
2019 Aug 0.0 0.0 0.0 0.0 0.0 0.0 0.0 0.0 0.0 0.0 0.0 0.0 0.0 0.0 0.0 0.0 0.0 0.0 0.0 0.0 0.0 0.0 0.02019 Sep 0.0 0.0 0.0 0.0 0.0 0.0 0.0 0.0 0.0 0.0 0.0 0.0 0.0 0.0 0.0 0.0 0.0 0.0 0.0 0.0 0.0 0.0 0.0
Oct 0.0 0.0 0.0 0.0 0.0 0.0 0.0 0.0 0.0 0.0 0.0 0.0 0.0 0.0 0.0 0.0 0.0 0.0 0.0 0.0 0.0 0.0 0.0 Nov 0.0 0.0 0.0 0.0 0.0 0.0 0.0 0.0 0.0 0.0 0.0 0.0 0.0 0.0 0.0 0.0 0.0 0.0 0.0 0.0 0.0 0.0 0.0 Dec 0.0 0.0 0.0 0.0 0.0 0.0 0.0 0.0 0.0 0.0 0.0 0.0 0.0 0.0 0.0 0.0 0.0 0.0 0.0 0.0 0.0 0.0 0.0
2020 Jan 0.0 0.0 0.0 0.0 0.0 0.0 0.0 0.0 0.0 0.0 0.0 0.0 0.0 0.0 0.0 0.0 0.0 0.0 0.0 0.0 0.0 0.0 0.0 Feb 0.0 0.0 0.0 0.0 0.0 0.0 0.0 0.0 0.0 0.0 0.0 0.0 0.0 0.0 0.0 0.0 0.0 0.0 0.0 0.0 0.0 0.0 0.0 Mar 0.0 0.0 0.0 0.0 0.0 0.0 0.0 0.0 0.0 0.0 0.0 0.0 0.0 0.0 0.0 0.0 0.0 0.0 0.0 0.0 0.0 0.0 0.0 Apr 0.0 0.0 0.0 0.0 0.0 0.0 0.0 0.0 0.0 0.0 0.0 0.0 0.0 0.0 0.0 0.0 0.0 0.0 0.0 0.0 0.0 0.0 0.0 May 0.0 0.0 0.0 0.0 0.0 0.0 0.0 0.0 0.0 0.0 0.0 0.0 0.0 0.0 0.0 0.0 0.0 0.0 0.0 0.0 0.0 0.0 0.0 Jun 0.0 0.0 0.0 0.0 0.0 0.0 0.0 0.0 0.0 0.0 0.0 0.0 0.0 0.0 0.0 0.0 0.0 0.0 0.0 0.0 0.0 0.0 0.0 Jul 0.0 0.0 0.0 0.0 0.0 0.0 0.0 0.0 0.0 0.0 0.0 0.0 0.0 0.0 0.0 0.0 0.0 0.0 0.0 0.0 0.0 0.0 0.0 Aug 0.0 0.0 0.0 0.0 0.0 0.0 0.0 0.0 0.0 0.0 0.0 0.0 0.0 0.0 0.0 0.0 0.0 0.0 0.0 0.0 0.0 0.0 0.0 Sep 0.0 0.0 0.0 0.0 0.0 0.0 0.0 0.0 0.0 0.0 0.0 0.0 0.0 0.0 0.0 0.0 0.0 0.0 0.0 0.0 0.0 0.0 0.0 Oct 0.0 0.0 0.0 0.0 0.0 0.0 0.0 0.0 0.0 0.0 0.0 0.0 0.0 0.0 0.0 0.0 0.0 0.0 0.0 0.0 0.0 0.0 0.0 Nov 0.0 0.0 0.0 0.0 0.0 0.0 0.0 0.0 0.0 0.0 0.0 0.0 0.0 0.0 0.0 0.0 0.0 0.0 0.0 0.0 0.0 0.0 0.0 Dec 0.0 0.0 0.0 0.0 0.0 0.0 0.0 0.0 0.0 0.0 0.0 0.0 0.0 0.0 0.0 0.0 0.0 0.0 0.0 0.0 0.0 0.0 0.0
2021 Jan 0.0 0.0 0.0 0.0 0.0 0.0 0.0 0.0 0.0 0.0 0.0 0.0 0.0 0.0 0.0 0.0 0.0 0.0 0.0 0.0 0.0 0.0 0.0 Feb 0.0 0.0 0.0 0.0 0.0 0.0 0.0 0.0 0.0 0.0 0.0 0.0 0.0 0.0 0.0 0.0 0.0 0.0 0.0 0.0 0.0 0.0 0.0 Mar 0.0 0.0 0.0 0.0 0.0 0.0 0.0 0.0 0.0 0.0 0.0 0.0 0.0 0.0 0.0 0.0 0.0 0.0 0.0 0.0 0.0 0.0 0.0 Apr 0.0 0.0 0.0 0.0 0.0 0.0 0.0 0.0 0.0 0.0 0.0 0.0 0.0 0.0 0.0 0.0 0.0 0.0 0.0 0.0 0.0 0.0 0.0 May 0.0 0.0 0.0 0.0 0.0 0.0 0.0 0.0 0.0 0.0 0.0 0.0 0.0 0.0 0.0 0.0 0.0 0.0 0.0 0.0 0.0 0.0 0.0 Jun 0.0 0.0 0.0 0.0 0.0 0.0 0.0 0.0 0.0 0.0 0.0 0.0 0.0 0.0 0.0 0.0 0.0 0.0 0.0 0.0 0.0 0.0 0.0 Jul -0.1 0.1 0.1 1.6 0.2 -1.2 0.2 -0.2 -0.1 0.0 -0.7 -0.8 -1.2 -0.1 0.0 0.5 -0.7 0.2 1.0 -0.6 -1.4 0.3 0.4 Aug -0.2 -0.1 0.2 2.0 -0.2 1.2 0.3 -0.5 -0.2 0.7 -1.2 -0.2 -1.7 -0.1 0.0 0.2 -0.9 -0.1 0.0 -0.7 -0.8 -0.1 -1.4
Percentage change, latest month on same month a year ago 3,5
2019 Aug 0.0 0.0 0.0 0.0 0.0 0.0 0.0 0.0 0.0 0.0 0.0 0.0 0.0 0.0 0.0 0.0 0.0 0.0 0.0 0.0 0.0 0.0 0.02019 Sep 0.0 0.0 0.0 0.0 0.0 0.0 0.0 0.0 0.0 0.0 0.0 0.0 0.0 0.0 0.0 0.0 0.0 0.0 0.0 0.0 0.0 0.0 0.0
Oct 0.0 0.0 0.0 0.0 0.0 0.0 0.0 0.0 0.0 0.0 0.0 0.0 0.0 0.0 0.0 0.0 0.0 0.0 0.0 0.0 0.0 0.0 0.0 Nov 0.0 0.0 0.0 0.0 0.0 0.0 0.0 0.0 0.0 0.0 0.0 0.0 0.0 0.0 0.0 0.0 0.0 0.0 0.0 0.0 0.0 0.0 0.0 Dec 0.0 0.0 0.0 0.0 0.0 0.0 0.0 0.0 0.0 0.0 0.0 0.0 0.0 0.0 0.0 0.0 0.0 0.0 0.0 0.0 0.0 0.0 0.0
2020 Jan 0.0 0.0 0.0 0.0 0.0 0.0 0.0 0.0 0.0 0.0 0.0 0.0 0.0 0.0 0.0 0.0 0.0 0.0 0.0 0.0 0.0 0.0 0.0 Feb 0.0 0.0 0.0 0.0 0.0 0.0 0.0 0.0 0.0 0.0 0.0 0.0 0.0 0.0 0.0 0.0 0.0 0.0 0.0 0.0 0.0 0.0 0.0 Mar 0.0 0.0 0.0 0.0 0.0 0.0 0.0 0.0 0.0 0.0 0.0 0.0 0.0 0.0 0.0 0.0 0.0 0.0 0.0 0.0 0.0 0.0 0.0 Apr 0.0 0.0 0.0 0.0 0.0 0.0 0.0 0.0 0.0 0.0 0.0 0.0 0.0 0.0 0.0 0.0 0.0 0.0 0.0 0.0 0.0 0.0 0.0 May 0.0 0.0 0.0 0.0 0.0 0.0 0.0 0.0 0.0 0.0 0.0 0.0 0.0 0.0 0.0 0.0 0.0 0.0 0.0 0.0 0.0 0.0 0.0 Jun 0.0 0.0 0.0 0.0 0.0 0.0 0.0 0.0 0.0 0.0 0.0 0.0 0.0 0.0 0.0 0.0 0.0 0.0 0.0 0.0 0.0 0.0 0.0 Jul 0.0 0.0 0.0 0.0 0.0 0.0 0.0 0.0 0.0 0.0 0.0 0.0 0.0 0.0 0.0 0.0 0.0 0.0 0.0 0.0 0.0 0.0 0.0 Aug 0.0 0.0 0.0 0.0 0.0 0.0 0.0 0.0 0.0 0.0 0.0 0.0 0.0 0.0 0.0 0.0 0.0 0.0 0.0 0.0 0.0 0.0 0.0 Sep 0.0 0.0 0.0 0.0 0.0 0.0 0.0 0.0 0.0 0.0 0.0 0.0 0.0 0.0 0.0 0.0 0.0 0.0 0.0 0.0 0.0 0.0 0.0 Oct 0.0 0.0 0.0 0.0 0.0 0.0 0.0 0.0 0.0 0.0 0.0 0.0 0.0 0.0 0.0 0.0 0.0 0.0 0.0 0.0 0.0 0.0 0.0 Nov 0.0 0.0 0.0 0.0 0.0 0.0 0.0 0.0 0.0 0.0 0.0 0.0 0.0 0.0 0.0 0.0 0.0 0.0 0.0 0.0 0.0 0.0 0.0 Dec 0.0 0.0 0.0 0.0 0.0 0.0 0.0 0.0 0.0 0.0 0.0 0.0 0.0 0.0 0.0 0.0 0.0 0.0 0.0 0.0 0.0 0.0 0.0
2021 Jan 0.0 0.0 0.0 0.0 0.0 0.0 0.0 0.0 0.0 0.0 0.0 0.0 0.0 0.0 0.0 0.0 0.0 0.0 0.0 0.0 0.0 0.0 0.0 Feb 0.0 0.0 0.0 0.0 0.0 0.0 0.0 0.0 0.0 0.0 0.0 0.0 0.0 0.0 0.0 0.0 0.0 0.0 0.0 0.0 0.0 0.0 0.0 Mar 0.0 0.0 0.0 0.0 0.0 0.0 0.0 0.0 0.0 0.0 0.0 0.0 0.0 0.0 0.0 0.0 0.0 0.0 0.0 0.0 0.0 0.0 0.0 Apr 0.0 0.0 0.0 0.0 0.0 0.0 0.0 0.0 0.0 0.0 0.0 0.0 0.0 0.0 0.0 0.0 0.0 0.0 0.0 0.0 0.0 0.0 0.0 May 0.0 0.0 0.0 0.0 0.0 0.0 0.0 0.0 0.0 0.0 0.0 0.0 0.0 0.0 0.0 0.0 0.0 0.0 0.0 0.0 0.0 0.0 0.0 Jun 0.0 0.0 0.0 0.0 0.0 0.0 0.0 0.0 0.0 0.0 0.0 0.0 0.0 0.0 0.0 0.0 0.0 0.0 0.0 0.0 0.0 0.0 0.0 Jul -0.1 0.1 0.1 1.2 0.3 -1.3 0.2 -0.3 -0.2 0.0 -0.8 -1.2 -1.2 0.0 0.0 0.5 -0.7 0.2 1.2 -0.7 -1.7 0.2 0.5 Aug -0.3 0.0 0.3 3.1 0.0 0.0 0.6 -0.8 -0.4 0.7 -2.0 -1.3 -3.1 -0.2 -0.1 0.7 -1.8 0.2 1.1 -1.5 -2.9 0.1 -1.2
1 The GVA output is designated as a National Statistic. Sources: For further information on these data please telephone2 Estimates cannot be regarded as accurate to the last digit shown. 01633 582428 or E-mail [email protected] Any apparent inconsistencies between the index numbers and the percentage changes shown in these tables are due to rounding.4 Monthly data from the construction survey are only available from January 2010, therefore the data prior to this period are derived using statistical methods from the available quarterly data, and should therefore be treated with some caution.5 Revisions to periods highlighted in Grey are consistent with the Quarterly National Accounts published on 30 September 2021
REV2Industry sections (SIC2007)

Monthly GDP based on GVA (Gross Value Added) 1
Contributions to growth of gross value added at basic prices 2,3,4,5 seasonally adjusted 2019=100
Wholesale Activities of Total Water and retail: Accommodation Professional, Administrative Public households
GVA at Agriculture, Total Electricity supply, Total repair of and food Information Financial scientific and support administration Human health Arts, Other as employers,basic forestry and production Mining & gas, steam sewerage service motor vehicles Transport service and and insurance Real estate and technical service and and social entertainment service undifferentiated
prices fishing industries quarrying Manufacturing and air etc Construction industries and motorcycles and storage activities Communication activities activities activities activities defence Education work activities and recreation activities goods and services Section A-T A B-E B C D E F G-T G H I J K L M N O P Q R S T 2019 weights 1000 7 137 11 99 15 12 64 792 105 40 29 62 82 131 74 51 48 59 76 16 17 2
Contribution to growth, latest 3 months on previous 3 months
EDMB EDMC EDMD EDME EDMF EDMG EDMH EDMI EDMJ EDMK EDML EDMM EDMN EDMO EDMP EDMQ EDMR EDMS EDMT EDMU EDMV EDMW EDMX
2019 Sep 0.34 0.08 -0.02 -0.03 0.02 -0.01 -0.01 -0.23 0.51 -0.01 0.03 0.01 0.02 0.10 0.01 0.12 0.06 0.03 0.04 0.05 0.01 0.04 0.00 Oct 0.21 0.08 -0.04 -0.02 -0.02 0.00 -0.01 -0.24 0.41 0.02 0.03 -0.02 -0.01 0.09 0.01 0.12 0.00 0.05 0.04 0.03 0.01 0.04 0.00 Nov 0.08 0.06 0.03 -0.02 0.01 0.05 -0.02 -0.18 0.17 0.01 0.03 -0.03 -0.03 -0.01 0.02 0.05 -0.01 0.05 0.07 0.01 -0.02 0.04 0.00 Dec -0.04 0.02 -0.01 -0.08 0.01 0.07 -0.01 -0.12 0.07 -0.04 0.01 0.01 -0.06 -0.08 0.02 0.03 0.00 0.05 0.10 0.00 0.01 0.03 0.012020 Jan -0.11 -0.02 -0.08 -0.07 -0.03 0.03 0.00 -0.02 0.02 -0.06 0.00 0.06 -0.12 -0.14 0.02 -0.02 0.04 0.03 0.12 0.06 0.04 0.00 0.01 Feb -0.02 -0.05 -0.12 -0.06 -0.01 -0.03 0.00 -0.01 0.16 0.00 -0.05 0.07 -0.08 -0.09 0.03 0.00 0.02 0.03 0.05 0.15 0.03 -0.02 0.01 Mar -2.55 -0.06 -0.33 -0.04 -0.22 -0.07 0.01 -0.11 -2.04 -0.32 -0.24 -0.27 -0.07 -0.09 0.03 -0.02 -0.21 0.02 -0.67 0.04 -0.10 -0.13 -0.02 Apr -10.98 -0.09 -1.40 -0.06 -1.20 -0.11 -0.03 -1.07 -8.43 -1.60 -0.73 -1.20 -0.20 -0.20 -0.07 -0.44 -0.83 0.03 -1.71 -0.61 -0.38 -0.41 -0.06 May -18.67 -0.11 -2.29 -0.07 -2.04 -0.13 -0.05 -1.86 -14.41 -2.58 -1.09 -2.12 -0.46 -0.35 -0.21 -0.91 -1.40 0.03 -2.64 -1.29 -0.64 -0.67 -0.09 Jun -19.28 -0.11 -2.37 -0.03 -2.14 -0.14 -0.07 -2.23 -14.57 -2.08 -1.03 -2.30 -0.58 -0.42 -0.32 -1.19 -1.45 0.04 -2.21 -1.52 -0.68 -0.72 -0.09 Jul -5.67 -0.06 -0.38 0.03 -0.37 -0.03 -0.01 -0.66 -4.57 0.61 -0.29 -0.94 -0.27 -0.21 -0.23 -0.58 -0.63 0.04 -0.71 -0.73 -0.35 -0.23 -0.05 Aug 9.66 0.00 1.56 0.06 1.35 0.10 0.05 1.00 7.09 2.97 0.42 1.01 0.17 0.01 -0.07 0.21 0.35 0.04 1.33 0.30 0.08 0.26 0.02 Sep 17.71 0.05 2.38 0.00 2.14 0.17 0.07 2.06 13.23 3.10 0.70 2.27 0.41 0.23 0.11 0.79 0.76 0.03 2.61 1.19 0.33 0.62 0.07 Oct 11.98 0.04 1.38 -0.04 1.30 0.09 0.03 1.32 9.25 1.38 0.44 1.57 0.28 0.22 0.13 0.65 0.50 0.03 2.34 1.13 0.23 0.28 0.06 Nov 5.45 0.03 0.64 -0.06 0.69 0.01 0.01 0.70 4.08 0.14 0.24 0.09 0.14 0.23 0.09 0.47 0.20 0.02 1.50 0.87 0.07 0.00 0.02 Dec 1.39 0.01 0.34 -0.04 0.39 -0.02 0.01 0.30 0.74 -0.19 0.17 -0.77 0.08 0.18 0.05 0.35 0.13 0.02 0.47 0.45 -0.03 -0.16 0.002021 Jan -1.40 -0.01 0.16 -0.02 0.17 0.01 0.02 0.11 -1.70 -0.63 0.09 -1.01 0.01 0.14 0.06 0.20 0.04 0.01 -0.59 0.33 -0.08 -0.23 0.00 Feb -1.69 -0.02 0.00 -0.02 -0.04 0.05 0.03 0.01 -1.70 -0.61 0.02 -0.49 -0.03 0.15 0.08 0.13 0.05 0.01 -1.27 0.28 -0.01 -0.14 0.01 Mar -1.35 -0.02 -0.06 -0.03 -0.10 0.05 0.04 0.13 -1.43 -0.61 -0.06 -0.29 0.01 0.18 0.07 0.08 0.04 0.02 -1.18 0.40 0.03 -0.21 0.01 Apr 1.82 -0.01 0.03 -0.06 0.04 0.03 0.04 0.35 1.46 0.38 -0.02 0.15 0.05 0.13 -0.02 0.16 0.10 0.02 -0.02 0.39 0.10 0.00 0.01 May 3.96 0.01 0.15 -0.07 0.17 0.05 0.03 0.41 3.41 0.91 0.02 0.52 0.12 -0.03 -0.06 0.15 0.13 0.03 1.00 0.52 0.12 0.12 0.01 Jun 5.50 0.02 0.13 -0.10 0.18 0.07 0.01 0.24 5.17 1.34 0.09 1.10 0.07 -0.17 -0.07 0.14 0.16 0.02 1.28 0.85 0.17 0.33 0.02 Jul 4.15 0.02 0.09 -0.04 0.07 0.07 0.01 0.01 4.08 0.68 0.08 1.23 0.06 -0.18 -0.04 0.08 0.16 0.02 0.64 1.01 0.20 0.23 0.01 Aug 2.72 0.02 0.05 0.03 0.00 0.00 0.02 -0.10 2.79 0.17 0.10 1.05 0.00 -0.07 -0.02 0.08 0.15 0.02 0.18 0.79 0.23 0.14 0.00 Sep 1.25 0.00 0.10 0.13 -0.03 -0.06 0.02 -0.10 1.26 -0.28 0.09 0.67 0.01 0.02 -0.02 0.03 0.14 0.01 0.03 0.24 0.26 0.04 0.00
Contribution to growth, latest 3 months on same 3 months a year ago
EDMY EDMZ EDNA EDNB EDNC EDND EDNE EDNF EDNG EDNH EDNI EDNJ EDNK EDNL EDNM EDNN EDNO EDNP EDNQ EDNR EDNS EDNT EDNU
2019 Sep 1.61 0.12 0.18 -0.26 0.22 0.17 -0.01 -0.08 1.40 -0.04 0.06 0.11 0.42 -0.06 0.15 0.03 0.12 0.16 0.30 0.13 0.03 -0.01 0.01 Oct 1.43 0.16 0.08 -0.42 0.26 0.18 -0.01 -0.17 1.36 0.02 0.04 0.09 0.37 -0.04 0.13 0.06 0.09 0.17 0.29 0.12 0.03 0.02 0.00 Nov 1.20 0.18 0.02 -0.52 0.26 0.21 -0.01 -0.21 1.22 0.00 0.02 0.07 0.33 -0.06 0.11 0.05 0.06 0.19 0.30 0.12 0.03 0.04 0.00 Dec 1.08 0.17 -0.07 -0.60 0.24 0.21 -0.01 -0.18 1.17 -0.02 0.01 0.09 0.24 -0.09 0.10 0.06 0.10 0.20 0.30 0.12 0.03 0.06 0.002020 Jan 0.97 0.13 -0.19 -0.52 0.12 0.18 0.00 -0.13 1.16 -0.02 0.01 0.10 0.09 -0.13 0.11 0.11 0.12 0.18 0.31 0.19 0.04 0.07 0.01 Feb 0.81 0.09 -0.26 -0.46 0.05 0.13 0.00 -0.17 1.15 0.01 -0.02 0.10 0.04 -0.13 0.12 0.16 0.09 0.16 0.25 0.28 0.03 0.05 0.01 Mar -2.05 0.06 -0.61 -0.41 -0.30 0.09 0.00 -0.30 -1.20 -0.39 -0.21 -0.24 0.00 -0.13 0.09 0.16 -0.16 0.13 -0.44 0.14 -0.08 -0.07 -0.01 Apr -10.63 0.01 -1.66 -0.35 -1.29 0.02 -0.03 -1.32 -7.66 -1.67 -0.72 -1.14 -0.23 -0.26 -0.01 -0.29 -0.78 0.13 -1.47 -0.48 -0.34 -0.36 -0.05 May -18.35 -0.04 -2.54 -0.30 -2.10 -0.07 -0.07 -2.17 -13.61 -2.63 -1.12 -2.03 -0.50 -0.39 -0.14 -0.73 -1.36 0.13 -2.46 -1.07 -0.60 -0.63 -0.09 Jun -21.11 -0.08 -2.68 -0.18 -2.28 -0.14 -0.08 -2.65 -15.70 -2.41 -1.21 -2.50 -0.68 -0.49 -0.25 -1.03 -1.56 0.14 -2.69 -1.40 -0.73 -0.77 -0.10 Jul -15.95 -0.09 -1.86 -0.12 -1.59 -0.10 -0.05 -1.92 -12.08 -1.09 -0.97 -2.01 -0.57 -0.45 -0.25 -0.87 -1.35 0.14 -2.18 -1.17 -0.65 -0.57 -0.09 Aug -10.77 -0.10 -1.11 -0.10 -0.95 -0.03 -0.03 -1.24 -8.32 -0.16 -0.77 -1.26 -0.43 -0.44 -0.21 -0.70 -1.11 0.13 -1.44 -0.88 -0.57 -0.44 -0.06 Sep -7.45 -0.11 -0.78 -0.14 -0.62 0.01 -0.02 -0.79 -5.76 0.05 -0.68 -0.72 -0.37 -0.40 -0.18 -0.53 -1.02 0.13 -0.67 -0.51 -0.49 -0.32 -0.04 Oct -6.07 -0.13 -0.66 -0.14 -0.48 -0.02 -0.01 -0.57 -4.71 0.04 -0.63 -0.66 -0.32 -0.35 -0.16 -0.44 -0.93 0.11 -0.26 -0.25 -0.46 -0.37 -0.04 Nov -5.98 -0.13 -0.56 -0.14 -0.34 -0.07 0.00 -0.43 -4.85 -0.05 -0.58 -1.15 -0.27 -0.22 -0.16 -0.33 -0.92 0.10 -0.17 -0.11 -0.48 -0.47 -0.05 Dec -6.12 -0.12 -0.46 -0.10 -0.27 -0.09 0.01 -0.39 -5.15 -0.09 -0.53 -1.44 -0.24 -0.15 -0.15 -0.23 -0.90 0.09 -0.34 -0.09 -0.53 -0.50 -0.052021 Jan -7.29 -0.10 -0.40 -0.07 -0.27 -0.05 0.01 -0.43 -6.40 -0.50 -0.53 -1.63 -0.19 -0.07 -0.11 -0.23 -0.91 0.09 -1.01 -0.05 -0.56 -0.60 -0.05 Feb -7.54 -0.09 -0.42 -0.08 -0.35 0.01 0.02 -0.40 -6.68 -0.61 -0.51 -1.62 -0.21 0.01 -0.11 -0.20 -0.87 0.09 -1.45 -0.05 -0.52 -0.59 -0.04 Mar -4.97 -0.08 -0.18 -0.07 -0.14 0.03 0.03 -0.15 -4.61 -0.36 -0.35 -1.42 -0.16 0.10 -0.11 -0.14 -0.66 0.09 -0.73 0.23 -0.41 -0.58 -0.03 Apr 6.05 -0.03 1.06 -0.09 1.03 0.10 0.08 1.05 3.93 1.59 0.20 -0.39 0.05 0.29 -0.06 0.41 0.00 0.10 1.15 1.15 -0.11 -0.20 0.02 May 18.18 0.02 2.30 -0.11 2.17 0.21 0.12 2.20 13.63 3.37 0.72 1.07 0.42 0.39 0.05 1.03 0.77 0.10 3.25 2.37 0.28 0.23 0.07 Jun 24.21 0.06 2.69 -0.18 2.58 0.28 0.13 2.79 18.66 3.64 0.93 2.26 0.59 0.44 0.17 1.45 1.13 0.10 3.88 3.48 0.52 0.56 0.10 Jul 17.09 0.05 1.61 -0.16 1.55 0.21 0.10 1.80 13.66 1.83 0.61 1.92 0.40 0.32 0.13 1.14 0.83 0.09 2.85 3.25 0.48 0.29 0.08 Aug 10.71 0.04 0.81 -0.11 0.79 0.10 0.08 1.01 8.89 0.62 0.39 1.24 0.23 0.27 0.09 0.84 0.55 0.08 1.70 2.69 0.44 0.12 0.05 Sep 6.85 0.02 0.49 -0.02 0.42 0.03 0.08 0.57 5.80 0.24 0.30 0.79 0.17 0.21 0.03 0.60 0.48 0.07 0.66 2.03 0.44 -0.01 0.03
1 The GVA output is designated as a National Statistic.2 Estimates cannot be regarded as accurate to the last digit shown.3 A complete run of data is available on the ONS website. 4 Contributions are based on output GVA growth5 Please use additional caution when aggregating individual contributions from April - September 2020, as the larger-than-usual growth rates mean that, when summed, the rounded contributions may not accurately represent the higher level contribution being calculated.
Sources: For further information on these data please telephone 01633 582428 or E-mail [email protected]
CONTRIB 1Industry sections (SIC2007)

Monthly GDP based on GVA (Gross Value Added) 1
Contributions to growth of gross value added at basic prices 2,3,4,5 seasonally adjusted 2019=100
Wholesale Activities of Total Water and retail: Accommodation Professional, Administrative Public households
GVA at Agriculture, Total Electricity supply, Total repair of and food Information Financial scientific and support administration Human health Arts, Other as employers,basic forestry and production Mining & gas, steam sewerage service motor vehicles Transport service and and insurance Real estate and technical service and and social entertainment service undifferentiatedprices fishing industries quarrying Manufacturing and air etc Construction industries and motorcycles and storage activities Communication activities activities activities activities defence Education work activities and recreation activities goods and services
Section A-T A B-E B C D E F G-T G H I J K L M N O P Q R S T 2019 weights 1000 7 137 11 99 15 12 64 792 105 40 29 62 82 131 74 51 48 59 76 16 17 2
Contributon to growth, latest month on previous month
EDKH EDKI EDKJ EDKK EDKL EDKM EDKN EDKO EDKP EDKQ EDKR EDKS EDKT EDKU EDKV EDKW EDKX EDKY EDKZ EDLA EDLB EDLC EDLD
2019 Sep 0.11 0.03 0.09 0.03 0.03 0.04 -0.01 -0.05 0.05 0.03 0.00 -0.01 0.08 -0.04 0.02 0.00 -0.04 0.02 0.03 0.00 -0.05 0.01 0.00 Oct 0.14 0.01 0.07 -0.08 0.10 0.06 -0.01 -0.10 0.16 0.04 0.04 -0.02 -0.01 0.01 0.01 0.06 0.00 0.02 0.03 -0.01 -0.01 0.01 0.00 Nov -0.39 -0.01 -0.12 -0.01 -0.12 0.02 0.00 0.06 -0.33 -0.14 -0.03 0.04 -0.13 -0.13 -0.02 -0.08 0.03 0.00 0.06 0.01 0.05 0.00 0.01 Dec 0.11 -0.04 -0.06 -0.04 0.01 -0.03 0.00 -0.01 0.21 0.00 -0.02 0.05 0.04 0.01 0.03 0.02 0.02 0.01 0.04 -0.01 0.02 0.00 0.002020 Jan 0.25 0.00 -0.01 0.00 0.02 -0.04 0.01 0.01 0.25 0.16 0.04 -0.01 -0.10 -0.02 0.01 0.03 0.00 0.00 0.01 0.18 -0.02 -0.03 0.00 Feb -0.25 -0.02 0.00 0.00 0.04 -0.02 -0.01 -0.05 -0.18 -0.06 -0.12 0.03 0.10 0.00 0.02 0.01 -0.07 0.01 -0.15 0.12 -0.03 -0.01 -0.01 Mar -7.71 -0.04 -0.74 -0.06 -0.70 0.00 0.01 -0.30 -6.64 -1.17 -0.50 -0.97 -0.07 -0.08 -0.03 -0.12 -0.55 0.01 -1.89 -0.65 -0.28 -0.29 -0.05 Apr -18.84 -0.09 -2.86 -0.03 -2.58 -0.16 -0.10 -2.66 -13.23 -2.80 -0.94 -1.91 -0.65 -0.44 -0.28 -1.29 -1.31 0.02 -1.07 -1.35 -0.52 -0.61 -0.06 May 2.83 0.01 0.85 0.03 0.82 -0.01 0.01 0.43 1.54 1.19 0.23 0.06 -0.08 0.06 -0.06 -0.06 0.02 0.02 0.01 0.20 -0.08 0.07 -0.01 Jun 9.35 0.01 1.55 0.09 1.28 0.10 0.08 1.09 6.70 2.97 0.49 0.48 0.33 0.09 -0.01 0.56 0.71 0.01 0.52 0.21 0.21 0.10 0.01 Jul 7.83 0.02 0.84 -0.03 0.76 0.10 0.01 0.96 6.01 0.87 0.21 1.32 0.26 0.08 0.10 0.27 0.20 0.01 1.37 0.50 0.18 0.60 0.04 Aug 2.15 0.01 0.21 -0.04 0.24 0.01 0.00 0.15 1.78 -0.28 0.06 0.87 -0.06 0.01 0.03 0.05 0.06 0.01 0.78 0.39 0.00 -0.15 0.03 Sep 1.75 0.01 0.10 -0.02 0.12 0.00 0.00 0.19 1.44 0.19 0.09 -0.36 -0.01 0.14 0.03 0.30 0.07 0.01 0.52 0.39 0.06 0.02 0.00 Oct 0.75 0.00 0.11 0.01 0.14 -0.04 0.01 0.12 0.51 0.14 0.04 -0.34 0.22 0.06 0.02 0.07 0.10 0.01 0.09 0.07 0.02 0.01 -0.01 Nov -2.29 0.00 0.15 -0.04 0.18 0.00 0.00 0.05 -2.49 -0.68 0.02 -0.83 -0.12 0.01 -0.04 -0.03 -0.11 -0.01 -0.18 -0.02 -0.17 -0.32 -0.01 Dec 0.97 -0.01 -0.04 0.03 -0.12 0.04 0.01 -0.10 1.11 0.28 0.10 0.31 -0.08 0.02 0.05 0.25 0.13 0.01 -0.32 0.03 0.09 0.24 0.012021 Jan -2.42 -0.01 -0.19 -0.02 -0.19 0.02 0.01 -0.05 -2.18 -0.90 -0.16 -0.23 0.14 0.09 0.13 -0.24 -0.06 0.01 -1.19 0.39 0.00 -0.25 0.01 Feb 0.78 0.00 0.08 -0.03 0.09 0.01 0.02 0.21 0.49 0.37 0.01 0.03 -0.08 0.12 -0.11 0.13 0.01 0.00 0.03 -0.07 0.03 -0.01 0.00 Mar 2.10 0.00 0.16 0.01 0.13 -0.01 0.02 0.30 1.65 0.26 0.06 -0.02 0.06 -0.03 -0.01 0.26 0.12 0.02 0.95 0.12 0.03 -0.02 -0.01 Apr 2.85 0.01 -0.05 -0.09 0.06 0.02 -0.01 0.03 2.91 1.06 0.03 0.55 0.08 -0.10 -0.02 -0.16 0.03 0.01 0.74 0.33 0.07 0.33 0.03 May 0.65 0.01 0.11 0.02 0.00 0.09 0.00 -0.09 0.63 -0.05 -0.03 0.61 0.02 -0.13 -0.02 -0.01 0.02 0.00 -0.17 0.26 0.07 0.01 0.00 Jun 1.42 0.01 -0.08 -0.04 -0.01 -0.03 0.01 0.02 1.49 -0.01 0.11 0.33 -0.12 0.01 0.02 0.27 0.11 0.01 0.01 0.80 0.04 0.00 -0.01 Jul -0.20 0.00 0.05 0.09 -0.04 -0.05 0.01 -0.07 -0.17 -0.13 -0.02 0.05 0.11 0.06 -0.05 -0.20 0.01 0.01 0.03 -0.20 0.12 0.02 0.00 Aug 0.16 0.00 0.12 0.10 0.02 -0.02 -0.01 -0.04 0.08 -0.10 0.03 0.27 0.02 0.00 0.03 0.01 0.03 0.00 0.06 -0.49 0.11 0.02 0.00 Sep 0.56 0.00 -0.05 -0.01 -0.01 -0.02 0.00 0.08 0.54 -0.16 0.08 0.07 -0.14 -0.01 0.00 0.16 0.10 -0.01 0.03 0.46 0.02 0.01 0.00
Contribution to growth, latest month on same month a year ago
EDLE EDLF EDLG EDLH EDLI EDLJ EDLK EDLL EDLM EDLN EDLO EDLP EDLQ EDLR EDLS EDLT EDLU EDLV EDLW EDLX EDLY EDLZ EDMA
2019 Sep 1.49 0.17 0.10 -0.36 0.22 0.18 -0.02 -0.16 1.39 0.05 0.03 0.10 0.38 -0.04 0.15 0.04 0.05 0.17 0.30 0.13 0.02 0.03 0.01 Oct 1.32 0.19 0.07 -0.60 0.39 0.21 -0.02 -0.29 1.35 0.06 0.04 0.05 0.40 -0.02 0.10 0.09 0.05 0.20 0.29 0.10 0.00 0.04 0.00 Nov 0.79 0.18 -0.11 -0.60 0.17 0.24 0.00 -0.19 0.91 -0.12 -0.01 0.07 0.21 -0.13 0.07 0.01 0.08 0.20 0.31 0.13 0.05 0.06 0.00 Dec 1.13 0.13 -0.18 -0.61 0.16 0.20 -0.01 -0.07 1.25 0.00 0.00 0.15 0.11 -0.12 0.15 0.08 0.16 0.20 0.30 0.14 0.03 0.08 0.012020 Jan 0.98 0.10 -0.29 -0.44 0.03 0.09 0.01 -0.15 1.32 0.06 0.04 0.08 -0.02 -0.15 0.11 0.23 0.11 0.15 0.31 0.30 0.04 0.06 0.01 Feb 0.34 0.07 -0.31 -0.38 -0.03 0.10 0.00 -0.30 0.87 -0.03 -0.09 0.09 0.04 -0.10 0.11 0.17 -0.01 0.13 0.15 0.39 0.00 0.03 0.00 Mar -7.47 0.02 -1.22 -0.41 -0.90 0.09 0.00 -0.46 -5.80 -1.20 -0.59 -0.88 -0.02 -0.13 0.06 0.07 -0.59 0.12 -1.77 -0.28 -0.28 -0.28 -0.05 Apr -24.78 -0.07 -3.45 -0.27 -2.95 -0.14 -0.10 -3.21 -18.07 -3.79 -1.49 -2.63 -0.70 -0.54 -0.20 -1.11 -1.74 0.13 -2.79 -1.54 -0.74 -0.82 -0.10 May -22.82 -0.08 -2.94 -0.21 -2.45 -0.17 -0.10 -2.84 -16.97 -2.90 -1.27 -2.58 -0.77 -0.50 -0.28 -1.15 -1.76 0.14 -2.83 -1.39 -0.78 -0.79 -0.11 Jun -15.73 -0.08 -1.65 -0.05 -1.45 -0.11 -0.04 -1.92 -12.08 -0.55 -0.87 -2.30 -0.58 -0.42 -0.28 -0.84 -1.19 0.14 -2.45 -1.26 -0.67 -0.72 -0.10 Jul -9.31 -0.10 -0.99 -0.11 -0.85 0.00 -0.02 -1.01 -7.21 0.17 -0.76 -1.15 -0.36 -0.41 -0.20 -0.62 -1.11 0.13 -1.28 -0.86 -0.49 -0.21 -0.06 Aug -7.27 -0.12 -0.68 -0.14 -0.55 0.03 -0.02 -0.79 -5.68 -0.09 -0.68 -0.34 -0.34 -0.48 -0.17 -0.63 -1.03 0.13 -0.58 -0.51 -0.54 -0.38 -0.03 Sep -5.76 -0.13 -0.68 -0.19 -0.46 0.00 -0.01 -0.56 -4.39 0.06 -0.60 -0.67 -0.42 -0.31 -0.16 -0.35 -0.93 0.11 -0.13 -0.15 -0.43 -0.37 -0.03 Oct -5.19 -0.13 -0.64 -0.11 -0.43 -0.10 0.00 -0.35 -4.06 0.15 -0.60 -0.96 -0.20 -0.25 -0.14 -0.34 -0.84 0.10 -0.07 -0.08 -0.40 -0.37 -0.05 Nov -6.99 -0.13 -0.38 -0.13 -0.13 -0.12 0.00 -0.37 -6.11 -0.35 -0.55 -1.81 -0.20 -0.11 -0.16 -0.29 -0.98 0.09 -0.30 -0.11 -0.62 -0.68 -0.06 Dec -6.19 -0.10 -0.35 -0.07 -0.25 -0.04 0.02 -0.45 -5.29 -0.08 -0.44 -1.56 -0.31 -0.10 -0.15 -0.07 -0.88 0.09 -0.64 -0.08 -0.55 -0.46 -0.052021 Jan -8.68 -0.10 -0.50 -0.07 -0.43 0.02 0.01 -0.49 -7.64 -1.08 -0.62 -1.68 -0.08 0.00 -0.04 -0.33 -0.91 0.09 -1.89 0.07 -0.53 -0.66 -0.05 Feb -7.74 -0.08 -0.43 -0.10 -0.39 0.05 0.04 -0.25 -7.03 -0.68 -0.48 -1.69 -0.26 0.12 -0.15 -0.22 -0.83 0.09 -1.69 -0.14 -0.48 -0.66 -0.03 Mar 2.07 -0.05 0.45 -0.05 0.44 0.03 0.06 0.34 1.31 0.76 0.07 -0.84 -0.14 0.18 -0.14 0.15 -0.20 0.10 1.57 0.79 -0.19 -0.42 0.00 Apr 29.36 0.06 3.80 -0.15 3.66 0.25 0.17 3.65 21.79 5.63 1.27 1.90 0.71 0.64 0.14 1.56 1.37 0.11 4.44 3.33 0.49 0.66 0.11 May 26.62 0.06 3.06 -0.15 2.79 0.38 0.15 3.02 20.46 4.29 0.98 2.57 0.80 0.41 0.17 1.57 1.34 0.09 4.10 3.33 0.64 0.59 0.12 Jun 17.43 0.05 1.37 -0.24 1.42 0.22 0.08 1.82 14.23 1.27 0.58 2.31 0.30 0.30 0.19 1.24 0.72 0.08 3.19 3.75 0.44 0.44 0.09 Jul 8.70 0.04 0.59 -0.11 0.61 0.06 0.08 0.74 7.36 0.25 0.32 1.03 0.16 0.27 0.04 0.68 0.49 0.08 1.47 2.72 0.38 -0.12 0.05 Aug 6.57 0.02 0.52 0.02 0.40 0.03 0.08 0.54 5.52 0.40 0.29 0.48 0.24 0.25 0.05 0.63 0.46 0.07 0.58 1.70 0.49 0.05 0.02 Sep 5.33 0.00 0.37 0.03 0.27 0.00 0.07 0.42 4.55 0.06 0.28 0.89 0.10 0.10 0.02 0.50 0.49 0.05 -0.02 1.70 0.45 0.04 0.02
1 The GVA output is designated as a National Statistic.2 Estimates cannot be regarded as accurate to the last digit shown.3 A complete run of data is available on the ONS website. 4 Contributions are based on output GVA growth5 Please use additional caution when aggregating individual contributions from April - September 2020, as the larger-than-usual growth rates mean that, when summed, the rounded contributions may not accurately represent the higher level contribution being calculated.
Sources: For further information on these data please telephone 01633 582428 or E-mail [email protected]
CONTRIB 2Industry sections (SIC2007)