Embed Size (px)
Citation preview

Classification: Confidential (C-3)
Monthly Economic Insight
Prepared by TMB Analytics
Date: 13 July 2017

Executive Summary
Better-than-expected Eurozone economy remained a solid driver for global economic outlook
which reflected by resilient manufacturing and services industry activities (higher PMI
figures). Additionally, the US manufacturing sector also showed sign of stronger expansion.
Nevertheless, there were persisting downside risks such as Brexit talk, “early” Italian election
and uncertainty of Trumponomics which could disrupt worldwide economic activities and
recovering global trades.
In May, the Thai economy continued to expand well as the ongoing recovery in external
demand and the growing tourism sector while the private investment remained fragile.
Private consumption continued to expand, supported by improvement in farm income, while
private investment remained contracted albeit improvement in business sentiment.
May exports surged by 13.2% mainly due to global economic recovery, while the effect of oil
price was starting to dissipate. Most of export products registered positive growth, indicating
product diversification and upward trends of global exports. Imports of raw material and
capital goods continued to grow at the high level of 18.2%, responding to a continuing
economic and export expansion.
-2-

Executive Summary
Manufacturing production increased +1.4%yoy in May, thanks to higher outputs of food,
electronic, vehicle and part supported by export market recovery. However, beverages in
alcohol product dropped due to gov’t will charging more excise tax, as well as construction
material declined from low demand in real estate sector.
Tourist attracted 2.59 million international visitors in May (+5%yoy) and monthly receipts
were 125 billion Baht (+6.9%yoy), these attributed from Chinese rebound to “Growth” zone
faster than forecast. During first five months, inbound tourists were recorded by 14.6 million
arrivals (+3.2%yoy) and the accumulation of oversea revenue generated 747 billion
(+5.1%yoy), showing that sector be able to grow right on target.
Inflation rate in June slowed down further to -0.05% due to high base effect from last year
drought. In 2017, 1.50% Policy rate is expected due to weak private investment and fragile
export recovery.
In the past month, Thai baht appreciated against the USD by 0.27% due to unclear path of
Trumponomics and future Fed’s rate hike. Fed and other central banks’ actions to start
reducing easing monetary policy later this year, could boost fund outflows from Thailand . In
near term, the dollar is expected to trade near 34.30 THB/USD in the 3rd Quarter of 2017.-3-

Classification: Confidential (C-3)
Economic Updates
Updates on Global Economy
Updates on Thai Economy

Classification: Confidential (C-3)Classification: Confidential (C-3)
Global Economy

1H2017 2H2017
EM risk-off
High corporate debt
Fed funds rate hike
UK trigger Article
50
Fed fund rate hike
Return of private investment
German
Election
0.75 to 1.00
French
Election
-6-
Debt Ceiling is back
Fed fund rate hike
1.00 to 1.251.25 to 1.50
UK
Election
Italy
Election
1Q2018
Era of Rising Interest Rate and Series of Elections

1H2017 2H2017
UK trigger Article
50 German
Election
French
Election
-7-
Theresa May
failed to win
majority in
parliament (317/650 seats)
UK
ElectionItaly
Election
1Q2018
“Bye Bye EUSee you (Softer)Hard Brexit”
“En Marche!” (Forward!)
“Progressive Movement”
Emmanuel Macron beat Marine Le Pen in presidential election
and won 350/577 seats in parliament
Angela Merkel’s
CDU/CSU* party is
expected to win
40% of votes
according to opinion polls
5 stars movement
party is losing popularity
Dutch
Election
Mark Rutte beat
Geert Wilders,
destroyed hope for Nethexit
*CDU = Christian Democratic Union of Germany
*CSU = Christian Social Union in Bavaria
Political Risk Subsided as Eurosceptic Lost in Elections

Classification: Confidential (C-3) -8-Source: Bloomberg, CEIC, and TMB Analytics
5
10
15
20
25
30EURUSD Volatility
GBPUSD Volatility
%
Fear of
Brexit
Brexit
Vote
Article50
Triggered
French
Election
UK Snap
election
EU FX Volatility Varied by Series of Political Risks

Source: ING and TMB Analytics -9-
Possible “Softer” Hard Brexit Talk
“Bye Bye EUSee you (Softer)Hard Brexit”
March 2017
March 2019
UK leaves EU
EU finalizes “divorce”
term with UK
1-3 Months
6-8 Months
10-11 Months
4-5 Months
Preparation
time
Future deals between
UK and EU negotiation
27 individual EU members
will ratify the deal
It will still take about 2 years to formally divorce EU as the talk could be less intense.
UK General Election June 8th 2017

-10-
Funding
Source: Bloomberg, ING, GovTrack, RealClearPolitics, FlatIcon, CBO, Wikipedia, and TMB Analytics
“39% of R-Congress are very Conservative … They will oppose my great plans !!!”
Trumpcare
Delayed!!
Tax Reform Infrastructure
Will also be Delayed!!
+0.3 Trillion USD over 10 years
Border
Adjustment Tax
-1 Trillion USD over 10 years
-1.2 Trillion USD over 10 years
+1.0 Trillion USD over 10 years
Trumponomics Likely Brings Disappointment This Year
Trump’s great stimulus plan timelines will be extended longer than market’s expectations as Healthcare reforms was delayed indefinitely.

Classification: Confidential (C-3) -11-Source: Fed, ECB, BOJ, Bloomberg, CEIC, and TMB Analytics
1.0
3.0
5.0
7.0
9.0
11.0
13.0
15.0
Dec-08 Dec-09 Dec-10 Dec-11 Dec-12 Dec-13 Dec-14 Dec-15 Dec-16
Fed B/S
ECB B/S
BOJ B/S
Trillion USD
Fed QE
Fed Tightening & Balance sheet reduction
BOJ QE
ECB QE
Dec-17
4.37
Trillion USD
4.40
Trillion USD
4.5
Trillion USD
Global B/S have been Swollen by Quantitative Easing

-12-Source: Fed, BoJ, ECB, Bloomberg and TMB Analytics
Short-term rate: Fed Fund
Dovish Hawkish
Short-term rate: Refin RateDovish Hawkish
Short-term rate: PR-BalancesDovish Hawkish
2H/2017 1H/2018 2H/2018
FED
BOJ
ECB
1 Rate Hike 1 Rate Hike 1 Rate Hike
Start B/S run-off
$ -10 bn $ -20 bn $ -30 bn $ -40 bn $ -50 bn
0 Rate Hike 0 Rate Hike 1 Rate Hike
Start QE Tapering
EUR 60 bn EUR 40 bn
0 Rate Hike 0 Rate Hike 0 Rate Hike
Start QE Tapering
JPY 80 Trillion / year
EUR 20 bn
JPY 60 Trillion / year JPY 40 Trillion / year
Major Central Banks could be More Hawkish Next Year

70
101
178
6.4
6.8
7.2
7.6
0
50
100
150
200
2017 2018 2019
Average 5YCorporatebond yield
-13-Source: Bloomberg, PBOC, TradingEconomics and TMB Analytics; as of June 17
China Corporate Debt: Ticking Time-Bomb
Rollover Risk Looms As Cost of Funds RiseCorporate debt is absurdly high (156% of GDP)
%to GDP
-500
0
500
1,000
1,500
2,000
2,500
3,000
3,500
Jan-16 Apr-16 Jul-16 Oct-16 Jan-17
Shadow loans MoMBank loans MoM
PBOC’s loans tightening spur shadow loans
Billion Yuan
3
24
0
5
10
15
20
25
30
2008 2009 2010 2011 2012 2013 2014 2015 2016
Trillion Yuan
Shadow banking loans keep swelling up
Billion Yuan
Yearly amount due
on Corporate Bond
rated AA- or lower
Shadow loans = 13% of total debt
%
100156
73 85
160
257
0
100
200
300
400
500
600
2008 2016 2016 2016
Corporate Debt Household Debt
Bank Debt Government Debt

95
100
105
110
115
120
125
130
Jan-16 Apr-16 Jul-16 Oct-16 Jan-17 Apr-17
SET
S&P500
-100
-50
0
50
100
150
Jan-16 Apr-16 Jul-16 Oct-16 Jan-17 Apr-17
ST Bonds (TTM < 1y) LT Bonds Net Equity Foreign Flows
-14-Source: CEIC and TMB Analytics
Risk of Fund Flow Reversal ?
bn.THB
Allocations move from
DM to EM; debt to
equity as Brexit and Fed hike delay
Foreign fund continuously flows into Thailand as US election reflected higher risk appetite
EM outflows
from fear of
trade protectionism
Inflows to EM
from unclear Trumponomics
Fear of Trump’s victory
Reflationary
Theme boost “Risk-Appetite”
YTD Net Inflows = 135 bn. THB

-15-Source: CEIC and TMB Analytics
The Market Vs. The Fed: Who Will be Right?
The Fed remain faithful that economic growth and inflation will be picked up but the market seem to
disagree with the Fed. Delayed Trumponomics decimated “Reflation traders”.
-1.0
-0.5
0.0
0.5
1.0
1.5
2.0
2.5
3.0
'98 '01 '04 '07 '10 '13 '16
UST10Y-UST2Y
200D-Moving Average
50D-Moving Average
90% of Dead Cross
signal followed by a deep dive in yields spread
Inverted Yields Curve is a
good predictor of economic slowdown
%Dead Cross signal
Inverted
yields curve
Trump presidency
ignited “A New Hope on Reflation”
Weak economic data and
concerns over pro-growth agenda led to bond inflows

45.0
50.0
55.0
60.0
Jun-14 Jun-15 Jun-16 Jun-17
EU_Service_PMI
EU_Mfg_PMI
-16-
New US government
policies create more
volatility to economic
projections
Subdued inflation could be
persist until consumer
spending grows stronger
Economy is projected to
expand 2.0% in 2017 from
1.6% in 2016
United States Eurozone
Activity
1.2%QoQ SAAR Real
GDP 1Q17
Price
1.9%YoY SA CPI
May 17
Labor Mkt
4.4%Unemployment
Rate June 17
UK economy expands more
than expected, eases fears of
economic ramifications from
Brexit
Stronger expansion among
manufacturing and service
sectors sustain EU’s growth
Growth in 2017 is expected
to be around +1.8% better
than +1.6% in 2016
EU Activity
1.7%YoY SWDA GDP 1Q17
UK Activity
Industry
Latest Releases Latest Releases
Source: Bloomberg, and TMB Analytics’ projection
2.0%YoY SWDA GDP 1Q17
57.4EU Mfg PMI
June 17
Flattening yields curve could hint market top Steady Recovery in EU Manufacturing & Services
Solid Growth Momentum Among Developed Economies
(bps)
↑ Expansion
↓ Contraction
-100
-50
0
50
100
150
200
250
300
200.0
700.0
1,200.0
1,700.0
2,200.0
Mar-90 Mar-96 Mar-02 Mar-08 Mar-14
S&P500 (LHS)
UST10Y-UST2Y (RHS)
-17-Source: Bloomberg, and TMB Analytics’ projection
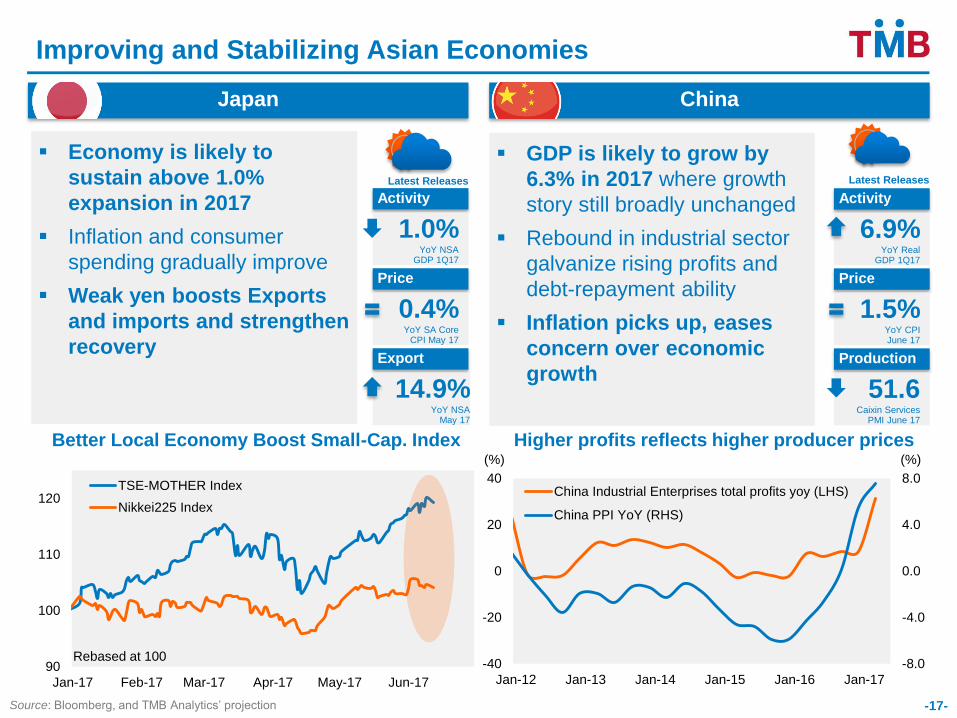
Economy is likely to
sustain above 1.0%
expansion in 2017
Inflation and consumer
spending gradually improve
Weak yen boosts Exports
and imports and strengthen
recovery
Japan China
Activity
1.0%YoY NSA
GDP 1Q17
Price
0.4%YoY SA Core
CPI May 17
Export
14.9%YoY NSA
May 17
GDP is likely to grow by
6.3% in 2017 where growth
story still broadly unchanged
Rebound in industrial sector
galvanize rising profits and
debt-repayment ability
Inflation picks up, eases
concern over economic
growth
Activity
6.9%YoY Real
GDP 1Q17
Price
1.5%YoY CPI June 17
Production
51.6Caixin Services
PMI June 17
Higher profits reflects higher producer prices
Latest Releases Latest Releases
Better Local Economy Boost Small-Cap. Index
Improving and Stabilizing Asian Economies
(%)(%)
-8.0
-4.0
0.0
4.0
8.0
-40
-20
0
20
40
Jan-12 Jan-13 Jan-14 Jan-15 Jan-16 Jan-17
China Industrial Enterprises total profits yoy (LHS)
China PPI YoY (RHS)
90
100
110
120
Jan-17 Feb-17 Mar-17 Apr-17 May-17 Jun-17
TSE-MOTHER Index
Nikkei225 Index
Rebased at 100

45
50
55
60
Jan-15 Jul-15 Jan-16 Jul-16 Jan-17
Japan Services
China Services
45
50
55
60
Jan-15 Jul-15 Jan-16 Jul-16 Jan-17
US Services
EU Services
45
50
55
60
Jan-15 Jul-15 Jan-16 Jul-16 Jan-17
China Manufacturing
Japan Manufacturing
45
50
55
60
Jan-15 Jul-15 Jan-16 Jul-16 Jan-17
US Manufacturing
EU Manufacturing
-18-Source: Bloomberg, PBOC, TradingEconomics and TMB Analytics; as of June 17
Steady Rise in EU Industry Activities while US loses Momentum
Industry activities in Japan start to rise steadilyEU Manufacturing sector continues to expand
No problem in Big Economies’ services sectors Japan Services finally escape from contraction
↑ Expansion
↓ Contraction
↑ Expansion
↓ Contraction

-100
-50
0
50
100
150
Jan-16 Apr-16 Jul-16 Oct-16 Jan-17 Apr-17
ST Bonds (TTM < 1y) LT Bonds Net Equity Foreign Flows
-19-Source: Bloomberg, CEIC and TMB Analytics
bn.THB
Allocations move from
DM to EM; debt to
equity as Brexit and Fed hike delay
EM outflows
from fear of
trade protectionism
Inflows to EM
from unclear Trumponomics
YTD Net Inflows = 166 bn. THB
Equity = 13 bn. THBBond = 153 bn. THB
-5
5
15
25
35
South Korea China Indonesia Thailand Phillippines Malaysia
Equity Bond
bn.USD
Thailand
Risk of Fund Flow Reversal ?
Foreign fund continuously flows into Thailand as US election reflected higher risk appetite
Year to date foreign fund flows into Asian mainly go into bond markets

Source: CEIC and TMB Analytics; as of June 2017 -20-
33.0
34.0
35.0
36.0
37.0
Oct-
16
De
c-1
6
Feb
-17
Ap
r-1
7
Ju
n-1
7
Aug-1
7
Oct-
17
De
c-1
7
Trump presidency leads to EM sell-off
1 Hikes & Trump Disappointed
34.30
Fed hiked policy rate by
25bps and planned to raise the rate 75bps in 2017
CBs’ Aggressive & Trumponomics
Strong
Thai Baht
Weak
Thai Baht
Other Central Banks Reduce QE, Rate hike
Pro-growth Trumponomics
Fed’s Tightening Cycle with B/S reduction
Trump “Too Strong Dollar”
Robust Thai economy and high C/A surplus
Geopolitical Risks
EM Risk-Off
THB
Risk Factors
2 Fed Hikes and B/S reduction in September
+ Pro-growth agendas pass congress
+ ECB communicate QE tapering
35.00
1 Fed Hikes and B/S reduction in December 2017Trump budgets less than what he proposes
33.90period-end
Improving Domestic Fundamentals Lessen Baht’s Depreciation
-21-
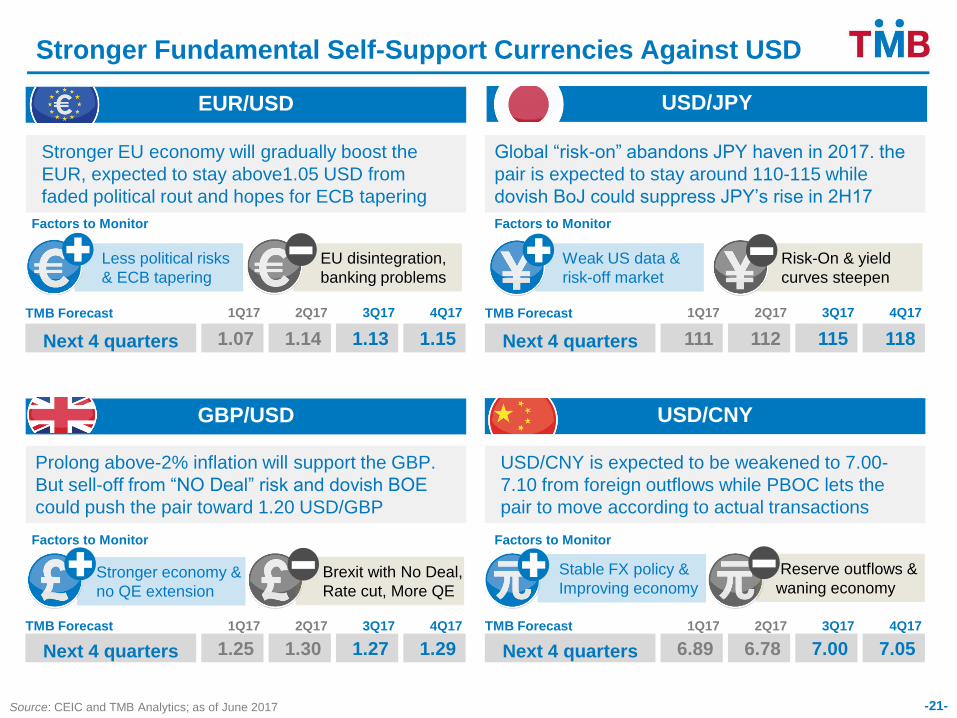
Stronger Fundamental Self-Support Currencies Against USD
Prolong above-2% inflation will support the GBP.
But sell-off from “NO Deal” risk and dovish BOE
could push the pair toward 1.20 USD/GBP
GBP/USD
1.291.271.301.25Next 4 quarters
4Q173Q172Q171Q17TMB Forecast
USD/CNY is expected to be weakened to 7.00-
7.10 from foreign outflows while PBOC lets the
pair to move according to actual transactions
USD/CNY
7.057.006.786.89Next 4 quarters
4Q173Q172Q171Q17TMB Forecast
Stronger EU economy will gradually boost the
EUR, expected to stay above1.05 USD from
faded political rout and hopes for ECB tapering
EU disintegration,
banking problems
Less political risks
& ECB tapering
EUR/USD
1.151.131.141.07Next 4 quarters
4Q173Q172Q171Q17TMB Forecast
Global “risk-on” abandons JPY haven in 2017. the
pair is expected to stay around 110-115 while
dovish BoJ could suppress JPY’s rise in 2H17
Risk-On & yield
curves steepen
Weak US data &
risk-off market
118115112111Next 4 quarters
4Q173Q172Q171Q17TMB Forecast
USD/JPY
Brexit with No Deal,
Rate cut, More QE
Stronger economy &
no QE extension
Reserve outflows &
waning economy
Stable FX policy &
Improving economy
Source: CEIC and TMB Analytics; as of June 2017
Factors to Monitor Factors to Monitor
Factors to Monitor Factors to Monitor

1.64
2.67
1.0
1.5
2.0
2.5
3.0
15Q1 15Q3 16Q1 16Q3 17Q1 17Q3
TGB2YTGB10Y
Source: MOC, CEIC and TMB Analytics -22-
% TMB’s Projection
0
1
2
3
4
5
15Q1 15Q3 16Q1 16Q3 17Q1 17Q3 18Q1 18Q3
2017 Policy Rate: 1.5%
%
2018 Policy Rate: 2.0%
2017 TGB 2Y: 1.64%
2017 TGB 10Y: 2.67%
Policy Rate will Reach 2.0% in 2018 amid Global Tightening Cycle
TGB yields will gradually rise as BoT hike rate

Thai Economy

65
70
75
80
85
-30
-20
-10
0
10
20
May-14 Nov-14 May-15 Nov-15 May-16 Nov-16 May-17
Services Durable Cons Confidence (RHS)
%yoy Index
Private Consumption Gained Traction
Source: BOT, OAE and TMB Analytics
Overall private consumption expanded well
especially in services from continual improvement
in farm income. Durable consumption persistently
expanded, while non-durable consumption slightly
contracted from the same period last year.
Farm income continuously grew, though at slower
rate due to lower price compared to last year as
there was high base effect from last year’s drought.
Quantity rise was mainly from rice production.
Private investment remained contracted even with
improving business sentiment.
Continual Expansion in Private Consumption Private Investment Remained Contracted
Farm Income Continuously Grew
44
47
50
53
-4
-1
2
5
May-14 Nov-14 May-15 Nov-15 May-16 Nov-16 May-17
Private Investment Biz Sentiment (RHS)
%yoy Index
-45
-30
-15
0
15
30
45
Apr-14 Oct-14 Apr-15 Oct-15 Apr-16 Oct-16 Apr-17
Price Quantity Farm Income
%yoy
-24-
-25-Source: Ministry of Finance and TMB Analytics
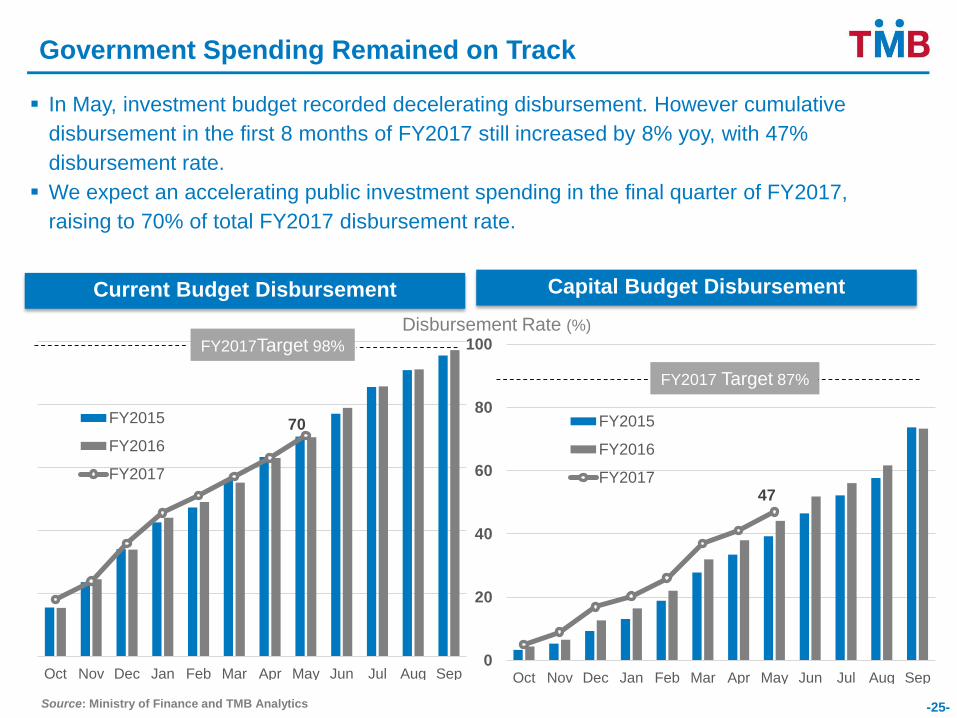
Government Spending Remained on Track
47
0
20
40
60
80
100
Oct Nov Dec Jan Feb Mar Apr May Jun Jul Aug Sep
FY2015
FY2016
FY2017
Capital Budget Disbursement
Disbursement Rate (%)
FY2017 Target 87%
70
Oct Nov Dec Jan Feb Mar Apr May Jun Jul Aug Sep
FY2015
FY2016
FY2017
Current Budget Disbursement
FY2017Target 98%
In May, investment budget recorded decelerating disbursement. However cumulative
disbursement in the first 8 months of FY2017 still increased by 8% yoy, with 47%
disbursement rate.
We expect an accelerating public investment spending in the final quarter of FY2017,
raising to 70% of total FY2017 disbursement rate.

7.6 4.6
57.866.3
0
1,000
2,000
3,000
4,000
5,000
6,000
7,000
8,000
Dec-1
4
Ma
r-1
5
Jun
-15
Se
p-1
5
Dec-1
5
Ma
r-1
6
Jun
-16
Se
p-1
6
Dec-1
6
Ma
r-1
7
Growth of No. of Tourists (%yoy)
May'17May'16
+114k
Occupancy Rate (%) +8.5%
2.48
2.5924k
38k
46k 7k10k
1k 4k-6k-9k
+3%
+13%
+6%
-2% +7% +6% -19% +5% +6%
Ma
y'1
6
Ch
ina
(29%
)
Ea
stA
sia
(Excl.C
hin
a)
(13%
)
AS
EA
N (
30%
)
Eu
rop
e (
12
%)
Am
eri
ca
s (
4%
)
So
uth
Asia
(6%
)
Mid
dle
East
(2%
)
Afr
ica (
1%
)
Oc
ea
nia
(3
%)
Ma
y'1
7May'16
Million
Million
May'17
Ch
ina
(2
9%
)
Source: Department of Tourism, BOT, and TMB Analytics
Good Momentum And Right On Target Chinese Returned To Growth Zone After Crackdown
May 2017, number of tourists were 2.59 million, raised up almost 5%yoy and inbound tourism revenue generated
125 billion, increased 6.9%yoy. These attributed mainly from the resumption of Chinese and coincided with
growing in East Asia and ASEAN arrivals.
During first five month, tourist arrivals were recorded at 14.6 million, grew by 3.2% and the accumulation of
receipts at 747 billion baht also indicated strong growth by 5.1% compared to the same period last year.
Occupancy rate higher than May’16 by 8.5%, emphasized the improvement of recovery sign in tourism sector.
*Note:± x % represents the growth of tourist arrival (yoy)( %) represents the share of tourist arrivals
Chinese rebounded … Bringing smile back to Thailand
+5%
-26-
Number of Tourists (Mill people)
2.482.59

27
0.5 0.8
-0.3
7.2
3.83.4
13.2
10.5
2.7
Value Volume Price
2016 YTD May-17
Trade Balance
+944 mn USD
Export Import
-3.7
-1.1-2.6
15.2
5.46.9
18.2
13.8
4.4
Value Volume Price
2016 YTD May-17
May Export 2017
May export was 19.94 bn USD, expanding by 13.2% from the same period last year and the highest in 52 months. Therefore, the first five months grew by 7.2%.
The strong growth mainly came from an increase in volume, while price effect was starting to dissipate.
May Import 2017
May import value was 19.0 bn USD grew by 18.2% from the same period last year.
Products with highest import growth
Electronic/Computer & Parts (+16.1%)
Chemical (+27.3%)
Energy Product (+18.9%)
Steel & Metal Producer (+16.9%)
Machinery Trader (+16.8%)
Vehicle (+12.9%)
A Surge in Export and Continuing Rise in Import Growth Driven by Strong Global
Demand
Source: MOC, and TMB Analytics-27-

28
Export Growth was More Diversified Both at Products and Markets Level
Key productsOutlook Major exporting market
Industrial
Consumption & Agriculture
%YTD Share
Vehicle 17.6
Electronic Home 7.2
Food 5.8
Agro 4.1
YTD Apr May
13.2 19.2
1.2 24.6
1.17.3
7.5 27.8
Electronic Com 17.4
Machinery Trader 6.2
2.818.5
0.212.2
• Auto Parts( 9.7%),Commercial
vehicles( 24.9%), Passenger car (0.4%)
• Consumer Electronics(20.5%)
• Seafood(6.2%),Chicken (20.7%)
• Vegetable & Fruits(45%), Sugar(45%)
• Electronics Parts (26.3%), Consumer Electronics (45.3%), HDD (20.6%)
• Industrial Machinery(13.4%)
• Australia (21%), EU25 (8%), Middle East (7%)
• USA (35%), Japan (17%), EU25 (9%)
• Japan (34%), EU25(17%), USA (14%)
• CLMV (25%), ASEAN5(21%), CHINA (12%)
• USA (18%), EU25 (15%), China (15%)
• EU25 (18%), USA (17%), JAPAN (15%)
May Growth (%) % YTD Share
8.3%
16.3%
7.3%
20.3%
3.2% 3.4%
-1.6%
-7.0%
12.8% 13.0% 14.3%
26.8% 25.2%
8.8%12.8% 11.7%
-15%
-5%
5%
15%
25%
35%
WORLD ASEAN5 CLMV CHINA JAPAN USA EU25 MIDDLE EAST
YTD April May
Thai Export to Major Markets
Source: MOC, and TMB Analytics -28-

CLMV
(2016 -0.2)
+6.5
Rubber
+38.5(2016 -3.8)
-29-Source: MOC CEIC and TMB Analytics
What is 2017 outlook for Thai Export?
Total
(2016 +0.5)
+3.7
ASEAN5
(2016 -1.4)
+2.2
Japan
(2016 +2.4)
+2.8
China
(2016 -0.8)
+9.3
USA
(2016 +1.7)
+3.5
EU
(2016 +0.5)
+2.4
Able to grow from
global demand
recovery despite higher
uncertainty from
political and geopolitical risk
Strong
consumption demand
Oil price
recovery helps
raw mat and commodities
Recovered
investment in Asia
help supply chain with Japan
Continual
economic recovery
Protectionism
unlikely to take
full effect this year
Thai Export: Recovery … Not A Significant Boost
Computer&Parts
+6.3(2016 -2.0)
Beverages
+0.5(2016 +5.8)
Electrical appliances
+5.4(2016 -1.3)
Rising demand
for tire mfg from
China and price increase
Drop comes
mainly from
middle east market
Global economic recovery and increase in
oil price which is expected to be 57 dollar per barrel at the end of 2017
Energy drink
market growth
contributes to overall growth
Market
Product
High
economic growth
Vehicles
-0.9(2016 +4.6)
Chemical
+8.3(2016 -7.5)

-30-
MPI increased +1.4%yoy, Because of Export Market Recovery
85.5
80
85
90
95
100
105
Jan-14 Jan-15 Jan-16 Jan-17
Diffu
sio
n In
de
x
BA
DG
OO
D
May 2017, MPI unexpectedly rose +1.4%yoy, thanks to higher
production of food, electronic, vehicle and part as export market
recovery.
Positive Growth: food, electronic part, vehicle & part, petroleum
Negative Growth: beverages, construction material, fashion
product
Manufacturing Product Index (MPI)
Negative gr.( MPI < 0%)
Low gr.( 0%<MPI < 3%)
Moderate gr.(3% <MPI<5%)
High gr.(MPI > 5%)
Source: OIE, BOT, FTI, classified industry group and calculated by TMB Analytics
-60
-40
-20
0
20
40
60
80
Jan-14 Jan-15 Jan-16 Jan-17
%Y
oY
Fuel Industry
Industry Indicator
II.Industrial Confidence
I.Raw Materials Import2016 May-17
Q4 Q1 Apr May (%MoM,sa)
Capacity Utilization Rate (%) 100.0 60.0 59.5 62.6 53.7 62.1 0.6
Manufacturing Product Index (MPI) (%YoY) 100.0 1.6 0.3 -1.5 -1.8 1.4 2.3
Food 15.3 2.7 2.8 5.1 1.5 8.2 0.1
Vehicle 11.8 2.2 -4.8 -7.3 -10.7 3.3 12.9
Electronic/Computer & Parts 11.2 2.7 13.9 7.0 8.2 9.1 -0.2
Autopart 9.8 -1.0 -3.2 0.2 0.5 3.4 3.3
Fashion Products 9.8 -2.8 -5.4 -10.3 -7.0 -4.0 3.5
Steel Products 5.9 5.3 8.8 -11.0 -5.4 -14.1 -13.1
Rubber Products 5.8 -0.7 -2.6 7.8 2.3 8.1 2.0
Construction Material 5.6 -0.9 -1.2 -5.0 -0.2 -6.1 -6.0
Electronic/Electric Home Appliance 4.3 15.1 -2.6 -2.5 0.5 -1.4 6.8
Beverage 4.0 -0.2 -1.7 -3.6 -5.5 -11.7 -2.7
Petroleum 3.3 2.4 -0.2 7.1 2.7 7.1 2.7
Plastics Products 3.1 4.2 -2.6 -3.8 -4.8 3.2 4.7
Papers & Printing 2.7 5.2 -1.2 0.1 0.8 -0.4 -2.5
Furniture and Household Products 1.8 -17.3 -2.0 -5.3 -15.9 4.2 8.5
Chemical 1.6 0.5 -1.5 1.5 -4.5 6.3 6.2
Healthcare 1.3 -1.2 13.4 1.9 2.4 4.0 0.7
Consumer Goods 1.3 1.1 -5.0 -10.1 -7.7 -6.8 4.7
Tabacco 1.1 -9.2 -5.0 -10.5 -15.0 -0.3 10.7
Agri.Machinery 0.1 5.8 -14.9 -0.6 -26.9 12.8 40.6
(%)
Weight2016
2017

-31-
90
100
110
120
Jan-14 Jul-14 Jan-15 Jul-15 Jan-16 Jul-16 Jan-17
MP
I (B
AS
E =
20
11
, S
A)
Export market (export > 60%)
Both market (30% < export < 60%)
Domestic market (export < 30%)
Growth +8.2%
100
103
105
108
110
113
Jan
-16
Jul-
16
Jan
-17
MP
I (B
ase
= 2
01
1, S
A)
Highlight of Manufacturing Production Index (May 2017)
MPI by Export Share
FoodSeafood, Sugar, Cooking oil,
flour products
High Growth High Decline
Source: OIE, BOT, FTI and TMB Analytics Note: Growth as of May-17
Growth+9.1%
Electronic HDD, Monolithic IC, Transistors
90
95
100
105
110
115
120
Jan
-16
Jul-
16
Jan
-17
MP
I (B
ase
= 2
01
1, S
A)
Growth-11.7%
BeverageLiquor, Soda, Water
110
115
120
125
130
135
140
Jan
-16
Jul-
16
Jan
-17
MP
I (B
ase
= 2
01
1, S
A)
Growth-6.1%
Con. Mat.Cement, Concrete, Ceramic
88
91
93
96
98
101
103
Jan
-16
Jul-
16
Jan
-17
MP
I (B
ase
= 2
01
1, S
A)
+Export growth

Expect Rate Normalization in 2018 and 1.50% Policy Rate in 2017
Source: MOC, CEIC and TMB Analytics
Headline Inflation Stands above Zero for 2 Consecutive Months
Policy Rate is Expected to be Held at 1.50% as Inflation Remains Low
2 Consecutive Months of Negative Inflation from Last Year’s High Base
May inflation rate turned negative at
-0.05% due to high base effect from last
year drought, while energy price continued
to increase as global energy price rose.
We expect inflation rate to turn positive
again in latter half of the year and
averaged at 1% in 2017 from increase in
energy price.
-32-
-2
-1
0
1
2
3
14Q1 14Q3 15Q1 15Q3 16Q1 16Q3 17Q1
%yoy
June 2017 = -0.04%
Avg 2016 = 0.2%
Policy rate is expected to be maintained at 1.50%
throughout 2017 to accommodate economic
recovery especially private investment. Moreover,
inflationary pressure remained low.
We expect the rate normalization to begin in 2018
as global interest rate is on an upward trend
following 3 expected fed rate hikes in 2017.
However, there is still concern over recovery of
private investment, which can delay Thai rate
normalization.0
1
2
3
4
5
15Q1 15Q3 16Q1 16Q3 17Q1 17Q3 18Q1 18Q3
%

THANK YOU
Disclaimer
This document is issued by TMB Analytics, a division of TMB Bank PCL. All analyses are based on information available to
the public. Although the information contained herein is believed to be gathered from reliable sources, TMB makes no
guarantee to its accuracy and completeness. TMB may have issued, and may in the future issue, other reports that are
inconsistent with, and reach different conclusions from, the information presented in this report. Opinions or predictions
expressed herein reflect the authors’ views, not that of TMB, as of date of the analysis and are subject to change without
notice. TMB shall not be responsible for the use of contents and its implication.


![Monthly Economic Reviewbsl.gov.sl/MER October 2019- Finalised Version.pdf · Monthly Economic Review October 2019 Publisher: The Monthly Economic Review [MER] is published by the](https://img.dokumen.tips/doc/110x75/5eddde83ad6a402d66691757/monthly-economic-october-2019-finalised-versionpdf-monthly-economic-review-october.jpg)


![Monthly Economic Reviewbsl.gov.sl/MER February 2020- Final.pdf · Monthly Economic Review February 2020 Publisher: The Monthly Economic Review [MER] is published by the Research Department,](https://img.dokumen.tips/doc/110x75/5fba3d20bddd3601b021cd66/monthly-economic-february-2020-finalpdf-monthly-economic-review-february-2020.jpg)