Embed Size (px)
Citation preview

Monthly Agricultural Review
1
AGRICULTURAL TRADING HIGHLIGHTS December 2016
Average daily volume for December 2016 Grain and Oilseed futures was 751,754 contracts, compared with 746,372 during December 2015, an increase of 10.02 percent.
Average daily volume for December 2016 Grain and Oilseed options was 137,646 contracts, compared with 151,706 during December 2015, a decrease of 9.27 percent.
Average daily volume for December 2016 Oilseed complex futures was 454,767 contracts, compared with 454,492 during December 2015, an increase of 0.06 percent.
Average daily volume for December 2016 Oilseed complex options was 65,021 contracts, compared with 87,131 during December 2015, a decrease of 25.38 percent.
Electronic average daily volume for December 2016 Grain and Oilseed options was 94,824 contracts, compared with 103,928 during December 2015, a decrease of 8.76 percent.
Average daily volume for December 2016 Live Cattle, Lean Hog and Feeder Cattle futures and options was 111,736 contracts, compared with 111,127 during December 2015, an increase of 0.55 percent.
Electronic average daily volume for December 2016 Live Cattle and Lean Hog options was 17,359 contracts, compared with 21,417 during December 2015, a decrease of 18.95 percent.

www.cmegroup.com
2
December 2016
Contracts
$ Notional
($ Millions) Contracts
$ Notional
($ Millions)
Spot Month
Close on
30-Dec-'16
Spot Month
Close in
US$/MT
30-Dec-'16
20-Day
Historical
Volatility
Corn Futures ZC C 189,687 $3,338 1,237,798 $21,785 352 $138.58 21.71%
Mini Futures XC YC 408 $1 8,681 $31
Total Futures 190,095 $3,340 1,246,479 $21,816
Options OZC CY/PY 50,014 830,720
Wheat Futures ZW W 75,149 $1,533 450,980 $9,200 408 $149.91 23.74%
Mini Futures XW YW 203 $1 1,778 $7
Total Futures 75,352 $1,534 452,758 $9,207
Options OZW WY/WZ 21,590 309,623
KC HRW Wheat Futures KE KW 29,808 $624 238,536 $4,991 418 1/2 $153.77 20.98%
Options OKE H 934 31,385
Soybeans Futures ZS S 232,934 $11,693 630,756 $31,664 1004 $368.91 18.55%
Mini Futures XK YK 1,015 $10 15,190 $153
Total Futures 233,949 $11,703 645,946 $31,816
Options OZS CZ/PZ 50,763 411,431
Soybean Oil Futures ZL BO 123,802 $2,575 370,720 $7,709 34.66 $764.12 16.54%
Options OZL OY/OZ 7,826 99,657
Soybean Meal Futures ZM SM 98,031 $3,104 325,056 $10,291 316.60 $348.99 20.59%
Options OZM MY/MZ 6,432 109,093
Rough Rice Futures ZR RR 1,683 $32 11,521 $221 9.610 $211.86 20.55%
Options OZR RRC/RRP 28 1,089
Oats Futures ZO O 480 $5 6,492 $74 228 1/2 $132.57 26.50%
Options OZO OO/OV 59 3,528
Live Cattle Futures LE LC 50,984 $2,367 308,053 $14,300 116.050 15.23%
Options LE CK/PK 11,608 196,134
Lean Hog Futures HE LH 39,706 $1,051 197,430 $5,224 66.150 32.48%
Options HE CH/PH 9,437 146,909
Feeder Cattle Futures GF FC 39,706 $2,484 45,210 $2,828 125.100 15.36%
Options GF KF/JF 9,437 34,302
Class III Milk Futures DC DA 1,793 $61 34,904 $1,183 16.950 20.88%
Options DC DA 2,566 92,370
Scorecard - Average Daily Volume and Open Interest Statistics
Average Daily Volume Open Interest
Ticker Symbols
Electronic - Pit

Monthly Agricultural Review
3
0
200,000
400,000
600,000
800,000
1,000,000
1,200,000
1,400,000
1,600,000
1,800,000
2,000,000
Co
ntr
ac
tsGrain and Oilseed Combined Futures and Options - Average Daily Volume
Futures Options
0
100,000
200,000
300,000
400,000
500,000
600,000
700,000
800,000
900,000
Co
ntr
acts
Corn, Wheat, KC HRW Wheat Futures - Average Daily Volume
Corn Wheat KC HRW Wheat

www.cmegroup.com
4
0
100,000
200,000
300,000
400,000
500,000
600,000
700,000
800,000
Co
ntr
acts
Soybean Complex Futures - Average Daily Volume
Soybeans Soybean Meal Soybean Oil
0
1,000
2,000
3,000
4,000
5,000
6,000
7,000
8,000
Co
ntr
acts
Oats and Rice Futures - Average Daily Volume
Oats Rough Rice
Monthly Agricultural Review
5
0
1,000
2,000
3,000
4,000
5,000
6,000
Co
ntr
acts
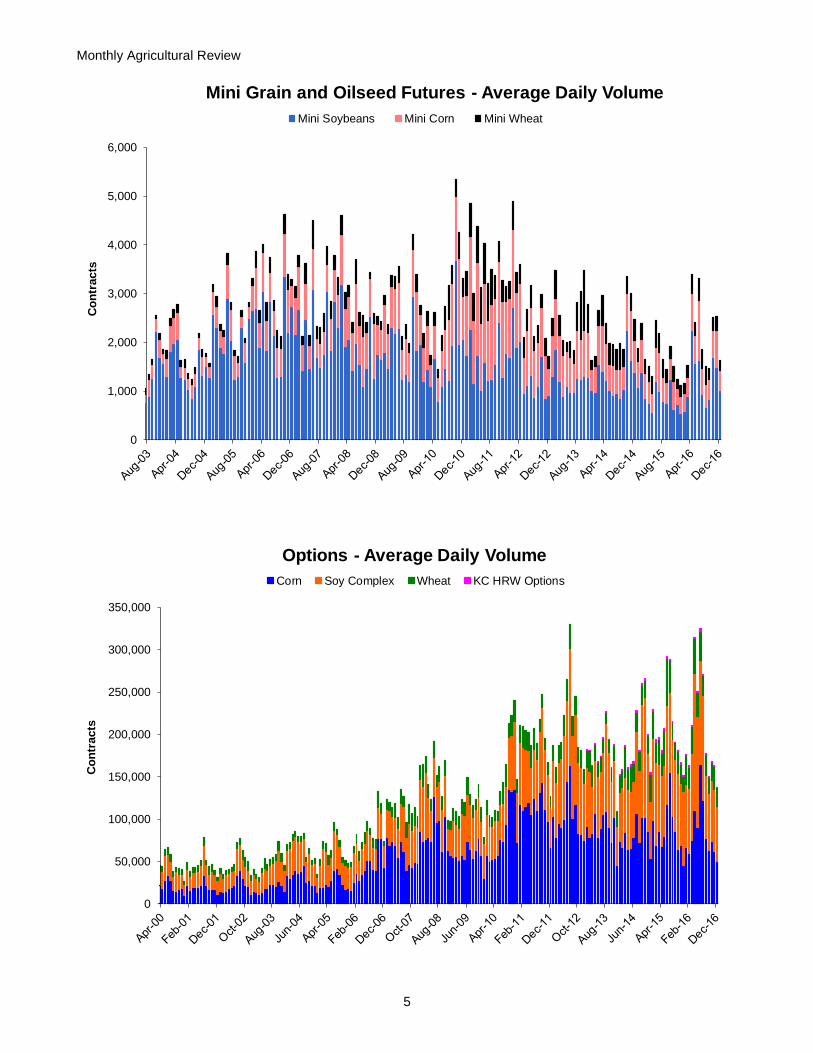
Mini Grain and Oilseed Futures - Average Daily Volume
Mini Soybeans Mini Corn Mini Wheat
0
50,000
100,000
150,000
200,000
250,000
300,000
350,000
Co
ntr
acts
Options - Average Daily Volume
Corn Soy Complex Wheat KC HRW Options

www.cmegroup.com
6
0
20,000
40,000
60,000
80,000
100,000
120,000
140,000
160,000
Co
ntr
acts
Live Cattle, Lean Hog, Feeder Cattle Futures - Average Daily Volume
Live Cattle Lean Hogs Feeder Cattle
0
5,000
10,000
15,000
20,000
25,000
30,000
35,000
40,000
45,000
Co
ntr
acts
Live Cattle, Lean Hog, Feeder Cattle Options - Average Daily Volume
Live Cattle Lean Hogs Feeder Cattle

Monthly Agricultural Review
7
0%
10%
20%
30%
40%
50%
60%
70%
80%
90%
100%
0
20,000
40,000
60,000
80,000
100,000
120,000
Co
ntr
acts
Corn and Wheat Electronic Options - Average Daily Volume
Corn Electronic ADV Wheat Electronic ADV
Corn % Electronic ADV Wheat % Electronic ADV
0%
10%
20%
30%
40%
50%
60%
70%
80%
90%
0
20,000
40,000
60,000
80,000
100,000
120,000
Co
ntr
acts
Soybean Complex Electronic Options - Average Daily Volume
Soybean Electronic ADV Soybean Meal Electronic ADV
Soybean Oil Electronic ADV Soybean Meal % Electronic ADV
Soybean % Electronic ADV Soybean Oil % Electronic ADV

www.cmegroup.com
8
0%
10%
20%
30%
40%
50%
60%
70%
80%
90%
100%
0
5,000
10,000
15,000
20,000
25,000
Co
ntr
acts
Live Cattle and Lean Hog Electronic Options - Average Daily Volume
Live Cattle Electronic ADV Lean Hog Electronic ADV
Lean Hog % Electronic ADV Live Cattle % Electronic ADV
Butterfly5%
Condor1%
Conversion/ Reversal20%
Diagonal2%
General Spread4%
Horizontal Option2%
Horizontal Straddle5%
Risk reversal3%
Straddle15%
Strangle7%
Vertical34%
Electronic Grain and Oilseeds Options Spreads Percentages (1%+ marked) - December 2016

Monthly Agricultural Review
9
Butterfly4%
Conversion/ Reversal12%
Diagonal2%
General Spread5%
Horizontal Option1%
Horizontal Straddle1%
Risk reversal17%
Straddle3%
Strangle1%
Vertical54%
Electronic Livestock Options Spreads Percentages (1%+ marked) - December 2016
0%
10%
20%
30%
40%
50%
60%
70%
80%
90%
Corn, Wheat, KC HRW Wheat Monthly Historical Volatility - Spot Month
Wheat Corn KC HRW Wheat

www.cmegroup.com
10
0%
10%
20%
30%
40%
50%
60%
70%
Soybeans Complex Monthly Historical Volatility - Spot Month
Soybeans Soybean Meal Soybean Oil
0%
10%
20%
30%
40%
50%
60%
70%
80%
Rough Rice and Oats Monthly Historical Volatility - Spot Month
Rough Rice Oats

Monthly Agricultural Review
11
0%
10%
20%
30%
40%
50%
60%
70%
Live Cattle, Lean Hog, Feeder Cattle Monthly Historical Volatility - Spot Month
Live Cattle Lean Hog Feeder Cattle
0%
10%
20%
30%
40%
50%
60%
250
275
300
325
350
375
400
VolatilitySettlement Price (¢/Bu)
Corn Futures - Spot Month, 20 Day Historical Volatility and Implied Volatility
Settlement Price Historical Volatility Implied Volatility

www.cmegroup.com
12
10%
20%
30%
40%
50%
60%
70%
600
700
800
900
1000
1100
1200
VolatilitySettlement Price (¢/Bu)
Soybean Futures - Spot Month, 20 Day Historical Volatility and Implied Volatility
Settlement Price Historical Volatility Implied Volatility
0%
10%
20%
30%
40%
50%
60%
70%
80%
90%
100%
300
320
340
360
380
400
420
440
460
480
500
VolatilitySettlement Price (¢/Bu)
Wheat Futures - Spot Month, 20 Day Historical Volatility and Implied Volatility
Settlement Price Historical Volatility Implied Volatility

Monthly Agricultural Review
13
0
20,000
40,000
60,000
80,000
100,000
120,000
140,000
160,000
180,000
Co
ntr
acts
Chicago Time
Average Hourly Volumes - All Hours - December 2016
Lean Hog Futures
Live Cattle Futures
Soybean Oil Futures
Soybean Meal Futures
Soybean Futures
Wheat Futures
Corn Futures
0
5,000
10,000
15,000
20,000
25,000
Co
ntr
acts
Chicago Time
Average Hourly Volumes - Extended Trading Hours - December 2016
Lean Hog Futures Live Cattle Futures
Soybean Oil Futures Soybean Meal Futures
Soybean Futures Wheat Futures
Corn Futures

www.cmegroup.com
14
0%
5%
10%
15%
20%
25%
30%
35%
40%
0
100,000
200,000
300,000
400,000
500,000
600,000
700,000
800,000
900,000
Op
en
In
tere
st
-C
on
tracts
CFTC COT Report - Corn Futures Open Positions - Long
Swap Dealers Long Managed Money Long
% Swap Dealers Long % Managed Money Long
Source: CFTC
0%
10%
20%
30%
40%
50%
60%
0
50,000
100,000
150,000
200,000
250,000
300,000
350,000
Op
en
In
tere
st
-C
on
tracts
CFTC COT Report - Wheat Futures Open Positions - Long
Swap Dealers Long Managed Money Long
% Swap Dealers Long % Managed Money Long
Source: CFTC

Monthly Agricultural Review
15
0%
5%
10%
15%
20%
25%
30%
35%
40%
0
20,000
40,000
60,000
80,000
100,000
120,000
Op
en
In
tere
st
-C
on
tracts
CFTC COT Report - KC HRW Wheat Futures Open Positions - Long
Swap Dealers Long Managed Money Long
% Swap Dealers Long % Managed Money Long
Source: CFTC
0%
5%
10%
15%
20%
25%
30%
35%
40%
0
50,000
100,000
150,000
200,000
250,000
300,000
350,000
400,000
Op
en
In
tere
st
-C
on
tracts
CFTC COT Report - Soybean Futures Open Positions - Long
Swap Dealers Long Managed Money Long
% Swap Dealers Long % Managed Money Long
Source: CFTC

www.cmegroup.com
16
0%
5%
10%
15%
20%
25%
30%
35%
40%
45%
0
20,000
40,000
60,000
80,000
100,000
120,000
140,000
160,000
Op
en
In
tere
st
-C
on
tracts
CFTC COT Report - Soybean Meal Futures Open Positions - Long
Swap Dealers Long Managed Money Long
% Swap Dealers Long % Managed Money Long
Source: CFTC
0%
5%
10%
15%
20%
25%
30%
35%
40%
0
50,000
100,000
150,000
200,000
250,000
Op
en
In
tere
st
-C
on
tracts
CFTC COT Report - Soybean Oil Futures Open Positions - Long
Swap Dealers Long Managed Money Long
% Swap Dealers Long % Managed Money Long
Source: CFTC

Monthly Agricultural Review
17
0%
5%
10%
15%
20%
25%
30%
35%
40%
45%
0
50,000
100,000
150,000
200,000
250,000
300,000
Op
en
In
tere
st
-C
on
tracts
CFTC COT Report - Live Cattle Futures Open Positions - Long
Swap Dealers Long Managed Money Long
% Swap Dealers Long % Managed Money Long
Source: CFTC
0%
5%
10%
15%
20%
25%
30%
35%
40%
45%
0
20,000
40,000
60,000
80,000
100,000
120,000
140,000
160,000
180,000
200,000
Op
en
In
tere
st
-C
on
tracts
CFTC COT Report - Lean Hog Futures Open Positions - Long
Swap Dealers Long Managed Money Long
% Swap Dealers Long % Managed Money Long
Source: CFTC

CME Group® is a registered trademark of Chicago Mercantile Exchange Inc. The Globe logo, CME, Chicago Mercantile Exchange, Globex, CME Direct and CME Direct Messenger are trademarks of Chicago Mercantile Exchange Inc. Chicago Board of Trade is a trademark of the Board of Trade of the City of Chicago, Inc. NYMEX is a trademark of the New York Mercantile Exchange, Inc. “S&P®” and “S&P 500®” are trademarks of The McGraw-Hill Companies, Inc. These products are not sponsored, sold or endorsed by S&P, a division of The McGraw-Hill Companies, Inc., and S&P makes no representation regarding the advisability of investing in them. All other trademarks are the property of their respective owners. NASDAQ-100 is a trademark of The Nasdaq Stock Market, used under license.
Russell 1000® is a trademark and service mark of the Frank Russell Company, used under license.
All rights in the FTSE 100 Index, FTSE 100 U.S. Index, FTSE China 50 Index, FTSE Developed Europe Index and the FTSE Emerging Markets Index (the “Index”) vest in FTSE International Limited (“FTSE”). “FTSE®” is a trade mark of the London Stock Exchange Group companies and is used by FTSE under licence.
E-mini FTSE 100 Index futures, E-mini USD-Denominated FTSE 100 Index Futures, E-mini FTSE China 50 Index Futures E-mini FTSE Developed Europe Index Futures and E-mini FTSE Emerging Markets Index Futures(the “Product”) have been developed solely by Chicago Mercantile Exchange Inc. (“CME”). The Index is calculated by FTSE or its agent. FTSE and its licensors are not connected to and do not sponsor, advise, recommend, endorse or promote the Product and do not accept any liability whatsoever to any person arising out of (a) the use of, reliance on or any error in the Index or (b) investment in or operation of the Product. FTSE makes no claim, prediction, warranty or representation either as to the results to be obtained from the Product or the suitability of the Index for the purpose to which it is being put by CME.
Futures trading is not suitable for all investors, and involves the risk of loss. Futures are a leveraged investment, and because only a percentage of a contract’s value is required to trade, it is possible to lose more than the amount of money deposited for a futures position. Therefore, traders should only use funds that they can afford to lose without affecting their lifestyles. And only a portion of those funds should be devoted to any one trade because they cannot expect to profi t on every trade. All examples in this brochure are hypothetical situations, used for explanation purposes only, and should not be considered investment advice or the results of actual market experience.
The information within this brochure has been compiled by CME Group for general purposes only and has not taken into account the specifi c situations of any recipients of this brochure. CME Group assumes no responsibility for any errors or omissions. All matters pertaining to rules and specifi cations herein are made subject to and are superseded by offi cial CME, NYMEX and CBOT rules. Current CME/CBOT/NYMEX rules should be consulted in all cases before taking any action.
© 2016 CME Group Inc. All rights reserved. PM1833/00/0916
CME GROUP GLOBAL OFFICESCME GROUP HEADQUARTERS
20 South Wacker DriveChicago, Illinois 60606cmegroup.com
Chicago +1 312 930 1000
Singapore+65 6593 5555
Houston+1 713 658 9292
Tokyo+81 3 3242 6228
New York+1 212 299 2000
Calgary+1 403 444 6876
São Paulo+55 11 2787 6451
Washington D.C.+1 202 638 3838
London+44 20 3379 3700
Hong Kong+852 2582 2200
Seoul+82 2 6336 6722