Embed Size (px)
Citation preview

Department of Radiation Physics, Lund University Hospital, Lund, Sweden
Master of Science Thesis
Monte Carlo simulations of the Elekta SLi Plus electron applicator system – A base
for a new applicator design to reduce radiation leakage
Marie-Louise Olsson
Supervisor: Peter Björk
LUJI-RADFYS-EX-3/2003

2
Abstract In this report the characteristics of the electron applicator system for an Elekta SLi Plus linear accelerator have been studied. The investigation will serve as a basis for a new applicator design that will give less radiation leakage. The present applicator system does not fully comply with the recommendations of the International Electrotechnical Commission (IEC) Standards recording radiation leakage. By a careful study of the different dose contribution components it was found that a simple modification of the applicator geometry could decrease the leakage dose to within the IEC recommendations. In purpose to limit the work, only the case of a 10×10 cm2 applicator and a nominal energy of 20 MeV was fully investigated. The 10×10 cm2 applicator is very common for patient treatments, and it is well known that the highest energy (20 MeV) gives the highest leakage dose. The Monte Carlo code BEAMnrc (2002 version) has been used to study the applicator system. Monte Carlo calculated dose distributions were found to be in good agreement with measurements verifying that the Monte Carlo method can be used for optimization of the applicator design. By using the LATCH feature of the Monte Carlo code, a history can be tracked. In that way, contribution from different system components of the total energy fluence or the total absorbed dose profile could be determined. It was found that most of the dose outside the applicator is deposited by particles that have interacted in the applicator itself. Furthermore, in this area the dose contribution from photons is almost equal to the contribution from electrons. It can also be concluded that it is the third level of the applicator that gives the highest bremsstrahlung contribution. A small modification has been done on the 10×10 cm2 applicator to reduce the radiation leakage. The modification includes a change of the order of the Pb-layer and the Al-layer in the third scarper level of the applicator. An evaluation according to the IEC protocol shows that the modified applicator reduces the maximum absorbed dose outside the applicator edge from about 5% to 2% relative to the maximum dose at the central axis. Also the average absorbed dose was reduced from about 1.8% to 0.6%, which is below the IEC recommended value of 1.3%.

3
1. INTRODUCTION............................................................................................................ 4
2. METHODS AND MATERIALS..................................................................................... 6 2.1. THE ACCELERATOR AND THE ELECTRON APPLICATOR ................................................. 6 2.2. A GENERAL DESCRIPTION OF THE MONTE CARLO METHOD ......................................... 7 2.3. SPECIFIC MONTE CARLO CALCULATIONS PERFORMED IN THIS STUDY......................... 8 2.4. MEASUREMENTS AND THE INTERNATIONAL ELECTROTECHNICAL COMMISSION (IEC) STANDARDS. ......................................................................................................................... 11
3. RESULTS........................................................................................................................ 12 3.1. ENERGY FLUENCE INVESTIGATION FOR THE STANDARD APPLICATOR. ....................... 12 3.2. DOSE PROFILE INVESTIGATION FOR THE STANDARD APPLICATOR. ............................. 16 3.3. ENERGY FLUENCES FOR THE MODIFIED APPLICATOR COMPARED TO THE STANDARD APPLICATOR. ......................................................................................................................... 19 3.4. DOSE PROFILES FOR THE MODIFIED APPLICATOR COMPARED TO THE STANDARD APPLICATOR. ......................................................................................................................... 21 3.5. COMPARISON WITH MEASUREMENTS AND THE INTERNATIONAL ELECTROTECHNICAL COMMISSION (IEC) STANDARDS. .......................................................................................... 25
4. DISCUSSION AND CONCLUSIONS ......................................................................... 26
5. REFERENCES............................................................................................................... 28
APPENDIX 1. ......................................................................................................................... 31
APPENDIX 2. ......................................................................................................................... 36
APPENDIX 3. ......................................................................................................................... 38
APPENDIX 4. ......................................................................................................................... 41
6. SUMMARY IN SWEDISH ........................................................................................... 43

4
1. Introduction Linear accelerators are used to provide beams of electrons as well as photons. Conventionally electron beams are used to treat superficial seated tumors, while photon beams are used to treat deep seated tumors. In electron-beam mode, a well defined electron beam passing through the thin window of the accelerator vacuum system is transported through a scattering foil system in order to broaden the beam. Electrons undergo significant scattering in the air between the scattering foils and the patient. It is therefore necessary to collimate the beam with an applicator attached to the accelerator treatment head. (See Figure 1).
Figure 1. Absorbed dose profiles with and without an electron applicator for an Elekta SLi Plus machine. The applicator size is 10×10 cm2 and the nominal energy is 20 MeV. The measurements were performed with a diode detector at 1 cm depth in a water phantom. SSD= 100 cm. Nowadays most accelerators are equipped with a dual scattering-foil system and the electron applicator is mainly used to limit the field size. Older machines that were used in the mid 80:ies only used a single foil to scatter the beam. In that time the purpose of the electron applicator was not only to limit the field size but also to provide a good flatness of the dose profile. This was achieved by using applicators with covered walls, often made of steel, which increased the scatter contribution near the field edges. The aim of the design of an applicator for high energy electron beams for radiotherapy is to obtain uniform beams with well defined energies. The amount of scattered electrons should be as low as possible. In that way the depth dose curve will have a high dose gradient and the therapeutic depth will be larger. The applicator should also shape the beam according to the tumor size and protect surrounding healthy tissues. When the beam leaves the treatment head it is broad and nearly parallel and contains only a small amount of low energy electrons. The necessary collimation of the beam will, however, decrease its quality. When an applicator is attached to the treatment head, we get more material in the radiation field and this results in increased scattering contribution (increased number of scattered electrons and increased bremsstrahlung production).
0
20
40
60
80
100
120
-15 -10 -5 0 5 10 15Off-axis position (cm)
Rel
ativ
e ab
sorb
ed d
ose
(%)
with applicatorwithout applicator

5
An important issue, which the manufactures are concerned about, is the radiation leakage outside the applicator. The present applicator system for Elekta accelerators do not fully conform to the International Electrotechnical Commission Standards (IEC 1998) regards leakage. One objective for a re-design of the applicator system would be to decrease the leakage but maintain or even improve characteristics such as flatness, uniformity, penumbra width and therapeutic depth for the electron beam. Some earlier studies have been made on leakage from electron applicators on medical accelerators (Pennington et al 1988, Keys and Purdy 1984). They evaluated applicator systems that were used in the mid 80:ies. These two investigations were based on measuring the leakage and scatter radiation around the applicator. They found that the leakage radiation, relative to the central axis dose was 7% in the patient plane (i.e., the surface perpendicular to the collimator rotation axis at the isocenter of the accelerator, SSD= 100 cm) and up to 39% at the applicator body surface(the side of each applicator). To reduce the magnitude of the radiation leakage they reduced the photon collimator setting or added lead at selected locations on the applicator surface. There are also some investigations based on Monte Carlo simulations (Kassaee et al 1994, Ebert and Hoban 1995, Northey and Zavgorodni 2002). The Monte Carlo method is a powerful tool to investigate different electron applicator systems and for optimization of new applicators. Monte Carlo simulation of radiation transport is considered to be the most accurate methods of radiation therapy dose calculations. Kassaee et al (1994) investigated the influence of cone design on the electron beam characteristics on clinical accelerators. Measurements were compared with calculated 3-D dose distributions obtained from Monte Carlo-derived energy deposition kernels. They showed that beam-defining cones can be fabricated to eliminate low-energy scattered electrons from the cone housing. Ebert and Hoban (1995) made a model for electron-beam applicator scatter. The model involved sampling established kernels of scatter from edge elements of appropriate materials, which were obtained through Monte Carlo simulations. The result of the model was a phase space (position, direction, energy, charge, weighting) of applicator scattered particles. The phase space can further be incorporated into Monte Carlo simulations. The results gave information on the angular and spatial variation characteristics of this beam component. Northey and Zavgorodni (2002) optimized the design of an electron applicator. They reported on a cylindrical steel-walled electron applicator for a Siemens KD2 Mevatron accelerator producing circular fields with 2-8 cm diameter. The seven and the eight centimeter diameter cones did not fully comply with to the IEC Standard. The maximum dose inside the field relative to the depth-dose maximum on the central axis exceeded 126% while IEC recommends 109%. They made a plastic insert along the internal wall of the applicator with optimized dimensions. It improved the “maximum ratio of absorbed dose” from 126% before modification to 108% with the plastic insert. In this paper we have used Monte Carlo simulations to evaluate the current electron applicator system on an Elekta SLi plus accelerator. Measured dose distributions were compared with calculations to verify the Monte Carlo code. The origin of different dose components to the total dose have been analyzed. Finally a small modification on the electron applicator is proposed which will reduce the radiation leakage.

6
2. Methods and Materials 2.1. The accelerator and the electron applicator The Elekta SLi Plus accelerator can deliver therapeutic electron as well as photon beams. The accelerator is equipped with a dual scattering foil system for nine electron energies (4, 6, 8, 10, 12, 15, 18, 20 and 22 MeV). The accelerator is equipped with a multi-leaf collimator and an achromatic bending magnet system. The magnet is an asymmetric 112.5° three sector uniform pole gap “slalom” magnet. This system would not sharply define the energy of the initial electron beam, hence we approximate it with a Gaussian distribution in the forthcoming simulations. The initial energy spectrum is symmetric and its full width at half maximum FWHM is less than approximately 10% of the energy (Deasy 1996, Kok 1999). The electron applicator which was used in the optimizations has a field size of 10×10 cm2 at SSD= 95 cm. A schematic figure of the electron applicator is shown in Fig. 2.
Figure 2. Schematic figure of the applicator. The material of each scraper layer is indicated as well as the LATCH numbers used in the Monte Carlo simulations. This applicator is constructed of four scrapers. The first scraper consists of aluminum, the second of aluminum and lead, the third of lead and aluminum and the last of aluminum and lead. We know from measurements that the radiation leakage is worst for the smallest applicator (6×6 cm2) and the highest energy. However, such a small applicator is rarely used in common clinical practice. Furthermore, the nominal energy 22 MeV is not always available due to magnetron problems. We have therefore chosen to consider the 10×10 cm2 applicator and 20 MeV as a “worst case” configuration and this will be the focus for our investigation.

7
2.2. A general description of the Monte Carlo method The Monte Carlo method is very useful for radiotherapy applications. Energy spectrum, energy fluence and dose distribution can be calculated by simulating a large number of interaction sequences. For instance, backscatter from high-density material (bone) or scatter perturbations by air cavities can be handle by Monte Carlo more accurately than any other dose calculation model (Ma and Jiang 1999). Detailed information about the beams incident on the patient surface is needed for Monte Carlo simulations. This information on a clinical beam is very difficult (if not impossible) to measure. A practical way to obtain this information is to simulate a treatment head with Monte Carlo technique. Such a simulation increase our understanding of clinical beam characteristics, and has the potential of improving the accelerator design. The work on Monte Carlo simulations can be divided in two groups of categories. The first group includes simulations that were performed more than about twenty years ago with limited computer power. The structure of the medical accelerators were simplified to one or two components which were considered to have most dosimetric significance. Monte Carlo simulations were performed with an acceptable accuracy and within a reasonable timeframe (Berger and Seltzer 1978, Borell-Carbonell et al 1980, Rogers and Bilajew 1986). The second category includes the simulation of a fairly complete accelerator head (Udale 1988, Udale-Smith 1990, 1992, Kassaee et al 1994). Since the OMEGA BEAM system was developed, this category has been greatly enhanced, and the modelling of medical accelerators has become easier and more systematic. It is a difficult task to do a complete Monte Carlo simulation of a medical accelerator. It needs a large number of physical data like component dimensions and materials specified with a high accuracy. An accurate and efficient model needs to be performed via a large amount of careful coding of the individual accelerator components. The results of the simulations are very sensitive to the details of the model. The OMEGA (Ottawa Madison Electron Gamma Algorithm) project was a cooperation between the National Research Council of Canada and the University of Wisconsin (Rogers et al 1990, Mackie et al 1990, 1994). Their goal with this project was to develop a 3D electron beam treatment planning system using Monte Carlo simulations for calculation of the dose distribution in a patient. This project was the development of the BEAM and the DOSXYZ code system (Rogers et al 1995, Ma and Rogers 1995, Ma et al 1995). BEAM and DOSXYZ are based on the PRESTA extension of the EGS4 Monte Carlo system (Nelson et al 1985, Bielajew and Rogers 1987, Rogers and Bielajew 1990, Bielajew et al 1994). There are many useful and important new features in the BEAM code (Rogers et al 1995). This includes the use of component modules, scoring particle phase space information, tracking each particle history, applying various variance reduction techniques, setting up a file/structure for parallel processing and development of a user-friendly interface. Each component module in the BEAM code acts like a “brick”, so a model of an accelerator head can readily be built. One can put a series of components together according to the technical drawing and this also allows users without much knowledge in programming. The recording of the complete phase-space information of each individual particle crossing the scoring planes is an important element of BEAM. This information includes the energy, position, charge, direction and a history tag for each particle. The phase-space data could be recorded at the back plane, at right angels to the beam axis, of any specified component module in the accelerator. A phase-space data file could be created at each plane and an arbitrary number of scoring planes can be used. The history tag variable LATCH is a very important parameter in the phase-space data file, which was a feature of EGS4 (Nelson et al 1985). With LATCH it is possible to keep track of

8
each particle history and used in the analysis of the relative dose distributions from various accelerator components. LATCH is a very useful tool for studying the origin of particles. 2.3. Specific Monte Carlo calculations performed in this study The code which was used to model the electron beams was the 2002 version of the BEAMnrc package which originally is based on the EGS4 Monte Carlo system for radiation transport. The accelerator treatment head and the electron applicator for the Elekta SLi Plus were modeled from a series of component modules. The 10×10 cm2 open standard applicator has a field size of 10.5×10.5 cm2 at SSD 100 cm. The Gaussian energy distribution of the initial electron beams used in the simulations have previously been tuned for the nominal electron energies 6, 12 and 20 MeV (Björk et al 2002). These Monte Carlo calculations were performed without attaching any applicator to the treatment head to get minimal influence from various beam scattering devices. In all simulations the energy cut-offs for particle transport were set to Ecut = Pcut = 0.521 MeV (kinetic energy plus rest mass) and AE = AP = 0.010 MeV. Ecut defines the global cutoff energy for electron transport in MeV. Ecut defaults to AE(medium) (the lowest electron energy for the data in the pegs4 data). Pcut defines the global cutoff energy for photon transport in MeV. It is the photon equivalent of Ecut. Pcut defaults to AP(medium) (the lowest photon energy for which there is data in the pegs4 file). The exact values do not take much more time. A value of 0.01 MeV should generally be used. In the primary collimator and in the x-ray diaphragms Ecut was set to 0.700 MeV to speed up the calculations and this change will not effect the results. PRESTA was used in all cases.
2.3.1. Energy fluence sampling for electrons and photons. For the investigation of the phase spaces we used the computer code BEAMDP (Ma and Rogers 1998). We have chosen to study the energy fluences for both electrons and photons to get an indication of the forthcoming investigation of the absorbed dose distributions. It must be noted that the energy fluence is not directly proportional to the absorbed dose. For photons the energy fluence should be multiplied with the mass energy absorption coefficient for water. For electrons the particle fluence should be multiplied with the mass collision stopping power for water. Both the mass energy absorption coefficient and the stopping power depends on the energy of the particles which may change over the radiation field. The mean photon energy was found to be nearly constant and therefore the photon energy fluence could be considered directly proportional to the absorbed dose. The mean electron energy was found to vary a lot over the radiation field and the particle fluence could therefore not represent the absorbed dose. It was, however, found that the energy fluence distribution of the electrons was very similar in shape to an expected absorbed dose distribution. Therefore, the energy fluence distribution was investigated for both electrons and photons. The energy fluence versus off-axis position in the crossplane (x) direction was studied. This fluence profile was sampled over a rectangular field with rectangular bins. A small investigation was done to determine a proper width of the bins which gives good statistics without changing the results.

9
In BEAMDP we used LATCH to get information about the particles histories and to analyze the relative dose contributions from various accelerator components. The energy fluence was divided into one electron part (e-) and one photon part (ph). Each of these was studied separately. The total energy fluence was divided into two components; one contribution from the treatment head and one from the electron applicator:
The contribution from the applicator was further split into the different scraper levels: abababaAppl 12,23,34,4 ψψψψψ +++= ,
where the numbers indicate the LATCH bit in each scraper (see Fig. 2).
2.3.2. Investigation of dose distributions. The Monte Carlo code DOSXYZnrc was used to calculate dose profiles and relative depth dose curves. Only profiles in the x-direction were studied. The total water phantom size was (x×y×z)= (25×25×14) cm3. For the profile study the voxels size were (0.4×5×0.4) cm3, and centered at 1 cm and 5.8 cm depth. For depth dose study the voxels were (1×1×0.2) cm3. The number of histories was chosen to ensure statistical uncertainty better than 1%. For the profiles the relative dose contributions to the total dose were investigated according to:
.ApplHeadTot ψψψ +=
baababaeAppl
phAppleApplAppl
ApplHeadTot
pheTot
DDDD
DDD
DDD
DDD
2,2,13,34,4,
,,.
.
++=
+=
+=
+=
−
−
−

10
2.3.3. Modification of the standard 10×10 cm2 applicator. A simple modification of the 10×10 cm2 applicator was performed, which includes a changing in the order of the aluminum and the lead in the third scraper. The dimension of each layer was kept, only the order was changed. The energy fluences and the dose profiles were investigated for this new design in the same manner as previously described. These results were compared to the results obtained from the standard applicator. We want to reduce the leakage from the applicator and this modification would hopefully decrease the radiation leakage. We put the low-Z material, aluminum on the top to reduce the electron energy then they penetrate the high-Z material, lead. Most of the energy will then be absorbed in the lead layer.

11
2.4. Measurements and the International Electrotechnical Commission (IEC)
Standards. The IEC Standards (1998) provides guidelines on acceptable dose levels in the patient plane outside the radiation field. Electron beam applicators and other parts of the radiation head should have a limited scattered radiation outside the electron radiation field. Scanning measurements (only crossline) were preformed in a large water phantom at 1 cm depth with a diode detector (RFA-300 from Scanditronix). According to the IEC, measurements shall be performed for a inline, crossline and also two profiles over the field diagonal. The IEC report shows the following values for the maximum and the average dose in this setup:
1. The absorbed dose as a percentage of the maximum absorbed dose on the reference axis shall not exceed a maximum of 10% in the area between 7.5 cm and 25 cm from the reference axis (for a 10×10 cm2 applicator). The area is defined between a line 2 cm outside the periphery of the geometrical radiation field and the boundary of M, there M is the projection of the primary collimator on the isocenter plane.
2. The average absorbed dose due to leakage radiation in the area between a line 4 cm outside the periphery of the geometrical radiation field and the boundary of M, shall not exceed the limits of allowable leakage radiation which is 1.3% for an electron energy of 20 MeV.
Figure 3. Illustration of the areas. The maximum value of the absorbed dose shall be measured in the area defined as a line (red line) 2 cm outside the periphery of the geometrical radiation field and 25 cm from the reference axis (black circle= M). The average absorbed dose shall be measured in the area between a line (yellow line) 4 cm outside the periphery of the geometrical field and 25 cm from the reference axis (black circle= M)

12
3. Results 3.1. Energy fluence investigation for the standard applicator. A bin size of ∆x= 0.5 cm and ∆y= 5 cm was chosen. The fluence profile was taken from x= -15 cm to x= 15 cm. The energy fluence results for 20 MeV are shown in Figures 4 and 5 (electrons) and in Figures 6 and 7 (photons). All profiles are normalized to the value at the central axis for the total electron/photon energy fluence. The profiles have been parameterised in Table 1-4. In Appendix 1 the corresponding figures for 12 MeV and 6 MeV are shown.
Figure 4. The total energy fluence is divided into two components; one contribution from the treatment head and one from the electron applicator. eAppleHeadeTot ,,, ψψψ += . Table 1. Energy fluence values at distances 0, 6.5 and 10 cm from the reference axis according to Figure 4. Distance from ref.axis Total Head Appl.
0 1.0 0.967 0.033 6.5 0.018 0.005 0.013 10 0.0095 0.0001 0.0094
0.00
0.20
0.40
0.60
0.80
1.00
1.20
-20 -15 -10 -5 0 5 10 15 20Off-axis position
Rel
ativ
e en
ergy
flue
nce
electrons, Totelectrons, Headelectrons, Appl

13
Figure 5. The contribution from the applicator divided into the different scraper levels; abababaeAppl 12,23,34,4, ψψψψψ +++= .
Table 2. Energy fluence values at a distance 0, 6.5 and 10 cm from the reference axis according to Figure 5. Distance from
ref.axis Appl. 4a,4b 3a,3b 2a,2b 1a
0 0.330 0.00263 0.00394 0.00110 0.00001 6.5 0.0131 0.00154 0.00085 0.00018 0.00004 10 0.0094 0.00078 0.00095 0.00066 0.00001
0.00
0.01
0.02
0.03
0.04
0.05
0.06
0.07
0.08
-20 -15 -10 -5 0 5 10 15 20Off-axis position (cm)
Rel
ativ
e en
ergy
flue
nce
electrons, Appl4a,4b3a,3b2a,2b1a

14
Figure 6. The total energy fluence for photons is divided into two components; one contribution from the treatment head and one from the electron applicator. phApplphHeadphTot ,,, ψψψ += Table 3. Energy fluence values at a distance 0, 6.5 and 10 cm from the reference axis Figure 6. Distance from ref.axis Total Head Appl.
0 1 0.815 0.186 6.5 0.421 0.161 0.260 10 0.154 0.014 0.144
0.00
0.20
0.40
0.60
0.80
1.00
1.20
-20 -15 -10 -5 0 5 10 15 20Off-axis position (cm)
Rel
ativ
e en
ergy
flue
nce
ph, Totph, Headph, Appl

15
Figure 7. The contribution from the applicator divided into the different scraper levels;
abababaphAppl 12,23,34,4, ψψψψψ +++= . Table 4. Energy fluence values at a distance 0, 6.5 and 10 cm from the reference axis according to Figure 7. Distance from
ref.axis Appl. 4a,4b 3a,3b 2a,2b 1a
0 0.186 0.124 0.06 0.015 - 6.5 0.260 0.140 0.118 0.011 - 10 0.154 0.038 0.112 0.0104 -
0.00
0.05
0.10
0.15
0.20
0.25
0.30
-20 -15 -10 -5 0 5 10 15 20Off-axis position (cm)
Rel
ativ
e en
ergy
flue
nce
ph, Appl4a,4b3a,3b2a,2b1a

16
3.2. Dose profile investigation for the standard applicator. Figure 8 shows the total dose profile, which are divided into one electron and one photon part. Figure 9 shows the total dose profile divided into head contribution and applicator contribution. Close-ups of figure 8 and 9 are shown in Appendix 2. There are tables to each diagram that include the important figures from the diagrams (see Table 5 and 6). The normalization has been done to the reference axis for the total dose.
Figure 8. The total dose distribution is divided into two components, one electron part and one photon part.
pheTot DDD += . Close up in the left corner.
Table 5. Average values of the energy fluence from distance 0, 6.5 and 10 cm from reference axis according to Figure 8. Distance from ref.axis Total electrons photons
0 1.0 0.963 0.037 6.5 0.0465 0.0274 0.0191 10 0.026 0.0169 0.0091
0.00
0.20
0.40
0.60
0.80
1.00
1.20
-30 -20 -10 0 10 20 30Off-axis position (cm)
Rel
ativ
e ab
sorb
ed d
ose
totalelectronsphotons
0.00
0.02
0.04
0.06
0.08
0.10
0.12
0.14
0.16
0.18
0.20
-30 -20 -10 0 10 20 30
17
0.00
0.20
0.40
0.60
0.80
1.00
1.20
-30 -20 -10 0 10 20 30Off-axis position (cm)
Rel
ativ
e ab
sorb
ed d
ose
TotHeadAppl.
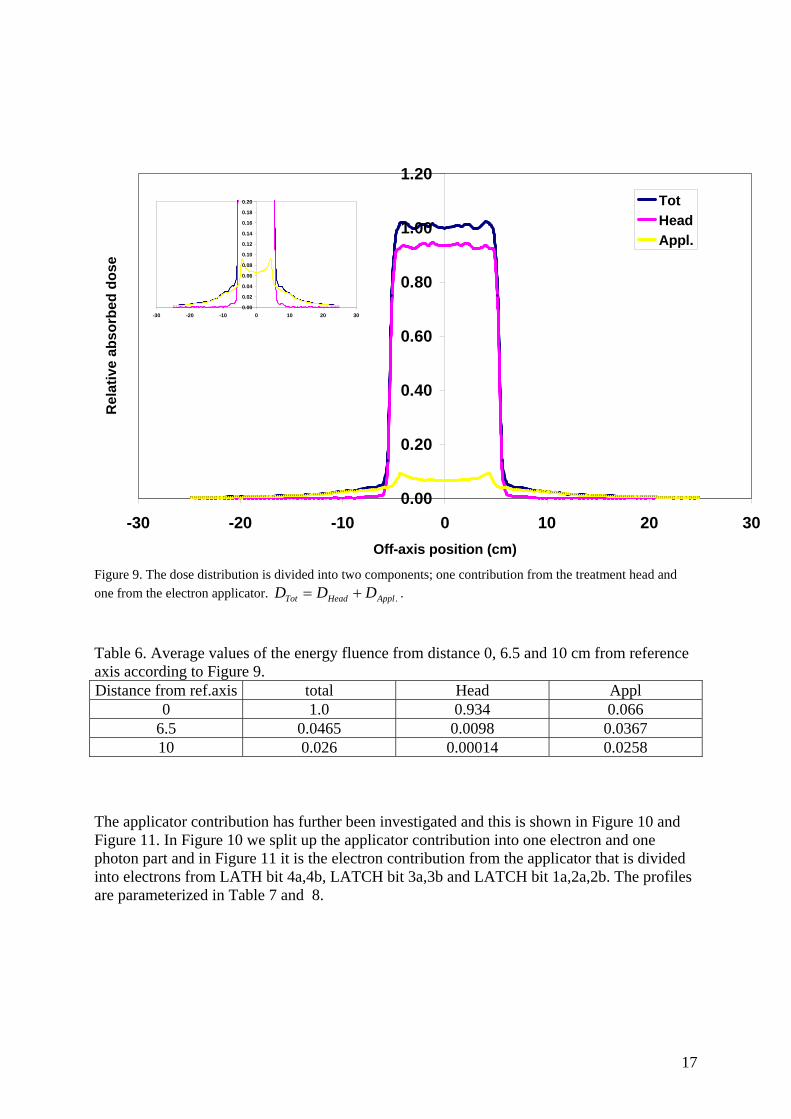
Figure 9. The dose distribution is divided into two components; one contribution from the treatment head and one from the electron applicator. .ApplHeadTot DDD += .
Table 6. Average values of the energy fluence from distance 0, 6.5 and 10 cm from reference axis according to Figure 9. Distance from ref.axis total Head Appl
0 1.0 0.934 0.066 6.5 0.0465 0.0098 0.0367 10 0.026 0.00014 0.0258
The applicator contribution has further been investigated and this is shown in Figure 10 and Figure 11. In Figure 10 we split up the applicator contribution into one electron and one photon part and in Figure 11 it is the electron contribution from the applicator that is divided into electrons from LATH bit 4a,4b, LATCH bit 3a,3b and LATCH bit 1a,2a,2b. The profiles are parameterized in Table 7 and 8.
0.00
0.02
0.04
0.06
0.08
0.10
0.12
0.14
0.16
0.18
0.20
-30 -20 -10 0 10 20 30

18
Figure 10. The contribution from the applicator divided into one electron part and one photon part; phAppleApplAppl DDD ,, += .
Table 7. Energy fluence values at a distance 0, 6.5 and 10 cm from the reference axis according to Figure 10. Distance from ref.axis Appl Appl,e Appl,ph
0 0.0658 0.0532 0.0126 6.5 0.0367 0.0233 0.0134 10 0.0258 0.0167 0.0091
0.00
0.01
0.02
0.03
0.04
0.05
0.06
0.07
0.08
0.09
0.10
-30 -20 -10 0 10 20 30Off-axis position (cm)
Rel
ativ
e ab
sorb
ed d
ose
Appl.Appl, eAppl, ph

19
Figure 11. The contribution from the applicator divided into the different scraper levels;
baababaeAppl DDDD 2,2,13,34,4, ++= .
Table 8. Energy fluence values at a distance 0, 6.5 and 10 cm from the reference axis according to Figure 11. Distance from ref.axis
Appl,e 4a,4b 3a,3b 1a-2b
0 0.0532 0.0252 0.0172 0.0108 6.5 0.0233 0.0123 0.00587 0.00514 10 0.0167 0.00505 0.00718 0.00447
3.3. Energy fluences for the modified applicator compared to the standard
applicator. Figure 12 shows a comparison between the electron energy fluence from the standard applicator and the modified applicator for the third scraper. In Appendix 3 the other figures in this study are shown.
0.00
0.01
0.02
0.03
0.04
0.05
0.06
0.07
0.08
0.09
-30 -20 -10 0 10 20 30Off-axis position (cm)
Rel
ativ
e ab
sorb
ed d
ose
Appl,eincl. 4a,4bincl. 3a,3bincl 1a,2a,2b

20
Figure 12. The electron energy fluence from the third scraper for both the standard applicator and the modified applicator.
Figure 13. Comparison between the energy fluence for photons from scraper two for standard and modified applicator, electron energy 20 MeV.
0.000
0.005
0.010
0.015
0.020
0.025
-20 -15 -10 -5 0 5 10 15 20Off-axis position (cm)
Rel
ativ
e en
ergy
flue
nce
3a,3b3a,3b mod
0.00
0.02
0.04
0.06
0.08
0.10
0.12
0.14
0.16
0.18
-20 -15 -10 -5 0 5 10 15 20Off-axis position (cm)
Rel
ativ
e en
ergy
flue
nce
3a,3b3a,3b mod

21
3.4. Dose profiles for the modified applicator compared to the standard
applicator. The Monte Carlo calculated dose profiles are compared to measurements at depth 1 cm and depth 5.8 cm (R90, 90% of the dose maximum). The results are shown in Figures 14-18. The measured depth dose curve is compared with the two Monte Carlo simulations (standard and modified applicator) in Figure 18.
Figure 14. Comparison between Monte Carlo calculated dose profiles for the standard applicator and measurements with the standard applicator at depth 1 cm (close up in the left corner).
0
20
40
60
80
100
120
-30 -20 -10 0 10 20 30Off-axis position (cm)
Rel
ativ
e ab
sorb
ed d
ose
(%)
Standard applicatorMeasurement
0
2
4
6
8
10
12
14
16
18
20
-30 -20 -10 0 10 20 30

22
Figure 15. Comparison between Monte Carlo Calculated dose profiles for standard applicator and modified applicator at depth 1 cm (close up in the left corner).
0
20
40
60
80
100
120
-30 -20 -10 0 10 20 30Off-axis position (cm)
Rel
ativ
e ab
sorb
ed d
ose
(%)
Standard applicatorModified applicator
0
2
4
6
8
10
12
14
16
18
20
-30 -20 -10 0 10 20 30

23
Figure 16. Comparison between Monte Carlo calculated dose profiles for the standard applicator and measurements with the standard applicator at depth 5.8 cm (equal to the R90-depht, 90% of dose maximum).
Figure 17. Comparison between Monte Carlo calculated dose profiles for the standard applicator and the modified applicator at depth 5.8 cm (equal to the R90-depht, 90% of dose maximum). Close up in the left corner.
0
20
40
60
80
100
120
-10 -5 0 5 10Off-axis position (cm)
Rel
ativ
e ab
sorb
ed d
ose
(%)
MCMeasurement
0
20
40
60
80
100
120
-30 -20 -10 0 10 20 30Off-axis position (cm)
Rel
ativ
e ab
sorb
ed d
ose
(%)
Standard applicatorModified applicator
0
2
4
6
8
10
12
14
16
18
20
-30 -20 -10 0 10 20 30

24
Figure 18. Comparison between Monte Carlo calculated depth dose curves for the standard and the modified applicator and the measured with the standard applicator depth dose curve.
0
20
40
60
80
100
120
-2 0 2 4 6 8 10 12 14 16Depth (cm)
Rel
ativ
e ab
sorb
ed d
ose
(%)
MCmeasurement

25
3.5. Comparison with measurements and the International Electrotechnical
Commission (IEC) Standards. The absorbed dose as a percentage of the maximum dose on the reference axis has been calculated and the results are shown in Table 9. Table 9 also shows the result of average absorbed dose (radiation leakage). Table 9. Comparison with measurements and the International Electrotechnical Commission (IEC) Standards.
LIMITS (IEC) Measurement MC simulation (Standard appl.)
MC simulation (Modified appl.)
Maximum dose 10% 4.32% 4.15%±0.14 2.12%±0.07 Average dose 1.3% 1.32% 1.13%±0.04 0.61%±0.02

26
4. Discussion and conclusions We have chosen to study the 10×10 cm2 applicator and the highest energy (20 MeV) because that configuration gives the highest leakage dose and it is common in patient treatments. The Monte Carlo techniques is a very useful tool to investigate applicator characteristics. With the history tag variable LATCH it is possible to keep track of each particle history. LATCH makes it possible to analyze the relative dose distributions from various accelerator components. The energy fluence investigation for electrons are shown in Figure 4 and 5 (20 MeV) and in Appendix 1 (6 and 12 MeV). A comparison between Figure 5 and Figure A1-4 shows that at the central axis the relative contribution of electrons generated in the applicator is greater for 6 MeV. It can also be seen that the “horns” are more clear for 20 MeV. This is a result of a lower mass scattering power for higher energies, which makes the applicator scattered electrons more forward directed. The energy fluence investigation for photons are shown in Figure 6, Figure A1-5 and Figure A1-7 for 20,12 and 6 MeV respectively. The diagrams clearly show that the bremsstrahlung is more forward directed for higher energies, which corresponds to the fundamental interactions facts. This show that the Monte Carlo code manage bremsstrahlung production like we expect. In Figure 8 (close up in Figure A2-1) the dose distributions from electrons and photons are shown. It was found that outside the applicator most of the dose comes from particles that have interacted in the applicator itself. Furthermore, in this area the dose contribution from photons almost equals the contribution from electrons. If we study the applicator contributions for electrons in Figure11, we see that at 10 cm outside the central axis most leakage is coming from the third scraper. It can also be concluded that it is the third scraper that gives the highest bremsstrahlung contribution. This implies that a reduced radiation leakage could be obtained if the aluminum and lead layer changed order in the third scraper. Repeated investigations after such a modification shows that the leakage is in fact reduced (see Appendix 3). The comparison between the standard applicator, the modified applicator and measurement of the standard applicator at 1 cm depth, show that our Monte Carlo model on the accelerator is not perfect. The disagreement between measurement and simulations is about 2% within the radiation field. The Monte Carlo simulations have a statistic uncertainty below 0.5% (1 S.D) inside the field. At 1 cm depth we get a higher absorbed dose with our Monte Carlo simulation but 5.8 cm depth it seems to be almost the same as the measurement. The deviation on 1 cm depth depends mostly of the model of the accelerator head is not quite correct. Probably it is the secondary foil that is not correct modeled. This effect decreases with increased water depth. The less homogenous field may also depend on the beam first hit a low Z material in the third scraper and this conduct in more scattered electron into the field. Outside the field there is good agreement between measurement and simulations for the standard applicator. The modified applicator has less radiation leakage but the profile is not so flat as the one from the standard applicator. In Figure 18 the simulation of the standard applicator is compared with measurement at 5.8 cm depth and it show good agreement. The modified applicator is also compared to the standard applicator at 5.8 cm depth (Figure18 and Figure A4-3). Also at this depth it is clearly shown that the modified applicator is has a lower dose outside the radiation field. The “horn” that are shown in Figure 18 for the modified applicator can be electrons scattered into the field from the aluminum. The electrons may have enough energy to reach down to 5.8 cm, there we have 90% of the dose maximum.

27
A conclusion is that the leakage dose decreases because less bremsstrahlung and less low energetic electrons. According to the IEC the maximum dose outside the applicator should not exceed 10%. This is no problem for neither the standard applicator nor the modified applicator, which have maximum values of 4.8% and 2.1%, respectively. According to IEC the average dose outside the periphery of the geometrical radiation field and the boundary of M, shall not exceed the limits of allowable leakage radiation which is 1.3% for an electron energy of 20 MeV. (M is the projection of the primary collimator on the isocenter plane). The standard applicator has a value of 1.8% which is slightly too high. The modified applicator reduced this value to only 0.6%. A future study will include further modification of the electron applicator so that the dose profile will remain flat and have low radiation leakage.

28
5. References Berger M. J, Seltzer S. M ,“The Influence of scattering foils on absorbed dose distributions from electron beams,“78-1552, NBS Internal report (1978) Bielajew A. F and Rogers D. W. O, “ PRESTA. The Parameter Reduced Electron-Step Transport Algorithm for electron Monte Carlo Transport, “ Nuclear Instrum. Methods B18. 165-181 (1988) Bjärngard B E, Piontek R W. and Svensson G K., ”Electron scattering and collimation system for a 12-Mev linear accelerator,” Med. Phys. Vol 3, no 3, May/June (1976) Björk P, Nilsson P. and Knöös T, “Dosimetry characteristics of degraded electron beams investigated by Monte Carlo calculations in a setup for intraoperative radiation therapy”, Phys. Med. Biol. (2002) Björk P, Knöös T. and Nilsson P, “Influence of initial beam characteristics on Monte Carlo calculated absorbed dose distributions for linear accelerator electron beams,” Phys. Med. Biol. (2002) Borell-Carbonell A, Patan J. P, Ternissol M and Tronc D, “Comparison between experimental measurements and calculated transport simulations for dose distributions inside homogeneous phantoms”, Strahlentherapie 156 186-91 (1980) Brahme A, ”Design principles of therapeutic electron and photon beams,” Paper presented at the workshop on Physical Aspects of High Electron Accelerators in Radiation Therapy, Bombay, Dec 3-8, (1982) Deasy JO, Almond PR and Mc Ellistrem MT, ”Measured electron energy and angular distributions from clinical accelerators,” Med Phys. 23 675-84 (1996) Ebert M. A. and Hoban P. W, ”A model for electron-beam applicator scatter,” Med. Phys. Sept; 22(9) (1995a) Ebert M. A. and Hoban P. W, ”A Monte Carlo investigation of electron-beam applicator scatter,” Med. Phys. Sept; 22(9) (1995b) Greene D,”Lineare accelerators for radiation therapy,” Medical Physics Handbooks 17, (1986) IEC Publication 60601-2-1, Particular requirements for safety of electron accelerators in the range 1 MeV to 50 MeV. Geneva: International Electrotechnical commission central Office (1998) Kassaee A, Altschuler M. D, Ayyalsomayajula S, and Bloch P, ”Influence of cone design on the electron beam characteristics on clinical accelerators,” Med. Phys. 21 1671-6 (1994). Keys R. A. and Purdy J. A., ”Radiation leakage from Linac electron applicator assembly,” Onc. Biol. Phys. Vol. 10. pp. 713-721 (1984).

29
Klein E. E, Low D. A. and Purdy J. A, ”Changes in electron beam dosimetry with a new scattering foil-applicator system on a CL2100C,” Onc. Biol. Phys. 32(2) (1995) Kok J G and Welleweerd J, “Finding mechanisms responsible for the spectral distribution of electron beams produced by a linear accelerator,” Med Phys. 26 2589-96 (1999) Ma C-M and Jiang S. B, “Topical review: Monte Carlo modelling of electron beams from medical accelerators,” Phys. Med. Biol.44 (1999) Ma C-M and Rogers D. W. O, “BEAMDP users manual,” Report PIRS-0509(C) (Ottawa: NRCC) (1995a) Ma C-M and Rogers D. W. O, “BEAMDP–as a general-purpose utility,” Report PIRS-0509(E) (Ottawa: NRCC) (1995b) Ma C-M, Reckwerdt P, Holmes M, Rogers D. W. O, Geiser and Walters B,“DOSXYZ users manual,“ Report PIRS-0509(b) (Ottawa: NRCC) (1995) Ma C-M, Rogers D. W. O and Walters B,“DOSXYZ99 users manual,“ Natinal Reasearch Council of Canada Report PIRS-0509b (Ottawa: NRC) (1999) Mackie T. R, Kubsad S. S, Rogers D. W. O and Bielajew A. F, “ The OMEGA Project: Electron dose planning using Monte Carlo simulation”, Med. Phys. 17 (1990) Nelson W. R, Hirayama H and Rogers D. W O, “The EGS4 Code System”, Stanford Linear Accelerator Center Report No. SLAC-265 (Stanford Calif) (1985) Northey B. J, Zavgorodni S. F, ”Optimation of electron cone design in high energy radiotherapy using the Monte Carlo method,” Australasian Phys. Eng. Sci. Med. Mar; 25(1) (2002) Rogers D. W. O and Bielajew A. F, “Differences in electron depth-dose curves calculated with EGS and ETRAN and improved energy-range relationships,” Med. Phys. 13 687-94 (1986) Rogers D. W. O, Faddegon B. A., Ding G. X, Ma C. -M. and We J, ”BEAM: A Monte Carlo code to simulate radiotherapy treatment units,” Med. Phys. 22(5), (May 1995) Rogers D. W. O and Bielajew, “Monte Carlo techniques of electron and photon transport for radiation dosimetry”, Vol III edited by K. R Kase, B.E Bjarngard and F. H Attix (Academic, New York, 1990) Rogers D. W. O, Bielajew, T. R. Mockie and Kubsad S. S, “ The OMEGA project: Treatment planning for electron-beam radiotherapy using Monte Carlo techniques”, Phys. Med. Biol. 35 (1990) Pennington E. C, Jani S. K. and Wen B-Chen, ”Leakage radiation from electron applicators on a medical accelerator,” Med. Phys. 15(5), (Sep/Oct 1988)

30
Udale M, “Monte Carlo investigation of surface doses for broad electron beams” Phys. Med. Biol. 33, 939-954 (1988) Udale-Smith M, “A Monte Carlo investigation of High Energy Electron Beams used in radiotherapy, “PhD-thesis, Leeds University (1990) Udale M,”Monte Carlo calculations of electron beam parameters for three Philips linear accelerators,” Phys. Med. Biol. 37, 85-105 (1992)

31
Appendix 1. Energy fluence investigation for electrons.
Figure A1-1. Electron energy 12 MeV. The total energy fluence for electrons is divided into two components, one contribution from the treatment head and one from the electron applicator. eAppleHeadeTot ,,, ψψψ += .
0.00
0.20
0.40
0.60
0.80
1.00
1.20
-20 -15 -10 -5 0 5 10 15 20Off-axis position (cm)
Rel
ativ
e en
ergy
flue
nce
Tot, electronsHead, electronsAppl, electrons

32
Figure A1-2. Electron energy 12 MeV. The contribution from the applicator divided into the different scraper levels; abababaeAppl 12,23,34,4, ψψψψψ +++= .
0.00
0.01
0.02
0.03
0.04
0.05
0.06
0.07
0.08
-20 -15 -10 -5 0 5 10 15 20Off-axis position (cm)
Rel
ativ
e en
ergy
flue
nce
electrons, Appl4a,4b3a,3b2a,2b1a

33
Figure A1-3. Electron energy 6 MeV. . The total energy fluence for electrons is divided into two components, one contribution from the treatment head and one from the electron applicator. eAppleHeadeTot ,,, ψψψ += .
Figure A1-4. Electron energy 6 MeV. The contribution from the applicator divided into the different scraper levels; abababaeAppl 12,23,34,4, ψψψψψ +++= .
0.00
0.20
0.40
0.60
0.80
1.00
1.20
-20 -15 -10 -5 0 5 10 15 20Off-axis position (cm)
Rel
ativ
e en
ergy
flue
nce
Tot, electronsHead, electronsAppl, electrons
0.00
0.01
0.02
0.03
0.04
0.05
0.06
0.07
0.08
0.09
-20 -15 -10 -5 0 5 10 15 20Off-axis position (cm)
Rel
ativ
e en
ergy
flue
nce
electrons, applicator4a,4b3a,3b2a,2b1a

34
Figure A1-5. Electron energy 12 MeV. The total energy fluence for photons is divided into two components, one contribution from the treatment head and one from the electron applicator
HeadApplTot ψψψ += .
Figure A1-6. Electron energy 12 MeV. The contribution from the applicator divided into the different scraper levels; abababaAppl 12,23,34,4 ψψψψψ +++= .
0.00
0.20
0.40
0.60
0.80
1.00
1.20
-20 -15 -10 -5 0 5 10 15 20Off-axis position (cm)
Rel
ativ
e en
ergy
flue
nce
Tot, photonsHead, photonsAppl, photons
0.00
0.05
0.10
0.15
0.20
0.25
0.30
-20 -15 -10 -5 0 5 10 15 20Off-axis position (cm)
Rel
ativ
e en
ergy
flue
nce
all photons, applicator4a,4b3a,3b2a,2b1a

35
Figure A1-7. Electron energy 6 MeV. The total energy fluence for photons is divided into two components, one contribution from the treatment head and one from the electron applicator
ApplHeadTot ψψψ += .
Figure A1-8. Electron energy 6 MeV. The contribution from the applicator divided into the different scraper levels; abababaAppl 12,23,34,4 ψψψψψ +++= .
0.00
0.20
0.40
0.60
0.80
1.00
1.20
-20 -15 -10 -5 0 5 10 15 20Off-axis position (cm)
Rel
ativ
e en
ergy
flue
nce
Tot, photonsHead, photonsAppl, photons
0.00
0.05
0.10
0.15
0.20
0.25
0.30
-20 -15 -10 -5 0 5 10 15 20Off-axis position (cm)
Rel
ativ
e en
ergy
flue
nce
all photons, applicator4a,4b3a,3b2a,2b1a

36
Appendix 2. Dose profiles by using DOSXYZ.
Figure A2-1. Close up on Figure 8. The total dose distribution is divided into two components, one electron part and one photon part pheTot DDD += .
0.00
0.02
0.04
0.06
0.08
0.10
0.12
0.14
0.16
0.18
0.20
-30 -20 -10 0 10 20 30Off-axis position (cm)
Rel
ativ
e ab
sorb
ed d
ose
totalelectronsphotons

37
Figure A2-2. Close up on Figure 9. The dose distribution is divided into two components, one contribution from the treatment head and one from the electron applicator, ApplHeadTot DDD += .
0.00
0.02
0.04
0.06
0.08
0.10
0.12
0.14
0.16
0.18
0.20
-30 -20 -10 0 10 20 30Off-axis position (cm)
Rel
ativ
e ab
sorb
ed d
ose
TotHeadAppl.

38
Appendix 3. Energy fluences for the modified applicator compared to the standard applicator.
Figure A3-1. Comparison between the total energy fluence for electrons from the standard applicator and modified applicator, energy 20 MeV.
0.00
0.01
0.02
0.03
0.04
0.05
0.06
0.07
0.08
-20 -15 -10 -5 0 5 10 15 20Off-axis position (cm)
Rel
ativ
e en
ergy
flue
nce
eappleappl, mod

39
Figure A3-2. Comparison between the total energy fluence for electrons from scraper four for standard and modified applicator, energy 20 MeV.
Figure A3-3. Comparison between the total energy fluence for electrons from scraper two for standard and modified applicator, energy 20 MeV.
0.000
0.010
0.020
0.030
0.040
0.050
-20 -15 -10 -5 0 5 10 15 20Off-axis position (cm)
Rel
ativ
e en
ergy
flue
nce
4a,4b4a,4b mod
0.000
0.001
0.002
0.003
0.004
0.005
0.006
0.007
0.008
0.009
-20 -15 -10 -5 0 5 10 15 20Off-axis position (cm)
Rel
ativ
e en
ergy
flue
nce
2a,2b2a,2b mod
40
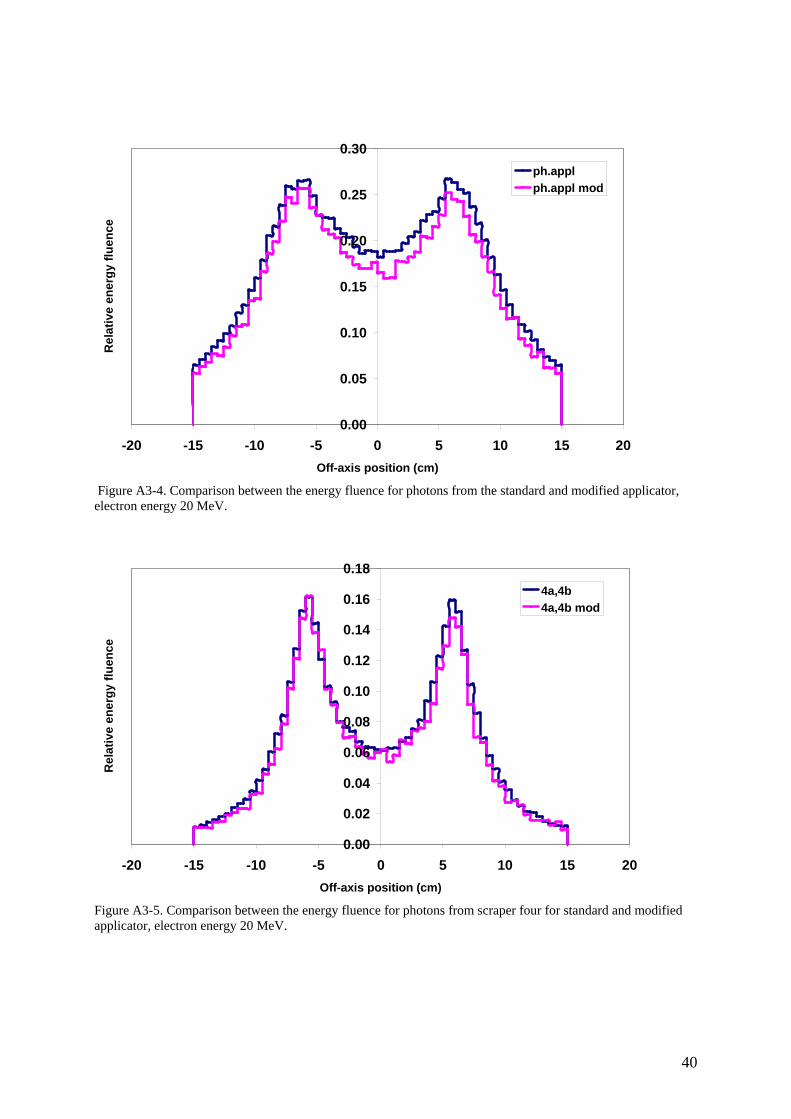
Figure A3-4. Comparison between the energy fluence for photons from the standard and modified applicator, electron energy 20 MeV.
Figure A3-5. Comparison between the energy fluence for photons from scraper four for standard and modified applicator, electron energy 20 MeV.
0.00
0.05
0.10
0.15
0.20
0.25
0.30
-20 -15 -10 -5 0 5 10 15 20Off-axis position (cm)
Rel
ativ
e en
ergy
flue
nce
ph.applph.appl mod
0.00
0.02
0.04
0.06
0.08
0.10
0.12
0.14
0.16
0.18
-20 -15 -10 -5 0 5 10 15 20Off-axis position (cm)
Rel
ativ
e en
ergy
flue
nce
4a,4b4a,4b mod
41
Appendix 4.
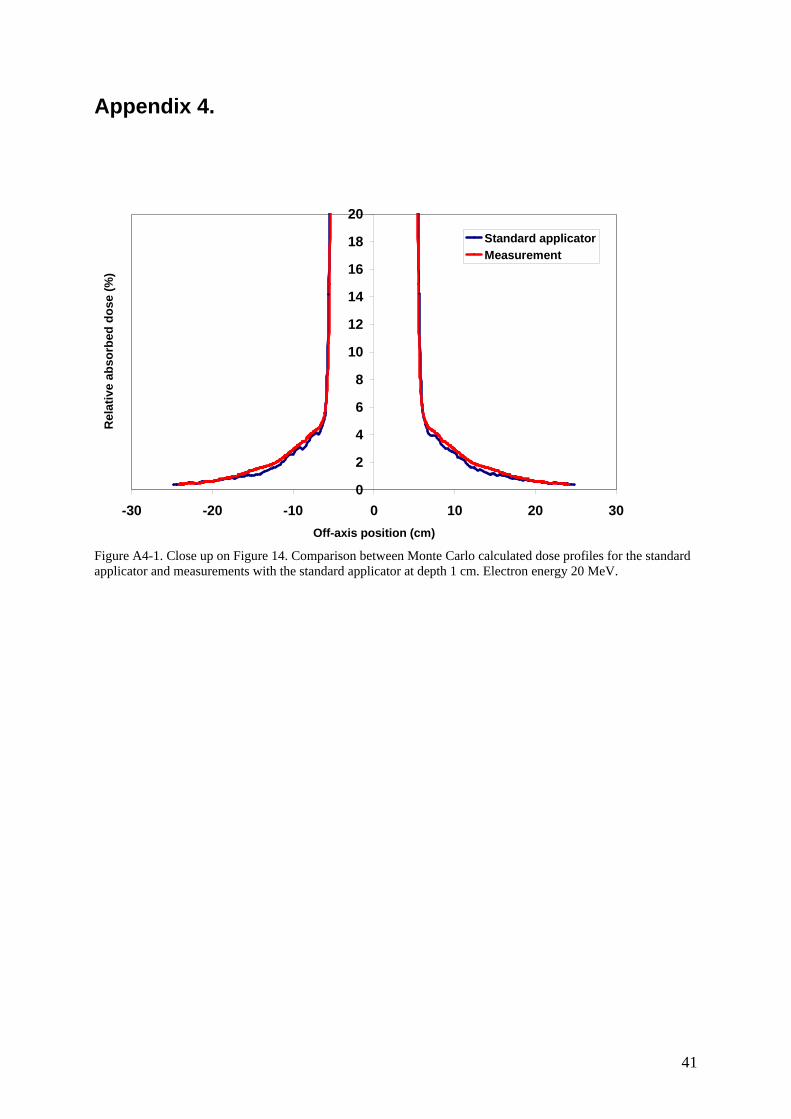
Figure A4-1. Close up on Figure 14. Comparison between Monte Carlo calculated dose profiles for the standard applicator and measurements with the standard applicator at depth 1 cm. Electron energy 20 MeV.
0
2
4
6
8
10
12
14
16
18
20
-30 -20 -10 0 10 20 30Off-axis position (cm)
Rel
ativ
e ab
sorb
ed d
ose
(%)
Standard applicatorMeasurement

42
Figure A4-2. Close up on Figure 15. Comparison between Monte Carlo Calculated dose profiles for standard applicator and modified applicator at depth 1 cm. Electron energy 20 MeV.
Figure A4-3. Close up on Figure 17. Comparison between Monte Carlo calculated dose profiles for the standard applicator and the modified applicator at depth 5.8 cm (equal to the R90-depht, 90% of dose maximum). Electron energy 20 MeV.
0
2
4
6
8
10
12
14
16
18
20
-30 -20 -10 0 10 20 30Off-axis position (cm)
Rel
ativ
e ab
sorb
ed d
ose
(%)
Standard applicatorModified applicator
0
2
4
6
8
10
12
14
16
18
20
-30 -20 -10 0 10 20 30Off-axis position (cm)
Rel
ativ
e ab
sorb
ed d
ose
(%)
Standard applicatorModified applicator

43
6. Summary in Swedish Linjäracceleratorer används för att producera foton- och elektronstrålning vid strålbehandling. Elektronstrålning framförallt till att behandla ytligt liggande tumörer, medan fotonstrålning används för behandling av mer djup liggande lesioner. Eftersom elektroner växelverkar och sprids markant i luften mellan behandlingshuvudet och patienten, är det nödvändigt att kollimera elektronstrålen med hjälp av en applikator som man fäster på strålhuvudet. Det nuvarande applikatorsystemet för Elektas linjäracceleratorer uppfyller inte de internationella rekommendationerna (IEC 1998) för strålningsläckage utanför applikatorn. Tillsammans med Elekta arbetar Radiofysik vid Universitetsjukhuset i Lund med att förbättra designen på applikatorn för att minska strålningsläckaget, med bibehållen god strålfältskarakteristik inne i behandlingsfältet. För att undersöka det befintliga applikatorsystemet och utvärdera en modifierad variant av applikatorn har vi använt oss av Monte Carlo-beräkningar. En Elekta SLi Plus linjäraccelerator och dess tillhörande applikatorsystem har modellerats i Monte Carlo-koden BEAMnrc. Strålfältskarakteristiken hos applikatorsystemet undersöktes och möjliga vägar till en förbättrad konstruktion fastställdes. Vi valde att undersöka karakteristiken hos applikatorn med storleken 10×10 cm2 och för energin 20 MeV, eftersom denna kombination ger ett tämligen högt strålningsläckage och är vanlig vid patientbehandlingar. Applikatorn är uppbyggd av fyra olika ”scrapers” (nivåer), se bilden till höger. Första nivån består av aluminium (närmast strålhuvudet), andra nivån av aluminium och bly, tredje nivån av bly och aluminium och den sista nivån består av aluminium och bly. I Monte Carlo koden som används är det möjligt att spåra partiklarnas historia, dvs man kan få information om var varje partikel har växelverkat. Med hjälp av denna information kan den relativa dosfördelningen från olika acceleratorkomponenter beräknas. Vi kunde med hjälp av detta verifiera att strålningsläckaget kom ifrån applikatorn och inte från andra delar av acceleratorn. Det visade sig också att det var den tredje nivån i applikatorn som bidrog mest till läckagestrålningen. För att minska strålningsläckaget ändrade vi plats på bly och aluminium i den tredje nivån i applikatorn. Denna enkla modifieringen av applikatorn resulterade i ett minskat strålningsläckage som uppfyller IEC rekommendationerna. Framtida studier kommer att omfatta fortsatt modifiering av elektronapplikatorn i syfte att ytterligare förbättra karakteristiken inne i strålfältet med bibehållet lågt strålningsläckage.