Embed Size (px)
Citation preview

Montana Highway Patrol
2013 Annual Report
Prepared by the
Montana Highway Patrol

Montana Highway Patrol 2012 Annual Report
Table of Contents
Content Page Table of contents Attorney General Tim Fox Colonel Tom Butler Division Goals Mission Statement Core Values Montana Highway Patrol District Map Montana Highway Patrol Districts District 1—Missoula 1 District 2—Great Falls 2 District 3—Butte 3 District 4—Billings 4 District 5—Glendive 5 District 6—Kalispell 6 District 7—Bozeman 7 District 8—Havre 8 Strategic Traffic Enforcement Team 9 Highway Patrol Activity 10 General Crash Information Annual Traffic Rates 11 Where Crashes Occurred 12 Crashes by County 13 Crashes by Day of Week 14 Crashes by Month 15 Crashes by Light Condition 16 Crashes by Road Condition 17 Crashes by Weather Condition 18 Crashes by Trafficway 19 Crashes by Collision 20

Vehicle Information Vehicles by First Harmful Event 21 Vehicles by Most Harmful Event 22 Vehicles by Body Style 23 Motorcycle Crashes 24 Helmet Use 25 Occupant Information Driver‐Related Contributing Circumstances 26 Top 10 Contributing Circumstances Chart 27 Drivers by Belt Use 28 Non‐Drivers by Belt Use 29 Crash/Injury Severity Daylight Hours 30 Crash/Injury Severity Non‐Daylight Hours 31 Drivers by Age and Sex Chart Fatality Information Fatalities by Age and Sex Chart Fatalities by County 1935‐2010 32‐40 Fatal Calendar 41 Fatalities during Major Holiday Periods 42 Total Fatalities Chart 2001‐2020 43

ATTORNEY GENERALSTATE OF MONTANA
TELEPHONE: (406) 444-2026 FAX: (406) 444-3549 E-MAIL: [email protected]
MONTANA DEPARTMENT OF JUSTICELegal Services Division Division of Criminal Investigation Highway Patrol Division Forensic Sciences Division
Gambling Control Division Motor Vehicle Division Information Technology Services Division Central Services Division
Tim FoxAttorney General
Department of Justice215 North SandersPO Box 201401Helena, MT 59620-1401
Fellow Montanans,
One of the greatest privileges afforded me as Attorney General is overseeing the Montana Highway Patrol. The men and women who don the green and tan uniform every day and risk their lives to keep our highways safe are some of the finest, most professional law enforcement officers I have ever known. I have met many of them during their earliest academy days, shaken their hands at graduation, and seen them work in the field. I have been impressed at every turn.
In the past year, Montana has seen a 30% decline in alcohol-related roadway fatalities. I have no doubt this is due in large measure to the hard work and diligent efforts of our Troopers. They have seen the impacts of drunk driving up-close – the lives lost, livelihoods destroyed, and property smashed beyond recognition. Like the rest of us, they have family and friends who travel Montana’s roads. Like the rest of us, they have a vested interest in keeping those roads free of drunk drivers. But unlike most of us, their jobs give them a unique ability to combat this profound threat to public safety.
We also know that credit goes to the 24/7 Sobriety Program, which has created an unparalleled mechanism for holding repeat offenders accountable. While I am pleased to say that most Montanans live in counties with operational 24/7 programs, more work must be done to expand the program throughout the state. I am committed to this great task and am delighted to be working with Colonel Tom Butler, our Highway Patrol chief, to make it happen. He has been instrumental in bringing 24/7 to Montana and making it such an effective, life-saving program across the state.
As a husband, father, and grandfather, when it comes to protecting my home I want only the best. As Montana’s Attorney General, when it comes to protecting our great state I know we have the best men and women guarding our highways. Please join me in thanking the Troopers of the Montana Highway Patrol for all they do to help keep us safe and make our home The Last Best Place.
Sincerely,
Tim Fox


• •

HP is about. Service is "to be of assistance to." This can takeof Montana Service to those passing through our state Ser

2
District II – Great Falls
812 14th Street North Great Falls, MT 59401-5595
Phone: (406) 453-1121 Fax: (406)454-2119 Commander Captain Robert Armstrong Detachments 212 Great Falls Sgt. Ben Havron (406) 453-1121
213 Great Falls Sgt. Shawn Hazelton (406) 453-1121 222 Lewistown Sgt. Josef Kinsey (406) 538-8718
2012 2013
Population 109,354 109,354 FTE Uniform Positions 22 22 Vehicle Miles Driven 608,153 568,862 Calls for Service 15,579 14,493 Citizen Assists 365 507 Crashes Investigated 900 784 Traffic Stops 12,862 11,153 Total Citations 8,791 7,506 Total Warnings 14,765 12,285 Fatal Crashes in Area 13 15

3
District III - Butte
3615 Wynne Butte, MT. 59701
Phone: (406) 494-3233 Fax: (406) 494-8264
Commander Captain Gary Becker Detachments 311 Butte Acting Sgt. Michael Rhodes (406) 533-6622 313 Butte Sgt. Mark Wilfore (406) 533-6623 321 Helena Sgt. Jay Nelson (406) 442-0477 322 Helena Sgt. Alex Betz (406) 442-0478
2012 2013 Population 139,458 139,458 FTE Uniform Positions 29 29 Vehicle Miles Driven 914,766 788,516 Calls for Service 25,647 27,717 Citizen Assists 536 452 Crashes Investigated 1,583 1,511 Traffic Stops 20,243 18,249 Total Citations 11,826 12,010 Total Warnings 16,946 15,752 Fatal Crashes in Area 24 25

4
District IV - Billings 615A South 27 Street Billings, MT 59101
Phone: (406) 896-4351 Fax: (406) 896-4355
Commander Captain Keith Edgell
Detachments
421 Billings Sgt. Scott Ayers (406) 896-4357 422 Billings Sgt. Craig Baum (406) 896-4359
423 Columbus Sgt. Tony Beehler (406) 322-6173 424 Billings Sgt. John O’Neill (406) 896-4358 2012 2013
Population 187,870 187,870 FTE Uniform Positions 32 32 Vehicle Miles Driven 840,790 835,368 Calls for Service 20,584 23,036 Citizen Assists 640 669 Crashes Investigated 1,442 1,679 Traffic Stops 13,496 12,750 Total Citations 11,255 10,050 Total Warnings 12,082 12,011 Fatal Crashes in Area 35 38

5
District V - Glendive 76 Highway 16
Glendive, MT 59330 Phone: (406) 377-5238 Fax: (406) 377-8504
Commander Captain Edward Hilbert Detachments
511 Glendive Sgt. James Hunter (406) 377-5238 511 Wolf Point Sgt. Jeffrey Kent (406) 653-6708 512 Miles City Sgt. Daniel Martin (406) 874-3395 514 Sidney Sgt. Troy Muri (406) 433-4475
2012 2013 Population 77,017 77,017 FTE Uniform Positions 28 33 Vehicle Miles Driven 774,401 921,699 Calls for Service 22,624 23,673 Citizen Assists 535 863 Crashes Investigated 737 917 Traffic Stops 18,886 18,591 Total Citations 12,695 11,749 Total Warnings 18,027 20,152 Fatal Crashes in Area 31 25

6
District VI - Kalispell 121 Financial Drive, Suite D
Kalispell, MT 59901 Phone: (406) 755-6688 Fax: (406) 756-6606
Commander
Captain Steve Lavin Detachments 621 Libby Sgt. Shawn Smalley (406) 293-5150
622 Kalispell Sgt. Roy Christensen (406) 755-6688 623 Polson Sgt. Randal Owens (406) 883-4766 624 Kalispell Sgt. James Sanderson (406) 755-6688
2012 2013 Population 140,110 140,110 FTE Uniform Positions 31 31 Vehicle Miles Driven 681,535 640,501 Calls for Service 18,508 20,517 Citizen Assists 492 608 Crashes Investigated 1,679 1,846 Traffic Stops 15,564 13,823 Total Citations 8,201 8,393 Total Warnings 18,006 16,211 Fatal Crashes in Area 23 34
Population

7
District VII - Bozeman 1045 Reeves Road East, Suite B
Bozeman, MT 59718 Phone: (406) 587-4525 Fax: (406) 587-4534
Commander Captain Art Collins
Detachments 712 Bozeman Sgt. Patrick McLaughlin (406) 587-4525 721 Bozeman Sgt. Patrick McCarthy (406) 587-4525 723 Bozeman Sgt. Marvin Reddick (406) 587-4525 725 Livingston Sgt. Eric Gilbert (406) 222-4618 2012 2013 Population 123,594 123,594 FTE Uniform Positions 29 29 Vehicle Miles Driven 841, 711 824,717 Calls for Service 19,073 21,888 Citizen Assists 321 317 Crashes Investigated 1,468 1,587 Traffic Stops 13,430 13,937 Total Citations 7,099 8,222 Total Warnings 14,444 14,839 Fatal Crashes in Area 27 16

8
District VIII - Havre
1708 Second Street West, Suite A Havre, MT 59501
Phone: (406)-265-6420 Fax: (406)-265-6430 Commander
Captain Duane Bowers Detachments
811 Shelby Sgt. Robert Bender (406) 424-8778 821 Havre Sgt. Jason Wickum (406) 265-6420
2012 2013 Population 60,569 60,569 FTE Uniform Positions 17 17 Vehicle Miles Driven 561,965 574,244 Calls for Service 13,130 13,530 Citizen Assists 502 472 Crashes Investigated 610 578 Traffic Stops 10,448 9,997 Total Citations 7,223 6,964 Total Warnings 10,128 9,921 Fatal Crashes in Area 18 20

9
SAFETY ENFORCEMENT TRAFFIC TEAM (SETT)
Sgt Derek Brown Sgt Sean Finley Trooper Lynwood Bateman Trooper Jeremy Lee Trooper Barry Mitchell Trooper Richard Salois Trooper Jonathan Scheer In 2013 the name for the STET team of the Montana Highway Patrol was changed to Safety Enforcement Traffic Team (SETT). Funded by the Department of Transportation, Highway Traffic Safety Division, this team of troops consists of 5 full-time troopers and 2 sergeants. The SETT team provides high visibility enforcement to selected areas and regions of the state using strategically deployed, aggressive, inter-agency enforcement patrols. The team bolsters high visibility enforcement efforts to educate the public about a variety of behaviors that contribute to traffic crashes, including the dangers of speeding, impaired driving, aggressive driving, distracted/inattentive driving, and the lack of safety belt usage. SETT enforcement has had a very positive effect on the areas patrolled, the 3,798 hours of concentrated enforcement during fiscal year 2013 yielded:
2012 2013 Suspended licenses 94 198 Uninsured motorists 129 109 Seat belt citations 328 1,151 DUI and drug arrests 50 94 Speed citations 1,427 1,023 Speed warnings 1,840 1,345 Total citations and warnings 6,672 10,286 Total citizen contacts 4,370 4,799

2,486 2,283 2,578 2,177 1,979 2,005
471 339 769 578 545 637
37,639 37,921 39,222 35,314 37,068 35,983
9,399 10,483 11,517 11,038 9,202 7,739
12,916 11,492 12,039 10,552 8,797 10,515
68,710 80,079 85,089 78,452 78,610 76,759
85,832 123,579 160,716 151,552 139,528 126,760
Stolen Vehicles Recovered 23 20 23 4 29 37
Warrants Served 1,238 895 834 455 392 507
Traffic Stops 106,522 116,906 106,146 95,959 118,622 115,147
11,499 13,230 13,361 10,291 9,165 9,611
7,897 8,807 8,513 5,932 5,771 6,746
15,848 13,333 8,441 6,219 5,651 6,174
6,977 7,841 9,323 6,783 6,805 7,363
123 107 622 442 440 411
661 678 392 870 958 1,235
685 529 429 312 336 296
19 11 4 7 10 17
66,908 63,627 54,620 52,304 156,784 173,171
5,817,503 5,538,996 6,529,534 5,736,271 6,160,140 6,127,618
4,585 4,737 4,243 4,253 4,059 4,206School Bus Inspections
Total Warnings
2012
2008 2012
Total Miles Driven
Illegal Drug Arrests
Illegal Possession, Alcohol
Safety Education Talks
Number of:
Furn. Liquor to a Minor
Calls for Service
2010
Seat Belt
Total Citations
D.U.I./Per Se
20112009
Highway Patrol Activity
20092008Citations
Issued2010 2011 2013
2013
Assist Public
Assist Other Gvt. Agency
Investigations - Traffic non-accident
Assist Other Law Enf.
Speed - Basic Rule
Speed - Over Legal
Liability Insurance
10

More Crashes Occurred:
More Fatal Crashes Occurred:
11
On Saturday than any other day of the week.
In August than any other month of the year.
* 58 Crashes (avg.) per day * 20 Persons injured (avg.) per day
When Crashes Occurred
On Friday than any other day of the week.
In December than any other month of the year.
* 639 Private property crashes
Between 3:00 p.m. and 4:00 p.m. than any other hours of the day.
Between 9:00 p.m. and 10:00 p.m. than any other hours of the day.
Annual Traffic Rates 2013
* One crash every 25 minutes
Reported Crashes Up 4%
* One fatality every 38 hours
* One injury every 74 minutes
* 15,703 Property damage only crashes * One PDO crash every 33 minutes
Fatalities Up 10%
* 229 Fatalities in 203 fatal crashes
* 7,131 Injuries in 5,249 injury crashes
* 21,155 Crashes reported
Injuries Down 5%

Fatal *Percent Total *PercentCrashes Change Crashes Change
37 0.00% 4,672 2.60%
85 15.00% 7,303 -3.00%
11 -62.00% 1,423 -4.50%
35 14.00% 1,157 4.50%
35 31.00% 6,445 19.30%0 0.00% 155 -62.00%
203 5.50% 21,155 4.00%
51%
49%
Male 17,590 Drivers InvolvedFemale 12,296Not Stated 973
Total 30,859
ROADS 2009 2010 2011 2012 2013
Interstate 82.90% 87.00% 84.40% 82.80% 82.00%
Primary 83.90% 81.20% 80.90% 80.10% 67.80%
Secondary* 78.00%
Urban/City 64.90% 64.70% 67.60% 65.70% 67.60%
Other 75.60% 74.10% 68.80% 70.50% 61.30%
All Roads 79.20% 78.90% 76.90% 76.30% 79.00%
Source: State Highway Traffic Safety Bureau, MT. Dept. of Transportation
12
* New Category starting in 2013
Seat Belt Usage Rates
* Percent change is the percent increase (+) or decrease (-) from the previous year.
Highway Patrol
Other Agencies
Where Crashes Occurred 2013
Interstate Highways
Where
Unknown
Primary Highways
Rural Routes
Secondary Routes
Urban Streets
Crashes Investigated By
Total


Beaverhead 164 3 45 116 McCone 21 1 10 10Big Horn 172 8 66 98 Meagher 27 1 14 12Blaine 59 1 22 36 Mineral 237 4 74 159Broadwater 129 2 33 94 Missoula 2,236 15 613 1,608Carbon 215 2 58 155 Musselshell 82 0 20 62
Carter 2 0 1 1 Park 367 1 70 296Cascade 2,021 10 445 1,566 Petroleum 11 1 6 4Choteau 76 2 19 55 Phillips 80 1 20 59Custer 289 2 57 230 Pondera 88 3 29 56Daniels 25 0 4 21 Powder River 54 1 15 38
Dawson 270 4 47 219 Powell 183 3 39 141Deer Lodge 88 2 26 60 Prairie 44 1 12 31Fallon 40 0 5 35 Ravalli 620 8 162 450Fergus 225 2 51 172 Richland 558 7 77 474Flathead 1,785 19 497 1,269 Roosevelt 138 1 48 89
Gallatin 1,760 8 436 1,316 Rosebud 136 4 38 94Garfield 26 1 11 14 Sanders 190 3 74 113Glacier 133 10 40 83 Sheridan 95 1 20 74Golden Valley 17 0 6 11 Silver Bow 610 7 110 493Granite 122 2 33 87 Stillwater 260 4 60 196
Hill 333 1 55 277 Sweet Grass 128 3 26 99Jefferson 352 3 91 258 Teton 80 1 22 57Judith Basin 51 0 7 44 Toole 130 2 17 111Lake 499 9 122 368 Treasure 36 0 11 25Lewis & Clark 1,571 5 358 1,208 Valley 82 2 23 57
Liberty 11 0 6 5 Wheatland 23 1 12 10Lincoln 239 6 78 156 Wibaux 32 0 5 27Madison 181 4 45 132 Yellowstone 3,751 21 958 2,772
Totals 21,155 203 5,249 15,703
13
Injury Crashes
Prop Dam Crashes
Crashes by County 2013
County CountyAll
CrashesFatal
Crashes Injury
CrashesProp Dam Crashes
All Crashes
Fatal Crashes

Saturday 32 29 35 38 40
Sunday 32 29 30 19 38
Monday 24 22 25 25 22
Tuesday 26 11 23 20 25
Wednesday 33 21 25 27 26
Thursday 23 23 24 28 18
Friday 28 26 25 35 34
Total 198 161 187 192 203
Saturday 2,832 2,761 2,946 2,334 2,753
Sunday 2,410 2,169 2,350 2,883 2,487
Monday 2,994 2,847 3,071 2,961 3,324
Tuesday 3,016 3,096 2,897 2,840 3,026
Wednesday 3,150 3,032 2,975 3,005 2,971
Thursday 3,012 2,975 2,930 3,466 3,122
Friday 3,515 3,638 3,467 2,806 3,472
Total 20,929 20,518 20,636 20,295 21,155
14
2013
Fatal Crashes
Crashes by Day-of-Week
All Crashes
20132012
Day of Week
Day of Week
2010 201220112009
2009 2010 2011

January 6 6 5 10 13
February 12 6 9 10 10
March 18 11 5 10 17
April 18 12 14 15 16
May 15 14 9 13 15
June 21 14 13 29 18
July 27 25 27 25 15
August 19 13 32 27 29
September 21 22 15 18 18
October 13 12 24 15 26
November 8 14 15 11 14
December 20 12 19 9 12
Total 198 161 187 192 203
January 1923 2082 2102 1795 2109
February 1478 1494 2114 1547 1395
March 1794 1191 1436 1469 1377
April 1422 1337 1259 1286 1436
May 1506 1479 1359 1481 1542
June 1638 1598 1485 1697 1652
July 1776 1782 1782 1659 1805
August 1717 1710 1745 1698 1779
September 1700 1574 1698 1616 1640
October 1810 1575 1627 1762 1908
November 1826 2382 2166 2041 1967
December 2339 2314 1863 2244 2545
Total 20929 20518 20636 20295 21155
15
All Crashes
2013
Crashes by Month
Month 2012 2013
Month 2012
20102009
2009 2010 2011
2011
Fatal Crashes

Dark-Lighted 9 13 14 6 16
Dark-not Lighted 73 56 65 74 78
Dawn 3 7 1 3 1
Daylight 107 78 99 98 104
Dusk 5 7 7 9 4
Unknown 1 0 1 2 0
Total 198 161 187 192 203
Dark-Lighted 1,956 1,864 1,830 1,960 1,875
Dark-not Lighted 3,983 4,071 4,155 4,324 4,426
Dawn 325 353 393 352 424
Daylight 14,027 13,630 13,562 12,949 13,693
Dusk 466 428 500 522 488
Unknown 172 172 196 188 249
Total 20,929 20,518 20,636 20,295 21,155
16
2013Light Condition 2012
Crashes by Light Condition
Fatal Crashes
Light Condition 2012
All Crashes
2009 2010 2011
2009 2010 2011 2013

Dry 156 128 142 169 162
Wet, Water 11 15 16 11 18
Snow or Slush 8 2 9 0 7
Ice 14 11 12 11 11
Sand, Mud, Dirt, Oil 9 3 8 0 2
Debris 0 0 0 0 0
Loose Gravel 0 1 0 0 0
Other 0 1 0 1 0
Unknown 0 0 0 0 3
Total 198 161 187 192 203
Dry 13,527 12,461 12,901 14,085 13,896
Wet, Water 1,703 2,077 1,954 1,710 1,813
Snow or Slush 2,280 2,454 2,350 1,884 2,193
Ice 2,740 2,995 2,928 2,108 2,772
Sand, Mud, Dirt, Oil 527 310 347 361 292
Debris 5 6 0 0 0
Loose Gravel 99 65 0 0 0
Other 33 28 28 28 26
Unknown 15 122 128 119 163
Total 20,929 20,518 20,636 20,295 21,155
17
2013Road
Condition2012
Crashes by Road Condition
Road Condition
Fatal Crashes
2012
All Crashes
20132009 2010 2011
2009 2011

Clear 132 88 110 122 119
Cloudy 45 55 54 56 62
Fog, Smog, Smoke 0 1 2 3 1
Rain 10 6 8 4 6
Snow 6 3 8 2 7
Blowing Snow 3 5 4 0 4
Severe Crosswinds 1 1 1 0 0
Unknown 0 1 0 3 3
Total 198 161 187 192 203
Clear 12,765 10,714 10,686 11,045 11,530 Cloudy 5,143 6,154 6,576 6,123 6,272 Fog, Smog, Smoke 116 170 78 219 130 Rain 632 888 921 636 769
Snow 1,556 1,765 1,497 1,545 1,620 Blowing Snow 334 374 398 268 349 Severe Crosswinds 55 76 105 86 74
Unknown 157 201 220 228 262
Total 20,929 20,518 20,636 20,295 21,155
18
Blowing Sand, Soil, Dirt
4
Sleet, Hail, Freezing Rain, Drizzle
Weather Conditions
2012
3 1 5
2009 2010 2011
168
Crashes by Weather Conditions
Fatal Crashes
Weather Conditions
2012 20132009 2010 2011
All Crashes
Blowing Sand, Soil, Dirt
Sleet, Hail, Freezing Rain, Drizzle
0
2 0
1
011
000
2013
145
4
175 150 141

Interstate 36 31 42 37 37
U.S. Route 81 68 96 72 85
State Route 28 31 14 30 35
County Road 38 16 21 29 11
City Street 15 15 13 24 35
Other 0 0 1 0 0
Total 198 161 187 192 203
Interstate 2,589 2,556 4,710 4,552 4,672
U.S. Route 5,667 5,407 7,804 7,527 7,303
State Route 5,477 5,666 1,103 1,106 1,157
County Road 1,992 1,637 1,546 1,490 1,423
City Street 5,096 5,028 5,233 5,207 6,445
Other 108 224 240 413 155
Total 20,929 20,518 20,636 20,295 21,155
19
Crashes by Trafficway
Trafficway
Fatal Crashes
20122009 2010 2011
Trafficway
All Crashes
2012
2013
20132009 2010 2011

4,323 20.43% 10 4.93% 1,141 21.74%
1,518 7.18% 1 0.49% 137 2.61%
506 2.39% 3 1.48% 91 1.73%
168 0.79% 0 0.00% 43 0.82%
308 1.46% 2 0.99% 108 2.06%
3,582 16.93% 17 8.37% 1,010 19.24%
91 0.43% 0 0.00% 10 0.19%
30 0.14% 0 0.00% 5 0.10%
392 1.85% 26 12.81% 155 2.95%
697 3.29% 5 2.46% 94 1.79%
9,540 45.10% 139 68.47% 2,455 46.77%
21,155 100.00% 203 100.00% 5,249 100.00%
28,390 92.00% 174 63.74% 7,126 88.53%
1,520 4.93% 58 21.25% 599 7.44%
116 0.38% 1 0.37% 51 0.63%
190 0.62% 28 10.26% 75 0.93%
0 0.00% 0 0.00% 0 0.00%
644 2.09% 12 4.40% 198 2.46%
30,860 100.00% 273 100.00% 8,049 100.00%
20
Unknown
Single Vehicle
Total
Drivers by Police Reported Alcohol/Drugs Presence 2013
Not Reported
Police Reported Alcohol / Drugs Presence
Drivers in All
Crashes
Drivers in Fatal
Crashes
Drivers in Injury
Crashes
Total
Neither Alcohol nor Drugs
Alcohol Present
Drugs Present
Alcohol and Drugs Present
Other
Rear End
Sideswipe, Same Direction
Collision Type
Sideswipe, Opposite Direction
Left Turn, Same Direction
Head-On
Crashes by Collision 2013
Left Turn, Opposite Direction
Right Angle
Right Turn, Opposite Direction
All Crashes Fatal Crashes Injury Crashes
Right Turn, Same Direction

MONTANA HIGHWAY PATROL DISTRICTSMONTANA HIGHWAY PATROL DISTRICTS
Scale in Kilometers
Scale in Miles
10 0 10 20 30 40 505
10 0 10 20 30 40 505
PREPARED BY THESTATE OF MONTANA
DEPARTMENT OF TRANSPORTATIONROAD INVENTORY AND MAPPING SECTIONCreated January 2014 in ArcGIS 10.2 using ArcMap. Esri, Inc.
NAD 1983 StatePlane Montana FIPS 2500Lambert Conformal Conic
L i n c o l n
F l a t h e a d
S a n d e r sL a k e
G l a c i e r
M i n e r a l
M i s s o u l a
R a v a l l i
B e a v e r h e a d
L e w i sa n d
C l a r k
J e f f e r s o nG r a n i t e
P o w e l l
D e e rL o d g e
S i l v e r B o w
M a d i s o n
G a l l a t i nP a r k
S w e e t G r a s s
B r o a d -w a t e r
M e a g h e r
W h e a t l a n d
T o o l e
L i b e r t y
H i l l
C h o u t e a u
C a s c a d e
T e t o n
J u d i t hB a s i n
P o n d e r a
B l a i n eP h i l l i p s V a l l e y
F e r g u sP e t r o l e u m G a r f i e l d
D a n i e l s S h e r i d a n
R o o s e v e l t
M c C o n e
R i c h l a n d
D a w s o n
P r a i r i eW i b a u x
G o l d e nV a l l e y
M u s s e l s h e l l
Y e l l o w s t o n e
S t i l l -w a t e r
C a r b o nB i g H o r n
F a l l o n
C a r t e rP o w d e rR i v e r
C u s t e r
T r e a s u r e
R o s e b u d
Map Legend
County
MHP Districts
Montana Highway PatrolDistrict Number4

All Fatal Injury All Fatal InjuryCrashes Crashes Crashes Crashes Crashes Crashes
183 0 71
76 1 6 71 1 23
837 34 313 187 0 23
42 3 14 65 1 19
10 0 2 236 5 43
102 1 27 4 0 1
17 2 13 64 0 6
77 0 2 Motor Vehicle in Transport 20,995 84 5,362
4 0 0 249 1 37
108 0 14 148 1 20
367 8 119 127 1 20
442 9 218 31 0 9
110 0 21 1,851 0 139
1,145 19 389 185 1 153
2,262 62 787 159 19 124
21 0 10 12 0 4
23 0 1 51 0 4
8 0 2 74 1 12
71 3 13 126 1 14
8 1 2
188 2 30 134 1 34
2,087 8 173 222 0 36
13 0 1 16 0 9
17 0 4
63 0 11
2 0 0
105 0 26
14 0 6
147 0 38 33,556 270 8,405
21
Culvert
Curb
Parked Motor Vehicle
Pedalcycle
Total
Concrete Traffic Barrier
Animal Domestic
Animal Wild
Ran Off Roadway
Separation of Units
Cargo/Equipment Loss or Shift
Downhill Runaway
Immersion
Other Non-collision
Vehicles by First Harmful Event 2013
First HarmfulEvent
Non-Collision
First HarmfulEvent
Impact Attenuator
Guardrail Face
Embankment
Ditch
Cross Centerline
Cross Median
Cable Barrier
Mail Box
Reentering Roadway
Equipment Failure
Fell/Jumped from Motor Vehicle
Collision With
Bridge Overhead Structure
Bridge Pier or Support
Jackknife
Fire/Explosion
Overturn/Rollover
Ran off Roadway Left
Ran off Roadway Right
Unknown
Other Fixed Object
Other Object, not Fixed
Thrown or Falling Object
Bridge Rail
Other Traffic Barrier
Guardrail End
Fence
Utility Pole/Light Support
Work Zone/Maintenace Equipment
Traffic Sign Support
Traffic Signal Support
Pedestrian
Railway Train
Rock or Boulder
Tree
Struck by Falling or Shifting Cargo
Other Post/Pole or Support

22
All Fatal Injury All Fatal InjuryCrashes Crashes Crashes Crashes Crashes Crashes
461 2 137
63 0 3 318 5 116
0 0 0 672 0 74
0 0 0 167 1 51
0 0 0 428 4 76
0 0 0 9 0 2
18 2 15 79 0 8
99 0 8 Motor Vehicle in Transport 21,372 121 5,471
21 0 2 380 1 85
104 0 5 155 1 21
156 1 33 177 0 21
2,415 87 1,231 26 0 1
0 0 0 1,872 2 153
0 0 0 185 1 154
0 0 0 165 21 127
0 0 0 13 1 4
0 0 0 102 0 19
7 0 1 69 0 14
93 1 16 182 0 19
16 1 3
180 2 28 481 10 151
2,029 4 149 362 1 79
27 0 2 19 0 8
13 1 5
102 0 17
59 0 3
195 0 51
61 0 21
49 0 8 33,401 270 8,395
Thrown or Falling Object
Bridge Rail
Other Traffic Barrier
Guardrail End
Fence
Utility Pole/Light Support
Work Zone/Maintenace Equipment
Traffic Sign Support
Traffic Signal Support
Pedestrian
Railway Train
Rock or Boulder
Tree
Struck by Falling or Shifting Cargo
Other Post/Pole or Support
Cable Barrier
Mail Box
Reentering Roadway
Equipment Failure
Fell/Jumped from Motor Vehicle
Collision With
Bridge Overhead Structure
Bridge Pier or Support
Jackknife
Fire/Explosion
Overturn/Rollover
Ran off Roadway Left
Ran off Roadway Right
Unknown
Other Fixed Object
Other Object, not Fixed
Cargo/Equipment Loss or Shift
Downhill Runaway
Immersion
Other Non-collision
Vehicles by Most Harmful Event 2013
Most HarmfulEvent
Non-Collision
Most HarmfulEvent
Impact Attenuator
Guardrail Face
Embankment
Ditch
Cross Centerline
Cross Median
Culvert
Curb
Parked Motor Vehicle
Pedalcycle
Total
Concrete Traffic Barrier
Animal Domestic
Animal Wild
Ran Off Roadway
Separation of Units

Body Style All Crashes Fatal Crashes Injury Crashes
Passenger Car (Unknown)
Sport Utility 6,268 44 1,627
Passenger Van
(Vans and Mini Vans)
Cargo Van (10,000 lbs or less) 110 0 24
Pickup
Motorhome 69 0 12
School Bus 78 0 12
Transit Bus 16 0 3
Motor Coach 7 0 2
Other Bus 55 1 7
Motorcycle 456 33 347
Moped 5 0 3
Low Speed Vehicle
(Includes bicycles)
Other Light Trucks
(includes tow trucks in transit)
All Terrain Vehicle 86 5 63
Snowmobile 3 0 2
Medium/Heavy Trucks 1,277 20 276
Other
Snowplow 19 0 5
Unknown 461 1 44
Total 33,593 270 8,412
23
60 0 9
545 2 59
Vehicles by Body Style 2013
(Subcompact, compact, mid-size, large passenger cars and station wagons)
(Small and standard pickups and pickups with campers)
(includes Ambulances, fire trucks, farm tractors and machinery and construction
equipment-working and not)
13,974 83 3,412
1,466 8 371
8,483 73 2,006
155 0 128

4423234534379
Total Fatal Total Fatal Total Fatal
139 15 112 1 27 14
35 5 12 0 23 5
6 4 1 0 5 4
1 0 0 0 1 0
251 5 27 0 224 5
12 4 11 3 1 1
444 33 163 4 281 29
24
Persons Injured
* Rural = Statewide minus City
1
5
0Other Trafficways
Alcohol Present
Alcohol and Drugs Present
Drugs Present
*Rural
Total
32Total
Unknown
Statewide City
Not Reported
(drivers only)
Neither Alcohol nor Drugs Present
Motorcyclist Sobriety
11
442
City Streets
Total
68
198
50
40
75
Fatal
County Roads
Where Crash Occurred
Interstate Highways
U.S. Highways
3
15
8State Highways
Total CrashesFatal CrashesInjury CrashesPersons Killed
Motorcycle Crashes 2013

Used Not Used Not Used Not Used Not Used Not Used Not
4 6 0 0 2 5 0 0 2 1 0 0
2 1 0 1 0 1 0 0 2 0 0 0
3 5 0 0 0 2 0 0 3 3 0 0
25 20 1 1 12 13 1 1 13 7 0 0
30 42 0 4 10 24 0 1 20 18 0 3
117 146 7 14 22 58 0 2 95 88 7 12
27 16 3 0 4 5 0 0 23 11 3 0
0 0 0 0 0 0 0 0 0 0 0 0
208 236 11 20 50 108 1 4 158 128 10 15
Used Not Used Not Used Not Used Not Used Not Used Not
1 2 0 0 0 2 0 0 1 0 0 0
2 0 0 0 0 0 0 0 2 0 0 0
0 0 0 0 0 0 0 0 0 0 0 0
0 4 0 0 0 3 0 0 0 1 0 0
1 4 0 1 0 2 0 0 1 3 0 1
17 21 1 2 1 6 0 0 16 15 1 2
2 3 0 1 0 1 0 0 2 2 0 1
0 0 0 0 0 0 0 0 0 0 0 0
23 34 1 4 1 14 0 0 22 21 1 4
25
* Rural = Statewide minus City
Total
25 to 34
35 to 64
65 & Over
Not Stated
20 to 24
65 & Over
Helmet Usage by Age of PassengerStatewide City *Rural
Age Fatal Total FatalTotal Fatal Total
14 & Under
15 to 17
18 to 19
Helmet Usage by Age of Driver 2013*Rural
Total FatalAge Total Fatal
Total
Statewide City
Total Fatal
Not Stated
14 & Under
15 to 17
18 to 19
20 to 24
25 to 34
35 to 64
26
Totals TotalFatals Totals Fatal Total Fatal Total Fatals Total Fatals Total Fatal
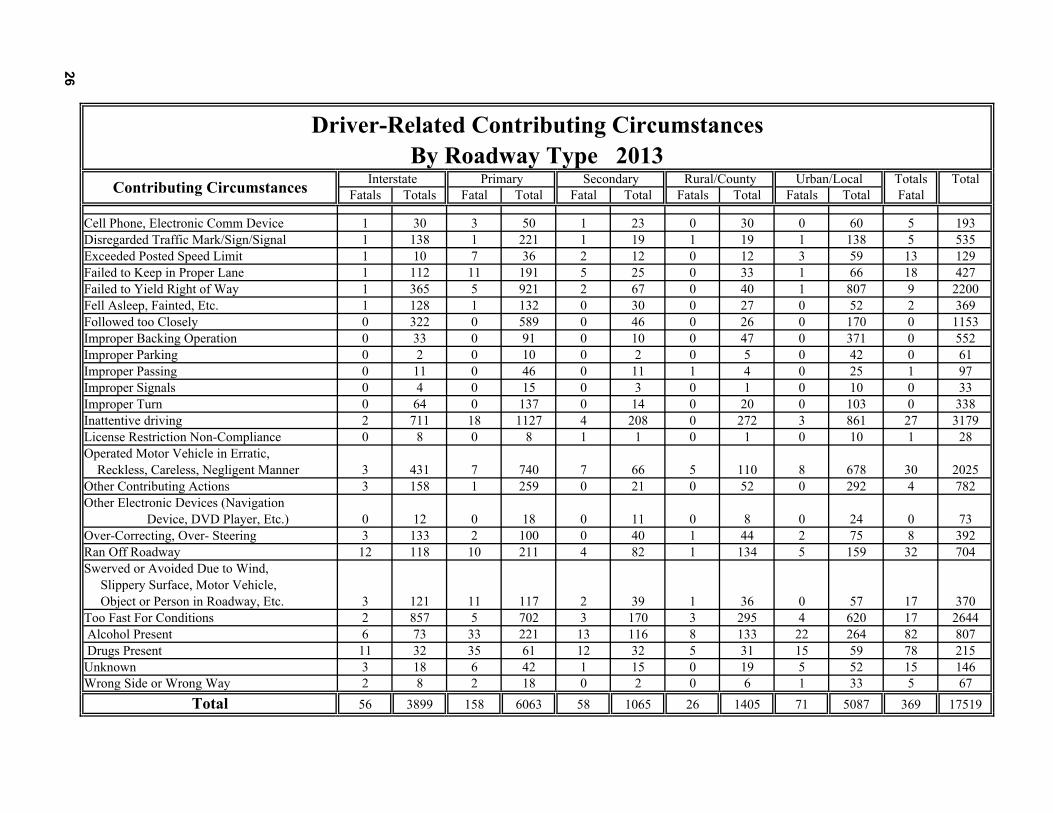
Cell Phone, Electronic Comm Device 1 30 3 50 1 23 0 30 0 60 5 193Disregarded Traffic Mark/Sign/Signal 1 138 1 221 1 19 1 19 1 138 5 535Exceeded Posted Speed Limit 1 10 7 36 2 12 0 12 3 59 13 129Failed to Keep in Proper Lane 1 112 11 191 5 25 0 33 1 66 18 427Failed to Yield Right of Way 1 365 5 921 2 67 0 40 1 807 9 2200Fell Asleep, Fainted, Etc. 1 128 1 132 0 30 0 27 0 52 2 369Followed too Closely 0 322 0 589 0 46 0 26 0 170 0 1153Improper Backing Operation 0 33 0 91 0 10 0 47 0 371 0 552Improper Parking 0 2 0 10 0 2 0 5 0 42 0 61Improper Passing 0 11 0 46 0 11 1 4 0 25 1 97Improper Signals 0 4 0 15 0 3 0 1 0 10 0 33Improper Turn 0 64 0 137 0 14 0 20 0 103 0 338Inattentive driving 2 711 18 1127 4 208 0 272 3 861 27 3179License Restriction Non-Compliance 0 8 0 8 1 1 0 1 0 10 1 28Operated Motor Vehicle in Erratic, Reckless, Careless, Negligent Manner 3 431 7 740 7 66 5 110 8 678 30 2025Other Contributing Actions 3 158 1 259 0 21 0 52 0 292 4 782Other Electronic Devices (Navigation Device, DVD Player, Etc.) 0 12 0 18 0 11 0 8 0 24 0 73Over-Correcting, Over- Steering 3 133 2 100 0 40 1 44 2 75 8 392Ran Off Roadway 12 118 10 211 4 82 1 134 5 159 32 704Swerved or Avoided Due to Wind, Slippery Surface, Motor Vehicle, Object or Person in Roadway, Etc. 3 121 11 117 2 39 1 36 0 57 17 370Too Fast For Conditions 2 857 5 702 3 170 3 295 4 620 17 2644 Alcohol Present 6 73 33 221 13 116 8 133 22 264 82 807 Drugs Present 11 32 35 61 12 32 5 31 15 59 78 215Unknown 3 18 6 42 1 15 0 19 5 52 15 146Wrong Side or Wrong Way 2 8 2 18 0 2 0 6 1 33 5 67
Total 56 3899 158 6063 58 1065 26 1405 71 5087 369 17519
Driver-Related Contributing CircumstancesBy Roadway Type 2013
Rural/County Urban/LocalInterstate Primary SecondaryContributing Circumstances

27
3,179
2,644
2,2002,025
1,153
807 782 704552 535
0
500
1,000
1,500
2,000
2,500
3,000
3,500
Top 10 Contributing Circumstances‐All Crashes
8278
3230
27
18 17 1715
13
0
10
20
30
40
50
60
70
80
90
AlcoholPresent
DrugsPresent
Ran OffRoadway
Drove inErratic,Reckless,Negligent
Inattentivedriving
Failed toKeep inProperLane
Too FastFor
Conditions
Swervedor Avoided
Unknown ExceededPostedSpeedLimit
Top 10 Contributing Circumstances‐Fatal Crashes

28
589 177 292 197 78 5 34 1,372
200 21 12 3 0 0 6 242
104 10 15 2 0 0 2 133
19,111 1,804 1,180 320 37 5 199 22,656
2 0 0 1 0 0 1 746
3955 21 142 50 4 0 1157 5,329
5 3 5 2 0 0 0 15
23,966 2,036 1,646 575 119 10 1,399 30,493
non-motorists (bicyclists, etc) since belt use does not apply to non-motorists.
Improper Use
Incapac. Injury
* The total number of drivers in this table will be smaller than the total number of drivers in other tables because this table excludes
Fatal InjuryDied Prior to Crash
Total
None Used
Total
Shoulder Belt Only
Use Unknown
Lap Belt Only
Shoulder & Lap Belt
Unknown
Other
Drivers by Belt Use/Injury Classification 2013
Restraint Use
No Injury
Possible Injury
Non-Incapac. Injury

424 95 172 131 35 0 17 874
55 1 5 0 0 0 1 62
212 16 21 8 0 0 2 259
6,978 645 447 123 11 0 42 8,246
1,355 68 40 5 2 0 15 1,485
4 0 0 0 0 0 0 4
1,027 129 41 23 1 0 75 1,296
16 1 8 6 0 0 0 31
10,071 955 734 296 49 0 152 12,257
29
Total
None Used
Shoulder Belt Only
Lap Belt Only
Non-Drivers by Belt Use/Injury Classification 2013
Restraint Use
No Injury
Possible Injury
Non-Incapac. Injury
Incapac. Injury
Fatal Injury
Died Prior to Crash
Unknown
Improper Use
* The total number of drivers in this table will be smaller than the total number of drivers in other tables because this table excludes
non-motorists (bicyclists, etc) since belt use does not apply to non-motorists.
Shoulder & Lap Belt
Child Safety Seat
Use Unknown
Total
Other

*All Roads
20 43 24 4 11 1 103
120 223 58 72 95 13 581
258 474 132 111 244 38 1,257
462 758 57 61 354 75 1,767
2,233 3,332 392 500 2,627 695 9,779
27 35 16 9 65 48 200
3,120 4,865 679 757 3,396 870 13,687
*AllRoads
62 193 99 16 32 6 408
338 604 143 180 250 39 1,554
588 1,325 331 240 294 103 2,881
1,291 2,273 164 143 1001 218 5,090
5,114 8,106 905 1,108 6288 1647 23,168
64 75 39 14 136 47 375
7,457 12,576 1,681 1,701 8,001 2,060 33,476
30
Property Damage Only
Number of Crashes
Number of Injuries
Unknown
Unknown
* All Roads Includes Interstate, Primary, Secondary, Rural and Urban*Injury severity does not include "died prior to accident".
Interstate Primary Secondary Rural Urban
Crash/Injury Severity During Daylight Hours 2013
Crash severity represents the most severe injury that was sustained by any person involved in a crash.
Interstate Primary Secondary Rural Urban
Injury severity represents the actual injuries sustained by all the people involved in a crash.
Total
Unknown
Unknown
Crash Severity
Incapacitating Injury
Non-incapacitating Injury
Fatal
Fatal
No Injury
Possible Injury
Possible Injury
Incapacitating Injury
* Injury Severity
Total
Non-incapacitating Injury

*All Roads
17 41 11 3 23 2 97
58 88 37 25 62 9 279
122 203 67 96 156 20 664
156 241 39 37 186 22 681
1,181 1,824 309 448 1,446 216 5,424
18 38 15 37 114 92 314
1,552 2,435 478 646 1,987 361 7,459
*AllRoads
50 106 41 19 70 8 294
153 199 93 61 140 19 665
256 473 126 193 347 56 1,451
392 626 77 81 409 50 1,635
2,160 3,525 511 775 2,742 395 10,108
38 74 32 57 181 40 422
3,049 5,003 880 1,186 3,889 568 14,575
31
Property Damage Only
Number of Crashes
Number of Injuries
Unknown
Unknown
* All Roads Includes Interstate, Primary, Secondary, Rural and Urban*Injury severity does not include "died prior to accident".
Interstate Primary Secondary Rural Urban
Crash/Injury Severity During Non-Daylight Hours 2013
Crash severity represents the most severe injury that was sustained by any person involved in a crash.
Interstate Primary Secondary Rural Urban
Injury severity represents the actual injuries sustained by all the people involved in a crash.
Total
Unknown
Unknown
Crash Severity
Incapacitating Injury
Non-incapacitating Injury
Fatal
Fatal
No Injury
Possible Injury
Possible Injury
Incapacitating Injury
* Injury Severity
Total
Non-incapacitating Injury

Drivers by Age and Sex - 2013
0
400
800
1200
1600
2000
2400
2800
3200
16 23
1,482 1,509
1,996
1,437 1,462
1,283
699
411
34 26
1,791
2,013
2,888
2,165 2,179
1,963
1,142
607
notstated
<15 15-19 20-24 25-34 35-44 45-54 55-64 64-74 Over 75
Female Male

Fatalities by Age and Sex - 2012
0
4
8
12
16
20
24
28
3 4
15
10
14
8
11
6 51
14
19
27
14
28
19
15 16
<15 15-19 20-24 25-34 35-44 45-54 55-64 64-74 Over75
FemaleMale
Fatalities by Age and Sex - 2013

32
1935 1936 1937 1938 1939 1940 1941 1942 1943 1944 Page Total 1935 1936 1937 1938 1939 1940 1941 1942 1943 1944 Page Total
3 2 1 1 2 1 2 6 0 0 18 1 2 0 2 1 0 2 1 2 1 124 4 10 4 1 5 5 2 1 0 36 0 1 0 0 1 2 0 1 0 0 52 2 5 2 6 2 3 1 4 1 28 0 3 4 2 3 4 3 4 0 1 240 3 1 3 1 0 5 4 0 0 17 8 15 11 6 11 7 11 5 0 1 753 2 2 6 1 3 5 4 3 3 32 5 1 0 1 1 2 2 2 1 4 19
0 2 0 0 1 0 0 0 0 0 3 3 4 2 5 6 2 11 1 3 1 3818 16 12 9 9 15 14 9 5 3 110 0 0 0 0 2 6 2 2 0 0 12
2 2 5 0 2 0 0 0 1 2 14 6 1 4 3 0 1 3 1 1 1 212 2 2 1 2 1 10 2 1 0 23 3 5 1 2 4 2 4 1 1 4 270 0 2 1 0 0 2 1 0 1 7 0 0 1 1 0 0 0 0 0 1 3
2 3 2 1 1 1 1 0 3 0 14 4 1 3 6 4 2 3 3 1 1 285 5 5 1 9 2 7 2 4 2 42 0 1 2 0 0 1 1 0 0 5 100 0 0 0 1 1 1 1 1 2 7 4 4 3 9 4 3 1 1 2 1 325 3 3 2 0 0 4 1 0 1 19 0 1 3 3 2 3 1 3 5 2 239 4 5 3 6 1 8 2 3 4 45 2 0 2 2 1 6 1 1 0 1 16
8 8 4 3 8 3 4 3 1 5 47 0 2 1 2 0 2 1 1 2 0 110 3 1 1 0 3 2 0 0 0 10 1 0 1 0 2 4 5 2 0 1 164 2 2 0 4 1 4 2 7 3 29 2 1 0 1 0 0 2 1 2 2 110 0 0 0 0 0 0 1 0 0 1 11 17 12 11 10 13 16 5 6 8 1090 2 7 3 4 3 1 2 0 0 22 2 2 0 0 4 2 1 3 1 0 15
6 3 2 1 2 0 4 2 2 1 23 1 1 3 1 0 0 3 2 0 0 111 3 6 4 6 5 3 0 0 2 30 0 0 1 3 0 1 0 0 2 1 82 2 0 3 0 2 0 2 0 0 11 3 2 3 1 1 7 3 0 3 1 243 6 5 5 5 8 2 1 0 2 37 0 0 1 0 0 0 1 0 0 1 35 5 6 10 5 1 9 4 3 3 51 8 5 5 4 3 2 7 1 4 3 42
0 0 0 1 1 1 0 0 0 2 5 1 0 1 2 1 0 0 0 0 2 71 1 2 3 3 0 1 2 3 2 18 0 0 2 0 0 0 1 0 0 0 30 1 3 1 0 0 1 1 1 0 8 11 11 14 9 9 11 11 8 13 6 103
161 166 173 145 150 142 194 104 92 88 1,415
Garfield
Glacier
Big Horn
Blaine
Broadwater
Carbon
Daniels
Fatalities by County 1935 to 1944County
Beaverhead
Carter
Cascade
Choteau
Custer
Golden Valley
Granite
Dawson
Deer Lodge
Fallon
Fergus
Flathead
Park
Hill
Jefferson
Lincoln
Judith Basin
Lake
Lewis & Clark
Petroleum
Gallatin
McCone
Meagher
Mineral
Missoula
Musselshell
Phillips
Pondera
Powder River
Powell
Sweet Grass
Prairie
Ravalli
Richland
Roosevelt
Rosebud
County
Wheatland
Wibaux
Yellowstone
Toole
Treasure
Sanders
Sheridan
Silver Bow
Stillwater
Valley
Teton
Totals
Madison
Liberty

1945 1946 1947 1948 1949 1950 1951 1952 1953 1954Page Total
1945 1946 1947 1948 1949 1950 1951 1952 1953 1954Page Total
3 1 5 3 3 0 4 4 3 2 28 0 0 1 1 0 0 1 4 5 2 141 3 6 1 2 2 5 4 7 3 34 0 2 0 1 0 2 4 3 3 1 160 2 8 3 5 8 9 0 8 4 47 1 2 3 0 10 2 2 5 1 4 302 2 2 3 0 2 2 1 0 0 14 8 12 6 4 7 15 3 9 8 8 806 6 6 5 3 5 3 8 7 6 55 1 1 0 2 2 3 2 1 2 3 17
0 0 1 0 0 1 2 0 0 1 5 4 2 0 3 4 2 4 9 3 4 357 12 11 19 4 11 12 14 13 18 121 0 0 0 0 1 2 3 0 0 0 62 2 1 1 2 1 2 5 5 4 25 4 3 3 3 1 4 4 7 2 4 353 7 2 1 3 6 2 5 4 7 40 0 0 0 2 4 1 3 6 6 2 241 0 1 0 0 3 0 2 0 1 8 1 1 1 0 1 1 1 0 1 2 9
1 2 5 2 2 5 1 6 8 4 36 4 2 1 5 3 2 1 8 2 3 311 8 4 1 0 8 8 6 3 6 45 0 0 0 1 2 2 1 1 4 3 142 2 0 2 0 0 3 1 0 0 10 4 4 1 3 3 2 1 4 3 4 292 3 10 6 3 9 3 3 4 7 50 2 0 1 3 0 3 3 2 1 2 172 7 7 12 3 2 11 7 18 11 80 3 2 3 1 8 5 3 10 5 12 52
3 5 4 4 9 11 7 7 3 8 61 1 5 4 6 1 3 2 2 6 2 321 0 0 1 1 0 0 0 7 2 12 1 3 7 3 3 0 2 1 6 0 260 3 4 4 4 6 2 5 7 9 44 2 3 1 3 2 3 0 6 0 3 230 0 1 1 1 0 0 0 1 1 5 5 8 11 4 7 10 10 13 15 10 932 2 1 3 1 4 2 1 3 2 21 1 4 4 1 2 7 7 0 0 4 30
1 4 0 2 2 3 6 2 2 4 26 1 1 2 0 1 4 3 6 5 1 244 1 5 0 4 1 5 11 7 4 42 2 4 1 0 3 3 1 1 4 0 192 0 1 4 2 2 1 2 2 1 17 2 4 0 2 3 4 5 5 6 1 322 0 5 5 6 1 2 2 7 8 38 0 1 1 3 2 1 0 2 0 2 122 10 3 0 7 12 2 8 4 5 53 1 2 4 2 2 2 9 2 12 6 42
0 0 1 0 0 0 0 0 1 0 2 0 2 0 4 5 3 0 0 0 3 170 3 0 6 1 2 3 8 9 6 38 0 1 1 1 1 3 1 0 1 0 90 2 2 0 1 0 0 5 2 2 14 14 6 15 17 15 8 9 17 14 8 123
112 162 167 164 162 202 182 241 250 220 1,862
33
Totals
County
Wheatland
Wibaux
Yellowstone
Toole
Treasure
Valley
Stillwater
Sweet Grass
Teton
Rosebud
Sanders
Sheridan
Silver Bow
Richland
Roosevelt
Powder River
Powell
Prairie
Petroleum
Phillips
Pondera
McCone
Meagher
Mineral
Missoula
Ravalli
Liberty
Jefferson
Lincoln
Madison
Judith Basin
Lake
Lewis & Clark
Golden Valley
Granite
Hill
Gallatin
Garfield
Glacier
Deer Lodge
Fallon
Fergus
Flathead
Custer
Daniels
Dawson
Cascade
Choteau
Big Horn
Blaine
Broadwater
Carbon
Fatalities by County 1945 to 1954County
Beaverhead
Carter
Musselshell
Park

34
1955 1956 1957 1958 1959 1960 1961 1962 1963 1964Page Total
1955 1956 1957 1958 1959 1960 1961 1962 1963 1964Page Total
4 2 6 4 4 5 2 3 5 4 39 0 0 4 1 2 1 3 1 0 0 128 11 2 4 2 4 7 7 15 10 70 1 0 2 0 3 0 1 3 4 0 141 3 2 3 6 2 7 5 2 5 36 4 3 0 1 4 5 7 10 9 1 441 4 5 5 6 1 0 0 3 0 25 17 15 8 10 19 6 11 7 9 6 1083 4 4 2 6 2 5 2 3 6 37 10 5 2 4 0 1 4 2 0 0 28
1 1 0 0 0 2 0 0 0 0 4 3 6 6 3 6 5 5 4 3 5 4612 13 13 14 10 13 24 24 12 15 150 0 0 0 0 0 1 0 0 0 1 2
2 6 2 1 5 0 2 4 3 7 32 2 6 5 1 0 5 0 7 0 1 273 5 5 3 7 4 11 2 2 5 47 3 7 4 3 3 2 9 3 1 3 381 1 0 3 1 0 0 1 0 0 7 2 5 1 0 2 0 1 0 1 0 12
9 2 5 4 0 3 1 2 4 6 36 4 10 0 5 3 4 8 1 2 5 428 11 4 3 3 5 8 6 5 6 59 0 2 2 5 0 2 3 7 4 2 272 1 2 2 0 1 0 0 0 0 8 1 4 5 8 6 5 1 7 1 6 446 4 2 1 5 3 5 6 5 6 43 4 4 3 3 3 1 2 7 6 3 364 9 5 2 14 12 15 11 2 13 87 14 6 9 5 7 13 2 7 5 7 75
4 7 4 7 8 9 23 5 13 13 93 3 5 5 3 10 3 3 7 4 5 480 0 1 6 1 1 2 0 3 5 19 1 0 4 5 5 3 0 1 3 4 26
13 14 1 7 8 12 8 8 10 7 88 3 2 3 0 3 3 1 3 1 2 212 0 1 1 2 0 3 2 4 1 16 6 8 5 4 6 4 3 15 4 9 640 2 0 9 3 2 1 5 1 0 23 2 2 2 2 2 3 3 5 2 0 23
9 9 6 4 4 9 6 6 5 6 64 3 2 1 2 6 2 1 3 6 5 317 3 9 2 8 4 7 2 2 4 48 0 8 2 0 1 2 2 1 3 4 231 1 2 4 2 4 9 1 2 1 27 6 1 5 4 1 1 3 2 3 7 335 10 4 3 4 11 4 8 10 7 66 1 2 3 1 0 1 2 0 2 1 131 8 8 3 6 12 15 4 6 12 75 8 10 8 6 11 10 7 7 9 1 77
4 0 6 1 2 0 0 0 1 1 15 4 1 7 4 2 3 5 0 2 2 308 6 7 4 3 4 5 6 6 3 52 1 1 1 0 1 0 0 1 1 0 61 3 0 1 5 1 4 6 5 3 29 13 12 7 10 17 10 14 19 14 33 149
236 267 210 193 248 222 275 256 228 259 2,394 Totals
County
Wheatland
Wibaux
Yellowstone
Toole
Treasure
Valley
Sanders
Sheridan
Silver Bow
Stillwater
Sweet Grass
Teton
Prairie
Ravalli
Richland
Roosevelt
Rosebud
Petroleum
Phillips
Pondera
Powder River
Powell
McCone
Meagher
Mineral
Missoula
Musselshell
Liberty
Park
Hill
Jefferson
Lincoln
Madison
Judith Basin
Lake
Lewis & Clark
Gallatin
Garfield
Glacier
Golden Valley
Granite
Dawson
Deer Lodge
Fallon
Fergus
Flathead
Carter
Cascade
Choteau
Custer
Daniels
Fatalities by County 1955 to 1964County
Beaverhead
Big Horn
Blaine
Broadwater
Carbon

1965 1966 1967 1968 1969 1970 1971 1972 1973 1974Page Total
1965 1966 1967 1968 1969 1970 1971 1972 1973 1974Page Total
5 11 5 5 6 3 3 4 4 6 52 0 3 1 3 5 1 6 3 1 1 249 10 11 17 11 19 11 9 14 5 116 1 1 4 1 2 0 0 2 2 1 143 2 11 3 3 3 4 10 3 4 46 8 3 9 7 6 12 3 8 11 6 730 2 1 1 0 3 2 12 1 0 22 25 21 20 10 18 19 33 35 25 16 2226 4 5 2 3 6 3 3 3 4 39 3 1 1 1 1 1 5 6 3 5 27
2 2 5 1 0 0 0 2 0 1 13 1 10 4 6 5 5 6 5 7 9 5817 17 17 7 23 23 15 15 8 16 158 1 0 0 0 4 1 1 1 2 1 11
2 1 4 3 5 7 1 6 11 1 41 4 1 3 3 3 4 5 3 2 4 324 2 3 4 6 2 9 13 8 8 59 1 6 5 2 13 4 5 4 1 0 411 1 1 5 2 1 0 0 2 2 15 1 0 3 3 10 4 3 0 0 2 26
2 6 4 10 5 5 3 9 3 4 51 6 7 11 10 9 5 6 11 10 7 825 7 6 7 2 5 4 6 5 5 52 4 0 1 2 3 1 5 1 2 0 191 1 0 1 3 2 1 4 2 1 16 7 5 8 10 5 7 7 8 9 5 715 5 1 5 7 3 3 6 6 8 49 3 0 4 3 4 2 2 4 2 3 27
10 6 23 8 15 19 21 16 25 13 156 8 3 6 6 4 2 6 9 3 6 53
8 9 4 13 13 11 13 13 11 10 105 4 5 1 6 7 20 9 3 8 7 703 0 2 1 1 0 2 3 1 2 15 2 8 4 5 2 4 1 5 1 4 365 15 3 9 13 8 17 10 11 9 100 1 3 6 3 3 4 4 5 2 0 310 0 0 1 4 1 3 3 1 2 15 13 13 10 3 13 10 5 12 13 10 1026 1 6 4 5 6 2 1 2 4 37 2 1 4 5 9 0 2 6 3 6 38
5 5 12 5 4 5 5 9 0 3 53 11 5 6 5 0 0 4 6 9 1 476 4 5 4 6 6 5 9 8 8 61 4 1 1 0 8 4 2 5 0 2 270 2 9 5 4 1 1 3 1 1 27 3 2 5 5 0 4 1 0 3 2 25
10 9 11 13 8 16 19 16 11 16 129 0 1 1 3 0 3 0 1 1 0 1011 21 10 6 15 15 14 15 8 14 129 6 5 7 10 6 8 3 6 5 7 63
1 0 0 5 8 1 0 3 2 2 22 1 0 0 1 1 0 1 7 2 2 157 9 9 10 6 4 15 5 12 7 84 3 1 1 1 0 1 1 1 2 1 125 3 6 2 1 3 2 9 1 2 34 18 15 19 18 19 14 24 24 30 33 214
280 276 319 289 339 318 328 395 323 299 3,166
35
Fatalities by County 1965 to 1974County
Beaverhead
Carter
Musselshell
Park
Cascade
Choteau
Big Horn
Blaine
Broadwater
Carbon
Deer Lodge
Fallon
Fergus
Flathead
Custer
Daniels
Dawson
Golden Valley
Granite
Hill
Gallatin
Garfield
Glacier
Liberty
Jefferson
Lincoln
Madison
Judith Basin
Lake
Lewis & Clark
Petroleum
Phillips
Pondera
McCone
Meagher
Mineral
Missoula
Ravalli
Richland
Roosevelt
Powder River
Powell
Prairie
Stillwater
Sweet Grass
Teton
Rosebud
Sanders
Sheridan
Silver Bow
Totals
County
Wheatland
Wibaux
Yellowstone
Toole
Treasure
Valley

36
1975 1976 1977 1978 1979 1980 1981 1982 1983 1984Page Total
1975 1976 1977 1978 1979 1980 1981 1982 1983 1984Page Total
12 11 6 5 10 6 11 4 6 2 73 0 1 3 1 2 3 6 2 4 0 2215 14 3 8 14 11 14 7 5 5 96 1 4 1 5 3 4 4 0 1 0 23
2 4 11 4 4 3 6 5 3 5 47 6 3 6 8 11 7 1 5 9 1 572 0 2 4 5 2 2 2 1 3 23 23 21 20 21 28 28 16 20 17 14 2080 1 5 3 3 5 3 5 3 2 30 1 2 4 1 1 2 1 0 2 2 16
0 3 0 0 2 1 1 0 2 2 11 1 5 3 5 8 6 3 7 6 3 4720 20 35 19 20 20 17 14 18 10 193 0 1 0 0 0 0 2 0 2 0 5
3 2 2 2 1 3 3 4 1 0 21 0 3 11 2 7 12 7 3 2 2 495 3 3 4 2 2 8 3 1 3 34 4 3 4 1 6 4 1 2 0 2 272 3 0 0 0 5 1 2 1 0 14 1 2 0 1 1 1 0 2 2 2 12
1 5 3 1 2 6 9 2 3 4 36 4 9 1 5 7 6 6 5 5 7 556 4 8 4 4 3 1 1 4 2 37 3 0 0 2 1 3 0 0 1 1 113 1 0 0 2 1 2 2 1 3 15 7 7 4 8 2 6 9 9 8 4 644 3 6 8 3 11 3 1 9 5 53 1 4 4 3 5 6 11 8 3 4 49
12 12 26 18 21 17 19 5 17 25 172 11 7 6 6 8 6 14 8 6 9 81
8 10 10 12 10 8 15 12 7 9 101 12 7 11 7 7 5 4 2 10 6 711 0 1 1 2 1 1 2 4 3 16 9 10 1 3 9 3 9 3 11 8 66
14 17 13 14 16 14 9 9 12 5 123 1 1 1 1 2 4 2 2 3 2 190 5 0 0 2 0 2 2 0 0 11 16 10 10 3 11 8 10 8 4 5 856 0 1 4 3 5 3 1 1 1 25 0 5 1 4 9 4 5 3 2 3 36
5 5 12 0 8 6 7 11 3 2 59 10 1 4 4 0 2 1 4 4 3 334 8 8 9 3 3 2 6 6 9 58 5 4 5 1 2 2 3 3 2 0 272 1 0 3 1 1 0 3 0 4 15 3 9 3 0 1 1 3 3 4 3 30
18 9 8 11 13 11 14 13 9 6 112 2 1 2 0 1 0 0 0 1 0 714 8 9 10 15 12 12 13 11 8 112 0 1 6 3 2 6 9 8 1 2 38
0 2 1 1 1 0 0 0 6 1 12 2 0 0 3 0 0 1 0 2 1 94 4 4 3 4 2 6 3 5 6 41 0 0 0 3 1 2 1 0 0 3 103 9 5 6 6 4 5 2 5 3 48 9 15 22 16 20 31 33 13 30 23 212
298 300 315 271 332 325 338 254 286 238 2,957
Fatalities by County 1975 to 1984County
Beaverhead
Big Horn
Blaine
Broadwater
Carbon
Carter
Cascade
Choteau
Custer
Daniels
Dawson
Deer Lodge
Fallon
Fergus
Flathead
Gallatin
Garfield
Glacier
Golden Valley
Granite
Hill
Jefferson
Lincoln
Madison
Judith Basin
Lake
Lewis & Clark
McCone
Meagher
Mineral
Missoula
Musselshell
Liberty
Park
Petroleum
Phillips
Pondera
Powder River
Stillwater
Powell
Prairie
Ravalli
Richland
Roosevelt
County
Wheatland
Wibaux
Yellowstone
Toole
Treasure
Rosebud
Sanders
Sheridan
Silver Bow
Valley
Sweet Grass
Teton
Totals

1985 1986 1987 1988 1989 1990 1991 1992 1993 1994Page Total
1985 1986 1987 1988 1989 1990 1991 1992 1993 1994Page Total
4 5 4 6 3 3 3 3 6 12 49 1 3 0 2 0 0 1 0 0 0 75 5 8 12 5 11 12 8 10 10 86 3 0 1 0 0 1 2 0 1 0 82 5 0 1 5 8 3 2 4 1 31 2 3 2 6 2 5 2 5 6 3 365 1 1 0 5 0 1 1 1 3 18 22 8 12 15 22 14 11 11 9 10 1344 3 2 3 1 1 2 3 3 2 24 0 1 2 3 1 2 0 1 1 0 11
0 2 1 0 0 0 1 1 1 0 6 3 3 3 4 3 1 3 6 1 4 3111 9 12 12 10 14 16 13 11 14 122 0 0 1 0 0 0 3 0 0 0 4
2 3 1 1 2 3 0 0 1 3 16 2 1 5 3 0 3 1 1 1 0 170 4 3 6 1 2 2 2 1 2 23 0 7 2 3 0 3 0 0 1 3 190 1 0 0 0 0 0 0 0 0 1 0 3 2 1 0 1 1 2 1 1 12
3 1 5 1 0 2 2 3 1 3 21 4 5 8 2 2 6 2 4 2 5 405 2 5 0 7 6 2 0 1 1 29 0 1 1 0 0 1 0 0 0 0 31 2 1 0 0 0 0 0 1 0 5 9 6 7 5 1 3 4 5 0 12 523 0 6 2 5 3 7 3 3 3 35 4 0 3 3 0 4 2 2 1 1 20
15 10 22 19 14 16 16 17 13 7 149 5 9 3 8 5 5 3 3 10 4 55
13 4 13 5 1 5 22 15 5 5 88 8 7 3 2 5 6 2 8 7 3 510 1 1 1 0 0 1 0 0 1 5 0 3 3 2 7 7 4 1 2 2 31
11 6 14 5 6 1 10 4 11 6 74 1 2 1 2 0 0 0 1 1 0 82 1 1 0 0 1 0 0 0 0 5 2 10 2 5 8 11 3 5 7 9 623 3 0 1 0 5 2 3 1 3 21 1 4 3 1 4 2 0 2 4 5 26
4 7 4 0 3 4 5 2 7 2 38 1 2 3 3 2 0 1 0 2 1 157 2 1 2 2 7 4 3 4 7 39 0 0 5 3 1 1 1 2 1 2 160 0 0 4 0 2 1 2 2 0 11 1 5 2 2 1 0 0 2 2 0 157 11 12 10 8 10 8 8 9 21 104 0 0 0 2 0 0 1 3 0 0 69 9 15 13 7 6 8 10 11 3 91 3 5 3 1 4 2 1 2 1 2 24
0 0 0 0 0 0 0 0 1 1 2 2 1 0 1 1 1 0 1 0 1 812 6 8 2 3 6 4 5 9 6 61 0 0 2 0 1 0 0 0 1 1 5
2 4 6 4 2 4 1 0 3 1 27 19 26 9 9 21 13 19 15 12 16 159
223 222 234 198 181 212 200 190 194 202 2,056
Fatalities by County 1985 to 1994County
Carter
County
Carbon
Beaverhead
Big Horn
Blaine
Cascade
Choteau
Custer
Daniels
Broadwater
Dawson
Deer Lodge
Fallon
Fergus
Flathead
Gallatin
Garfield
Glacier
Golden Valley
Granite
Liberty
Park
Hill
Jefferson
Lincoln
Judith Basin
Lake
Lewis & Clark
McCone
Meagher
Mineral
Missoula
Musselshell
Petroleum
Phillips
Pondera
Powder River
Powell
Prairie
Ravalli
Richland
Roosevelt
Rosebud
Sanders
Sheridan
Silver Bow
Stillwater
Wheatland
Wibaux
Toole
Treasure
Valley
37
Sweet Grass
Teton
Totals
Yellowstone Madison

38
1995 1996 1997 1998 1999 2000 2001 2002 2003Page Total
All Years 1995 1996 1997 1998 1999 2000 2001 2002 2003Page Total
All Years
10 9 2 3 2 5 2 5 4 42 301 0 1 0 0 0 0 0 2 1 4 957 5 6 6 13 11 10 17 10 85 523 1 2 1 1 1 0 0 1 3 10 905 2 1 3 4 8 4 2 5 34 269 2 10 9 5 3 8 8 5 5 55 3193 0 1 1 0 2 5 2 1 15 134 11 16 19 15 16 25 16 12 15 145 9724 0 8 4 13 3 3 11 5 51 268 0 1 3 1 0 1 0 2 0 8 126
0 0 3 1 1 0 0 0 1 6 48 1 8 7 5 5 5 7 6 9 53 3085 6 10 15 11 13 12 8 13 93 947 0 1 0 1 0 0 3 0 0 5 453 4 2 1 2 3 1 6 5 27 176 2 0 3 2 5 3 1 1 2 19 2002 1 2 0 0 3 1 3 1 13 239 4 4 4 2 1 0 5 4 5 29 2051 1 0 1 0 0 0 1 0 4 56 0 0 6 1 0 2 2 4 1 16 90
1 2 1 2 0 1 2 0 0 9 203 3 0 1 3 1 10 6 6 6 36 3147 2 7 6 3 1 2 2 2 32 296 1 2 0 1 0 0 0 2 1 7 911 2 0 0 0 0 1 1 0 5 66 9 11 6 12 4 9 11 5 9 76 3681 2 5 6 2 5 4 5 1 31 280 0 1 1 3 2 4 1 0 2 14 186
11 14 18 17 12 14 21 14 22 143 832 7 2 6 4 6 3 6 5 4 43 375
6 10 17 14 9 15 14 17 23 125 620 3 5 4 4 4 1 1 1 2 25 3082 1 3 0 0 0 4 1 0 11 88 6 3 5 4 2 3 6 4 5 38 2390 4 13 12 8 8 2 11 9 67 525 0 0 0 4 0 0 2 0 0 6 1191 1 0 1 0 0 0 0 0 3 56 6 8 9 4 9 3 2 6 7 54 5692 0 4 3 3 4 4 2 1 23 172 5 2 2 5 11 3 2 5 4 39 207
7 5 10 2 4 1 2 2 2 35 298 0 5 0 1 1 3 5 4 0 19 1804 1 8 12 2 2 3 5 4 41 319 3 1 1 0 2 2 3 1 1 14 1340 0 0 2 0 0 4 0 0 6 114 1 0 3 3 1 1 3 6 0 18 177
17 11 15 8 13 13 8 18 23 126 612 0 0 0 0 1 0 1 2 2 6 5711 7 4 8 12 3 4 12 5 66 577 4 2 2 2 2 3 2 2 7 26 312
3 0 0 1 1 1 0 2 0 8 66 4 0 0 1 1 3 2 0 1 12 983 3 12 4 1 8 7 5 7 50 344 0 1 1 0 1 0 0 1 0 4 498 3 5 1 3 2 0 6 3 31 191 17 16 15 19 22 19 15 24 23 170 1,130
215 198 265 237 220 237 230 269 262 2,133 15,983
County
Wheatland
Wibaux
Yellowstone
Toole
Treasure
Valley
Sweet Grass
Teton
Totals
Sanders
Sheridan
Silver Bow
Stillwater
Prairie
Ravalli
Richland
Roosevelt
Rosebud
Petroleum
Phillips
Pondera
Powder River
Powell
McCone
Meagher
Mineral
Missoula
Musselshell
Liberty
Park
Hill
Jefferson
Lincoln
Madison
Judith Basin
Lake
Lewis & Clark
Gallatin
Garfield
Glacier
Golden Valley
Granite
Dawson
Deer Lodge
Fallon
Fergus
Flathead
Carter
Cascade
Choteau
Custer
Daniels
Fatalities by County 1995 to 2003County
Beaverhead
Big Horn
Blaine
Broadwater
Carbon

2004 2005 2006 2007 2008 2009 2010 2011 2012Page Total
All Years 2004 2005 2006 2007 2008 2009 2010 2011 2012Page Total
All Years
5 4 3 1 8 6 5 3 4 39 333 3 0 0 0 1 0 3 1 0 8 1028 10 9 11 12 9 13 7 9 88 595 1 2 1 1 3 0 0 1 1 10 983 3 2 4 4 1 3 3 3 26 289 5 4 7 7 7 3 3 2 3 41 3555 2 4 4 2 3 1 1 4 26 155 13 18 16 23 20 15 13 17 7 142 1,0906 2 4 4 3 7 4 2 7 39 298 0 1 2 6 0 1 0 3 0 13 136
0 0 0 0 4 0 1 1 1 7 53 5 5 5 6 1 3 1 4 5 35 33410 9 11 13 7 6 5 10 7 78 1,008 2 4 0 2 0 1 0 1 0 10 545 5 2 2 3 4 2 1 0 24 199 1 3 1 4 1 2 1 4 0 17 2131 5 1 6 4 2 2 1 2 24 260 5 1 2 0 0 4 4 2 5 23 2210 0 0 0 0 0 0 1 1 2 56 2 0 4 2 0 0 1 0 2 11 99
3 1 0 2 1 2 5 3 1 18 217 1 5 3 5 1 6 2 2 3 28 3371 3 3 2 1 3 0 1 1 15 309 0 0 1 1 1 1 0 3 3 10 952 1 0 0 0 2 0 1 0 6 71 6 7 6 10 4 6 5 4 5 53 4111 5 3 2 9 0 4 4 4 32 304 3 2 4 4 7 0 2 7 3 32 208
19 17 30 26 25 16 9 13 11 166 974 0 1 3 5 3 5 3 5 4 29 395
16 11 22 14 13 7 10 10 12 115 713 5 6 7 3 3 12 2 3 8 49 3460 1 0 1 0 1 0 2 0 5 91 7 6 7 8 7 7 11 3 6 62 292
11 5 8 14 7 5 4 6 3 63 579 1 0 1 1 0 0 2 0 2 7 1240 1 0 1 0 1 1 0 0 4 60 6 7 6 3 5 10 2 2 2 43 6083 5 1 2 2 3 0 1 0 17 188 6 3 1 4 1 1 0 2 1 19 223
3 1 3 4 3 2 3 3 6 28 317 2 3 1 3 1 1 0 3 0 14 1916 5 3 8 5 8 6 8 6 55 360 1 0 1 3 1 0 3 1 0 10 1430 2 1 4 0 0 3 4 1 15 124 0 4 2 0 0 0 0 0 0 6 183
12 14 22 10 5 8 7 4 6 88 689 0 0 1 1 1 0 1 0 0 4 614 11 11 11 13 13 9 7 8 87 649 4 2 4 1 1 3 3 2 3 23 330
0 1 0 0 0 0 0 0 1 2 67 0 3 0 2 0 0 0 2 1 8 1031 7 6 6 3 6 10 5 6 50 383 1 3 3 0 0 0 0 0 1 8 564 7 5 6 6 1 2 9 5 45 222 20 23 20 13 22 24 18 24 18 182 1,270
229 251 263 276 231 221 189 209 205 2,061 17,641
39
Choteau
Custer
Fatalities by County 2004 - 2012County
Carbon Musselshell
Beaverhead
Big Horn
Blaine
Broadwater
Carter
Cascade
Fallon
Fergus
Flathead
Daniels
Dawson
Deer Lodge
Gallatin
Garfield
Glacier
Golden Valley
Granite
McCone
Meagher
Mineral
Missoula
Liberty
Lincoln
Madison
Judith Basin
Lake
Lewis & Clark
Hill
Jefferson
Powder River
Powell
Prairie
Park
Petroleum
Phillips
Pondera
Silver Bow
Ravalli
Richland
Roosevelt
Totals
County
Wheatland
Wibaux
Yellowstone
Toole
Treasure
Valley
Stillwater
Sweet Grass
Teton
Rosebud
Sanders
Sheridan

40
2013 2014 2015 2016 2017 2018 2019 2010 2013Page Total
All Years 2013 2014 2015 2016 2017 2018 2019 2020 2021Page Total
All Years
3 3 336 1 1 1038 8 603 1 1 991 1 290 4 4 3592 2 157 15 15 1,1052 2 300 0 0 136
0 0 53 1 1 33510 10 1,018 1 1 552 2 201 1 1 2142 2 262 3 3 2240 0 56 1 1 100
4 4 221 3 3 3402 2 311 1 1 960 0 71 8 8 4192 2 306 7 7 215
19 19 993 1 1 396
8 8 721 4 4 3501 1 92 3 3 295
10 10 589 1 1 1250 0 60 7 7 6152 2 190 4 4 227
1 1 318 3 3 1943 3 363 1 1 1440 0 124 2 2 1859 9 698 0 0 615 5 654 2 2 332
0 0 67 1 1 1046 6 389 0 0 564 4 226 21 21 1,291
203 0 0 0 0 0 0 0 0 203 17,844
Choteau
Custer
Fatalities by County 2013 - 2021County
Carbon Musselshell
Beaverhead
Big Horn
Blaine
Broadwater
Carter
Cascade
Fallon
Fergus
Flathead
Daniels
Dawson
Deer Lodge
Gallatin
Garfield
Glacier
Golden Valley
Granite
McCone
Meagher
Mineral
Missoula
Liberty
Lincoln
Madison
Judith Basin
Lake
Lewis & Clark
Hill
Jefferson
Powder River
Powell
Prairie
Park
Petroleum
Phillips
Pondera
Silver Bow
Ravalli
Richland
Roosevelt
Totals
County
Wheatland
Wibaux
Yellowstone
Toole
Treasure
Valley
Stillwater
Sweet Grass
Teton
Rosebud
Sanders
Sheridan

S M T W T F S S M T W T F S S M T W T F S1 1 1 1
1 1 1 1 31 1 2 1 2 1 1 11 2 2 1 1 1 1 12 1 3 1 1 1 1 2 1
1
14 12 19
14 26 45
S M T W T F S S M T W T F S S M T W T F S2 2 1 1
1 1 1 2 4 1 1 2 11 1 1 1 1 2 1 3 2 1 4
3 1 6 1 11 2 1 1 1 1
1
18 16 24
63 79 103
S M T W T F S S M T W T F S S M T W T F S2 3 1 1 1 1
3 1 2 2 2 1 1 1 12 1 1 1 2 4 2 1 2 1 2 2
2 2 1 3 1 1 2 12 1 1 1 2 2 1
17 32 18
120 152 170
S M T W T F S S M T W T F S S M T W T F S3 1 1 2 1 2 1 1 1
3 3 1 2 1 1 1 11 1 1 2 1 1 2 2 2
1 2 1 1 1 2 1 1 1 21 1 1 1 1 1 1
31 15 13
201 216 229
41
Total for Month:
Total for Year:
Total for Month:
Total for Year:
JuneMay
Total for Year:
Fatality Calendar 2013
Total for Month:
Total for Year:
Total for Month:
January February March
April
Total for Year:
Total for Month:
Total for Year:
Total for Month:
Total for Year:
Total for Month:
Total for Year:
Total for Year:
Total for Month:
Total for Year: Total for Year:
Total for Month:
July August
December
Total for Month:
Total for Year:
Total for Month:
September
October November
Total for Month:

42
2009 2010 2011
Fatal Fatal Fatal Fatal Fatal Fatal
Crashes Fatalities Crashes Fatalities Crashes Fatalities Crashes Fatalities Crashes Fatalities Crashes Fatalities
Memorial Day 4 5 3 5 2 3 0 0 0 0 9 13
Independence Day 4 4 2 2 2 4 2 2 0 0 10 12
Labor Day 6 6 4 5 0 0 2 3 3 3 15 17
Thanksgiving 0 0 0 0 1 1 1 1 2 2 4 4
Christmas 1 2 4 5 1 1 0 0 0 0 6 8
New Year's 1 1 1 1 0 0 1 1 1 1 4 4
Total 16 18 14 18 6 9 6 7 6 6 48 58
*
the day of the holiday. If a holiday falls on a Monday the holiday period begins a 6 pm on Friday and ends at midnight on Monday If a holiday falls on a Friday the holiday period begins at 6 pm on Thursday and ends at midnight on Sunday.
Fatalities During Major Holiday Periods*
TotalHoliday
2012 2013

43
262
229
251
263
276
229
221
189
209205
229
150
200
250
300
2003 2004 2005 2006 2007 2008 2009 2010 2011 2012 2013
Total Number of Fatalities by Year 2003-2013

The Montana Highway Patrol is looking for qualified applicants to become part of our team. You may be eligible to join the Patrol if
you possess any of the following: ► High school diploma (or GED) ► Montana Basic POST certificate ► Out of State POST certificate
Testing dates and locations are posted on our website
http://doj.mt.gov/enforcement/highwaypatrol
If you are interested in being a part of Montana’s premier law enforcement agency, now is your chance. For more information call 406-444-3259 or the number below.
The Montana Highway Patrol is an AA/EEO Employer

1
District I - Missoula 2681 Palmer, Suite B
Missoula, MT. 59808-1700 Phone: (406) 329-1500 Fax: (406) 329-1549
Commander Captain James Kitchin Detachments
111 Missoula Sgt. Scott Hoffman (406) 329-1514 112 Missoula Sgt. Chad Dever (406) 329-1513 113 Hamilton Sgt. Ken Breidenbach (406) 777-2517 114 Superior Sgt. Roman Zylawy (406) 822-6699
2012 2013 Population 167,169 167,169 FTE Uniform Positions 33 32 Vehicle Miles Driven 715,688 745,748 Calls for Service 21,639 27,317 Assists Citizen 456 591 Crashes Investigated 1,560 1,728 Traffic Stops 13,693 16,647 Total Citations 9,492 11,865 Total Warnings 15,480 19,108 Fatal Crashes in Area 21 30