Embed Size (px)
Citation preview

M. Mazurek1, T. Al2, M. Celejewski2, I.D. Clark2, A.M. Fernandez3, D. Jaeggi4, L. Kennell-Morrison5, J.M. Matray6, S. Murseli2, T. Oyama7, S. Qiu2, D. Rufer1, G. St-Jean2, H.N. Waber1 & C. Yu6 1Rock-Water Interaction, Institute of Geological Sciences, University of Bern, Switzerland 2Department of Earth Sciences, University of Ottawa, Canada 3CIEMAT, Dpto. Medio Ambiente, Madrid, Spain 4Swisstopo, Switzerland 5NWMO, Toronto, Canada 6IRSN, DEI/SARG-BP17-92262, Fontenay-Aux-Roses, France 7CRIEPI, Nuclear Fuel Cycle Backend Research Center, Abiko-shi, Chiba-ken, Japan
Mont Terri DB-A Experiment: Comparison of Pore-water Investigations Conducted by Several Research Groups on Core Materials from the BDB-1 Borehole
NWMO-TR-2017-09 June 2017

Nuclear Waste Management Organization 22 St. Clair Avenue East, 6th Floor Toronto, Ontario M4T 2S3 Canada Tel: 416-934-9814 Web: www.nwmo.ca

i
This report has been prepared at the University of Bern, under contract to the NWMO, as part of a joint project between the following members of the Mont Terri Consortium: NWMO, NAGRA, IRSN and Swisstopo. The report has been reviewed by the NWMO and contributing authors. The views and conclusions are those of the author(s) and do not necessarily represent those of the NWMO.
Mont Terri DB-A Experiment: Comparison of Pore-water Investigations Conducted by Several Research Groups on Core Materials from the BDB-1 Borehole NWMO-TR-2017-09 June 2017
M. Mazurek1, T. Al2, M. Celejewski2, I.D. Clark2, A.M. Fernandez3, D. Jaeggi4, L. Kennell-Morrison5, J.M. Matray6, S. Murseli2, T. Oyama7, S. Qiu2, D. Rufer1, G. St-Jean2, H.N. Waber1 & C. Yu6
1Water-Rock Interaction, Institute of Geological Sciences, University of Bern, Switzerland 2Department of Earth and Environmental Sciences, University of Ottawa 3CIEMAT, Dpto. Medio Ambiente, Madrid, Spain 4Swisstopo, Switzerland 5Nuclear Waste Management Organization, Toronto, Canada 6IRSN, DEI/SARG-BP17-92262, Fontenay-Aux-Roses, France 7CRIEPI, Nuclear Fuel Cycle Backend Research Center, Abiko-shi, Chiba-ken, Japan

ii
Document History
Title: Mont Terri DB-A Experiment: Comparison of Pore-water Investigations Conducted by Several Research Groups on Core Materials from the BDB-1 Borehole
Report Number: NWMO-TR-2017-09
Revision: R000 Date: June 2017
Report Contributors
Authored by:
M. Mazurek, D. Rufer, H.N. Waber (Rock-Water Interaction, Institute of Geological Sciences, University of Bern, Switzerland) T. Al, M. Celejewski, I.D. Clark, S. Murseli, S. Qiu, G. St-Jean (Department of Earth and Environmental Sciences, University of Ottawa, Ottawa, Canada) A.M. Fernandez (CIEMAT, Dpto. Medio Ambiente, Madrid, Spain) D. Jaeggi (Swisstopo, Switzerland) L. Kennell-Morrison (Nuclear Waste Management Organization, Toronto, Canada) J.M. Matray, C. Yu (IRSN, DEI/SARG-BP17-92262, Fontenay-Aux-Roses, France) T. Oyama (CRIEPI, Nuclear Fuel Cycle Backend Research Center, Abiko-shi, Chiba-ken, Japan)
Reviewed by:
M. Mazurek, H.N. Waber (Rock-Water Interaction, Institute of Geological Sciences, University of Bern, Switzerland); T. Al, I.D. Clark (Department of Earth and Environmental Sciences, University of Ottawa, Ottawa, Canada); J.M. Matray (IRSN, DEI/SARG-BP17-92262, Fontenay-Aux-Roses, France)
Approved by: M. Mazurek
Nuclear Waste Management Organization
Reviewed by: Laura Kennell-Morrison, Mark Jensen
Accepted by: Mark Jensen

iii
ABSTRACT Title: Mont Terri DB-A Experiment: Comparison of Pore-water Investigations
Conducted by Several Research Groups on Core Materials from the BDB-1 Borehole
Report No.: NWMO-TR-2017-09 Author(s): M. Mazurek1, T. Al2, M. Celejewski2, I.D. Clark2, A.M. Fernandez3, D. Jaeggi4, L.
Kennell-Morrison5, J.M. Matray6, S. Murseli2, T. Oyama7, S. Qiu2, D. Rufer1, G. St-Jean2, H.N. Waber1 & C. Yu6
Company: 1Water-Rock Interaction, Institute of Geological Sciences, University of Bern, Switzerland, 2Department of Earth and Environmental Sciences, University of Ottawa, 3CIEMAT, Dpto. Medio Ambiente, Madrid, Spain, 4Swisstopo, Switzerland, 5Nuclear Waste Management Organization, Toronto, Canada, 6IRSN, DEI/SARG-BP17-92262, Fontenay-Aux-Roses, France, 7CRIEPI, Nuclear Fuel Cycle Backend Research Center, Abiko-shi, Chiba-ken, Japan
Date: June 2017
Abstract The characterisation of pore-water chemistry in low-permeability rocks is an on-going challenge. There are several methods in use internationally to estimate the chemical and isotopic composition of pore water from clay-rich low-permeability rocks; each method is accompanied by distinct challenges and many may be subject to artefacts of some kind and/or provide only partial information on pore-water composition. In the context of the characterisation of clay-rich low-permeability rocks and associated pore waters for the purpose of long-term waste management, a number of the methods have been specifically adapted, modified and extensively tested to allow successful characterisation of the rock formation(s) of interest, and, as of yet, no single technique has been found to be suitable across the entire range of clay-rich low-permeability geologic materials and environments of interest for waste isolation. With this in mind, the drilling of a new borehole (BDB-1) at the Mont Terri Underground Research Laboratory provided an opportunity within the DB-A Experiment to test, evaluate and observe similarities and differences in the results from a number of these specifically adapted methods. The main aims of the DB-A experiment were to:
1. Compare the results from newly developed laboratory techniques for the characterization of pore-water chemical or isotopic composition against well-established techniques; and
2. Perform a detailed investigation of the geochemical boundary conditions in groundwater and pore water at the interface between Opalinus Clay and an adjacent aquifer (Passwang Formation).
To reach these goals, researchers from several different universities, including the University of Ottawa (Canada), the University of New Brunswick (Canada), and the University of Bern (Switzerland) participated in the experiment. As part of the first aim of the experiment, methods that have been developed and/or are in development to overcome challenges associated with pore-water characterization in relatively low-porosity sedimentary formations containing highly saline pore waters in the Michigan Basin, Canada, were included, along with well-established methods used extensively to characterize the Opalinus Clay. The new methods include:

iv
1. A micro-vacuum distillation technique to determine the stable water isotopic composition of pore waters under development at the University of Ottawa;
2. A method for the determination of helium concentrations and isotopic compositions, also under development at the University of Ottawa,
3. A filter-absorption method being developed as part of a PhD thesis to determine pore-water chemical compositions at the University of New Brunswick.
These new methods and a suite of established pore water characterization methods (e.g. diffusive exchange, out-diffusion, squeezing) were applied to a series of freshly drilled and preserved core samples. Two technical reports have been prepared documenting the results of the DB-A investigations. This report focuses on the results related to aim 1 (see above). A second report (Waber and Rufer, 2017) focuses primarily on an additional dataset related to aim 2.

v
TABLE OF CONTENTS
Page
ABSTRACT……… .................................................................................................................... iii
1. INTRODUCTION ................................................................................................. 1
1.1 FRAMEWORK ..................................................................................................... 1 1.2 SCOPE AND OBJECTIVES ................................................................................ 1 1.3 MEASURED PARAMETERS AND REPORTING OF ERRORS .......................... 3
2. BOREHOLE PROFILE ........................................................................................ 7
3. MAJOR-ION COMPOSITION BASED ON DIRECT METHODS: FILTER-PAPER ABSORPTION AND SQUEEZING ....................................................... 10
3.1 RESULTS .......................................................................................................... 10 3.2 OBSERVATIONS .............................................................................................. 12 3.3 CONCLUSIONS ................................................................................................ 13 3.4 RECOMMENDATIONS ...................................................................................... 13
4. MAJOR-ION COMPOSITION BASED ON INDIRECT METHODS: AQUEOUS EXTRACTION AND OUT-DIFFUSION .............................................................. 14
4.1 METHODOLOGICAL ASPECTS ....................................................................... 14 4.2 FORMALISMS TO RE-CALCULATE ION CONCENTRATIONS IN
AQUEOUS EXTRACTS TO PORE-WATER CONCENTRATIONS ................... 15 4.3 AQUEOUS-EXTRACT DATA RE-CALCULATED TO A SOLID:LIQUID
RATIO OF O.5 ................................................................................................... 16 4.3.1 Results ............................................................................................................... 16 4.3.2 Observations ...................................................................................................... 16 4.3.3 Conclusions ....................................................................................................... 17 4.3.4 Recommendations ............................................................................................. 19 4.4 AQUEOUS-EXTRACT DATA RE-CALCULATED TO WATER CONTENT
OBTAINED FROM GRAVIMETRIC WATER LOSS OR FROM DENSITIES ..... 19 4.4.1 Observations ...................................................................................................... 19 4.4.2 Conclusions ....................................................................................................... 20 4.4.3 Recommendations ............................................................................................. 21
5. COMPARISON OF ALL CHEMISTRY DATA .................................................... 24
5.1 OBSERVATIONS – ANIONS ............................................................................. 25 5.2 CONCLUSIONS – ANIONS ............................................................................... 26 5.3 RECOMMENDATIONS – ANIONS .................................................................... 26 5.4 CONCLUSIONS AND RECOMMENDATIONS – CATIONS .............................. 34 5.5 DIRECT COMPARISON OF ANALYSES OF IDENTICAL SOLUTIONS ........... 35 5.5.1 Analysis of Standard Solutions........................................................................... 35 5.5.2 Analysis of Aqueous Extracts ............................................................................. 37 5.5.3 Discussion and Conclusions .............................................................................. 39
6. STABLE ISOTOPES OF WATER ..................................................................... 41
6.1 RESULTS .......................................................................................................... 41 6.2 OBSERVATIONS .............................................................................................. 42

vi
6.3 EXPLORING THE DISCREPANCIES BETWEEN RESEARCH GROUPS ........ 43 6.3.1 Calculation Basis ............................................................................................... 43 6.3.2 Results and Discussion ...................................................................................... 44 6.4 CONCLUSIONS ................................................................................................ 46 6.5 RECOMMENDATIONS ...................................................................................... 46
7. DISSOLVED NOBLE GASES ........................................................................... 47
7.1 HE AND 3HE/4HE: RESULTS AND OBSERVATIONS ...................................... 47 7.2 HE AND 3HE/4HE: CONCLUSIONS .................................................................. 48 7.3 AR AND 40AR/36AR: RESULTS AND OBSERVATIONS ................................... 50 7.4 AR AND 40AR/36AR: CONCLUSIONS ............................................................... 50
8. MINERALOGY .................................................................................................. 52
9. WATER CONTENT AND POROSITY ................................................................ 54
10. SPECIFIC SURFACE AREA ............................................................................. 57
11. CONCLUSIONS AND BEST PRACTICES OF PORE-WATER CHARACTERISATION IN OPALINUS CLAY ................................................... 59
11.1 GENERAL ASPECTS ........................................................................................ 59 11.2 DIRECT METHODS OF PORE-WATER ANALYSIS ......................................... 60 11.3 AQUEOUS EXTRACTION ................................................................................. 60 11.4 ISOTOPIC COMPOSITION OF PORE WATER ................................................. 61 11.5 DISSOLVED NOBLE GASES ........................................................................... 62 11.6 DENSITY AND POROSITY ............................................................................... 62
REFERENCES ......................................................................................................................... 65
APPENDIX A: DOCUMENTATION OF THE DATABASE ........................................................ 69
APPENDIX B: METHODS SUMMARIES ................................................................................ 107

vii
LIST OF TABLES Page
Table 1-1: Overview of Participating Teams and Research Groups Conducting On-site
Sampling and Laboratory Work ........................................................................................... 2 Table 1-2: Overview of Methods and Data Originally Provided by the Participating Research
Groups ................................................................................................................................ 4 Table 1-3: Overview of Error Types Reported by the Participating Research Groups ................. 6 Table 5-1: Summary Observations Pertinent to Anion Concentrations in Pore Waters;
Attempt at Qualitative Rating by Comparing Data with Benchmarks (ground water, seepage waters). Green = Consistent, Yellow = Somewhat Consistent, Red = Inconsistent ....................................................................................................................... 28
Table 5-2: Composition of Aqueous Extracts Analysed by Different Research Groups, Expressed as Ion Ratios ................................................................................................... 40
Table 6-1: Fractionation of Water Isotopes Between Vapour and Liquid Water at Different Temperatures, Calculated on the Basis of Horita & Wesolowski (1996) ............................ 44
LIST OF FIGURES Page
Figure 2-1: Stratigraphic Profile of the BDB-1 Borehole, Adapted from Hostettler et al.
(2017). Clay-mineral contents based on gamma logging according to Willenberg (2015) .... 8 Figure 2-2: Legend – Colours Used in Figures Throughout the Report ....................................... 9 Figure 3-1: Ion Concentrations and Ratios Obtained from Direct Pore-water Extraction
Techniques. Open Symbols Refer to Data Points Considered to be Uncertain for Analytical Reasons According to the Judgment of the Research Groups that Produced the Data. Ground-water Data are from Waber (in prep.), Data for Seepage Waters from Pearson et al. (2003), Müller & Leupin (2012), Vinsot et al. (2008) and Vogt (2013) ......... 12
Figure 4-1: Rock and Water Masses Used for Aqueous Extraction and Out-diffusion Tests. S*:L = Mass of Wet Rock:mass of Water Added ................................................................ 14
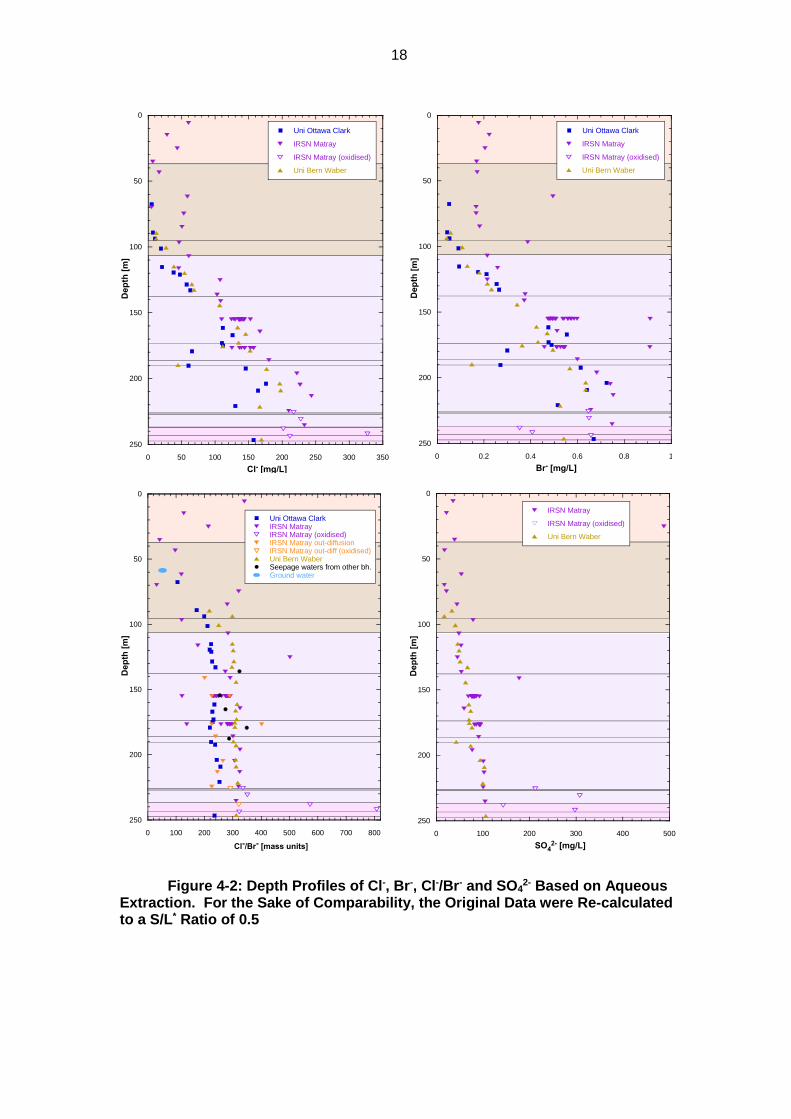
Figure 4-2: Depth Profiles of Cl-, Br-, Cl-/Br- and SO42- Based on Aqueous Extraction. For the
Sake of Comparability, the Original Data were Re-calculated to a S/L* Ratio of 0.5 ........... 18 Figure 4-3: Br- vs. Cl-/Br- Based on Aqueous Extraction of Different Grain-size Fractions of
Sample 155.10 by IRSN Matray. The Original Data were Re-calculated to a S/L* Ratio of 0.5 ................................................................................................................................. 19
Figure 4-4: Depth Profiles of Cl-, Br-, and SO42- (the latter linear and logarithmic) Based on
Aqueous Extraction, Re-calculated to Concentrations in Bulk Pore Water Based on Water Loss (Uni Ottawa Clark, Uni Bern Waber) and on Water Loss from Densities (IRSN Matray) ................................................................................................................... 22
Figure 4-5: Correlation of Halide Concentrations (re-calculated to anion-accessible porosity) in Samples Subjected to Both Aqueous Extraction and Out-diffusion by IRSN Matray. Numbers Adjacent to Symbols are Clay-mineral Contents in wt.% .................................... 23
Figure 5-1: Anion-accessible Porosity Fraction as a Function of Depth. Red Line: Simplified Trend Assumed by IRSN Matray and Used Here. Blue Squares: Data Derived by Uni Bern Mazurek from Combined Squeezing/aqueous-extraction Data. Clay-mineral Contents Based on Gamma Borehole Logging are Shown to the Right ............................. 25
Figure 5-2: Cl- Concentration in Anion-accessible Pore Water Based on 1) Direct and Indirect Extraction Techniques, 2) Ground Water and 3) Pore Water Obtained by Long-term in-situ Sampling Elsewhere in the Rock Laboratory ............................................................... 29

viii
Figure 5-3: Br- Concentration in Anion-accessible Pore Water Based on 1) Direct and Indirect Extraction Techniques, 2) Ground Water and 3) Pore Water Obtained by Long-term in-situ Sampling Elsewhere in the Rock Laboratory ............................................................... 30
Figure 5-4: Cl- /Br- Ratio in Pore Water Based on 1) Direct and Indirect Extraction Techniques, 2) Ground Water and 3) Pore Water Obtained by Long-term in-situ Sampling Elsewhere in the Rock Laboratory ..................................................................... 31
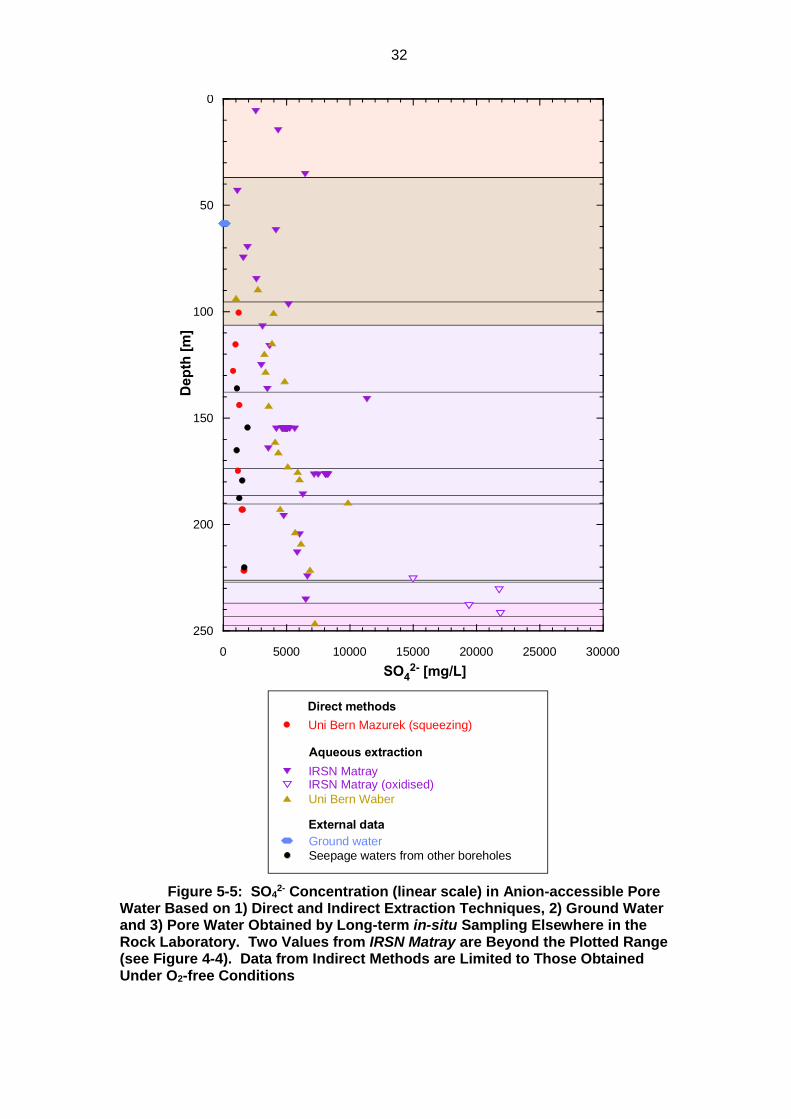
Figure 5-5: SO42- Concentration (linear scale) in Anion-accessible Pore Water Based on 1)
Direct and Indirect Extraction Techniques, 2) Ground Water and 3) Pore Water Obtained by Long-term in-situ Sampling Elsewhere in the Rock Laboratory. Two Values from IRSN Matray are Beyond the Plotted Range (see Figure 4-4). Data from Indirect Methods are Limited to Those Obtained Under O2-free Conditions ................................... 32
Figure 5-6: SO42- Concentration (log scale) in Anion-accessible Pore Water Based on 1)
Direct and Indirect Extraction Techniques, 2) Ground Water and 3) Pore Water Obtained by Long-term in-situ Sampling Elsewhere in the Rock Laboratory ...................... 33
Figure 5-7: Cl- and Br- Concentrations in Pore Waters at Mont Terri and Mont Russelin. Data are from Pearson et al. (2003) and Koroleva et al. (2011). Solid Line Indicates the Cl-
/Br- Ratio in Modern Sea Water ......................................................................................... 34 Figure 5-8: Cl- Analysis of Standard Solutions at Different Research Groups. The Research
Group that Analysed the Standards is Given in the Upper Left Corner of Each Graph. Red Bars Indicate the Target Values of the Standards, Error Bars Represent Analytical Uncertainty as Indicated by the Research Groups ............................................................. 36
Figure 5-9: Na+ Analysis of Standard Solutions at Different Research groups. The Research Group that Analysed the Standards is Given in the Upper Left Corner of Each Graph. Red Bars Indicate the Target Values of the Standards, Error Bars Represent Analytical Uncertainty as Indicated by the Research Groups ............................................................. 37
Figure 5-10: Comparison of Cl- Concentrations and Cl-/Br- Ratios in Selected Aqueous Extracts. The Horizontal Axis Shows the Original Data Reported by the Research Group that Produced the Extract, and the Vertical Axis Indicates Values Obtained from Later Re-measurement of the Same Solution by the Other Research Groups ................... 38
Figure 6-1: Depth Profiles of 2H and 18O in Pore Water ......................................................... 41 Figure 6-2: 2H vs. 18O in Pore Water. Local Meteoric Water Line (2H = 7.55 18O + 4.8)
According to Kullin & Schmassmann (1991) ...................................................................... 42 Figure 6-3: Effects of Incomplete Vacuum Distillation at 150 °C on the Values in Pore
Water. Blue Squares Indicate Data as Measured, Black Lines Show Calculated Values Assuming Values for fpure clay as Indicated .......................................................................... 45
Figure 6-4: Effects of Incomplete Vacuum Distillation at 80–100 °C on the Values in Distilled Water. Blue Squares Indicate Data as Measured, Black Lines Show Calculated Values ............................................................................................................................... 45
Figure 7-1: He Concentration as a Function of Depth on Linear (left) and Logarithmic (right) Scales ............................................................................................................................... 48
Figure 7-2: 3He/4He Ratio as a Function of Depth ..................................................................... 49 Figure 7-3: He Concentration and 3He/4He Ratio vs. Degree of Sample Contamination by
Atmospheric He ................................................................................................................. 49 Figure 7-4: He Concentration and 3He/4He Ratio as a Function of Clay Content ....................... 50 Figure 7-5: Ar Concentration and 40Ar/36Ar Ratio as a Function of Depth. Total Propagated
Errors are Also Shown ...................................................................................................... 51 Figure 8-1: Contents of Calcite, Quartz and Total Clay Minerals as a Function of Depth.
Filled Symbols Show Data from Uni Bern Waber, Open Symbols from IRSN Matray. Grey Line Represents Clay Contents Obtained from Gamma Borehole Logging (data smoothed over 20 cm) ....................................................................................................... 52

ix
Figure 8-2: Contents of Dolomite/ankerite, Siderite, Total Feldspars, Pyrite and Organic Carbon as a Function of Depth. Filled Symbols Show Data from Uni Bern Waber, Open Symbols from IRSN Matray ............................................................................................... 53
Figure 9-1: Wet Water Content as a Function of Depth ............................................................. 54 Figure 9-2: Porosity Obtained from Water Content and from Densities as a Function of Depth . 55 Figure 9-3: Correlation Between Porosity Obtained from Water Content and from Densities .... 55 Figure 9-4: Porosity Obtained from Water Content and from Densities as a Function of Clay
Content ............................................................................................................................. 56 Figure 10-1: BET and BJH Surface Areas as a Function of Depth ............................................ 57 Figure 10-2: Correlation Between BET Surface Area and Clay Content .................................... 58

x

1
1. INTRODUCTION
1.1 FRAMEWORK
The characterisation of pore-water chemistry in low-permeability rocks is an on-going challenge. There are several methods in use internationally to estimate the chemical and isotopic composition of pore water from clay-rich low-permeability rocks. Some are well known, including direct sampling of seepage in fractures and boreholes, high-pressure squeezing, advective displacement, aqueous extraction, out-diffusion, diffusive exchange and vacuum distillation. Another method that is represented in this work, a filter absorption method, is relatively new. Each method is accompanied by distinct challenges and many may be subject to artefacts of some kind and/or provide only partial information on pore-water composition. For example, aqueous extraction requires sample disaggregation and dilution, which exposes fresh mineral surfaces and may promote ion exchange, sulphide oxidation and dissolution of minerals. Further, some methods require a measure of pore volume, which in turn leads to complex questions about what porosity fraction is most relevant to particular solutes (e.g. anion-accessible porosity). No single technique has yet been found to be suitable across the entire range of clay-rich low-permeability geologic materials and environments of interest for waste isolation. Variations in site-specific characteristics, such as degree of induration, porosity and salinity, determine whether one or more of the available methods will yield useful data. For example, the advective displacement technique provides good results for pore-water chemistry in moderately indurated rocks (such as many of the formations studied in Europe), yet this method has been unsuccessful at extracting sufficient pore water for geochemical analysis in the more highly indurated, lower-porosity rocks from southern Ontario (Canada). In the context of the characterisation of clay-rich low-permeability rocks and associated pore waters for the purpose of long-term waste management, a number of the methods indicated above have been specifically adapted, modified and extensively tested to allow successful characterisation of the rock formation(s) of interest. With this in mind, the drilling of a new borehole (BDB-1) at the Mont Terri Underground Research Laboratory provided an opportunity within the DB-A Experiment to test, evaluate and observe similarities and differences in the results from a number of these specifically adapted methods. The BDB-1 borehole provided 247.5 m of core materials and a complete profile across the Opalinus Clay.
1.2 SCOPE AND OBJECTIVES
The main objective of this report is to compare the chemical and isotopic pore-water compositions determined by different research groups using a variety of techniques. The resulting data are then used to assess strengths and limitations of specific methods, as well as to better understand and potentially quantify possible artefacts. Based on this, information on method robustness and applicability in various low-permeability rocks can be obtained. Five research groups (listed in Table 1-1) participated in a co-ordinated sampling and laboratory programme to analyse and to compare the chemical and isotopic compositions of pore water along the BDB-1 profile. They submitted their individual data sets to the NWMO in the form of draft reports or simple data sheets, which have been compiled into two reference documents (see ‘reference for data’ in Table 1-1).

2
Only once all of the data were available, they were disclosed and formed the basis for this report. Research groups used their in-house analytical protocols, and there was no ambition to homogenise procedures among all. The methodologies are succinctly summarised in Appendix B, and Table 1-1 provides the most relevant references. For legibility reasons, the research groups are named throughout the report according to their affiliation and the name of the principal investigator. This report compares the various data sets, identifies similarities and explores the reasons for diverging results. The findings are then summarised in a section in which the best practices to characterise pore water in Opalinus Clay are discussed. The hydrogeological understanding of the pore-water profiles across Opalinus Clay will be treated in the frame of parallel projects and are not a topic of this report, which focuses only on methodological aspects. It should be noted that given the fact that the true pore-water compositions are not known, the various data sets can be compared but not benchmarked in the proper sense. The only data that could be considered as benchmarks originate from long-term borehole-water sampling campaigns in short boreholes along the laboratory tunnel (Pearson et al. 2003, Müller & Leupin 2012, Vinsot et al. 2008 and Vogt 2013). Combined with geochemical modelling, the compositions of these borehole waters can be considered as close representations of the in-situ pore-water composition for most parameters, but they were taken at some distance from the BDB-1 borehole. In this report, they were projected along strike to their equivalent positions in that borehole, which involves a limited degree of uncertainty.
Table 1-1: Overview of Participating Teams and Research Groups Conducting On-site Sampling and Laboratory Work
ON-SITE SAMPLING
Team Persons involved
Swisstopo D. Jäggi & team
Uni Bern Waber D. Rufer , H.N. Waber
Uni Ottawa Clark Shiran Qiu
LABORATORY WORK
Research group
Reference for data Reference for
methodologies Persons involved
Uni Ottawa Clark NWMO TM, 2017 NWMO TM, 2017 S. Murseli, S. Qiu, G. St-Jean, I. Clark
Uni Ottawa Al NWMO TM, 2017 NWMO TM, 2017 M. Celejewski, T. Al
IRSN Matray NWMO TM, 2017 NWMO TM, 2017 C. Yu, J. M. Matray
Uni Bern Mazurek
NWMO TM, 2017 Mazurek et al. (2015) M. Mazurek, T. Oyama,
A. M. Fernandez, D. Rufer, H.N. Waber
Uni Bern Waber Waber & Rufer (2017) Mazurek et al. (2012), Waber (2012), Rufer &
Waber (2015) H. N. Waber, D. Rufer

3
1.3 MEASURED PARAMETERS AND REPORTING OF ERRORS
Parameters on which the research groups originally provided information are summarised in Table 1-2. In the course of the project, further data were derived from these by calculations, with the objective to yield data that are directly comparable. Direct methods are defined here as those in which the pore water is not diluted by test water or other substances during extraction, and so provide concentrations that do not require re-calculation. Indirect methods involve dilution and so measured concentrations must be re-calculated in order to represent values in pore water. Various types of errors were reported by the research groups, including analytical error, total propagated error and variability among subsamples, and Table 1-3 provides an overview. Given the heterogeneous nature of reported errors, these are not shown in the graphics throughout the report (with some exceptions), but they are given in the data lists in Appendix A. It should be noted here that the focus of the methods comparison (i.e., first aim of the DB-A Experiment) was on the Opalinus Clay Formation, as well as the immediately overlying interface zone within the Passwang Formation. Additional data at shallower intervals are discussed only briefly in this report, with emphasis placed primarily on the results from the target formation intervals (~95-235 m). A second report (Waber and Rufer 2017) documents additional data, 50 to 100 m depth in the Passwang Formation, and is focused on the results of the aquifer interface investigation (i.e., the second aim of the DB-A Experiment) and the methods used.

4
Table 1-2: Overview of Methods and Data Originally Provided by the Participating Research Groups
Research Group Uni Ottawa Clark Uni Ottawa Al IRSN Matray Uni Bern Mazurek Uni Bern Waber
Chemical composition – Direct methods
Filter absorption Na+, K+, Ca2+, Mg2+, Sr2+,
Cl-, Br-
Squeezing
Na+, K+, Ca2+, Mg2+, Sr2+
Cl-, Br-, NO3-, SO4
2-
Alkalinity, TIC, pH
modelled parameters (pCO2, SI for carbonates,
and sulphates)
Chemical composition – Indirect methods: Aqueous extraction
Aqueous extraction: Composition of extract
Na+, K+, Ca2+, Mg2+, Sr2+
Cl-, Br-, I-, NO3-, SO4
2-
Si, Al, B
SI for sulphates
F-, Cl-, Br-, NO3-, SO4
2-
Na+, K+, NH4+, Ca2+, Mg2+,
Sr2+
F-, Cl-, Br-, NO3-, SO4
2-
Alkalinity, pH
modelled parameters (pCO2, SI for carbonates,
and sulphates).
Aqueous extraction: Composition re-calculated to water content
Na+, K+, Ca2+, Mg2+, Sr2+
Cl-, Br-, I-, NO3-, SO4
2-, B
SI for sulphates
Cl-
Aqueous extraction: Composition re-calculated to porosity from densities, considering anion-accessible porosity
F-, Cl-, Br-, NO3-, SO4
2-
Out-diffusion: Composition re-calculated to porosity from densities, considering anion-accessible porosity
Cl-, Br-, SO42-
Note: Uni Bern Mazurek also provided data on Cl-, Br- and water contents obtained by drying and aqueous extraction of core previously subjected to squeezing. This allows
calculation of total Cl- and water inventories in samples subjected to squeezing and of the anion-accessible porosity fraction.

5
Table 1-2 (continued)
Research Group Uni Ottawa Clark Uni Ottawa Al IRSN Matray Uni Bern Mazurek Uni Bern Waber
Water isotopes
Water isotopes 18O, 2H from µVDE 18O, 2H from squeezed
waters 18O, 2H from diffusive
exchange
Noble gases
Noble gases He, 3He/4He He, 3He/4He, Ar, 40Ar/36Ar
Ancillary data
Mineralogy Major phases, clay-
mineral species
Densities Bulk wet and grain
densities
Bulk wet and grain densities
Water content From drying in vacuum @
150 °C From drying @ 105 °C
From squeezing and drying @ 105 °C
From drying @ 105 °C
Porosities From water content From densities, from
water content From water content
From densities, from water content
Surface area BET, BJH BET

6
Table 1-3: Overview of Error Types Reported by the Participating Research Groups
Research Group Uni Ottawa Clark Uni Ottawa Al IRSN Matray Uni Bern Mazurek Uni Bern Waber
Chemical composition – Direct methods
Filter absorption Propagated analytical error
Squeezing Analytical error of IC analysis
Chemical composition – Indirect methods: Aqueous extraction
Aqueous extraction: Composition of extract 1 variability among 4
subsamples Analytical error Analytical error
Aqueous extraction: Composition re-calculated to water content
1 variability among 4 subsamples
not specified
Aqueous extraction: Composition re-calculated to porosity from densities, considering anion-accessible porosity
Propagated analytical error
Out-diffusion: Composition re-calculated to porosity from densities, considering anion-
accessible porosity Propagated analytical error
Water isotopes
Water isotopes 1 variability among 4
subsamples
Analytical error of CRDS analysis
Propagated analytical error
Noble gases
Noble gases not specified
He, Ar, 40Ar/36Ar, Ne, 20Ne/22Ne: larger of either 1
of 2-3 subsamples or propagated uncertainty on
their average value; 3He/4He: 1 variability among 2-5 subsamples
Ancillary data
Densities Propagated analytical error 1 variability among 3
subsamples

7
2. BOREHOLE PROFILE
The BDB-1 borehole was drilled perpendicular to bedding and penetrates the limestones of the Hauptrogenstein Formation, the mixed calcareous-argillaceous lithologies of the Passwang Formation, the Opalinus Clay and the uppermost part of the underlying clay-rich Staffelegg Formation (Figure 2-1). While the main focus of the data comparison exercise was the Opalinus Clay, some research groups also studied samples from the overlying, more calcareous units. Data from gamma-ray logging are available for large parts of the borehole profile, and the resulting clay-mineral contents based on these logs are also given in Figure 2-1, according to data of Willenberg (2015). While large parts of the Opalinus Clay are clay-rich with contents of 50–60 wt.%, there is a marked depression in clay-mineral contents in the sandy and carbonate-rich sandy facies in the interval 173.7–190.4 m. Sample IDs correspond to the mean depth in metres along hole. Colour codes used for the different geological units in Figures throughout the report are defined in Figure 2-2.

8
Figure 2-1: Stratigraphic Profile of the BDB-1 Borehole, Adapted from Hostettler et al. (2017). Clay-mineral contents based on gamma logging according to Willenberg (2015)

9
Figure 2-2: Legend – Colours Used in Figures Throughout the Report
Hauptrogenstein Fm.
Passwang Fm.
Opalinus Clay
Staffelegg Fm.

10
3. MAJOR-ION COMPOSITION BASED ON DIRECT METHODS: FILTER-PAPER ABSORPTION AND SQUEEZING
3.1 RESULTS
The full results are documented in Appendix A.1, and selected parameters are shown graphically in Figure 3-1. Method descriptions can be found in Appendix B.
0
50
100
150
200
250
0 5000 10000 15000 20000 25000 30000
Uni Ottawa Al (filter absorption)
Uni Bern Mazurek (squeezing)
Ground water
Seepage waters from other boreholes
0 20 40 60 80 100 120 140
0
50
100
150
200
250
Uni Ottawa Al (filter absorption)
Uni Bern Mazurek (squeezing)
Ground water
Seepage waters from other boreholes
0 500 1000 1500 2000 2500
0
50
100
150
200
250
Uni Ottawa Al (filter absorption)
Uni Bern Mazurek (squeezing)
Ground water
Seepage waters from other boreholes
0 50 100 150 200 250 300 350 400
0
50
100
150
200
250
Uni Ottawa Al (filter absorption)
Uni Bern Mazurek (squeezing)
Ground water
Seepage waters from other boreholes

11
0 5000 10000 15000 20000 25000
0
50
100
150
200
250
Uni Ottawa Al (filter absorption)
Uni Bern Mazurek (squeezing)
Ground water
Seepage waters from other boreholes
0 100 200 300 400 500 600 700 800
0
50
100
150
200
250
Uni Ottawa Al (filter absorption)
Uni Bern Mazurek (squeezing)
Ground water
Seepage waters from other boreholes
0 2000 4000 6000 8000 10000 12000 14000 16000
0
50
100
150
200
250
Uni Ottawa Al (filter absorption)
Uni Bern Mazurek (squeezing)
Ground water
Seepage waters from other boreholes
0 200 400 600 800 1000 1200 1400
0
50
100
150
200
250
Uni Ottawa Al (filter absorption)
Uni Bern Mazurek (squeezing)
Ground water
Seepage waters from other boreholes

12
Figure 3-1: Ion Concentrations and Ratios Obtained from Direct Pore-water Extraction Techniques. Open Symbols Refer to Data Points Considered to be Uncertain for Analytical Reasons According to the Judgment of the Research Groups that Produced the Data. Ground-water Data are from Waber & Rufer (2017), Data for Seepage Waters from Pearson et al. (2003), Müller & Leupin (2012), Vinsot et al. (2008) and Vogt (2013)
3.2 OBSERVATIONS
Major-ion concentrations obtained by Uni Bern Mazurek from squeezing show regular trends with depth and generally fit well together with data from seepage waters. Except for K+, ion concentrations increase with depth. The depth trends of SO4
2- both from squeezing and seepage waters show some variability and scatter, probably due to artefacts during sampling and analysis (e.g., due to bacterially mediated redox reactions). Nevertheless, data from both sources are consistent.
Data obtained by Uni Ottawa Al using the filter-absorption method yield ion concentrations that are substantially higher when compared to squeezing and seepage-water data. Subsamples at any given depth yield values that vary within substantial ranges, often in excess of a factor 2. The trends of increasing concentrations with depth are seen for Cl-, Br- and Na+ but not for Ca2+ and Mg2+.
Ion ratios based on squeezing and seepage waters are largely consistent, even though the Na+/K+ ratio in squeezed waters appears to be slightly lower. The Cl-
/Br- ratio in waters squeezed from Opalinus Clay is close to 300, i.e., near to the marine ratio and consistent with the results of Pearson et al. (2003).
Ion ratios based on the filter-absorption method differ systematically from the other data. Na+/K+ and Na+/Ca2+ are markedly lower. The Cl-/Br- ratio in Opalinus Clay is well defined around 200-230, which is remarkable because neither evaporation
0 2 4 6 8 10
0
50
100
150
200
250
Uni Ottawa Al (filter absorption)
Uni Bern Mazurek (squeezing)
Ground water
Seepage waters from other boreholes
0 20 40 60 80 100 120 140
0
50
100
150
200
250
Uni Ottawa Al (filter absorption)
Uni Bern Mazurek (squeezing)
Ground water
Seepage waters from other boreholes

13
nor oxidation are expected to affect this ratio (except in the unlikely situation that halite precipitates on the surface of the cleaved sample).
Saturation indices for carbonate and sulphate minerals could be calculated only for the squeezing data (Table A.2c). The squeezed water is oversaturated with respect to calcite and dolomite, a feature already seen previously (Mazurek et al. 2015). The squeezed water is close to saturation with respect to celestite, which may be plausible given the presence of trace amounts of this mineral in the rock. The squeezed water is always undersaturated with respect to gypsum.
3.3 CONCLUSIONS
Data obtained by squeezing are consistent with seepage-water data, show clear depth trends, and, for many parameters, may closely reflect the in-situ pore-water composition. SO4
2- concentrations are somewhat scattered in both seepage and squeezed waters, so the consistency and adequacy of the two data sets is more difficult to judge. Further uncertainties are related to the carbonate system, in particular to pH and p(CO2).
Data obtained by the filter-absorption method are affected by evaporation leading to errors in the quantification of pore-water mass, such that most ion concentrations are overestimated and yield heterogeneous patterns. The possible effect of oxidation is not quantifiable in the absence of SO4
2- data.
Evaporation alone does not explain all features of the filter-absorption data, as ion ratios also differ from those obtained by the other techniques. Possibly, the filter-absorption method taps a different pore-water reservoir, or the mechanisms of solute transport may be different. Subjecting the same materials to aqueous extraction may shed further light on halide concentrations and on the Cl-/Br- ratio.
3.4 RECOMMENDATIONS
For the squeezing method applied by Uni Bern Mazurek, further efforts to minimise the effects of redox processes on SO4
2- concentrations are advisable, as well as an attempt to better understand the carbonate system.
For the filter-absorption method applied by Uni Ottawa Al, a better control of evaporation during the experiments could improve the resulting data. Quantification of SO4
2- is essential in order to assess possible effects of oxidation. Aqueous extraction of subsamples taken at the same depth interval may shed light on the Cl-/Br- ratio.

14
4. MAJOR-ION COMPOSITION BASED ON INDIRECT METHODS: AQUEOUS EXTRACTION AND OUT-DIFFUSION
4.1 METHODOLOGICAL ASPECTS
The analytical protocols for aqueous extraction varied between research groups and method descriptions can be found in Appendix B. Figure 4-1 illustrates the masses of sample materials and water added. Aqueous extractions were performed under N2 atmosphere by IRSN Matray and Uni Bern Waber, while Uni Ottawa Clark extracted samples under atmospheric conditions. All research groups extracted wet rock (no drying). The ratio between the mass of wet rock and water added (S*:L) was around 0.25 for Uni Ottawa Clark, 0.5 for IRSN Matray and 1.0 for Uni Bern Waber. The raw data are documented in Appendix A.2. For out-diffusion tests by IRSN Matray, substantially higher rock masses were used, and the S*/L ratio was high, around 3.5. Protection from air was imperfect, and some oxidation took place during the experiments. The full data are given in Appendix A.6.
Figure 4-1: Rock and Water Masses Used for Aqueous Extraction and Out-diffusion Tests. S*:L = Mass of Wet Rock:Mass of Water Added
Uni Ottawa Clark
IRSN Matray
IRSN Matray (out-diffusion)
Uni Bern Waber
0
50
100
150
200
250
300
0 20 40 60 80
Mass of water added [g]
S*:L = 0.25
S*:L = 0.5
S*:L = 1
S*:L = 3.5

15
4.2 FORMALISMS TO RE-CALCULATE ION CONCENTRATIONS IN AQUEOUS EXTRACTS TO PORE-WATER CONCENTRATIONS
The formalism depends on the details of the experimental protocols. In particular, the solid/liquid ratio needs to be defined appropriately. The simplest case is when the rock was dried prior to extraction. In such a situation, the following equations apply:
𝐶𝑝𝑤 = 𝐶𝑙𝑒𝑎𝑐ℎ𝑎𝑡𝑒 𝑚𝑎𝑑𝑑𝑒𝑑
𝑚𝑝𝑤 α =
𝐶𝑙𝑒𝑎𝑐ℎ𝑎𝑡𝑒 𝑚𝑎𝑑𝑑𝑒𝑑
𝑊𝐶𝑑𝑟𝑦 𝑚𝑑𝑟 𝛼 =
𝐶𝑙𝑒𝑎𝑐ℎ𝑎𝑡𝑒
𝑊𝐶𝑑𝑟𝑦 𝑆
𝐿 𝛼
(1)
with
𝑊𝐶𝑑𝑟𝑦 = 𝑚𝑝𝑤
𝑚𝑑𝑟 (2)
𝑆
𝐿 =
𝑚𝑑𝑟
𝑚𝑎𝑑𝑑𝑒𝑑 (3)
Cpw = ion concentration in pore water Cleachate = ion concentration in extract water madded = mass of added water mpw = mass of pore water mdr = mass of dry rock
= anion-accessible porosity fraction WCdry = water content per mass of dry rock S/L = mdr / madded The formalism is different if wet rock was subjected to extraction, because the pore water present in the rock affects the solid/liquid ratio:
𝐶𝑝𝑤 = 𝐶𝑙𝑒𝑎𝑐ℎ𝑎𝑡𝑒 𝑚𝑙𝑒𝑎𝑐ℎ𝑎𝑡𝑒
𝑚𝑝𝑤 𝛼 =
𝐶𝑙𝑒𝑎𝑐ℎ𝑎𝑡𝑒 𝑚𝑙𝑒𝑎𝑐ℎ𝑎𝑡𝑒
𝑊𝐶𝑤𝑒𝑡 𝑚𝑤𝑟 𝛼 =
𝐶𝑙𝑒𝑎𝑐ℎ𝑎𝑡𝑒
𝑊𝐶𝑤𝑒𝑡 𝑆∗
𝐿∗ 𝛼 (4)
with
𝑊𝐶𝑤𝑒𝑡 = 𝑚𝑝𝑤
𝑚𝑤𝑟 (5)
𝑆∗
𝐿∗ = 𝑚𝑤𝑟
𝑚𝑙𝑒𝑎𝑐ℎ𝑎𝑡𝑒 (6)
WCwet = water content per mass of wet rock mleachate = mass of pore water + mass of added water mwr = mass of wet rock (i.e., dry dock + pore water) or, alternatively,
𝐶𝑝𝑤 = 𝐶𝑙𝑒𝑎𝑐ℎ𝑎𝑡𝑒 𝑚𝑙𝑒𝑎𝑐ℎ𝑎𝑡𝑒
𝑚𝑝𝑤 𝛼 =
𝐶𝑙𝑒𝑎𝑐ℎ𝑎𝑡𝑒 𝑚𝑙𝑒𝑎𝑐ℎ𝑎𝑡𝑒
𝑊𝐶𝑑𝑟𝑦 𝑚𝑑𝑟 𝛼 =
𝐶𝑙𝑒𝑎𝑐ℎ𝑎𝑡𝑒
𝑊𝐶𝑑𝑟𝑦 𝑆
𝐿∗ 𝛼 (7)
with
𝑊𝐶𝑑𝑟𝑦 = 𝑚𝑝𝑤
𝑚𝑑𝑟 (8)
𝑆
𝐿∗ = 𝑚𝑑𝑟
𝑚𝑙𝑒𝑎𝑐ℎ𝑎𝑡𝑒 (9)

16
Water content WCwet or WCdry is typically obtained by mass loss of the sample by drying to 105 °C (IRSN Matray, Uni Bern Waber) or 150 °C (Uni Ottawa Clark) to constant weight. The porosity obtained from water content is frequently slightly below that obtained from the measurement of bulk and grain density, a feature attributed to incomplete release of all pore water at the drying temperature and/or slight desaturation of the sample. IRSN Matray considered this and opted to calculate water content based on porosity derived from density data.
4.3 AQUEOUS-EXTRACT DATA RE-CALCULATED TO A SOLID:LIQUID RATIO OF O.5
4.3.1 Results
All aqueous-extract data were re-calculated to an arbitrary S/L* ratio of 0.5 for the sake of direct comparability. This simple calculation does not aim at calculating pore-water concentrations and does not depend on data or assumptions regarding anion
accessibility ( or water content. Uni Ottawa Clark and Uni Bern Waber provided concentrations for all major ions, mainly for the purpose of charge-balance calculations on the leachates and modelling mineral saturation indices for identification of mineral dissolution reactions. IRSN Matray provided data for anions only. Given the fact that aqueous extraction generally provides information on the pore-water concentrations of conservative anions (i.e., Cl-, Br-) but not on those of reactive anions (such as F-, SO4
2-) and all cations, the comparison here is limited to Cl- and Br-, with just a few comments on SO4
2-. It should also be noted that Uni Ottawa Clark did not have access to a glovebox, and oxidation had a major effect on measured concentrations of SO4
2- and cations (in addition to other processes that affect these solutes even when extraction is performed under O2-free conditions). Therefore, these data are not reported and discussed here. Aqueous-extraction data are shown in Figure 4-2 and listed in full in Appendix A.3.
4.3.2 Observations
Cl- concentrations differ somewhat between research groups, with generally low values from Uni Ottawa Clark and high values from IRSN Matray. Uni Bern Waber yield intermediate values.
Two samples of Uni Ottawa Clark (179.15, 190.15) and one of Uni Bern Waber (175.33) fall out of the general trend and have exceptionally low Cl- and Br- concentrations (Figure 4-2). In contrast, the Cl-/Br- ratios are not aberrant. These samples originate from the clay-poor zone within Opalinus Clay (see Figure 2-1). As clay and water contents are typically correlated, the latter are also low (WCwet = 0.016–0.023 g/g). Thus, the low Cl- and Br- concentrations are due to the low porosity of the samples and not to any kind of artefact. When re-calculated to the natural water content, the values follow the general trend (Figure 4-4 below).
The depth profile of Br- according to IRSN Matray shows more scatter, possibly due to the difficulty to quantify low Br- concentrations by IC.
In the carbonate-rich upper part of the profile, both Cl- and Br- concentrations reported by IRSN Matray are substantially higher than those of the other research groups, and the Cl-/Br- ratio is widely scattered.

17
The profiles of Cl-/Br- reported by Uni Ottawa Clark and Uni Bern Waber show smooth, well-defined profiles but with discrepant absolute values. Values around 300, as reported by Uni Bern Waber, are consistent with numerous previous studies at Mont Terri (e.g. Pearson et al. 2003; Figure 5-7), whereas the lower values of Uni Ottawa Clark are not. Data of IRSN Matray are somewhat scattered (including the data based on out-diffusion), as are their Br- data.
For samples 155.10 and 176.60, IRSN Matray extracted aliquots using a variety of experimental protocols. Extraction time, nature of the added water (milli-Q water or calcite-saturated solution) and solid/liquid ratio did not yield any systematic correlations with measured Cl- and Br- contents. Further, aliquots were sieved to grain-size fractions 200-500 µm, 100-200 µm and <100 µm. For sample 155.10, the resulting Cl- concentrations yielded widely overlapping values for all fractions. In contrast, Br- contents and therefore Cl-/Br- ratios showed a systematic variation as a function of grain size, as shown in Figure 4-3. The coarsest fraction yielded Cl-/Br- ratios around 290, i.e., close to the marine value and consistent with existing data. With decreasing grain-size fraction, Br- contents increased, leading to lower Cl-/Br- ratios. For sample 176.60, Cl-/Br- ratios for the fractions 200–500 and 100–200 µm are in the range 281–292 but vary widely in the range 138–297 for the fraction <100 µm.
The profiles of SO42- based on data of IRSN Matray and Uni Bern Waber yield
smooth and consistent profiles, with some outliers towards higher values for IRSN Matray. Samples taken by IRSN after months of storage under atmospheric conditions yield distinctly higher SO4
2- contents, which is a result of pyrite oxidation, in spite of sample processing under O2-free atmosphere.
4.3.3 Conclusions
Even though aqueous extraction appears to be a simple method, the details of the protocols matter. In particular, grain size and the methodology used for sample crushing are of importance. These issues have been previously investigated for the Opalinus Clay (e.g. Waber et al. 2003) and the Tournemire shale (e.g. Patriarche et al. 2004). Further, the analysis of Cl- and Br- by IC appears to be an issue at least for some research groups (see also Chapter 5).
A detailed study by IRSN Matray showed that Br- concentrations in aqueous extracts increase with decreasing grain-size fraction subjected to aqueous extraction, while Cl- does not show any dependence. Based on the fact that the Cl-
/Br- ratios in the coarsest fraction are consistent with existing data from Mont Terri, it is concluded that an additional source of Br- is tapped in the finer fractions that does not originate from the pore water. The nature of this source is enigmatic at this stage.
The fact that the Cl-, Br- and Cl-/Br- profiles of Uni Bern Waber show the smoothest depth trend increases the confidence in these data, given the fact that the system is diffusion-dominated. Further, the Cl-/Br- ratio according to this research group is consistent with existing data.
Sample storage under atmospheric conditions prior to processing and analysis (5 samples of IRSN Matray) leads to gross overestimations of SO4
2- concentrations in pore water and are not useful for any kind of interpretation. This also means that all cation concentrations are affected as well. To what degree the SO4
2- data obtained from samples whose exposure to atmospheric conditions was minimised to the degree possible (IRSN Matray, Uni Bern Waber) represent in-situ pore-water signatures will be further discussed in Chapter 5.
18
Figure 4-2: Depth Profiles of Cl-, Br-, Cl-/Br- and SO42- Based on Aqueous
Extraction. For the Sake of Comparability, the Original Data were Re-calculated to a S/L* Ratio of 0.5
Uni Ottawa Clark
IRSN Matray
IRSN Matray (oxidised)
Uni Bern Waber
0 50 100 150 200 250 300 350
0
50
100
150
200
250
0 0.2 0.4 0.6 0.8 1
0
50
100
150
200
250
Uni Ottawa Clark
IRSN Matray
IRSN Matray (oxidised)
Uni Bern Waber
Uni Ottawa ClarkIRSN MatrayIRSN Matray (oxidised)IRSN Matray out-diffusionIRSN Matray out-diff (oxidised)Uni Bern WaberSeepage waters from other bh.Ground water
0 100 200 300 400 500 600 700 800
0
50
100
150
200
250
0 100 200 300 400 500
0
50
100
150
200
250
IRSN Matray
IRSN Matray (oxidised)
Uni Bern Waber

19
Figure 4-3: Br- vs. Cl-/Br- Based on Aqueous Extraction of Different Grain-size Fractions of Sample 155.10 by IRSN Matray. The Original Data were Re-calculated to a S/L* Ratio of 0.5
4.3.4 Recommendations
Some focus should be placed on the methodology of crushing and its consequences. Uni Ottawa Clark hand crushed and sieved rock (2-4 mm), IRSN Matray used a knife mill, and Uni Bern Waber disintegrated the samples by hand. The diversity of methods may be in part responsible for the observed differences between research groups.
One way to further explore the effects of sample treatment, in addition to what has been previously accomplished, are sequential steps of crushing and extraction. In a first step, rock pieces several mm in size are extracted at a low S/L ratio. The same material is then crushed by hand in a mortar, followed by aqueous extraction. Finally, this material is crushed in a mechanical mill and extracted again.
4.4 AQUEOUS-EXTRACT DATA RE-CALCULATED TO WATER CONTENT OBTAINED FROM GRAVIMETRIC WATER LOSS OR FROM DENSITIES
The re-calculated data are listed in Appendix A.4.
4.4.1 Observations
As expected, the profiles of Cl-, Br-, and SO42- re-calculated to water content are
more regular than the original data (compare Figure 4-4 and Figure 4-2). In Figure 4-4, it becomes even more evident that there are systematic differences between research groups.
100
150
200
250
300
0.4 0.5 0.6 0.7 0.8 0.9
< 100 µm100 – 200 µm200 – 500 µm
Sample 155.10 m

20
In the clay-rich part of the studied profile (below 106 m), Cl- concentrations obtained by aqueous extraction at Uni Ottawa Clark are about 17 % lower, those of IRSN Matray about 20 % higher when compared to the data of Uni Bern Waber. Cl- concentrations based on out-diffusion by IRSN Matray are markedly below the aqueous-extraction data from the same research group (Figure 4-5). In general they lie between the trends of Uni Ottawa Clark and Uni Bern Waber.
In the calcareous lithologies in the upper part of the profile (Hauptrogenstein and Passwang Fm., 0–106 m), data obtained by aqueous extraction at Uni Ottawa Clark and by out-diffusion at IRSN Matray yield low Cl- concentrations (Figure 4-4). On the other hand, the values are scattered and may be substantially higher according to aqueous-extraction data of IRSN Matray (Figure 4-5).
Cl- concentrations of 2 out of 5 samples (and the Br- concentration of 1 sample) that were stored under atmospheric conditions for months prior to sampling by IRSN Matray are anomalously high. The reasons for this are not entirely clear – possibilities include the difficulty to constrain porosity on the basis of density measurements of dry, partially oxidised samples, or displacement of Cl- within the sample during drying.
The discrepancies between research groups are less for Br- than for Cl-. Aqueous-extraction data for Br- reported by Uni Ottawa Clark and Uni Bern Waber agree well and are also coherent with non-destructive out-diffusion data of IRSN Matray. Aqueous-extraction data for Br- reported by IRSN Matray are slightly higher in the clay-rich lithologies and orders of magnitude higher in calcareous lithologies, similar to what can be seen for Cl-. The two outliers in Opalinus Clay were obtained at an exceptionally low solid/liquid ratio of around 0.1. In the absence of a more extended data set, this observation cannot be further elaborated. One issue may be the low Br- concentration in the original extracts (<0.2 mg/L), which may pose analytical problems.
There is good agreement between SO42- concentrations obtained by IRSN Matray
and Uni Bern Waber. Note that those samples studied by IRSN Matray that were stored under atmospheric conditions fall out of the trend and show much higher values (even though sample processing occurred under O2-free atmosphere).
4.4.2 Conclusions
Cl- concentrations in the calcareous lithologies at 0–106 m depth are highly discrepant. The low values obtained by Uni Ottawa Clark and the out-diffusion data of IRSN Matray appear to be plausible and are consistent with the low salinity of the ground-water sample taken at 59 m. The much higher values obtained from aqueous extraction by IRSN Matray (Figure 4-5) apparently tap an additional reservoir of Cl- that is not seen by the other methods. A possible explanation is the decrepitation of saline fluid inclusions in the limestones during crushing of the rock (a knife mill was used).
The same discrepancy in Cl- concentrations as in the limestones is also seen throughout the clay-rich sequence, and it is more systematic but less pronounced. The liberation of Cl- from additional reservoirs has to be considered even for the clay-rich lithologies (see also previous work by Waber et al. 2003 and Patriarche et al. 2004) to explain the aqueous-extraction data of IRSN Matray. In any case, it appears that the method used for rock crushing (disaggregation by gently hammering to mm-sized pieces by Uni Bern Waber vs. fine crushing using a knife mill by IRSN Matray) markedly affects the results. For two samples of the Opalinus Clay, IRSN Matray separated different grain-size fractions prior to aqueous extraction (Figure 4-3). While Br- concentrations increased with decreasing grain

21
size (and moved away from the typical ratio of 290 at Mont Terri), no systematic shifts were identified for Cl- (Figure 4-3). However, the coarsest material was still <500 µm, at least one order of magnitude below the grain size used by Uni Bern Waber. Therefore, these results are not considered conclusive.
While the difference in Cl- concentrations between data of IRSN Matray (out-diffusion) and Uni Bern Waber on the one hand, and the higher values of IRSN Matray (aqueous extraction) on the other hand, can be potentially explained as a grain-size effect, the even lower values of Uni Ottawa Clark are difficult to rationalise. A possible explanation related to the IC analysis of Cl- is discussed below in Section 5.5.
Cl- concentrations obtained from samples that were stored dry under air prior to analysis are aberrant. Even though the details of the underlying artefact are not entirely clear, these outliers illustrate the need for fresh, saturated samples even for the quantification of conservative pore-water constituents.
Sample storage under atmospheric conditions prior to analysis leads to oxidation reactions that massively increase SO4
2- (and cation) concentrations in aqueous extracts, even if the aqueous extracts are prepared under O2-free conditions. Given the fact that the rock commonly constitutes the largest reservoir of S in the rock-water system (mainly pyrite, traces of sulphate minerals), even a minor contribution of mineral dissolution may have a major impact on concentrations in solution.
4.4.3 Recommendations
The crushing method and the resulting grain size affect the concentrations even of conservative constituents, such as Cl- and Br-. This effect is of prime importance in the limestones but may also play a role in clay-rich lithologies. The coarser the grain size, the lower the chance of accessing ion reservoirs other than connected pore water. Out-diffusion experiments are an end member in this sense (no crushing at all). It is recommended 1) to maximise grain size used for aqueous extraction to the degree possible, and 2) to perform dedicated experiments to identify the relationship between anion reservoirs, crushing methods and grain sizes.

22
Figure 4-4: Depth Profiles of Cl-, Br-, and SO42- (the latter linear and
logarithmic) Based on Aqueous Extraction, Re-calculated to Concentrations in Bulk Pore Water Based on Water Loss (Uni Ottawa Clark, Uni Bern Waber) and on Water Loss from Densities (IRSN Matray)
Uni Ottawa ClarkIRSN MatrayIRSN Matray (oxidised)IRSN Matray out-diffIRSN Matray out-diff (oxidised or not equil.)Uni Bern Waber
0 5000 10000 15000
0
50
100
150
200
250
0 10 20 30 40 50
0
50
100
150
200
250
Uni Ottawa ClarkIRSN MatrayIRSN Matray (oxidised)IRSN Matray out-diffIRSN Matray out-diff (ox. or not equil.)Uni Bern Waber
0 20000 40000 60000 80000 100000 120000
0
50
100
150
200
250
IRSN Matray
IRSN Matray (oxidised)
Uni Bern Waber
1000 10000 100000
0
50
100
150
200
250
IRSN Matray
IRSN Matray (oxidised)
Uni Bern Waber

23
Figure 4-5: Correlation of Halide Concentrations (re-calculated to anion-accessible porosity) in Samples Subjected to Both Aqueous Extraction and Out-diffusion by IRSN Matray. Numbers Adjacent to Symbols are Clay-mineral Contents in wt.%
0
5000
10000
15000
0 5000 10000 15000
Aqueous extraction: Cl- in anion-accessible porosity [mg/L]
0 29
52
50
62
62
5252
48
53
50
53
00
20
40
60
80
0 20 40 60 80
Aqueous extraction: Br- in anion-accessible porosity [mg/L]
50
6262 52
4852
53
50
53

24
5. COMPARISON OF ALL CHEMISTRY DATA
Data from the following sources are compared: 1) Direct methods (filter absorption method, squeezing) 2) Aqueous extraction and out-diffusion 3) Ground water from borehole BDB-1 (see Waber and Rufer 2017, for details) 4) In-situ pore-water sampling data from other locations in the Mont Terri URL In order to compare data from aqueous extraction and out-diffusion with the other methods, ion concentrations must be re-calculated to anion-accessible porosity instead of total porosity as done in Section 4.4. The concept of anion-accessible porosity goes back to the formulation of Pearson (1999) and is related to the fact that clay-mineral surfaces are negatively charged and therefore repel anions. The anion-
accessible porosity fraction () for Opalinus Clay at Mont Terri is 0.54 according to Pearson et al. (2003). IRSN Matray re-calculated their data using a factor 0.55, while the other research groups only reported concentrations in bulk pore water. For the sake of consistency and comparability, all data of all research groups have been
treated consistently, using a factor of 0.55 for in eq. (4) and (7). Following IRSN Matray, this value is used for all clay-rich rocks including the Passwang Formation,
whereas no anion exclusion, i.e., = 1, is assumed for the almost clay-free limestones of the Hauptrogenstein.
The parameter was also directly derived from combining squeezing and aqueous-extraction data (for methodology see Pearson et al. 2003 and Mazurek et al. 2015). As shown in Figure 5-1, the obtained values for Opalinus Clay are close to 0.55 as chosen by IRSN Matray (with one exception). In the Passwang Formation that contains mixed lithologies, the single measured value is 0.9. However, given the low
ion concentrations in the upper part of the profile, the uncertainty on has limited effects on the shapes of the ion-concentration profiles. Appendix A.5 documents results from aqueous extraction re-calculated to anion-accessible porosity.

25
Figure 5-1: Anion-accessible Porosity Fraction as a Function of Depth. Red Line: Simplified Trend Assumed by IRSN Matray and Used Here. Blue Squares: Data Derived by Uni Bern Mazurek from Combined Squeezing/aqueous-extraction Data. Clay-mineral Contents Based on Gamma Borehole Logging are Shown to the Right
5.1 OBSERVATIONS – ANIONS
The results of all available methods for Cl-, Br-, Cl-/Br- and SO4
2- are shown graphically in Figure 5-2 to Figure 5-6. On the one hand, these Figures compare the data sets and test their internal consistency. On the other hand, there is some independent information that can be used to benchmark the data, i.e., to compare them with data that are considered to closely represent true in-situ values. The following benchmarks are used: 1. Ground-water sample taken in the BDB-1 borehole at 58 m, i.e., in the
Passwang Formation overlying the Opalinus Clay. 2. Compositions of seepage waters obtained from long-term sampling in dedicated
boreholes at various locations in the rock laboratory (data from Pearson et al. 2003, Müller & Leupin 2012, Vinsot et al. 2008 and Vogt 2013). These waters were collected from short boreholes drilled from the laboratory tunnels, i.e., they do not originate from the BDB-1 borehole. In addition, the collection of seepage water occurred from differently designed and equipped boreholes and the water compositions may be affected by reactions in the borehole to different degrees. This is specifically the case for the carbon and sulphur systems. In Fig. 5-2 to Fig. 5-6, they were projected into the BDB-1 profile along strike, which assumes the absence of heterogeneity in this direction and so is associated with some uncertainty. However, given the fact that the Cl- profiles obtained from the BDB-
0 0.5 1
0
50
100
150
200
250
10 20 30 40 50 60 70

26
1 borehole and that from the ensemble of all information obtained from the laboratory tunnels are consistent, the projection appears justified.
3. There is a large number of analyses at Mont Terri and Mont Russelin indicating
that the Cl-/Br- ratio of pore waters at Mont Terri is close to the marine value of 290, irrespective of the salinity (Figure 5-7).
The main findings of the data comparison and, to the degree possible, the benchmarking are summarised in Table 5-1.
5.2 CONCLUSIONS – ANIONS
To the degree this can be judged, the Cl- and Br- concentrations obtained from out-diffusion by IRSN Matray, squeezing by Uni Bern Mazurek and aqueous extraction by Uni Bern Waber are adequate.
Aqueous extraction by IRSN Matray overestimated Cl- concentrations, most strongly so in clay-poor lithologies. This may be related to the crushing procedure (knife milling to fine powder), which may liberate Cl- that does not originate from pore water.
Aqueous extraction by Uni Ottawa Clark underestimates Cl- concentrations and Cl-/Br- ratios, while those of Br- concentrations are close to the expected values. The problem may lie in the calibration of the IC instrument (see Section 5.5).
To date, the filter absorption method does not provide reliable pore-water concentrations of anions. Data are scattered and overestimate the concentrations, likely due to difficulties with the quantification of the mass of water absorbed by the paper. Moreover, the Cl-/Br- ratio does not fit the expected value, an observation that requires further investigations.
The concentrations of SO42- are massively overestimated in those cases where the
samples were exposed to air prior to processing in an O2-free glovebox (some samples of IRSN Matray). This also means that all cation concentrations obtained from aqueous extracts of such samples are not representative.
Smooth and internally consistent SO42- profiles were obtained by Uni Bern Waber
and IRSN Matray, who used fresh materials and performed all processing under O2-free atmosphere. The concentrations are a factor ≥3 higher than those of seepage waters and waters squeezed by Uni Bern Mazurek. This means that SO4
2- was added to the solution in spite of all measures taken to minimise oxidation. Sources of SO4
2- are sulphate minerals (e.g., celestite, anhydrite) and pyrite. Possibly, some additional SO4
2- might be introduced by pyrite oxidation that occurred during the short periods during which the rock samples were exposed to air (e.g., during drilling, core recovery or crushing). SO4
2- concentrations obtained from squeezing by Uni Bern Mazurek are close to the values found in seepage waters.
A project dedicated to the identification of SO42- sources in aqueous extracts is
currently on-going at the University of Bern.
5.3 RECOMMENDATIONS – ANIONS
The methods used to crush the rock, and the grain size of the rock used for extraction, matter in the context of yielding representative pore-water concentrations and deserve in-depth investigation. Fine crushing appears to

27
provide access to anion reservoirs that do not belong to the connected pore water, possibly fluid inclusions in carbonate minerals. A systematic comparison of different crushing procedures (finely milled powder vs. pieces obtained by hammering vs. no crushing at all [out-diffusion]) would provide further insights. At this stage, it appears that protocols considering no or only limited crushing yield results that best match the benchmark data.
Calibration of the instrument used to quantify anion concentrations (frequently IC) deserves attention.
Mineral dissolution leads to an overestimation of pore-water SO42- concentrations
based on aqueous extraction, whereas additional sulphide oxidation can be minimised by extracting under O2-free atmosphere. Sources of SO4
2- as well as the underlying mechanisms deserve further attention and in-depth testing for each lithology.

28
Table 5-1: Summary Observations Pertinent to Anion Concentrations in Pore Waters; Attempt at Qualitative Rating by Comparing Data with Benchmarks (ground water, seepage waters). Green = Consistent, Yellow = Somewhat Consistent, Orange = Inconsistent
Group Method Cl- Br- Cl-/Br- SO42-
Bench-mark
Data from seepage waters taken at
other locations in the Mont Terri URL
Data from seepage waters taken at other locations in the Mont Terri
URL
Typical value of about 300 from Pearson et al. (2003), based on a
suite of methods
Data from seepage waters taken at other locations in the Mont Terri
URL
Uni Ottawa Clark
Aqueous extraction
Well defined depth trend, values about 15 % below those of
seepage waters
Well defined depth trend, concentrations consistent with
seepage-water data as well as data of IRSN Matray (out-diffusion), Uni Bern Mazurek (squeezing) and Uni Bern Waber (aqueous extraction)
Within the Opalinus Clay, values are consistently in the range 220–260, lower than data reported in
Pearson et al. (2003)
Uni Ottawa
Al
Filter absorption
Highly scattered data, always substantially above values in
seepage waters
Highly scattered data, always substantially above values in
seepage waters
Data scatter is less than that in the absolute concentrations of Cl- and
Br-, most data are in the range 190–240, i.e., substantially lower than
expected
IRSN Matray
Aqueous extraction
Well defined depth trend in the Opalinus Clay, values about 20 % above those of seepage waters.
Scattered data in calcareous units above the Opalinus Clay, values
much higher than in ground-water sample
Well defined trend in the Opalinus Clay, consistent with data from other research groups, but with some outliers towards higher
values. Scattered data in calcareous units above the
Opalinus Clay, values much higher than in ground-water sample
Some of the data in the Opalinus Clay are close to a value of 300 (Pearson et al. 2003), but other data show substantial scatter (mainly towards lower values)
Well-defined depth trend (some outliers), consistent with that of Uni
Bern Waber. However, concentrations are a factor ≥3
higher than seepage-water data. Values in Passwang Fm. are much higher than in ground-water sample
IRSN Matray
Out-diffusion
Well defined depth trend with values close to those of seepage waters but well below aqueous-extraction data from the same research group
Well defined depth trends, concentrations are consistent with
seepage-water data as well as data of Uni Ottawa Clark (aqueous
extraction)
Uni Bern Mazurek
Squeezing
Well-defined and consistent depth trends, good correspondence with
data from seepage waters
Very well defined and consistent range around 300, similar to a large
amount of data reported by Pearson et al. (2003)
Reasonably well defined depth trend, good correspondence with
data from seepage waters. Remaining uncertainty regarding
limited effects of mineral dissolution
Uni Bern Waber
Aqueous extraction
Well-defined depth trend (some outliers), consistent with that of
IRSN Matray. However,
concentrations are a factor ≥3 higher than seepage-water data

29
Figure 5-2: Cl- Concentration in Anion-accessible Pore Water Based on 1) Direct and Indirect Extraction Techniques, 2) Ground Water and 3) Pore Water Obtained by Long-term in-situ Sampling Elsewhere in the Rock Laboratory
0 5000 10000 15000 20000 25000 30000
0
50
100
150
200
250
Ground water
Seepage waters from other boreholes
Direct methods
Uni Ottawa Al (filter absorption)
Uni Bern Mazurek (squeezing)Dito, uncertain value
Dito, uncertain value
Uni Ottawa ClarkIRSN MatrayIRSN Matray (oxidised)IRSN Matray out-diffIRSN Matray out-diff (oxidised or not equil.)Uni Bern Waber
Aqueous extraction & out-diffusion
External data

30
Figure 5-3: Br- Concentration in Anion-accessible Pore Water Based on 1) Direct and Indirect Extraction Techniques, 2) Ground Water and 3) Pore Water Obtained by Long-term in-situ Sampling Elsewhere in the Rock Laboratory
Ground waterSeepage waters from other boreholes
Direct methods
Uni Ottawa Al (filter absorption)
Uni Bern Mazurek (squeezing)Dito, uncertain value
Dito, uncertain value
Uni Ottawa ClarkIRSN MatrayIRSN Matray (oxidised)IRSN Matray out-diffIRSN Matray out-diff (oxidised or not equil.)Uni Bern Waber
Aqueous extraction & out-diffusion
External data
0 20 40 60 80 100 120 140
0
50
100
150
200
250

31
Figure 5-4: Cl- /Br- Ratio in Pore Water Based on 1) Direct and Indirect Extraction Techniques, 2) Ground Water and 3) Pore Water Obtained by Long-term in-situ Sampling Elsewhere in the Rock Laboratory
Ground waterSeepage waters from other boreholes
Direct methods
Uni Ottawa Al (filter absorption)
Uni Bern Mazurek (squeezing)Dito, uncertain value
Dito, uncertain value
Uni Ottawa ClarkIRSN MatrayIRSN Matray (oxidised)IRSN Matray out-diffIRSN Matray out-diff (oxidised or not equil.)Uni Bern Waber
Aqueous extraction & out-diffusion
External data
0 100 200 300 400 500 600
0
50
100
150
200
250
32
Figure 5-5: SO42- Concentration (linear scale) in Anion-accessible Pore
Water Based on 1) Direct and Indirect Extraction Techniques, 2) Ground Water and 3) Pore Water Obtained by Long-term in-situ Sampling Elsewhere in the Rock Laboratory. Two Values from IRSN Matray are Beyond the Plotted Range (see Figure 4-4). Data from Indirect Methods are Limited to Those Obtained Under O2-free Conditions
Ground water
Seepage waters from other boreholes
Uni Bern Waber
External data
IRSN MatrayIRSN Matray (oxidised)
Direct methods
Uni Bern Mazurek (squeezing)
Aqueous extraction
0 5000 10000 15000 20000 25000 30000
0
50
100
150
200
250

33
Figure 5-6: SO42- Concentration (log scale) in Anion-accessible Pore
Water Based on 1) Direct and Indirect Extraction Techniques, 2) Ground Water and 3) Pore Water Obtained by Long-term in-situ Sampling Elsewhere in the Rock Laboratory
100 1000 10000 100000
0
50
100
150
200
250
Ground water
Seepage waters from other boreholes
Uni Bern Waber
External data
IRSN MatrayIRSN Matray (oxidised)
Direct methods
Uni Bern Mazurek (squeezing)
Aqueous extraction

34
Figure 5-7: Cl- and Br- Concentrations in Pore Waters at Mont Terri and Mont Russelin. Data are from Pearson et al. (2003) and Koroleva et al. (2011). Solid Line Indicates the Cl-/Br- Ratio in Modern Sea Water
5.4 CONCLUSIONS AND RECOMMENDATIONS – CATIONS
Given the fact that SO42- concentrations appear to be overestimated by all
methods that involve the addition of water (aqueous extraction, out-diffusion) even when working under O2-free conditions, cation concentrations are equally affected and therefore not representative of in-situ concentrations. Another point is that adding water reduces the ionic strength, which in turn affects equilibria in the exchanger population. In particular, bivalent cations are sorbed, while monovalent cations are desorbed at lower ionic strength, which affects the concentrations in solution. Finally, the addition of water leads to partial dissolution of carbonate and sulphate minerals. In conclusion, aqueous extraction and out-diffusion are useful to quantify conservative anions but unsuitable for reactive anions and all cations.
Viable alternatives that remain for the quantification of cations are direct methods only, and these are presented and illustrated in Section 3 and Figure 3-1. The preceding discussion indicates that cation (and anion) concentrations from squeezing by Uni Bern Mazurek yield data that are mostly consistent with concentrations in seepage waters. On the other hand, the concentrations derived by Uni Ottawa Al using the filter absorption method are highly scattered and yield generally much higher concentrations. This method is currently being developed further.
Given the various processes that affect cation concentrations when using indirect methods involving the addition of water, there is little hope that this approach will ever be able to provide reliable data on cation concentrations in pore water.
Out of the methods applied in this study, squeezing is the method of choice at this stage. It is also the only one that yields information on pH, TIC and TOC, i.e., data needed for geochemical modelling of the carbonate system. Nevertheless, there are some issues with the squeezing method that require further investigations:
0 5 10 15 20 250.0
20
40
60
80
Mont Russelin – Ground water
Mont Terri – Water sampling
Mont Terri – SqueezingMont Russelin – Squeezing
Cl- [g/L]

35
- Squeezing is currently limited to rocks with >3-3.5 wt.% water content, which excludes clay-poor lithologies as well as highly compacted shales.
- Squeezed waters are oversaturated with respect to calcite and dolomite, most probably due to the pressure dependence of mineral solubility and/or due to lattice damage due to deformation during squeezing. The underlying mechanisms are not fully understood.
- One possible approach is to quantify artefacts is to study samples that were equilibrated with pore water(s) of known composition(s).
Further direct pore-water sampling techniques are available but have not been included in this study. The advective-displacement method of Mäder et al. (2004) has been successfully used on samples from Mont Terri and elsewhere. Ultracentrifugation could be another choice but has never been used for Opalinus Clay. It has been applied on calcareous marls of the Effingen Member from the Oftringen borehole (Switzerland) but was not successful (Mazurek et al. 2012).
5.5 DIRECT COMPARISON OF ANALYSES OF IDENTICAL SOLUTIONS
In order to shed further light on the observed differences in the results obtained for aqueous extracts, an additional analytical effort was made at a later stage. Each of the three participating research groups (Uni Ottawa Clark, IRSN Matray and Uni Bern Waber) prepared 2–3 standard solutions with known Cl- contents and exchanged these with the other research groups. These tests were blind, and the target Cl- concentrations were disclosed only after the delivery of the data by the research groups. In addition, a small number of remaining materials from aqueous extracts were also exchanged for analysis by the other research groups. The objective was to test whether the analytical instruments used by the research groups were appropriately calibrated and suited for the analysis of the aqueous extracts.
5.5.1 Analysis of Standard Solutions
The full data are documented in Appendix A.13. Results for Cl- are shown in Figure 5-8, which illustrates that all measurements are consistent with the target values of the standards within the uncertainty range indicated by the research groups. It is concluded that at the time when the standard solutions were analysed, all analytical instruments were properly calibrated and yielded reliable Cl- concentrations. Uni Ottawa Clark used both IC and ICP-MS instruments, and the results are virtually identical. Uni Ottawa Clark and IRSN Matray also reported Na+ concentrations, and the comparison with the target values is shown in Figure 5-9. Values reported by Uni Ottawa Clark are slightly below the target values (outside the indicated uncertainty range). Values of IRSN Matray are also below the target values, but the discrepancy is less, and only 2 out of 6 values are outside the uncertainty range.

36
Figure 5-8: Cl- Analysis of Standard Solutions at Different Research Groups. The Research Group that Analysed the Standards is Given in the Upper Left Corner of Each Graph. Red Bars Indicate the Target Values of the Standards, Error Bars Represent Analytical Uncertainty as Indicated by the Research Groups

37
Figure 5-9: Na+ Analysis of Standard Solutions at Different Research groups. The Research Group that Analysed the Standards is Given in the Upper Left Corner of Each Graph. Red Bars Indicate the Target Values of the Standards, Error Bars Represent Analytical Uncertainty as Indicated by the Research Groups
5.5.2 Analysis of Aqueous Extracts
Analysis of all major ions were provided by the research groups, and the full results are given in Appendix A.131. The results for Cl- are shown in Figure 5-10, and the following observations can be made:
For aqueous extracts originally prepared by IRSN Matray and Uni Bern Waber, Cl- concentrations measured for all 3 research groups are consistent, within error, in most cases (Figure 5-10, top).
A systematic deviation is observed between the original data for extracts prepared by Uni Ottawa Clark and the data from re-measurement by the other two research groups (Figure 5-10, bottom). Uni Ottawa Clark's original data yield markedly lower Cl- concentrations than the other two research groups, whose data are consistent within error. The average difference is 21 %. The Cl-/Br- ratios are in the range 210–253 according to Uni Ottawa Clark but 279–311 according to the other research groups. The latter are consistent with literature values, while the former are lower (see Figure 5-7). On this basis, it might be conjectured that the calibration of the IC instrument used by Uni Ottawa Clark may have been inaccurate at the time when the original extracts were measured, even though it
1 Samples 132.63 and 166.08 extracted by Uni Bern Waber were also analysed by IRSN Matray and Uni
Ottawa Clark. While the results of Uni Ottawa Clark are in agreement with those of Uni Bern Waber, data
from IRSN Matray yield highly inconsistent results. It was suspected that these two samples were mixed
up by mistake. If IRSN's results for these samples were exchanged, they would be in good
correspondence with those of the other labs. Due to the resulting uncertainty, these two samples were
excluded from the discussion. At a later stage, the mix-up was confirmed by IRSN.

38
was clearly excellent at the time of re-measurement (as demonstrated by the analyses of standard solutions and also corroborated by the ICP-MS data). If this is true, then the low Cl- concentrations in aqueous extracts reported by Uni Ottawa Clark (Figure 4-4, Figure 5-2) may in reality be higher and therefore closer to the data from other research groups.
A full comparison of ion concentrations is provided in Table 5-2. Data for Na+ are reasonably consistent among research groups, whereas K+, Ca2+, Mg2+ and SO4
2- yield more heterogeneous patterns. As a general rule, the consistency of the data tends to be better for higher concentrations of an ion.
Figure 5-10: Comparison of Cl- Concentrations and Cl-/Br- Ratios in Selected Aqueous Extracts. The Horizontal Axis Shows the Original Data Reported by the Research Group that Produced the Extract, and the Vertical Axis Indicates Values Obtained from Later Re-measurement of the Same Solution by the Other Research Groups

39
5.5.3 Discussion and Conclusions
Standard solutions were exchanged among research groups and analysed blindly for Cl- (and in some cases Na+) concentrations. For Cl-, all measured values are within the indicated uncertainty range (5–10 %) of the target values. This means that, at the time of analysis of the standard solutions, the IC instruments were well calibrated and suited to quantify Cl- within the concentration range of interest. In addition, Uni Ottawa Clark used an ICP-MS instrument to quantify Cl, and the results are virtually identical to those obtained by IC.
Na+ concentrations in standard solutions were measured by Uni Ottawa Clark and IRSN Matray. Measured data are about 14 % below the target values for Uni Ottawa Clark and 8 % for IRSN Matray.
Existing aqueous extracts were split and sent to other research groups for analysis. For Cl-, extracts produced by IRSN Matray and Uni Bern Waber yielded results that are in most cases consistent within error with the original data. For extracts produced by Uni Ottawa Clark, the re-measurement by the other research groups yielded concentrations about 27 % higher than the original data. The re-measured Cl-/Br- ratios are similar to literature values, while they are markedly lower in the original data of Uni Ottawa Clark. These arguments suggest that the original Cl- concentrations reported by Uni Ottawa Clark may be too low.
Measured Na+ concentrations in aqueous extracts show a good consistency among research groups, and most results are within 10 %.
K+, Ca2+, Mg2+ and SO42- yield a degree of consistency comparable to that of the
Cl- data. Discrepancies tend to be more substantial with decreasing ion concentrations.
The identified differences between the results of different research groups suggest that calibration of the IC instrument is an issue that requires attention.

40
Table 5-2: Composition of Aqueous Extracts Analysed by Different Research Groups, Expressed as Ion Ratios
Sa
mp
le I
D
Na
+ (
IRS
N)
/ N
a+ (
UniO
tt)
Na
+ (
UniB
e)
/ N
a+ (
Un
iOtt
)
Na
+ (
IRS
N)
/ N
a+ (
UniB
e)
K+ (
IRS
N)
/ K
+ (
UniO
tt)
K+ (
UniB
e)
/ K
+ (
UniO
tt)
K+ (
IRS
N)
/ K
+ (
UniB
e)
Ca
2+ (
IRS
N)
/ C
a2
+ (
UniO
tt)
Ca
2+ (
UniB
e)
/ C
a2
+ (
UniO
tt)
Ca
2+ (
IRS
N)
/ C
a2
+ (
UniB
e)
Mg
2+ (
IRS
N)
/ M
g2
+ (
UniO
tt)
Mg
2+ (
UniB
e)
/ M
g2
+ (
UniO
tt)
Mg
2+ (
IRS
N)
/ M
g2
+ (
UniB
e)
Cl-
(IR
SN
) /
Cl-
(UniO
tt I
C)
Cl-
(UniB
e)
/ C
l- (U
niO
tt I
C)
Cl-
(IR
SN
) /
Cl-
(UniB
e)
Br-
(IR
SN
) /
Br-
(UniO
tt)
Br-
(UniB
e)
/ B
r- (U
niO
tt)
Br-
(IR
SN
) /
Br-
(UniB
e)
SO
42
- (I
RS
N)
/ S
O4
2- (U
niO
tt)
SO
42
- (U
niB
e)
/ S
O4
2- (U
niO
tt)
SO
42
- (I
RS
N)
/ S
O4
2- (U
niB
e)
IRSN BDB1-61.75 0.85 0.93 0.84
IRSN BDB1-74.78 0.82 0.86
IRSN BDB1-96.70 0.86 0.92 0.86
IRSN BDB1-107.00 0.79 0.87
IRSN BDB1-125.12 0.85 0.77 0.82
IRSN BDB1-141.1 0.77 0.91 0.78
IRSN BDB1-164.30 1.27 1.34 0.28
IRSN BDB1-185.97 0.96 1.00
IRSN BDB1-204.73 0.90 0.90
IRSN BDB1-213.23 0.98 0.94 0.95
IRSN BDB1-235.41 0.86 0.86
UniBern BDB1-89.45 0.99 1.14 0.87 1.16 1.26 0.91 1.02 0.90 1.13 1.17 1.02 1.15 1.09 1.04 1.05 1.08 1.11 1.07 1.04
UniBern BDB1-189.71 1.07 1.18 0.91 1.31 1.36 0.97 1.13 0.84 1.36 1.17 1.02 1.14 1.08 1.02 1.06 1.24 1.10 1.06 1.04
UniBern BDB1-221.28 1.02 1.10 0.93 1.45 1.40 1.04 0.98 0.55 1.78 1.09 0.84 1.30 1.13 1.02 1.11 0.91 1.08 1.04 1.04
UniOttawa BDB1-101.25 0.84 0.94 0.90 0.86 0.92 0.94 1.10 0.93 1.18 1.19 1.07 1.12 1.46 1.30 1.13 1.22 1.18 1.04
UniOttawa BDB1-132.85 0.98 1.05 0.93 1.02 1.03 0.99 1.09 0.55 1.97 1.10 1.33 1.30 1.02 1.13 1.27 1.28 1.00
UniOttawa BDB1-166.95 1.01 0.98 0.59 1.27 1.16 1.10 0.93 0.87 1.07 1.48 1.24 1.19
UniOttawa BDB1-190.15 0.89 0.89 1.13 1.13 1.44 1.09 1.32 1.27 1.23 1.03
UniOttawa BDB1-220.72 1.01 1.01 1.20 1.18 1.02 0.97 1.14 1.21 0.94

41
6. STABLE ISOTOPES OF WATER
6.1 RESULTS
Results shown in Figure 6-1 and Figure 6-2 were obtained by vacuum distillation at 150 °C (Uni Ottawa Clark), diffusive isotope exchange (Uni Bern Waber) and by squeezing (Uni Bern Mazurek). The data are listed in Appendix A.7.
Figure 6-1: Depth Profiles of 2H and 18O in Pore Water
Uni Ottawa Clark (vacuum distillation)
Uni Bern Mazurek (squeezing)
Uni Bern Waber (diffusive exchange)
Ground water
Seepage waters from other boreholes
-75 -70 -65 -60 -55 -50 -45
0
50
100
150
200
250
-10 -9.5 -9 -8.5 -8 -7.5 -7 -6.5
0
50
100
150
200
250
Uni Ottawa Clark (vacuum distillation)
Uni Bern Mazurek (squeezing)
Uni Bern Waber (diffusive exchange)
Ground water
Seepage waters from other boreholes

42
Figure 6-2: 2H vs. 18O in Pore Water. Local Meteoric Water Line
(2H = 7.55 18O + 4.8) According to Kullin & Schmassmann (1991)
6.2 OBSERVATIONS
Results of Uni Bern Mazurek and Uni Bern Waber yield consistent, smooth and regular profiles.
Data of Uni Ottawa Clark yield more negative values. The difference is particularly
substantial for 2H. The profiles for both isotopes are less regular, and, at least for 2H, show a positive excursion in the clay-poor zone 174–190 m.
For 2H, data of Uni Bern Mazurek and Uni Bern Waber are consistent with or slightly higher than values obtained from borehole seepages. Data of Uni Ottawa Clark yield markedly more negative values.
For 18O, the values of Uni Ottawa Clark are close to or slightly higher than those from borehole seepages, whereas data of Uni Bern Mazurek and Uni Bern Waber are about 1 ‰ higher when compared to the seepages.
-80
-75
-70
-65
-60
-55
-50
-45
-40
-10 -9.5 -9 -8.5 -8 -7.5 -7
Uni Ottawa Clark (vacuum distillation)
Uni Bern Mazurek (squeezing)
Uni Bern Waber (diffusive exchange)
Ground water
Seepage waters from other boreholes

43
As seen in Figure 6-2, data of Uni Bern Mazurek, Uni Bern Waber, of borehole seepages and of ground water are mostly close to the local meteoric water line, whereas those of Uni Ottawa Clark are below this line.
6.3 EXPLORING THE DISCREPANCIES BETWEEN RESEARCH GROUPS
6.3.1 Calculation Basis
The fact that the values reported by Uni Ottawa Clark show a positive excursion in the clay-poor zone in the interval 174–190 m not identified by the other research groups suggests that this excursion within the low-permeability sequence is related to the applied test protocol, and that there is a relationship to the presence of clay minerals. Potential underlying processes could be incomplete distillation and/or release of structural or hydration water from clay minerals. In order to test the hypothesis of incomplete distillation, scoping calculations were performed considering a Rayleigh-distillation process. The equation for Rayleigh distillation can be rewritten for stable water isotopes as follows (Faure 1986):
𝛿𝑟𝑒𝑠𝑖𝑑 = (𝛿0 + 1000) 𝑓𝛼−1 − 1000 (10)
with = 18O or 2H
resid = isotopic composition of the residual water remaining in the sample
0 = initial composition of pore water (prior to distillation) f = liquid mass fraction remaining
= fractionation factor of stable water isotopes between vapour and liquid.
The following mass-balance equation links the values of initial, residual and evaporated water: 𝛿0 = 𝑓 𝛿𝑟𝑒𝑠𝑖𝑑 + (1 − 𝑓) 𝛿𝑣𝑎𝑝 𝑐𝑢𝑚 (11)
with vap cum = cumulative isotopic composition of evaporated water. Combining these equations leads to
𝛿0 = 𝑓 (1000 𝑓𝛼−1 − 1000) + (1−𝑓) 𝛿𝑣𝑎𝑝 𝑐𝑢𝑚
1−𝑓 𝑓𝛼−1 (12)
This equation allows the calculation of the original isotopic composition of the pore water 0 if
the fractionation factor (and the mass fraction (f) of water remaining in the sample are known. Further, the following assumptions are made: a. Distillation occurs in an open system, i.e., evaporated water is instantaneously removed; b. The system is in local thermodynamic equilibrium; c. There is only one isotopically homogeneous reservoir of liquid water; d. Distillation occurs only at a specified temperature.
Fractionation factors vapour-water ≈ 1000 ln are known on the basis of experimental work by Horita & Wesolowski (1996) and are given in Table 6-1 for different temperatures.

44
Table 6-1: Fractionation of Water Isotopes Between Vapour and Liquid Water at Different Temperatures, Calculated on the Basis of Horita & Wesolowski (1996)
Temperature [°C]
1000lnvapour-water for
2H [‰V-SMOW]
1000lnvapour-water for
18O [‰V-SMOW]
80 -36.74 -5.92
100 -27.90 -5.08
150 -12.59 -3.50
Further, it was assumed that all water remaining is associated to clay minerals, while release from surfaces of other minerals is considered to be complete. Therefore, the fraction remaining in each sample was scaled by its clay-mineral content obtained from gamma borehole logging according to fsample = fpure clay * clay content [wt.%] / 100. The idea behind this is the attempt to
explain the conspicuous positive excursion of values within the clay-poor zone in Opalinus Clay by considering a less complete distillation (larger fsample) in clay-rich samples.
6.3.2 Results and Discussion
A suite of calculations using eq. (12) were performed with a range of values for fpure clay at the distillation temperature of 150 °C, and results are shown in Figure 6-3 and Figure 6-4:
The maximum possible effect of incomplete distillation occurs when only a small fraction of
the pore water is distilled (fpure clay close to 1). For 2H, the calculated shift towards more
positive values due to incomplete distillation is nonetheless insufficient for all values of fpure clay to explain the discrepancy to the data obtained from squeezing and diffusive exchange (compare with Figure 6-1). It follows that incomplete distillation at 150 °C alone
cannot explain the observed discrepancies for 2H.
On the other hand, incomplete distillation with a realistic value of 0.1 for fpure clay yields values
for 18O that are consistent with those obtained from the other methods, and the excursion
towards higher 18O values in the clay-poor zone at 174–190 m is eliminated to a large degree in this scenario. However, the same fpure clay value should explain the data of both water isotopes, so another process must be considered instead of or in addition to incomplete distillation at 150 °C.
Assuming that at least part of the water was released during the initial heating stage at temperatures well below 150 °C leads to larger fractionation factors and therefore stronger effects of incomplete distillation. At 80 and 100 °C and for fpure clay values of about 0.4 and
0.6, respectively, the shift of the 2H values leads to a pattern that is consistent with the
other methods (Figure 6-4). However, the corresponding fpure clay value for 18O is only 0.03,
so again incomplete distillation cannot consistently explain both the 2H and the 18O data.

45
Figure 6-3: Effects of Incomplete Vacuum Distillation at 150 °C on the Values in Pore Water. Blue Squares Indicate Data as Measured, Black Lines Show Calculated Values Assuming Values for fpure clay as Indicated
Figure 6-4: Effects of Incomplete Vacuum Distillation at 80–100 °C on the Values in Distilled Water. Blue Squares Indicate Data as Measured, Black Lines Show Calculated Values
Based on these scoping calculations, it is concluded that incomplete distillation alone cannot explain the discrepancies between the methods, and other mechanisms must be considered. One potential effect is the tapping of an additional reservoir during vacuum distillation not accessed by the other methods, such as the volatilisation of water from clay minerals. A dedicated study is currently on-going at the University of Ottawa. Marumo et al. (1995)

46
interpreted water with anomalously high 2H evolved from smectitic clay at 200–300 °C as residual interlayer water. This means that some interlayer water remained in the system until
200 °C, and that water evolved at lower temperature had substantially lower 2H, leaving the
heavy hydrogen in the rock. Further, McKay & Longstaffe (2013) identified a lowering of 18O of structural oxygen in smectitic clay in response to steam injection in wells, with no systematic
effects on 2H. These examples show that residual interlayer as well as structural water in clay minerals may potentially play a role during the vacuum-distillation process.
Clay minerals typically have higher 18O and lower 2H than coexisting water. One might
conjecture that a contribution of hydroxyl water shifted the measured 18O data to higher and
2H data to lower values. Thus, the combined effects of incomplete distillation and release of hydroxyl water could at least qualitatively explain the observed shifts. However, the isotopic composition and relative contribution of hydroxyl water are unknown. Together with the unknown value for fpure clay, there are too many free parameters, so the full process cannot be quantified at this stage.
6.4 CONCLUSIONS
Concerning 2H, there are major discrepancies among the results obtained by the different research groups. The internally consistent, smooth and lithology-independent depth profiles reported by Uni Bern Mazurek and Uni Bern Waber, together with the position of the data along the meteoric water line (consistent with findings of Pearson et al. 2003) support the adequacy of these data. Seepage waters yield values that are close to or up to 5 ‰ more
negative than these data. On the other hand, 2H values reported by Uni Ottawa Clark are substantially more negative and show a dependence on lithology.
The discrepancy between research groups is limited for 18O. Here, the data of Uni Ottawa Clark show a better consistency with seepage-water data than those of the other research groups.
Scoping calculations indicate that incomplete distillation cannot explain the shift towards
more negative values in the data set of Uni Ottawa Clark. Work is on-going at the University of Ottawa (and the University of Western Ontario) to assess the potential for water from clay minerals to contribute to a negative shift in the δ2H signature for smectite-rich clays, such as the Opalinus Clay, as well as the potential magnitude of such a shift, when using vacuum distillation.
6.5 RECOMMENDATIONS
Given the observed discrepancies between research groups, the adequacy of the various methods applied to study the stable-isotope composition of pore water in Opalinus Clay deserve further investigations. One possible route would be to equilibrate samples with waters of known isotopic composition and then have them analysed by the different methods.

47
7. DISSOLVED NOBLE GASES
Uni Ottawa Clark provided data on He concentrations and on 3He/4He ratios. Uni Bern Waber reported He and Ar concentrations as well as 3He/4He and 40Ar/36Ar ratios. The methods of field sampling and sample processing differed substantially between the research groups and are described in NWMO TM (2017) and Rufer & Waber (2015). All data are listed in Appendix A.8. Measured 3He/4He ratios were re-calculated relative to the ratio in air (Ra). Uni Ottawa Clark used a value of Ra = 1.38E-6, Uni Bern Waber used Ra = 1.34E-6 according to Lee et al. (2006).
7.1 HE AND 3HE/4HE: RESULTS AND OBSERVATIONS
Results are given in Figure 7-1 and Figure 7-2.
Data of Uni Bern Waber yield slightly higher He concentrations than those of Uni Ottawa Clark (Figure 7-1). The profiles of both research groups are relatively flat. He concentrations are close to or slightly below the maximum values of about 1E-4 cm3 STP/gpore water reported by Rübel et al. (2002).
The two points with low He concentrations in the data set of Uni Ottawa Clark originate from the clay-poor zone 174–190 m. In the data set of Uni Bern Waber, one outlier towards higher values is observed in this zone.
There are 3 outliers (values >1 Ra) of 3He/4He in the data set of Uni Ottawa Clark and 1-2 outliers in the data set of Uni Bern Waber (Figure 7-2). With one exception, they all originate from the clay-poor zone 174–190 m. In the case of Uni Ottawa Clark, the outliers correlate with low He concentration. In the Opalinus Clay, the in-situ production ratio of 3He/4He is <<1 Ra, so measured values >1 Ra are likely due to some kind of artefact. The only natural He source with 3He/4He >1 Ra is the mantle, but it appears highly unlikely that mantle He may be present at Mont Terri. In the case of Uni Ottawa Clark, the samples with 3He/4He >1 Ra are also those with the lowest He concentrations, meaning that the propagated error in the calculation of 3He/4He in pore water is likely substantial. The outlier of Uni Bern Waber does not correlate with low He concentration and remains difficult to explain.
The degree of contamination by atmospheric He is substantially higher for Uni Ottawa Clark when compared to Uni Bern Waber (Figure 7-3). In both cases, contamination was corrected in order to obtain pore-water values. There is an apparent correlation of both He concentration and 3He/4He ratio with the degree of air contamination in the data set of Uni Ottawa Clark, while data of Uni Bern Waber do not show any correlation. The 3 outliers with high 3He/4He in the data set of Uni Ottawa Clark originate from clay-poor and therefore harder samples for which sample conditioning was difficult and took more time. This could have led to substantial out-gassing of pore water, and this could explain both the low He concentration and the higher relative contamination by He from air as seen in Figure 7-3. On the other hand, the positive correlation of 3He/4He with relative contamination is more difficult to explain, except for the fact that the error on 3He/4He in pore water increases substantially with increasing contamination.
He concentrations from the two data sets best converge in samples with high clay content (Figure 7-4).

48
7.2 HE AND 3HE/4HE: CONCLUSIONS
The sampling and experimental protocols used by the two research groups are substantially different. The fact that the degree of He contamination from the atmosphere is much lower for Uni Bern Waber is likely due to the fact that the rock-sample mass (and therefore also the mass/surface ratio) exceeded that used by Uni Ottawa Clark (300–400 g and 4–8 g, respectively). With a He concentration in air of merely 5.24 ppmv, the primary cause for elevated relative contamination in a sample gas is almost exclusively the loss of pore-water He but only marginally the incorporation of large amounts of air (see also Rufer & Waber 2015).
Some degree of He outgassing during sampling may have occurred in the case of Uni Ottawa Clark, leading to somewhat lower He concentrations.
Data from both research groups show outliers in the clay-poor zone at 174–190 m. In the case of Uni Ottawa Clark, the likely reason is the difficulty to subcore the relatively hard rock. The process took >30 min in such lithologies, and the subcore was generally fragmented, leading to outgassing and therefore underestimation of He concentrations. In the case of Uni Bern Waber, the reason for the one high value is less obvious but may in some way be linked to the low water content in the sandy-calcareous sample.
The He and 3He/4He data sets from both research groups converge for clay-rich samples but show differences at lower clay (and therefore water) contents for reasons discussed above.
Figure 7-1: He Concentration as a Function of Depth on Linear (left) and Logarithmic (right) Scales
0 2E-5 4E-5 6E-5 8E-5 1E-4
0
50
100
150
200
250
Uni Ottawa Clark
Uni Bern Waber
Ground water
1E-6 1E-5 1E-4 1E-3
0
50
100
150
200
250
Uni Ottawa Clark
Uni Bern Waber
Ground water

49
Figure 7-2: 3He/4He Ratio as a Function of Depth
Figure 7-3: He Concentration and 3He/4He Ratio vs. Degree of Sample Contamination by Atmospheric He
0.1 1 10
0
50
100
150
200
250
Uni Ottawa Clark
Uni Bern Waber
Ground water

50
Figure 7-4: He Concentration and 3He/4He Ratio as a Function of Clay Content
7.3 AR AND 40AR/36AR: RESULTS AND OBSERVATIONS
Results obtained by Uni Bern Waber are shown in Figure 7-5.
The results are much more sensitive to air contamination than the He data, as the Ar partial pressure in air is 3 orders of magnitude higher than that of He. The necessary corrections lead to large error bars, in particular for 40Ar/36Ar.
Both the Ar and 40Ar/36Ar profiles are relatively flat. An evolution of 40Ar/36Ar to markedly higher values of about 330 at the base of Opalinus Clay as reported by Rübel et al. (2002) is not resolvable.
7.4 AR AND 40AR/36AR: CONCLUSIONS
Even at the low level of air contamination in the samples taken by Uni Bern Waber, the effects are substantial and lead to large error bars. Most of the measured 40Ar/36Ar ratios are consistent within error with the atmospheric value of 298.56 (Lee et al. 2006), and a similar near-atmospheric value has also been measured in the ground-water sample.

51
Figure 7-5: Ar Concentration and 40Ar/36Ar Ratio as a Function of Depth. Total Propagated Errors are Also Shown
1E-4 1E-3
0
50
100
150
200
250
Uni Bern Waber
Ground water
200 250 300 350 400 450 500
0
50
100
150
200
250
Uni Bern Waber
Ground water

52
8. MINERALOGY
The full data base is given in Appendix A.9. Results obtained by IRSN Matray and Uni Bern Waber are shown in Figure 8-1 and Figure 8-2. The two data sets are consistent to the degree this can be judged. Clay-mineral contents fit well with those obtained from gamma borehole logging.
Figure 8-1: Contents of Calcite, Quartz and Total Clay Minerals as a Function of Depth. Filled Symbols Show Data from Uni Bern Waber, Open Symbols from IRSN Matray. Grey Line Represents Clay Contents Obtained from Gamma Borehole Logging (data smoothed over 20 cm)
0 20 40 60 80
0
50
100
150
200
250
Calcite
Quartz
Total clay minerals

53
Figure 8-2: Contents of Dolomite/ankerite, Siderite, Total Feldspars, Pyrite and Organic Carbon as a Function of Depth. Filled Symbols Show Data from Uni Bern Waber, Open Symbols from IRSN Matray
0
50
100
150
200
250
0 5 10 15
Dolomite / Ankerite
Siderite
Total feldspars
Pyrite
C(org)

54
9. WATER CONTENT AND POROSITY
All data are listed in Appendix A.10 and A.11. Water content as a function of depth is illustrated in Figure 9-1, and porosities are given in Figure 9-2.
Data obtained by different research groups agree well in Opalinus Clay. In particular, the low water contents in the clay-poor zone 174–190 m are seen consistently.
In the lithologically heterogeneous Passwang Formation, data scatter is substantial. While water contents of Uni Bern Mazurek are generally lower than those of IRSN Matray2, the differences may well be due to heterogeneity rather than lab-specific protocols.
Porosities obtained from water content and from densities show similar depth profiles (Figure 9-2).
Porosity obtained from densities is equal to or slightly larger than that obtained from water content (Figure 9-3). This is a commonly seen feature due to the incomplete release of pore water at 105 °C and/or partial desaturation of the sample (see, e.g., Wersin et al. 2013).
There is a positive correlation between porosity and clay content (Figure 9-4), again a well-known feature. The correlation is better for the data of Uni Bern Waber than for IRSN Matray.
Figure 9-1: Wet Water Content as a Function of Depth
2 For the sake of comparability, the data shown for IRSN Matray refer to actual measured water contents.
In their original files, IRSN Matray calculated water content from porosity obtained from densities, in order to account for effects of possible desaturation and/or incomplete release of water at 105 °C.
0 0.01 0.02 0.03 0.04 0.05 0.06 0.07 0.08
0
50
100
150
200
250
Uni Ottawa ClarkIRSN MatrayUni Bern MazurekUni Bern Waber

55
Figure 9-2: Porosity Obtained from Water Content and from Densities as a Function of Depth
Figure 9-3: Correlation Between Porosity Obtained from Water Content and from Densities
0 5 10 15 20
0
50
100
150
200
250
Uni Ottawa ClarkIRSN MatrayUni Bern MazurekUni Bern Waber
0 5 10 15 20
0
50
100
150
200
250
IRSN Matray
Uni Bern Waber

56
Figure 9-4: Porosity Obtained from Water Content and from Densities as a Function of Clay Content

57
10. SPECIFIC SURFACE AREA
Surface areas were characterised by the BET and BJH methods, and results are shown in Figure 10-1 and 10-2. Data are listed in Appendix 12.
Data obtained by IRSN Matray using the BET and BJH methods on the same samples yield almost identical results.
BET surfaces obtained by Uni Bern Waber are consistently lower than those of IRSN Matray. The reasons for the discrepancy are unknown at this stage.
Data of Uni Bern Waber show a well-defined correlation of BET surface with clay content (Figure 10-2). This correlation is less well expressed in the data set of IRSN Matray.
Figure 10-1: BET and BJH Surface Areas as a Function of Depth
BET surface IRSN Matray
BET surface Uni Bern Waber
BJH surface IRSN Matray
0
0
50
100
150
200
250
0 5 10 15 20 25 30 35 40
0
50
100
150
200
250

58
Figure 10-2: Correlation Between BET Surface Area and Clay Content
0
5
10
15
20
25
30
35
40
0 10 20 30 40 50 60 70
IRSN MatrayUni Bern Waber

59
11. CONCLUSIONS AND BEST PRACTICES OF PORE-WATER CHARACTERISATION IN OPALINUS CLAY
The conclusions and recommendations in this chapter are strictly valid for Opalinus Clay only. However, they can be extrapolated to other clay-rich formations to some degree. Depending on the mineralogy, porosity and pore-water salinity, some issues relevant for Opalinus Clay may have a smaller impact elsewhere. For example, in highly saline pore-water systems, the contribution of salinity released from sources other than connected pore water may be negligible. On the other hand, other issues such as low water content or presence of soluble minerals such as gypsum/anhydrite or halite in the rock may emerge.
11.1 GENERAL ASPECTS
Even if only a few of the major ions are of direct interest (e.g. Cl- in aqueous extracts), it is advisable to analyse the complete major-ion composition of the water. The obvious advantage is the possibility to calculate the charge balance as a quality criterion of the analytical instruments used. A major-ion analysis can be considered good if charge balance is below 5–10 %. Further, full compositions can provide additional relevant information (e.g. solubility control by minerals).
To this end, it is also advisable to constrain dissolved carbon species (typically dominated by HCO3
-) by measuring pH, dissolved organic and inorganic carbon contents, and/or by measuring total alkalinity. Note that total alkalinity determined by titration may include other compounds (e.g. Si, B, low-molecular weight organics), and so may not correspond to the carbonate alkalinity. In particular, in diluted solutions such as aqueous extracts, the contribution of carbon species may be relevant for charge balance. Further, pH and TIC are necessary for geochemical model calculations (pCO2, mineral saturation indices), which are required for the derivation of an internally consistent in-situ pore-water composition.
The calculation of saturation indices for sulphate and carbonate minerals provides a quality criterion for the chemical analysis of any kind of experimental waters. For carbonate minerals, this requires knowledge of pH and concentrations of carbonate species (derived from measurements of dissolved carbon contents and/or alkalinity).
Calibration of analytical instruments appears to be an issue in some cases. Recurrent calibration covering the whole concentration range of interest, reproducibility and recovery tests, and cross-checking by other methods is recommended.
Knowledge of the mineralogical composition of the rock is essential for the understanding and interpretation of measurements pertaining to the chemical and isotopic composition of pore water and also helps with the identification of artefacts. For example, this was the case for various aberrant data from the clay-poor zone at 174–190 m in the BDB-1 borehole.
When reporting ion concentrations obtained from aqueous extraction, it is necessary to clearly state in text, figures and tables whether they refer to 1) concentrations in the extract solution, 2) concentration in bulk pore water, or 3) concentration in anion-accessible pore water. Respecting this seemingly trivial issue potentially avoids unnecessary misunderstandings.

60
11.2 DIRECT METHODS OF PORE-WATER ANALYSIS
Filter absorption method
At the present stage, this method suffers from artefacts such as pore-water evaporation during the experiment. There is as yet no clear explanation for the observation that the conservative ion ratios differ from those obtained by other methods. Additional studies and adaptations of the method are underway to gain a better understanding of the data and to minimise the potential for evaporation.
Squeezing
Apart from the advective-displacement method that was not applied in this study, squeezing is currently the only method that provides data on the full chemical and isotopic composition. The resulting data generally compare favourably with independent information obtained from seepage waters. TIC/TOC, alkalinity and pH data are also obtained for squeezed water and can be used for the calculation of pCO2 and mineral saturation indices. There are remaining issues and questions regarding squeezing, and these are being addressed at the University of Bern.
The majority of parameters determined on squeezed water obtained from the first fraction (i.e., at the lowest pressure) compare best with the benchmark data obtained from seepage waters.
Concentrations of monovalent ions decrease in later squeezing steps at higher pressures, likely an artefact of ion filtration and associated re-equilibration of the solution with the rock.
Similarly, the stable-isotope composition evolves towards lower values. Concentrations of bivalent cations tend to increase with pressure, probably a consequence of pressure-dependent mineral solubilities.
While SO42- concentrations are similar to those in seepage waters, they are considered less
certain than concentrations of other solutes.
Squeezed waters tend to be oversaturated with respect to calcite, probably due to the fact that mineral solubilities increase with pressure, due to the creation of lattice defects during sample deformation in the squeezing chamber and/or due to degassing of the squeezed water during water collection and storage.
Squeezing is applicable to clay-bearing rocks with water contents >3–3.5 wt.%. It is not applicable for harder rocks, such as limestones.
11.3 AQUEOUS EXTRACTION
Aqueous extraction provides information on the pore-water concentrations of conservative anions (i.e., Cl- and Br-). Because Br- concentrations may be close to or below the detection limit of routine ion chromatography in aqueous extracts, information may be limited to Cl-, unless more sensitive analytical methods or instruments (such as ICP-MS) are used.
Aqueous extraction is always related to a dilution of the pore water, leading to a lower salinity. This leads to partial dissolution of minerals (in particular carbonates, sulphides and sulphates) and also affects equilibria in the exchanger population (divalent cations are preferentially sorbed, monovalent cations are desorbed). Additional oxidation reactions (sulphides) can be minimised by extraction under O2-free atmosphere. The contributions of

61
cations from mineral dissolution and cation-exchange reactions cannot be properly quantified. Therefore, measured cation concentrations in aqueous extracts cannot be used to calculate pore-water concentrations. Even though the re-calculation of measured contents to pore-water concentrations is mathematically simple, it is geochemically not appropriate and should be avoided.
Re-calculated concentrations of SO42- in aqueous extracts potentially overestimate those in
pore water even if extraction is performed under O2-free atmosphere. In case of extraction under air when sulphide minerals are present, the overestimation is considerably greater. The potential sources of SO4
2- include trace amounts of sulphate minerals (typically not seen by standard XRD analysis) or sulphides, such as pyrite. There is an on-going project at the University of Bern targeted at this issue.
Depending on whether dry or saturated rock is extracted, different equations apply for the re-calculation of ion concentrations in aqueous extracts to pore-water concentrations. While the definition of the solid/liquid ratio (S/L) is straightforward for the extraction of dry rock, the pore water remaining in the sample in case of wet extraction needs to be properly considered.
Anions in clay-bearing lithologies can access only a fraction of the pore space that is available to water and dissolved cations. When re-calculating anion concentrations in aqueous extracts to concentrations in free pore water, the anion-accessible porosity fraction
() needs to be considered.
In addition to the connected pore water, there is an additional source of Cl- in the rocks. Its identity is not clear, but it may originate from fluid inclusions in carbonate minerals or quartz, and its relative contribution is largest in clay-poor lithologies where it may dominate. It is recommended to disintegrate the rock mildly along the grain boundaries, ideally manually, instead of using mechanical mills that result in very small particle sizes. In order to evaluate the contribution of the second reservoir, aqueous extracts of rocks milled by different methods should be performed and compared. Out-diffusion tests performed on intact cores are the end member in which the mechanical effects are minimised.
If only the Cl- concentration is of interest, extraction can, in principle, be performed under air on wet or dried samples, provided porosity is properly measured. Nevertheless, there is some benefit of working under O2-free conditions, as the impact of artefacts is less and the extract compositions provide less strongly disturbed data.
Aqueous extraction of vintage samples that dried out and partially oxidised yields highly uncertain anion concentrations in pore water. Reasons include 1) the development of a heterogeneous Cl- distribution in samples due to the enrichment along evaporation fronts, and 2) the uncertainty related to the determination of porosity of dry clay-rich materials.
11.4 ISOTOPIC COMPOSITION OF PORE WATER
Three fundamentally different methods were applied to extract pore water for isotope
analysis (vacuum distillation, diffusive exchange, squeezing). For 18O, the agreement between the methods is typically within 0.5 ‰ (even though some seepage waters used for
comparison have slightly lower 18O). For 2H, squeezing and diffusive-exchange data are consistent, while vacuum distillation yields values that are 10–15 ‰ lower.
The comparison with data obtained from seepage water is not fully conclusive – for 18O, the
best agreement is obtained with data from vacuum distillation, while 2H yields better consistency with data from squeezing and diffusive exchange.

62
Unlike the other methods, vacuum distillation shows a dependence of the isotopic composition on mineralogical composition (positive excursion in a clay-poor zone within the Opalinus Clay), a feature that is not expected in a diffusion-dominated system. It is likely that this excursion is a methodological artefact.
Scoping calculations indicate that incomplete distillation alone cannot explain the
discrepancy of 18O and 2H between vacuum-distillation data and those from the other methods, irrespective of the choice of values for the water fraction remaining in the rock and temperature. It is suggested on a qualitative basis that a combination of incomplete distillation and release of structural or hydration water from clay minerals may provide a potential explanation.
In order to resolve the discrepancies among methods and to gain understanding on the underlying processes, it is suggested to distribute samples with known isotopic composition of pore water to the various research groups for benchmark testing. Such samples can be prepared by diffusive equilibration with an external water reservoir.
11.5 DISSOLVED NOBLE GASES
Preventing loss of He through degassing and minimising contamination with air requires that sampling techniques be designed to facilitate rapid sampling and to minimise the ratio of rock-surface area exposed to air to rock volume.
For less clay-rich and lithologically more heterogeneous samples, an accurate determination of the water content on the same specimen on which the noble gases were measured is recommended.
Due to elevated hydrocarbon concentrations frequently observed in pore waters of sedimentary rocks, a sophisticated and efficient cleaning procedure has to be applied in order to prevent interferences on the noble gas measurements.
11.6 DENSITY AND POROSITY
It is advisable to measure bulk wet density (instead of bulk dry density) and to calculate bulk dry density from this measurement using the water content. Clay-rich rocks shrink during drying, which affects the direct measurement of bulk dry density and may lead to overestimations.
Porosity obtained from water content tends to be slightly below porosity calculated from density measurements, in particular for clay-rich samples. The difference between the two methods is either due to significant portions of pores not accessible to water transport or, more likely, due to the incomplete removal of pore water at 105 °C in weight-loss measurements or partial desaturation of the samples. These effects do not affect density measurements, so, in principle, these may be better representations of in-situ values. However, density measurements also have some disadvantages (larger analytical errors, samples are small and possibly not representative in case of material heterogeneity, subsamples used for bulk- and grain-density measurements are adjacent but not identical materials). Therefore, it is recommended to obtain porosity both from water-loss and density data. This provides a data-quality check and yields information on the magnitude of potential artefacts.

63
The porosity of a typical clay-rich rock is difficult to measure on samples that were exposed to atmospheric conditions and dried out. The only way to constrain porosity is by measuring bulk dry and grain density. In particular, bulk-dry density measurements on vintage samples are affected by various processes, such as sample shrinkage, cracking and mineral reactions (sulphide oxidation, formation of gypsum and Fe-hydroxides) that are difficult to quantify. The error on bulk dry density propagates to the porosity value and therefore affects the re-calculation of ion contents in aqueous extracts to pore-water concentrations. Cl- concentrations obtained using density data from vintage samples may differ from the true values by a factor of 2 or more.

64

65
REFERENCES
Celejewski, M. and T. Al. 2014. An absorption method for extraction and characterization of
porewater from low-permeability rocks using cellulosic sheets. Appl. Geochem. 49, 22–30.
Faure, G. 1986. Principles of isotope geology, 2nd ed. Wiley, 589 pp. Fernández, A.M., A. Melón, D.M. Sánchez, E. Gaucher, C. Tournassat, S. Altmann, A. Vinsot,
N. Maes, M. De Craen, O. Leupin, P. Wersin and J. Astudillo. 2009. Study of different argillaceous formations performed in the context of the FUNMIG project: pore water chemistry and physical, mineralogical and geochemical properties in Boom Clay, Callovo-Oxfordian, Opalinus Clay and Boda Claystone rock samples. Publicación Técnica de Enresa 05/2009, 214 pp. (Available at www.enresa.es).
Fernández, A.M., D.M. Sánchez-Ledesma, C. Tournassat, A. Melón, E. Gaucher, J. Astudillo
and A. Vinsot. 2014. Applying the squeezing technique to highly consolidated clayrocks for pore water characterisation: lessons learned from experiments at the Mont Terri rock laboratory. Appl. Geochem. 49, 2–21.
Horita, J. and D.J. Wesolowski. 1996. Liquid-vapor fractionation of oxygen and hydrogen
isotopes of water from the freezing to the critical temperature. Geochim. Cosmochim. Acta. 58, 3425–3437.
Hostettler, B., A.G. Reisdorf, D. Jäggi, G. Deplazes, H.R. Bläsi, A. Morat, S. Feist-Burkhart, A.
Waltschew, V. Dietze and U. Menkveld Gfeller. 2017. Litho- and biostratigraphy of the 250 m deep borehole Mont Terri BDB-1 through the Opalinus Clay and bounding formations, St. Ursanne, Switzerland. Swiss J. Geosci., in press.
Hummel, W., U. Berner, E. Curti, F.J. Pearson and T. Thoenen. 2002. Nagra /PSI
thermochemical data base 01/01. Nagra Technical Report NTB 02–16, Nagra, Wettingen, Switzerland.
Koroleva, M., P. Alt-Epping and M. Mazurek. 2011. Large-scale tracer profiles in a deep
claystone formation (Opalinus Clay at Mont Russelin, Switzerland): Implications for solute transport processes and transport properties of the rock. Chem. Geol. 280, 284–296.
Kullin, M. and H. Schmassmann. 1991. Isotopic composition of modern recharge. In: Pearson,
F.J., Balderer, W., Loosli, H.H., Lehmann, B.E., Matter, A., Peters, T., Schmassmann, H. & Gautschi, A.: Applied isotope hydrogeology. A case study in northern Switzerland. Elsevier, Amsterdam, The Netherlands and Nagra Technical Report NTB 88-01, Nagra, Wettingen, Switzerland, 65–89.
Lee, J.Y., K. Marti, J.P. Severinghaus, K. Kawamura, H.S. Yoo, J.B. Lee and J.S. Kim. 2006. A
redetermination of the isotopic abundances of atmospheric Ar. Geochim. Cosmochim. Acta. 70, 4507–4512.
Mäder, U.K., H.N. Waber and A. Gautschi. 2004. New method for pore water extraction from
claystone and determination of transport properties with results for Opalinus Clay (Switzerland). In: Wanty, R.B., Seal II, R.R. (Eds.), Proc. 11th Symp.Water–Rock

66
Interaction WRI-11, Saratoga Springs, NY, USA. Balkema/Taylor & Francis, Leiden, The Netherlands, pp. 445–449.
Marumo, K., F.J. Longstaffe and O. Matsubaya. 1995. Stable isotope geochemistry of clay minerals from fossil and active hydrothermal systems, southwestern Hokkaido, Japan. Geochim. Cosmochim. Acta. 59, 2545–2559.
Mazurek, M., P. Alt-Epping, A. Bath, T. Gimmi and H.N. Waber. 2009. Natural tracer profiles
across argillaceous formations: The CLAYTRAC project. OECD/NEA report 6253, OECD Nuclear Energy Agency, Paris, France, 358 pp.
Mazurek, M., P. Alt-Epping, A. Bath, T. Gimmi, H.N. Waber, S. Buschaert, P. De Cannière, M.
De Craen, A. Gautschi, S. Savoye, A. Vinsot, I. Wemaere and L. Wouters. 2011. Natural tracer profiles across argillaceous formations. Appl. Geochem. 26, 1035–1064.
Mazurek, M., H.N. Waber, U.K. Mäder, T. Gimmi, A. De Haller and M. Koroleva. 2012.
Geochemical synthesis for the Effingen Member in boreholes at Oftringen, Gösgen and Kuttigen. Nagra Tech. Rep. NTB 12-07, Nagra,Wettingen, Switzerland
Mazurek, M., T. Oyama, P. Wersin and P. Alt-Epping. 2015. Pore-water squeezing from
indurated shales. Chem. Geol. 400, 106–121. McKay, J.L. and F.J. Longstaffe. 2013. Tracking fluid movement during cyclic steam
stimulation of Clearwater Formation oil sands using stable isotope variations of clay minerals. Clays Clay Min. 61, 440–460.
Muller, H. and O. Leupin. 2012. WS-H (Investigation of wet spots): Observation, first
experimental results, and a short presentation of possible hypotheses regarding the origin of these waters. Mont Terri Technical Note TN 2012-96, Mont Terri Consortium, St. Ursanne, Switzerland.
Murseli, S., G. St-Jean, D. Hanna and I. Clark. 2017. Method Development: Micro Vacuum-
distillation Experiments (µVDE). Technical Report for the Nuclear Waste Management Organization NWMO-TR-2017-12. Toronto, Canada.
NWMO. 2017. Technical Memorandum. DB-A Experiment at Mont Terri: Methods
Descriptions and Data, Borehole Progress and Activities – Supporting TM (NWMO-TR-2017-09/10). Compiled by L. Kennell-Morrison.
Parkhurst, D.L. and C.A.J. Appelo. 2013. Description of input and examples for PHREEQC
version 3 — a computer program for speciation, batch-reaction, one-dimensional transport, and inverse geochemical calculations. U. S. Geological Survey Techniques and Methods, Book 6, Chap. A43 (497 pp.).
Patriarche, D., J.L. Michelot, E. Ledoux and S. Savoye. 2004. Diffusion as the main process for
mass transport in very low water content argillites: 1. Chloride as a natural tracer for mass transport—Diffusion coefficient and concentration measurements in interstitial water. Wat. Resources Res. 40, doi:10.1029/2003WR002600
Pearson, F.J. 1999. What is the porosity of a mudrock? Geol. Soc. London Spec. Publ. 158,
9–21.

67
Pearson, F.J., D. Arcos, A. Bath, J.Y. Boisson, A.M. Fernandez, H.E. Gäbler, E. Gaucher, A.
Gautschi, L. Griffault, P. Hernan and H.N. Waber. 2003. Mont Terri project – Geochemistry of water in the Opalinus Clay formation at the Mont Terri Rock Laboratory. Federal Office for Water and Geology Report 5, Bern, Switzerland. (Available at www.swisstopo.admin.ch).
Rubel, A.P., C. Sonntag, J. Lippmann, F.J. Pearson and A. Gautschi. 2002. Solute transport in
formations of very low permeability: profiles of stable isotope and dissolved noble gas contents of pore water in the Opalinus Clay, Mont Terri, Switzerland. Geochim. Cosmochim. Acta. 66, 1311–1321.
Rufer, D. and H.N. Waber. 2015. Noble and reactive gas data of porewaters and rocks from
the Schlattingen borehole SLA-1. Nagra Arbeitsbericht NAB 15-12, Nagra, Wettingen, Switzerland.
Sültenfuss, J., W. Roether and M. Rhein. 2009. The Bremen mass spectrometric facility for the
measurement of helium isotopes, neon, and tritium in water. Isotopes Environ. Health Stud. 45, 83–95.
Vinsot, A., C.A.J. Appelo, C. Cailteau, S. Wechner, J. Pironon, P. De Donato, P. De Cannière,
S. Mettler, P. Wersin and H.E. Gäbler. 2008. CO2 data on gas and pore water sampled in situ in the Opalinus Clay at the Mont Terri rock laboratory. Physics and Chemistry of the Earth. 33, S54–S60.
Vogt, T. 2013. WS-I Experiment – Outflow measurements and hydrochemical analyses. Mont
Terri Technical Note TN 2013-01, Mont Terri Consortium, St. Ursanne, Switzerland. Waber, H. N., E.C. Gaucher, A.M. Fernández and A. Bath. 2003. Aqueous leachates and cation
exchange properties of Mont Terri claystones. In: Pearson, F. J. et al. (eds.), Mont Terri Project – Geochemistry of Water in the Opalinus Clay Formation at the Mont Terri Rock Laboratory. Federal Office for Water and Geology Report 5, Bern, Switzerland, 200–237 (Available at www.swisstopo.admin.ch).
Waber, H.N. and J.A.T. Smellie. 2008. Characterisation of pore water in crystalline rocks.
Appl. Geochem. 23, 1834–1861. Waber H.N. 2012. Laboratoire de Recherche Souterrain Meuse / Haute-Marne - Geochemical
data of borehole EST433. Nagra Arbeitsbericht NAB 09-16, Nagra, Wettingen, Switzerland. Waber, H. N. and D. Rufer. 2017. Porewater Geochemistry, Method Comparison and Opalinus
Clay-Passwang Formation Interface Study at the Mont Terri URL. Technical Report for the Nuclear Waste Management Organization, NWMO-TR-2017-10. Toronto Canada. (also published as Mont Terri Technical Report TR 2017-02).
Wersin, P., M. Mazurek, H.N. Waber, U.K. Mäder, T. Gimmi, D. Rufer and A. De Haller. 2013.
Rock and porewater characterisation on drillcores from the Schlattingen borehole. Nagra Arbeitsbericht NAB 12–54, Nagra, Wettingen, Switzerland.
Willenberg, H. 2015. Bohrung BDB-1 (Mont Terri). Abschätzung des Tonmineralgehaltes aus
geophysikalischen Bohrlochlogs. Unpubl. report to Nagra.

68

69
APPENDIX A: DOCUMENTATION OF THE DATABASE Red values are uncertain (as declared by the data producers) Grey background refers to numbers calculated by the first author of this report, i.e., these numbers are not listed in the original documents received from the data producers

70
A.1 APPARENT PORE-WATER COMPOSITIONS BASED ON DIRECT METHODS
Table A1-1: Major-ion Compositions of Pore Water Based on the Filter-Absorption Method of Uni Ottawa Al

71
Table A1-2: Major-ion Compositions of Waters Squeezed by Uni Bern Mazurek – Data for All Pressures

72
Table A1-3: Alkalinity, TIC/TOC and pH of Waters Squeezed by Uni Bern Mazurek – Data for All Pressures

73
Table A1-4: Charge Balance and Saturation Indices for Waters Squeezed by Uni Bern Mazurek – Data for All Pressures. Saturation Indices were Calculated
with the PHREEQC (version 3) Code (Parkhurst & Appelo 2013) and the Nagra/PSI Database (Hummel et al. 2002)

74
Table A1-5: Major-ion Compositions of Pore Water Based on Squeezing by Uni Bern Mazurek – Data for Lowest Pressure Only
Table A1-6: Alkalinity, TIC/TOC, pH, Charge Balance and Saturation Indices for Waters Squeezed by Uni Bern Mazurek – Data for Lowest Pressure Only. Saturation Indices were Calculated with the PHREEQC (version 3) Code (Parkhurst & Appelo 2013) and the
Nagra/PSI Database (Hummel et al. 2002)

75
A.2 COMPOSITION OF AQUEOUS EXTRACT SOLUTIONS
Table A2-1: Halide Concentrations in Aqueous Extract Solutions of Uni Ottawa Clark

76
Table A2-2: Anion Compositions of Aqueous Extract Solutions of IRSN Matray

77
Table A2-3: Major-ion Compositions of Aqueous Extracts of Uni Bern Waber

78
Table A2-4: Alkalinity, TIC/TOC, pH, Charge Balance and Saturation Indices for Aqueous Extracts of Uni Bern Waber. Saturation Indices were Calculated with the PHREEQC (version 3) Code (Parkhurst & Appelo 2013) and the Nagra/PSI Database (Hummel et al.
2002)

79
A.3 COMPOSITION OF AQUEOUS EXTRACTS RE-CALCULATED TO A SOLID/LIQUID RATIO OF 0.5
Table A3-1: Halide Concentrations in Aqueous Extracts of Uni Ottawa Clark Re-calculated to a Solid/liquid Ratio of 0.5

80
Table A3-2: Anion Concentrations in Aqueous Extracts of IRSN Matray Re-calculated to a Solid/liquid Ratio of 0.5

81
Table A3-3: Major-ion Compositions of Aqueous Extracts of Uni Bern Waber Re-calculated to a Solid/liquid Ratio of 0.5

82
A.4 COMPOSITION OF AQUEOUS EXTRACTS RE-CALCULATD TO CONCENTRATIONS IN BULK PORE WATER
Table A4-1: Halide Concentrations in Aqueous Extracts of Uni Ottawa Clark Re-calculated to Concentrations in Bulk Pore Water Using Measured Water
Content

83
Table A4-2: Anion Concentrations in Aqueous Extracts of IRSN Matray Re-calculated to Concentrations in Bulk Pore Water. Water Content for the Re-calculation was Obtained from Porosity Based on Density Measurements

84
Table A4-3: Halide Concentrations in Aqueous Extracts of Uni Bern Waber Re-calculated to Concentrations in Bulk Pore Water Using Measured Water
Content

85
A.5 COMPOSITION OF AQUEOUS EXTRACTS RE-CALCULATED TO PORE-WATER COMPOSITIONS CONSIDERING AN ANION-ACCESSIBLE POROSITY FRACTION OF 0.55 (except in limestones of the Hauptrogenstein Fm: 1)
Table A5-1: Halide Concentrations in Aqueous Extracts of Uni Ottawa Clark Re-calculated to Pore-water Compositions Considering an Anion-accessible
Porosity Fraction of 0.55 (except limestones of the Hauptrogenstein Fm: 1). Measured Water Content was Used for the Re-calculation

86
Table A5-2: Anion Concentrations in Aqueous Extracts of IRSN Matray Re-calculated to Pore-water Compositions Considering an Anion-accessible
Porosity Fraction of 0.55 (except limestones of the Hauptrogenstein Fm: 1). Water Content for the Re-calculation was Obtained from Porosity Based on
Density Measurements

87
Table A5-3: Anion Concentrations in Aqueous Extracts of Uni Bern Waber Re-calculated to Pore-water Compositions Considering an Anion-accessible
Porosity Fraction of 0.55 (except limestones of the Hauptrogenstein Fm: 1). Measured Water Content was Used for the Re-calculation

88
A.6 CHLORIDE AND BROMIDE DATA OBTAINED FROM OUT-DIFFUSION TESTS
Table A6-1: Anion Concentrations Based on Out-diffusion Tests of IRSN Matray Re-calculated to Pore-water Compositions Considering an Anion-accessible Porosity Fraction of 0.55 (except limestones of the Hauptrogenstein Fm: 1). Water Content for the Re-calculation was Obtained from Porosity Based on
Density Measurements

89
A.7 STABLE-ISOTOPE COMPOSITION OF PORE WATER
Table A7-1: Stable-isotope Composition Based on Vacuum Distillation by Uni Ottawa Clark

90
Table A7-2: Stable-isotope Composition Based on Squeezing by Uni Bern Mazurek – Data for All Pressures

91
Table A7-3: Stable-isotope Composition Based on Squeezing by Uni Bern Mazurek – Data for Lowest Pressure Only
Table A7-4: Stable-isotope Composition Based on Diffusive Exchange by Uni Bern Waber

92
A.8 DISSOLVED NOBLE GASES
Table A8-1: He Concentrations and 3He/4He Ratios from Uni Ottawa Clark
Table A8-2: He, Ar Concentrations and 3He/4He, 40Ar/36Ar Ratios from Uni Bern Waber

93
A.9 MINERALOGICAL COMPOSITION
Table A9-1: Mineralogical Composition Based on Analyses by IRSN Matray

94
Table A9-2: Mineralogical Composition Based on Analyses by Uni Bern Waber

95
A.10 DENSITIES AND POROSITY FROM DENSITIES
Table A10-1: Densities and Porosity from Densities Based on Analyses by IRSN Matray

96
Table A10-2: Densities and Porosity from Densities Based on Analyses by Uni Bern Waber

97
A.11 WATER CONTENT AND WATER-CONTENT POROSITY
Table A11-1: Water Content and Water-content Porosity Based on Analyses by Uni Ottawa Clark

98
Table A11-2: Water Content and Water-content Porosity Based on Analyses by IRSN Matray

99
Table A11-3: Water Content and Water-content Porosity Based on Analyses by Uni Bern Waber

100
A.12 MINERAL SURFACE AREAS
Table A12-1: Mineral Surfaces Based on Analyses by IRSN Matray

101
Table A12-2: Mineral Surfaces Based on Analyses by Uni Bern Waber
A.13 DIRECT COMPARISON OF ANALYSES OF IDENTICAL SOLUTIONS (standards, aqueous extracts)
Significance of colour codes:
Aqueous extracts – original data Standard solutions and exchanged aqueous extracts – data from
comparison exercise
Data from Uni Ottawa Clark Data from Uni Ottawa Clark
Data from IRSN Matray Data from IRSN Matray
Data from Uni Bern Waber Data from Uni Bern Waber

102
Table A13-1: Results of the Direct Comparison of Analyses of Identical Solutions (standards, aqueous extracts): Na+, K+, Ca2+

103
Table A13-2: Results of the Direct Comparison of Analyses of Identical Solutions (standards, aqueous extracts): Mg2+, Sr2+

104
Table A13-3: Results of the Direct Comparison of Analyses of Identical Solutions (standards, aqueous extracts): F-, Cl-, Br-

105
Table A13-4: Results of the Direct Comparison of Analyses of Identical Solutions (standards, aqueous extracts): NO3-, SO4
2-

106

107
APPENDIX B: METHODS SUMMARIES
The BDB-1 deep-inclined borehole was drilled between December 5th, 2013 and January 30th, 2014 to a final depth of 247.5 m. Core samples were collected along the entire borehole length for geochemical and petrophysical analyses. For preservation purposes, core samples for analysis were taken immediately after core recovery, sealed in plastic foil bags flushed with N2 and then sealed in aluminum coated bags where any air was extracted via vacuum prior to sealing. The key methods employed by the participating research groups in the DB-A pore-water characterisation programme are briefly summarised below, using the references given in Table 1-1 of the main report as the main source of information. Citations have been provided, wherever possible, which reference publications that contain more detailed and/or comprehensive method descriptions.
B.1 IRSN MATRAY – AQUEOUS EXTRACTION
Preserved core samples, taken every 10 m along the borehole and each ~25 cm long, were prepared and analysed at the LAME laboratory, located at the IRSN facility in Fontenay-aux-Roses, for a number of parameters. Aqueous extraction consists of diluting pore-water solutes contained in powdered rock samples in a leaching solution and subsequent analysis for major anions by ion chromatography (IC). In order to minimise contact with O2 from the atmosphere, and therefore pyrite oxidation, sample manipulations were performed, to the extent possible, in a glovebox under N2 atmosphere (O2 <50 ppmv). The majority of samples were sawed in a glovebox using a hand saw, though a select number were sawed in air using a circular saw due to rock hardness. The central sections of the core samples were coarsely crushed with a hammer and milled using a laboratory knife mill (IKA M20). For preliminary test purposes, several samples were sieved at different grain sizes (< 100 µm, 100–200 µm and 200–500 µm). The obtained rock powders were packaged in plastic bags and placed in hermetic glass jars. To address potential artefacts associated with mineral dissolution, which can bias pore-water concentrations, two leaching solutions were evaluated: 1) milli-Q water made anoxic by bubbling with N2 for 1 h, and 2) carbonate saturated water prepared by adding 1 g of fine-grained calcite (Merck) in 2000 mL of the same milli-Q water as for 1). In these tests, the use of carbonate-saturated milli-Q water did not appear to significantly change the obtained concentrations in the leachates, indicating that dissolution of carbonate mineral phases has limited impact on the pore-water elements measured (F-, Cl-, Br-, NO3
-, SO42-). Other extraction parameters that were also tested included the
solid:liquid mass ratio used (0.1, 0.33, 0.5, 1) and contact time (2 h, 24 h and 48 h). Following preliminary testing and evaluation, it was decided to analyse the entire suite of 24 samples using rock powders sieved to <100 µm and extracted in milli-Q water for 2 h at a solid:liquid mass ratio of 0.5. Aqueous extractions were performed by adding 5 g of rock powder and 10 g of leaching solution into a 35 mL centrifuge tube. The tubes were placed in a hermetic glass jar and stirred (outside the glovebox) using an end-over-end agitator. Following this, samples were centrifuged at 10000 rpm for 15 minutes and then filtered in a glovebox using a 0.22 µm syringe filter. Anion concentrations (F-, Cl-, Br-, NO3
-, SO42-)

108
were analysed by high performance liquid chromatography using a Metrohm Advanced Compact IC 861. The difference in affinity of the solution components for the stationary phase and mobile phase (eluent) enables their separation along the column. Analytical uncertainties for the equipment are estimated to be ±10% and the detection limit is 0.1 ppm. The sample preparation and analysis protocol is summarised in Figure B-1. The aqueous-extraction procedure is a relatively simple method and is applicable for most rock materials. The most significant challenge relates to avoiding or minimising contact with air in order to minimise the potential for oxidation and desaturation effects. Additional challenges arise when attempting to relate extract concentrations to in-situ pore-water concentrations – as uncertainties regarding the amount of pore water accessible to anions, as well as differences between gravimetric water contents measured in laboratory and actual water contents in situ (e.g. due to desaturation during drilling and sample manipulation) can make extrapolation of pore-water concentrations difficult. In order to correct the effect of desaturation, water-content values were re-calculated from laboratory-measured values in order to correspond to porosities obtained from density measurements, assuming full saturation for all samples.
Figure B-1: Aqueous Extraction Protocols. Dotted Steps were Performed in a Glovebox (N2 atmosphere). Underlined Options were Selected for Testing the Entire Sample Suite
B.2 UNI OTTAWA AL – FILTER-ABSORPTION METHOD
The filter-absorption method uses capillary action to extract pore water into a sheet of low chemical background cellulosic paper that is sandwiched between two pieces of rock core and left to absorb pore water for an extended period of time (i.e., from weeks to months; see Figure B-2). The technique requires very small volumes of pore water (< 50 µL) to provide enough solute mass for quantification (Na+, K+, Ca2+, Mg2+, Sr2+, Cl- and Br-), and there is no need for crush-and-leach or reliance on measurements of sample porosity. It has been observed that: 1) cellulosic sheets are capable of extracting pore water and solutes from low-permeability rock formations; 2) solutes can be quantitatively extracted from the paper and quantified by ICP-MS;

109
3) the mass of pore water extracted can be quantified by near-infrared spectrometry (NIR); and, 4) concentrations of solutes in the pore water can be quantified with acceptable precision by combining data for solute mass (ICP-MS) and water mass (NIR). BDB-1 cores received at the University of New Brunswick in 2014 were stored at 4 °C in laboratory refrigerators until they were prepared for pore-water extraction. During preparation, the cores were unwrapped individually, photographed, and wrapped in three layers of plastic wrap. The wrapped cores were placed on an impact-damping cleaving surface and sectioned into pucks using a hammer and chisel. Core cleaving was conducted at 10-15 % relative humidity and at ambient temperature between 10 and 18 °C. Upon cleaving of a puck pair, the two segments were removed from the cleaving surface, pressed together and wrapped in plastic wrap, in order to minimise potential pore-water evaporation from the core surfaces. When a whole core sample was cleaved, each puck pair was unwrapped individually and the pore-water extraction surfaces were cleaned with tack cloth to remove any loose rock particles. An air-dried 4.5 cm diameter Whatman 1 CHR© paper (hereafter referred to as ‘paper(s)’) was placed between the core segments. The cores were then pressed tight, wrapped in plastic wrap, and bound with electrical tape to compress the core segments onto the paper. The cores were then placed in individual zip-lock storage bags and refrigerated at 4 °C for 55 days. Prior to insertion between the core segments, the papers were weighed and the initial moisture content of the air-dried papers was determined using NIR spectrometry (measurements recorded in triplicate).
Figure B-2: Schematic of the Absorption Method – Absorbent Material is Sandwiched Between Rock Core Segments, Allowing for Pore Water and Solute Extraction by Capillary Action and Diffusion
After 55 days, each core was unwrapped individually. The paper was quickly transferred from the core into a FEP (fluorinated ethylene propylene) envelope, and then placed in the transmission NIR paper sample holder for analysis using an Ocean Optics fibre optic NIR spectrometer (NIR Quest) – for which the measurements were recorded in triplicate. This step was conducted as quickly as possible to minimise evaporation of extracted pore water from the paper. The FEP sheets/films are used because they do not absorb light in the NIR region, are chemically neutral, and have very low water-vapour permeability. The paper, along with the paper sample holder, was measured gravimetrically, and then transferred to a reflection NIR sample holder for reflection NIR measurement. Reflection NIR is best-suited for use on papers with water contents > 35 %, whereas transmission NIR is best-suited for use on papers with water contents < 35 %. The paper was then photographed to provide an approximation of the amount of rock particulate
Rock Core
Absorbent Material

110
transferred to the paper from the rock core. Finally, each paper was placed in a square bottom jar, and a 15 mL aliquot of ultrapure water was used to rinse the FEP in contact with the paper. This solution was then used to for leaching solutes from the papers over a period of 24 hours. For the determination of solute mass extracted, leachates were centrifuged and then prepared for ICP-MS analysis in a 1 % HNO3 matrix (trace metal grade, SCP Science). Internal standards (1 µg In/L and 1 µg Y/L, SCP Science) were used to monitor and correct for instrumental drift. Calibration curves were generated from calibration standards, prepared from certified standards (SCP Science) and tailored to match the sample matrix. Certified ground-water reference solutions (SCP Science) were used to monitor accuracy. Solutions were analysed using an Agilent 7700x quadrupole ICP-MS with a helium collision cell. Samples were introduced using an auto-sampler with a nebuliser pump flow rate of 0.1 mL/min and gas flow rate of 2 mL/min. The internal standard was introduced using a sample splitter intake. The helium collision cell was used for Cl and Br quantification. The NIR response depends on both the water content and the total solute mass on the paper. Calibration surfaces were defined, as part of method development, for a range of water contents and solute masses, and these calibration surfaces are used to determine the total water mass in each paper. Details of the development of this method can be found in Celejewski & Al (2014). Estimates of pore water concentrations (e.g., Ca, Na, Cl, Br) were determined by normalizing the individual solute masses in the leach solutions to the total water mass determined via NIR.
B.3 UNI OTTAWA CLARK – MICRO VACUUM-DISTILLATION, AQUEOUS EXTRACTION AND CORE ENCAPSULATION - HELIUM
B.3.1 Micro Vacuum-distillation Extraction
Micro vacuum-distillation extraction (µVDE; Murseli et al. 2017) is a closed-system crushing and extraction procedure, which minimises the potential for evaporative losses during analysis. Advantages of the method include: 1) relatively short extraction times; 2) efficient temperature control; and 3) small sample size. BDB-1 cores received by the University of Ottawa in 2014 were stored in laboratory refrigerators at 4 oC until they were prepared for analysis. Cores were prepared for sampling by removing a puck-sized disk (~3-5 cm thick) from the central region of the core so that only freshly exposed samples were used for analysis. The core was visually inspected and efforts were made to sample within homogenous zones, avoiding sample heterogeneities (i.e., veins, fossils). Approximately 2 cm of the outer exposed edge of the disk was chipped away with a chisel to minimise the potential for drilling-fluid or air contamination, and the remaining portion was broken into several smaller pieces. These sub-samples were immediately weighed, placed into individual stainless-steel sample holders with a ½” stainless-steel ball for closed system crushing, and sealed with a high-temperature silicone septum to allow the transfer of water vapour under vacuum. Four sample replicates were prepared per core to observe heterogeneity and/or analytical variability. Once loaded and sealed, the sample holders containing the rock samples were placed on a Retch MM 200 ball mill and shaken until crushed to a fine powder (<100 µm, ~15 minutes). Following milling, the sample holders were mounted onto individual temperature-controlled block heaters and connected to separate vacuum extraction ports via a 1/16” custom double side-hole stainless steel needle fitted with

111
a 20 µm VCR filter and bellows-toggle valve to prevent rock dust from being drawn up into the vacuum transfer line during evacuation. Each line was paired with a pre-weighed septum-sealed 1.2 mL high-recovery micro-vial (HRµV) on the water vapour recovery side of the transfer line, completing the closed-system extraction. Due to sufficient water content in the samples, all BDB-1 pore waters were extracted using a single transfer line (dual extraction lines can be used for ultra-low water content samples, WCvol < 2 %). Pore-water extraction via the µVDE method involves two stages: (I) primary transfer of water vapour during heating to a built-in U-trap via dynamic vacuum; and (II) secondary transfer directly to the HRµV via static vacuum. Both primary and secondary transfer procedures are shown in Figure B-3. During primary transfer, the transfer lines were individually evacuated to 50 mT, and the crushed samples were heated at a ramping speed of 10˚C/min and held at 150˚C for a period of 60 minutes. During this time, water vapour was trapped cryogenically on the built-in U-trap via dynamic vacuum, allowing the vacuum on the transfer line to be maintained. Following the 60 minute heating period, the crushed samples were entirely desiccated, and the transfer lines were isolated from the vacuum pump and sample holder. The extracted water vapour was then transferred from the U-trap to the HRµV (cryogenic trap) with a heat gun via static vacuum (secondary transfer). Once the secondary transfer was complete, the vacuum was gently released on the transfer line while the sample was still frozen (brought closer to 0˚C to avoid the innate vacuum effect of liquid nitrogen temperatures on atmospheric moisture), and the HRµV containing the recovered water was removed from the transfer line and capped with a silicone/PTFE septum fitted cap. The pre-weighed HRµV’s containing the extracted pore waters were weighed again to determine water recovery, and volumetric water content was calculated based on the mass of pore water recovered. δ18O and δD of the recovered pore waters were analysed by CO2/H2 equilibration via gas-source continuous flow stable isotope ratio mass spectrometry (CF-IRMS) on a Thermo Delta Plus XP interfaced with a Gasbench II. Samples were analysed in 2 separate batches (100 µL and 200 µL) depending on volumes recovered. Recovered pore waters were prepared for analysis by transferring the aliquots to a clean 12 mL exetainer, along with 2-3 charcoal grains (1-2 mm) to each sample exetainer to remove any condensed hydrocarbons and a small amount of Cu pellets to remove any S-containing compounds that may have condensed from the heated rock, in order to prevent S-sorption and subsequent catalyst poisoning. The exetainers containing the sample were then flushed and filled with a mixture of 2 % CO2 in He gas, and allowed to equilibrate for 24 hours to allow exchange of 18O between CO2 and H2O. Following CO2 analysis on the mass spectrometer, a platinum bead catalyst was added to the same exetainers with the sample aliquots. The exetainers were re-flushed with a mixture of 2 % H2 in He and left to equilibrate with the water prior to mass spectrometer analysis. Three laboratory water standards were run sequentially with samples for both δ18O and δD to calibrate the measured ratios to the international reference water VSMOW (Vienna Standard Mean Ocean Water). Results are given in per mil differences between the isotope ratio, R(18O/16O or D/1H), of the sample versus the isotopic ratio of the reference standard. Periodic quality control duplicates (QCD) were run on select samples, volume permitting. The analytical reproducibility of δ18O and δD by CF-IRMS is reported as ±0.2‰ and ±2.0‰, respectively. The average of the four replicates is reported for each core samples, and values are expressed as ‰ relative to VSMOW. The Opalinus Clay at Mont Terri differs from the Ordovician shales and limestones in southern Ontario, Canada, for which this method was specifically developed. The µVDE method was developed at the University of Ottawa to overcome challenges

112
associated with pore-water characterisation in relatively low-porosity sedimentary formations containing highly saline pore waters, such as those in the Michigan Basin, Canada. Potential artefacts of this method applied to the Opalinus Clay may include extraction of interlayer waters from smectite clays. Confidence in the stable isotope measurements is provided by undertaking four replicates of each sample. This provides good statistical analysis of precision and allows outliers to be identified and evaluated. Uncertainty in stable isotope analyses undertaken by vacuum-distillation has been shown to arise from incomplete extraction and the stable isotope data are susceptible to contributions from clay hydration waters. The degree to which this impacts the results depends largely on the smectite content.
Figure B-3: Schematic Diagram of the (A) Four-port µVDE Pore-water Extraction Line Illustrating (B) Closed System Extraction of Water Vapour
B.3.2 Aqueous Extraction
Following µVDE analysis for the determination of stable water isotopes, sub-samples of rock cores were crushed and leached for the determination of major ion concentrations. Pore-water geochemistry was reconstructed by measurement of major ions by way of extracting pore-water solutes from granulated core material from a contiguous section of the same core sample used for isotope analysis. Approximately 10 g of crushed and sieved granulated core (2-4 mm grain size) was weighed into a 50 mL falcon tube, and leached with approximately 40 mL of ultrapure deionised water purified by reverse-osmosis. The mass of granulated core and leach water were recorded, and the solution containing the granulated core was leached at room temperature under oxic conditions (an anaerobic chamber was not available for these experiments) for a period of 7 days, after which time the leachate was filtered into two 15 mL centrifuge tubes using a 0.45 µm syringe filter for subsequent ion analysis. Major anions (Cl–, SO4
2- and NO3-) were analysed by routine liquid
chromatography on a Dionex® DX-100 coupled to a Dionex® AS40 auto sampler,

113
major cations (B+, Ca2+, K+, Mg2+, Na+ and Sr2+) by atomic emission spectroscopy in an inductively coupled argon plasma (ICP-AES), and trace elements (Br and I) by ICP-MS. All of the DB-A samples were run with a set of internal standards, and analytical reproducibility is better than 5 % relative to standard deviation (RSD). Quadruplicate sampling on each core was completed to observe sample heterogeneity. Pore-water solute molar concentrations are then determined by normalisation of the mass of solutes leached from the granulated core to the volumetric mass of the original pore waters yielded by vacuum-distillation. Leach water blanks were also tested and subtracted from the measured values if reported higher than the limit of detection on that instrument. Conservative solutes, including Cl– and Br–, are considered to have high precision and good accuracy. However, cation concentrations, and in particular the divalent cations, will be affected by cation exchange and so cannot be reliably considered as representative of pore-water concentrations. Further, mineral dissolution (in particular due to oxidation of sulphide minerals) during extraction introduces further artefacts that affect mainly SO4
2- and all cation data.
B.3.3 Core Encapsulation - Helium
A newly-developed encapsulation method was tested for the determination of helium concentrations and 3He/4He ratios in cores from the BDB-1 borehole. Portions for helium analysis were micro-cored and sampled in the field in gas tight chambers. Micro-core sampling was tested on archived Opalinus Clay core at the University of Ottawa prior to field sampling. Due to the brittle nature of the Opalinus Clay, a dry coring technique was utilised. Sub-cores for helium analysis were collected by gently hammering stainless steel tubes (1.27 cm diameter x 5.08 cm length) with a machined knife edge vertically (orthogonal to bedding) into the center of the 85-mm-diameter cores immediately upon retrieval during drilling, in order to minimise noble gas loss. The intact sub-cores (4–8 g), along with the stainless steel tubes, were immediately sealed in a 45 cm3 stainless steel conflate-sealed gas-tight diffusion chamber fitted with a copper tube cold-welded (crimped) at one end and evacuated to 1.5 torr. Gas accumulated over time (3 to 5 months) in the head space by room temperature diffusion. All samples were measured by a Helix SFT noble gas mass spectrometer. Data is reported as concentration normalised to water volume equivalent (cm3 STP/gwater) and 3He/4He relative to the ratio in air (1.38 x 10⁻⁶).
B.4 UNI BERN MAZUREK - SQUEEZING
The squeezing technique was utilised for this work at both the CRIEPI Laboratory (Japan) and CIEMAT (Spain) in collaboration with the University of Bern. Squeezing, as detailed in Mazurek et al. (2015) and summarised below, involves the placement of rock core in a confining rig. Increasing pressure is applied to the sample, forcing fluid to be displaced from the pore space onto collecting plates. The technique is considered to be analogous to the process of consolidation, but at rates greatly exceeding those of the deposition of sediments in the natural environment (Mazurek et al. 2009). A schematic of the squeezing rig at the CRIEPI Laboratory is shown in Figure B-4. Their sample chamber is cylindrical, with a diameter of 5 cm and a height of 10 cm. The drillcore samples are dry cut to polygonal prisms to the size and shape needed for the squeezing cell, so that at least the outermost 2.5 cm of the core was removed. After being weighed, samples are inserted into the sample chamber with the sample axis oriented normal to bedding. The total preparation process takes only 15–20 minutes. A piston located above the sample chamber is used to exert

114
pressure on the sample in a step-wise fashion (50, 75, 100, 150, 200, 300, 400 and 500 MPa). Standing times of 2–4 days at each pressure step were applied, resulting in total squeezing times of 15–20 days per sample. Fibre-glass filters and collecting plates are then attached to both the upper and lower surfaces of the sample, and pore water is collected in syringes connected to the collecting plates. The total dead volume of the system is less than 0.25 mL. The collection of a sufficient pore-water volume to allow for both chemical and isotopic analysis depends primarily on 1) the water content of the sample, 2) the rock properties (fabric and mineralogy), 3) the squeezing pressure applied, and 4) the squeezing time (Mazurek et al. 2009, 2011, 2015). Pore waters obtained from the DB-A core samples at each pressure step were collected separately, stored cool in 4 mL plastic bottles, and sent to RWI, University of Bern, for chemical and isotopic analysis. Squeezed core samples were heat sealed in plastic foil and also sent to RWI. Two samples were squeezed at the CIEMAT laboratories in Madrid, Spain. As for the CRIEPI campaign, squeezed rock samples and waters were sent to RWI for analysis. The methodology is documented in Fernandez et al. (2009, 2014). Squeezed core samples were dried at 105 °C until weight constancy to quantify the remaining water content. Water-loss porosity was calculated from the gravimetric water content. In the absence of grain-density measurements, a value of 2.712 g/cm3 was assumed for the calculation of water-loss porosity from the gravimetric water content. Subsequently, the squeezed cores were subjected to aqueous extraction (details see Appendix B5). As only Cl- and Br- concentrations are of interest, no measures were taken to prevent oxidation of sulphide minerals. Squeezed waters were analysed for major ions by ion chromatography using a Metrohm Prof IC AnCat MCS IC system, with an analytical error of ±5 %. δ18O and δ2H were measured using a Picarro L2120-I cavity-ring-down laser spectrometer (CRDS). The device is connected to an auto-sampler for liquid samples, and a vaporiser to convert liquid samples to water vapour at 140 °C. Samples were taken from vials sealed with a Teflon membrane using a syringe mounted on an auto-sampler. For each sample, five repeat measurements were completed and averaged, each with a volume of 5 µL. The measurements were calibrated with laboratory standards of liquid water of +1.0 ‰V-SMOW (distilled Mediterranean water) and −14.9 ‰V-SMOW (glacier water). In order to minimise memory effects on the CRDS, samples and standards of a batch were arranged according to IAEA recommendations. Laboratory standards are regularly calibrated against original V-SMOW standards provided by the International Atomic Energy Agency, and the total analytical error is ±0.2 ‰ for δ18O and ±1.0 ‰ for δ2H. As documented in Mazurek et al. (2015), hyperfiltration and mineral dissolution affect the composition of squeezed waters, and the effects become more pronounced with increasing squeezing pressure. Therefore, only the first water samples, i.e., those obtained at the lowest pressure, were used for the purpose of this report.

115
Figure B-4: Schematic of the Squeezing Rig at the CRIEPI Laboratory in Japan
B.5 UNI BERN WABER – ISOTOPE DIFFUSIVE EXCHANGE, AQUEOUS EXTRACTION AND NOBLE-GAS ANALYSIS
More detail about the applied extraction techniques is given in Waber & Rufer (2017).
B.5.1 Isotope Diffusive Exchange
The isotope diffusive exchange technique was originally developed at the University of Heidelberg (Rogge 1997, Rübel et al. 2002). It is based on the diffusive exchange of water isotopes over the vapour phase between the pore water of a saturated rock sample and a test waters of known isotopic composition. Each test includes two rock/test-water sets. One test water has a composition similar to that of the pore water, while the other has a composition that differs substantially. If the masses and the isotopic compositions (δ18O and δ2H) of the test waters are known, then the isotopic composition of the pore water can be calculated from the measurement of the modified compositions of the test waters once isotopic equilibrium is reached.
The pore water 18O and 2H values are derived by mass balance calculations (equations documented in Waber & Smellie 2008). Saturated rock pieces from the central part of the drill core, approximately 2 cm in diameter, are placed in two vapour-tight containers together with a small crystallisation dish containing a test water with known mass and isotopic composition (see Figure B-5). The two isotopically different test waters used are laboratory tap water and a standard prepared with melt water from an ice core drilled in Greenland. During the entire experiment, the rock material is never in direct contact with the test water. A minor amount of NaCl is added to the test solutions (0.3 molal) to minimise the potential for condensation of water along the container walls. Approximately 200-250 g of rock and 3-5 mL of test solution are typically used in the experiments, which run over 1 month. The test water, the rock material and the container are weighed before and after the equilibration experiments in order to monitor a possible transfer

116
of water between the reservoirs. After equilibration, the test water is removed from the crystallisation dish and stored in a vapour-tight small PE-flask until isotopic analysis. The rock material is then dried in an oven to constant mass at 105 °C in order to obtain the gravimetric water content. δ18O and δ2H on the small-sized samples was conducted by isotope ratio infrared spectroscopy (IRIS) utilising a Picarro L2120-i cavity ring down spectrometer (CRDS) with vaporization module V1102-i and coupled to a HTC PAL autosampler (CTC Analytics). Post-run correction of oxygen and hydrogen stable isotope measurements followed the method of van Geldern and Barth (2012). All values are expressed in the standard delta notation
(18O, 2H) in per mil (‰) relative to the Vienna Standard Mean Ocean Water
(VSMOW). For the present samples, the analytical error was 0.1‰ for 18O and 1.0‰
for 2H based on multiple measurements of internal and IAEA standards.
Figure B-5: Isotope Diffusive Exchange Set-up Showing Rock Cores Enclosed in Sealed Containers and Equilibrating with Known Solutions Over the Vapour Phase
B.5.2 Aqueous Extraction
Aqueous extraction is a simple, yet destructive, method for the indirect characterisation of pore water. Extract solutions yield information about the concentrations of chemically conservative elements per mass of rock (kgrock), which requires the determination of the sample porosity in order to convert to concentrations per mass of pore water (kgw). For preparation in the laboratory, at least 1.5–2 cm of the outer rim of the drill core sections is removed by hand, in order to minimise artefacts related to evaporation and drilling-fluid contamination. Saturated rock material (30 g) was disintegrated by hand along grain boundaries to pieces of a few mm3 to avoid opening of mineral fluid inclusions. The material was immediately placed in polypropylene tubes filled with an equivalent mass of degassed, oxygen- and CO2-free water that was prepared in the glovebox by boiling and N2-bubbling for 30 minutes. The preparation time from the large chips until immersion of

117
the small pieces into the water and closure of the polypropylene tube was minimised to less than 5 minutes to suppress sulphide mineral oxidation and pore-water evaporation as much as possible. Subsequently, the closed tubes were quickly transferred into a glovebox were they were shaken end-over-end under a continuous N2 gas stream in an oxygen-free atmosphere. All sample handling was conducted using surgical rubber gloves in order to minimise Cl- contamination from the skin. For each preparation campaign a blank extraction was also performed. After extraction, phase separation was conducted by centrifugation of the polypropylene tubes for ~20 minutes. The supernatant leach solutions were quickly removed using a syringe. From the syringe, the clear extract solution was transferred into PPE bottles under filtration with 0.2 μm Millipore filters and immediately analysed for pH and alkalinity with a Metrohm Titrino DMP 785 system. Major anions (F-, Cl-, Br-, NO3
-, SO42-) and
cations (Na+, K+, NH4+, Ca2+, Mg2+, and Sr2+) were analysed simultaneously in the
remaining solutions by ion chromatography using a Metrohm ProfIC AnCat MCS IC
system with automated 5 L and 50 L injection loops. The detection limit of this technique is 0.016 mg/L for anions and 0.1 mg/L for cations with an analytical error of ± 5% based on multiple measurements of high-grade, commercial check standard solutions (Sigma-Aldrich, Merck). Concentrations of K, Mg and Sr that were close to, or below, the detection limit in the ion chromatographic method were re-analysed using a Varian 710 ES ICP-OES system with a detection limit of 0.01 mg/L. The analytical error of the ICP-OES analyses is also ± 5% for these elements based on multiple measurements of high-grade, commercial check standard solutions (Sigma-Aldrich, Merck).
B.5.3 Noble-gas Sampling and Analysis
From full core sections of approximately 7 cm length, axially centred rectangular blocks were trimmed by dry cutting on the drill site immediately after core recovery. Their wet weight was recorded and the blocks were subsequently sealed into stainless steel sample containers, which were repeatedly flushed with Kr to remove all air, and finally evacuated and sealed by crimping the interface copper tube of the sample container. The preservation of the in-situ water-saturated state of the rock material and the minimisation of noble-gas loss and potential contamination by atmospheric gases were primary concerns, necessitating an efficient and rapid sampling procedure. After sealing the evacuated sample container, the dissolved gases are quantitatively released from the pore water by molecular diffusion into the void volume of the container. The time required to reach equilibrium conditions depends on the transport properties of the rock material as well as the sample size and geometry. It has been demonstrated that for sedimentary rocks equilibration times of merely up to two months suffice to attain steady state with regards to He and that under these conditions significantly less than 1 % of the 4He remains dissolved in the pore water. Noble-gas analyses were conducted at the Institute of Geological Sciences, University of Bern, to determine 4He, 20Ne, 22Ne, and 40Ar concentrations and 40Ar/36Ar isotope ratios and at the Institute of Environmental Physics, University of Bremen, Germany, for 3He/4He isotope ratio measurements. Extraction of the sample gas from the sample container was achieved by rapid expansion into a well-defined volume approximately five times larger than the gas volume in the sample container, before the latter was again closed off. This ensured the extraction of a large fraction (>80 %) of sample gas from the sample container. At the same time it minimised pressure change induced alteration of the equilibrated sample gas composition by e.g. renewed diffusion or evaporation of H2O. Separation and purification of the

118
different noble gas species from the extracted sample gas mixture were achieved using a sequential combination of N2(liq.)-cooled cold traps filled with activated charcoal and a Ti-sponge getter operated at 650 °C. This allowed separate measurements of a purified gas fraction containing He and Ne and a fraction containing Ar. On an aliquot of the former, 3He/4He ratios were determined in Bremen according to the procedure given in Sültenfuss et al. (2009). The measurements in Bern were performed on multiple aliquots of the purified gas, using a Pfeiffer QMS200 quadrupole mass spectrometer equipped with an in-line faraday cup detector. Gas ionization was by a tungsten filament using an emission current 1.15 mA and an acceleration voltage of 93 V. In consideration of the reduced amounts of gas available per measurement due to aliquoting, the mass spectrometer was operated in static mode.