Embed Size (px)
Citation preview

0
AFWAL-TR-84-3018
MONOLITHIC F-16 UNIFORM THICKNESS STRETCHEDACRYLIC CANOPY TRANSPARENCY PROGRAM
Rick Hopkins
Swedlow, kw.12122 Western AvenueGarden Grove, CA 92645
3anuary 1984
Final Technical Report for Period September 1982 - September 1983
Approved for public release; distribution unlimited
FLIGHT DYNAMICS LABORATORYAIR FORCE WRIGHT AERONAUTICAL LABORATORIESAIR FORCE SYSTEMS COMMANDWRIGHT-PATTERSON AIR FORCE BASE, OHIO 45433 c•J

NOTICE
When Government drawings, specifications, or other data are used for any purposeother than in connection with a definitely related Government procurementoperation, the United States Government thereby incurs no responsibility nor anyobligation whatsoever; and the fact that the government may have formulated,furnished, or in any way supplied the said drawings, specifications, or other data, isnot to be regarded by implication or otherwise as in any manner licensing theholder or any other person or corporation, or conveying any rights or permission tomanufacture use, or sell any patented invention that may in any way be relatedthereto.
This report has been reviewed by the Office of Public Affairs (ASD/PA) and isreleasable to the National Technical Information Service (NTIS). At NTIS, it willbe available to the general public, including foreign nations.
This technical report has been reviewed and is approved for publication.
2Lt DALE A. CROCKER RALPH 3. SPEEILMANProject Manager Program ManagerImproved W/S Protection ADPO Improved W/S Protection ADPOVehicle Equipment Division Vehicle Equipment Division
FOR THE COMMANDER
Vehicle Equipment Division
"If your address has changed, if you wish to be removed from our mailing list, or ifthe addressee is no longer employed by your organization please notifyAFWAL/FIER, WPAFB, OH 45433 to help us maintain a current mailing list".
Copies of this report should not be returned unless return is required by securityconsiderations, contractural obligations, or notice on a specific document.
I]NCI AS•TTFTFISECURITY CLASSIFICATION OF THIS PAGE (ohen Data.Entered)
REPORT DOCUMENTATION PAGE READ INSTRUCTIONSBEFORE•COMPLETING FORM
I. REPORT NUMBER 2. GOVT ACCESSION NO. 3. RECIPIENT'S CATALOG NUMBER
AFWAL-TR-84-3018 _
4. TITLE (and Subtitle) $. TYPE OF REPORT & PERIOD COVEREDFINAL REPORTMONOLITHIC F-16 UNIFORM THICKNESS STRETCHED Sept 1982 - Sept 1983
ACRYLIC CANOPY TRANSPARENCY PROGRAM S. PERFORMING ORO. REPORT NUMBER
7. AUTHOR(e) S. CONTRACT OR GRANT NUMBER(&)RICK HOPKINS F33615-81-C-3416
Amendment P00003
9. PERFORMING ORGANIZATION NAME AND ADDRESS 10. PROGRAM ELEMENT, PROJECT, TASKAREA & WORK UNIT NUMBERS
SWEDLOW, INC. PE64212F12122 Western Avenue Project 1926, Task 192601Garden Grove, CA 92645 Work Unit 19260111
11. CONTROLLING OFFICE NAME AND ADDRESS 12. REPORT DATE
Flight Dynamics Laboratory (FIEA) JAN 1984Air Force Wright Aeronautical Laboratories i1. NUMBER OF PAGES
Air Force System Command, WPAFB, OH 45433 4714. MONITORING AGENCY NAME & ADDRESS(II different from Controlling Office) 1S. SECURITY CLASS. (of this report)
UNCLASSI FIED15. DECL ASSI FICATION/DOWNGRADING
SCHEDULE
16. DISTRIBUTION STATEMENT (of this Report)
Approved for public release; distribution unlimited
*7. DISTRIBUTION STATEMENT (of the abstract entered in Block 20, if different from Report)
IS. SUPPLEMENTARY NOTES
19. KEY WORDS (Continue on reverse side if necessary and identify by block number)
Transparency Thermoforming Finite Strain AnalysisFinite Element Modeling Mooney FormulationTensile Testing Acrylic Material PropertiesF-16 Transparency ThinningUniform Thickness Transparency MARC
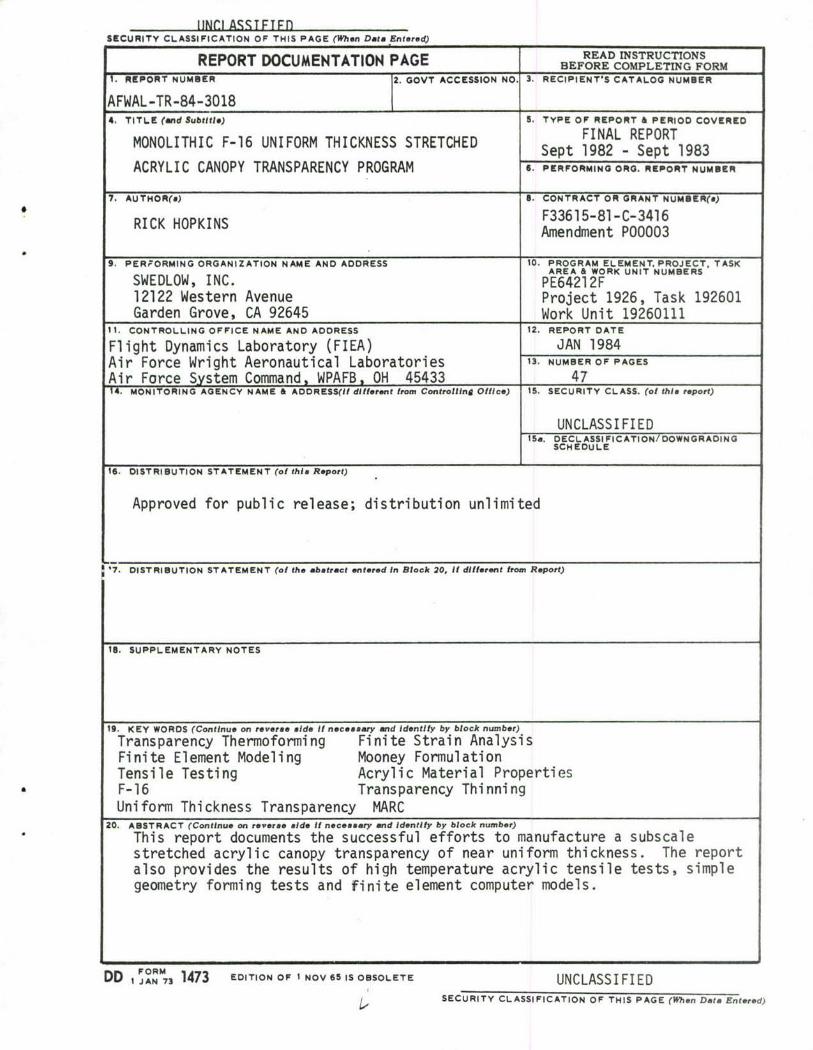
20. ABSTRACT (Continue on reverse side If neceeeary end Identify by block number)This report documents the successful efforts to manufacture a subscalestretched acrylic canopy transparency of near uniform thickness. The reportalso provides the results of high temperature acrylic tensile tests, simplegeometry forming tests and finite element computer models.
FORM
DD I JANl 3 1473 EDITION OF I NOV 65 IS OBSOLETE UNCLASSIFIEDSECURITY CLASSIFICATION OF THIS PAGE (When Data Entered)

FOREWORD
The effort reported herein was conducted by Swedlow, Inc., located inGarden Grove, California, and was partially funded under Air Force ContractF33615-81-C-3416, amendment P00003. The Air Force administrative directionwas provided by Lt. Dale Crocker and Mr. Ralph Speelman, AFWAL/FIEA.
The work described herein was conducted during the period September 1982through September 1983. The principle investigator and project manager atSwedlow was Mr. Rick Hopkins and the person who conducted the formingexperiments was Ms. Brooke Hall. Other persons who significantly contributed tothe program success were Mr. Dave Holdridge, Manager of Design Engineering; Mr.Gene Nixon, Vice President of Engineering; and Dr. William Fischer, CorporateVice President of Technology.
In addition to those listed above, the author wishes to acknowledge thecontributions of Dr. Michael Burke of MARC Analysis Research Corporation inPalo Alto, California. Dr. Burke developed the necessary MARC codemodifications and performed the finite element models.
iii

TABLE OF CONTENTS
SECTION PAGE
I INTRODUCTION ....................................... I
II PROGRAM OVERVIEW ...................................... 4
III FINITE ELEMENT ANALYSIS ................................. 6
MARC ANALYSIS OF ACRYLIC TENSILE SPECIMEN ...... 8MARC ANALYSIS OF ACRYLIC HEMISPHERE ............ 12
IV ACRYLIC MATERIAL PROPERTIES AT THERMOFORMING
TEMPERATURES ........................................... 21
V SUBSCALE F-16 CANOPY FORMING EXPERIMENTATION ....... 31
VI PROGRAM CONCLUSIONS .................................. 38
VII RECOMMENDATIONS ...................................... 39
REFERENCES .............................................. 40
av

LIST OF ILLUSTRATIONS
FIGURE PAGE
I Stretched Acrylic 1/4 Scale F-16 Canopy Transparencyof Virtually Uniform Thickness (Forming Attempt No. 11) ........ 3
2 Program Logic Diagram ..................................... 5
3 MIL-P-8184 Tensile Test Numerical/Experimental Comparison:True Stress vs True Strain Curves ............................. 10
4 MIL-P-8184 Tensile Test Numerical/Experimental Comparison:Load vs Lateral Thickness Reduction .......................... 11
5 MIL-P-8184 Free Blown Hemisphere .......................... 14
6 Description of Measurements for CircularDisk and Hemisphere ........................................ 15
7 MIL-P-8184 Hemisphere Numerical/Experimental Comparison:Normalized Deformed Shape vs Radius ........................ 16
8 MIL-P-8184 Hemisphere Numerical/Experimental Comparison:Thickness Extension Ratio vs Radius .......................... 17
9 MIL-P-8184 Hemisphere Numerical/Experimental Comparison:Radial Extension Ratio vs Radius ............................. 18
10 MIL-P-8184 Hemisphere Numerical/Experimental Comparison:
Hoop Extension Ratio vs Radius .............................. 19
11 MIL-P-8184 Hemisphere Final Stress State ..................... 20
12 Stress-Strain-Time Domain .................................. 21
13 Ultimate Tensile Strain vs Temperature, MIL-P-8184 ............ 23
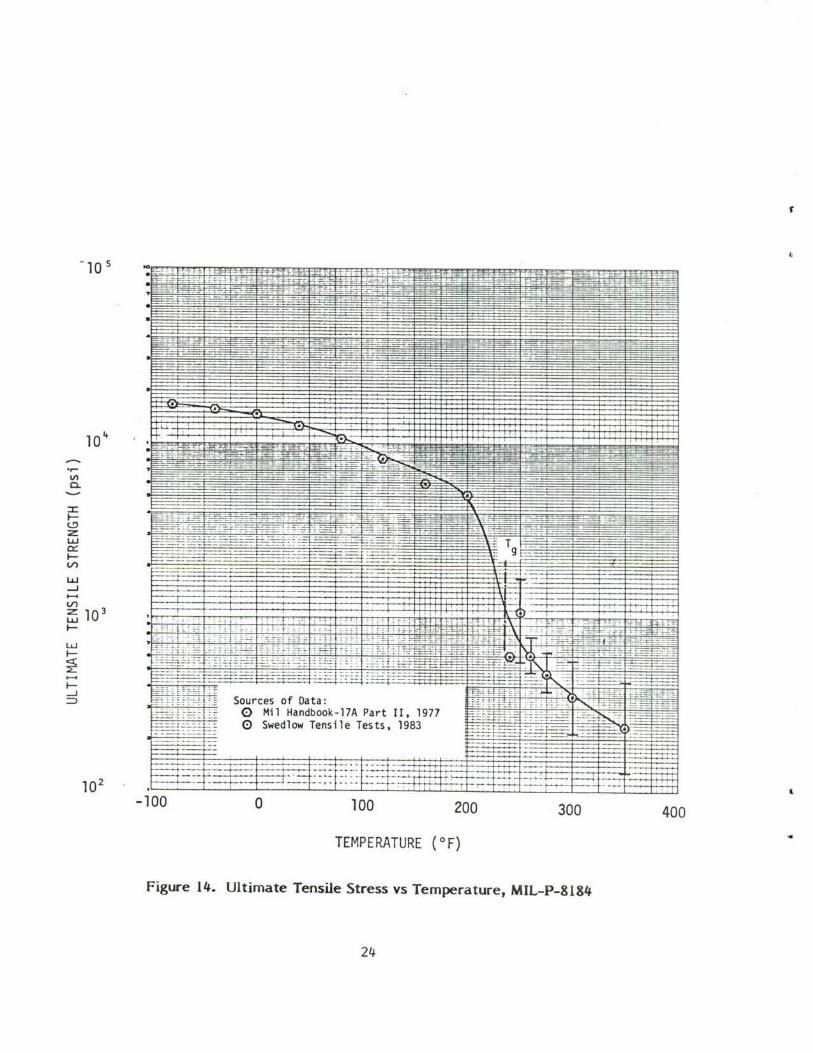
14 Ultimate Tensile Stress vs Temperature, MIL-P-8184 ............ 24
15 Tensile Modulus vs Temperature, MIL-P-8184 .................. 25
16 Approximate Tensile Stress at Yield Point vs TemperatureMIL-P-8184 ................................................ 26
17 Average Engineering Stress vs Engineering Strain, MIL-P-8284 .... 27
18 MIL-P-8184 Engineering Stress vs Engineering Strain, 250"F ..... 28
vi
LIST OF ILLUSTRATIONS (CONT'D)
FIGURE PAGE
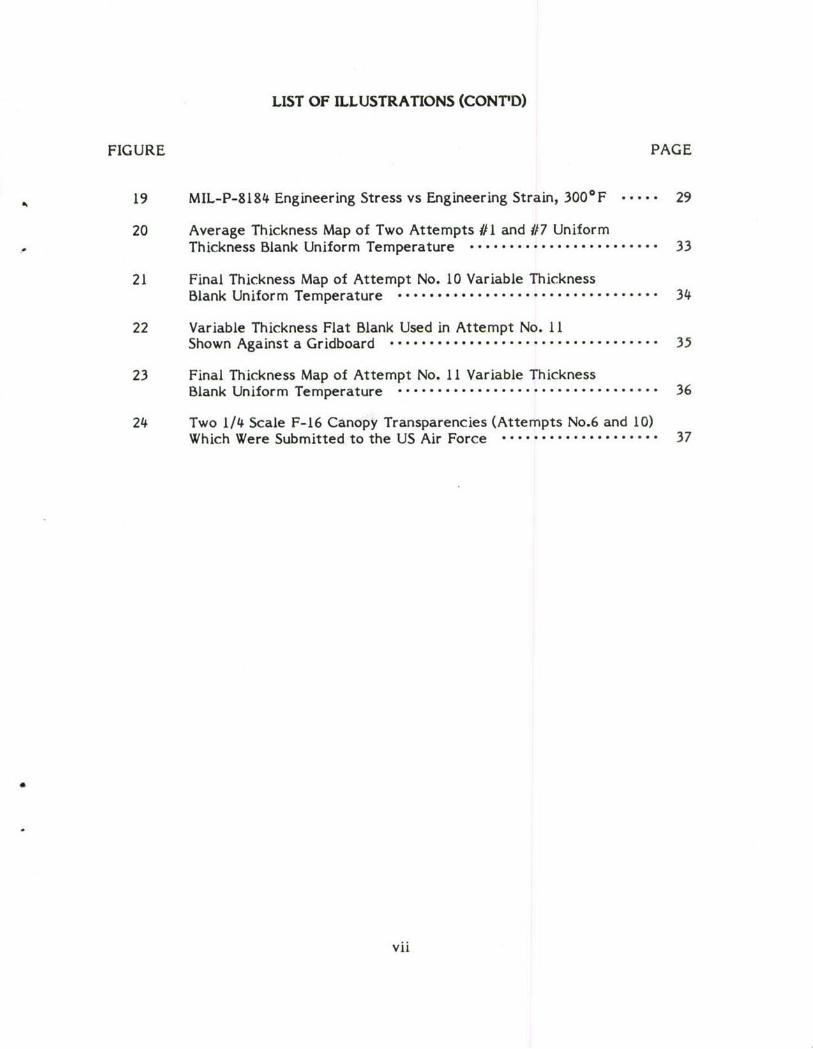
19 MIL-P-8184 Engineering Stress vs Engineering Strain, 3000F ..... 29
20 Average Thickness Map of Two Attempts #1 and #7 UniformThickness Blank Uniform Temperature ........................ 33
21 Final Thickness Map of Attempt No. 10 Variable ThicknessBlank Uniform Temperature ................................ 34
22 Variable Thickness Flat Blank Used in Attempt No. 11Shown Against a Gridboard .................................. 35
23 Final Thickness Map of Attempt No. 11 Variable ThicknessBlank Uniform Temperature ................. 36
24 Two 1/4 Scale F-16 Canopy Transparencies (Attempts No.6 and 10)Which Were Submitted to the US Air Force .................... 37
vii

SECTION I
INTRODUCTION
The objective of this project was to demonstrate the feasibility ofproducing a uniform thickness aircraft canopy through subscale formingexperimentation. This work was considered necessary before full scalefabrication of uniform thickness canopies having a complex curvaturecould be undertaken.
Aircraft canopies are normally of compound curvature shape.Generally they are made from constant thickness sheet stock which,when thermoplasticly formed, produces the required configuration.This shape, combined with the process used in its development, resultsin a nonuniform thinning of material. Thinning is greatest in the regionmost highly strained during forming.
For those canopies which are highly compound curved, like the F-16aircraft canopy, thinning can be considerable. In many cases this non-uniform thickness is undesirable and may result in weight and perform-ance penalties. A uniform thickness canopy or one in which thethickness is locally controlled would be beneficial.
One disadvantage of uncontrolled thinning of canopies is illustrated bythe requirement to defeat bird strikes. The required thickness of acanopy necessary to resist these impacts is a function of the criticalpoint of impact. In the case of the F-16 aircraft this critical impactpoint is in a high strain and therefore thinned region. Because of itsgeometry, the canopy is thicker than necessary in regions away fromthe critical point, and a substantial weight penalty occurs. The uniformthickness canopy would be advantageous, and locally controlledthickness would be preferred in order to minimize the weight of thecanopy.
Although the study of uniform thickness canopies could have beenconducted using almost any shape, that of the F-16 was selected forthis project. In addition, the study concentrated on the formingcharacteristics of biaxially stretched acrylic material, even though theconcepts apply to other thermoplastic materials. It should also benoted that the study of uniform thickness generating methods isapplicable to the more general condition of controlled thickness.
Selection of the F-16 canopy and stretched acrylic material for thisstudy was based upon its complex shape and perceived long range needs.Presently F-16 canopies are a multi-ply laminate construction consist-ing of polycarbonate and acrylic. Analysis has indicated that a uniformthickness stretched acrylic canopy for the F-16 could satisfy all designrequirements including bird impact resistance at a weight comparableto that of the present composites, and with a greatly superior life.
Application of uniform thickness technology to the F-16 aircraft canopycould provide the means whereby the Air Force's goal of utilizing themost cost effective canopy transparency (while retaining specification
I

optics and structural requirements) could be met. Such a canopy for
the F-16 could provide the following values:
"o Reduced acquisition costs (about half of current part costs).
"o Improved optical quality.
"o Improved durability.
In order to demonstrate the concept of producing a uniform thicknesscanopy, both analytical and experimental actions were simultaneouslyundertaken. Analytical work was based on finite element modeling ofthe forming process. Experimental work was based on forming trials.Both of these activities were structured such that simple geometricforms were dealt with prior to advancing to the complex shape of theF-16 canopy.
The program was accomplished in two phases. In phase I, Swedlowinvestigated acrylic material properties at forming temperatures, con-ducted ideal geometry forming experiments, and modeled these experi-ments with finite element analysis. Phase II consisted of forming 1/4scale models of the F-16 transparency shape. Two sets of F-16 subscalecanopy parts were delivered to the US Air Force following this effort.A stretched acrylic canopy model of virtually uniform thickness isshown in Figure 1.
2

1
Figure 1. Stretched Acrylic 1/4 Scale F-16 CanopyTransparency of Virtually Uniform Thickness
(Forming Attempt No. 11)
The results of this project verify an ability to manufacture uniformthickness compound curved shapes, such as that of the F-16 canopy. In
* addition, acrylic material properties (necessary for finite elementstress analysis work) were generated at temperatures in the range ofthermoforming. A finite element code (MARC) was identified andimprovements were incorporated which show promise for stress-strainpredictions involving very highly strained items. The objective of thisproject was clearly achieved.
3

SECTION II
PROGRAM OVERVIEW
The overall objective of this program was to demonstrate the conceptof producing a uniform thickness canopy transparency through sub-scaleforming experimentation and computer modeling.
The program was accomplished in two phases. In phase I, Swedlowinvestigated acrylic material properties at elevated forming tempera-tures, conducted ideal geometry forming experiments, and modeledthese experiments with finite element analysis. Phase II consisted offorming 1/4 scale model of the F-16 transparency shape. Two sets ofF-16 subscale canopy parts were delivered to the US Air Forcefollowing this effort.
The program was structured to efficiently arrive at the objective.Initially it was uncertain that all of the anticipated tasks could beexecuted successfully within the budget. For example, the ability ofthe finite element modeling to accurately predict experimental resultswas unknown. In addition, the computer modeling could be costly andprohibit further computer development. Questions such as these couldonly be answered during program execution.
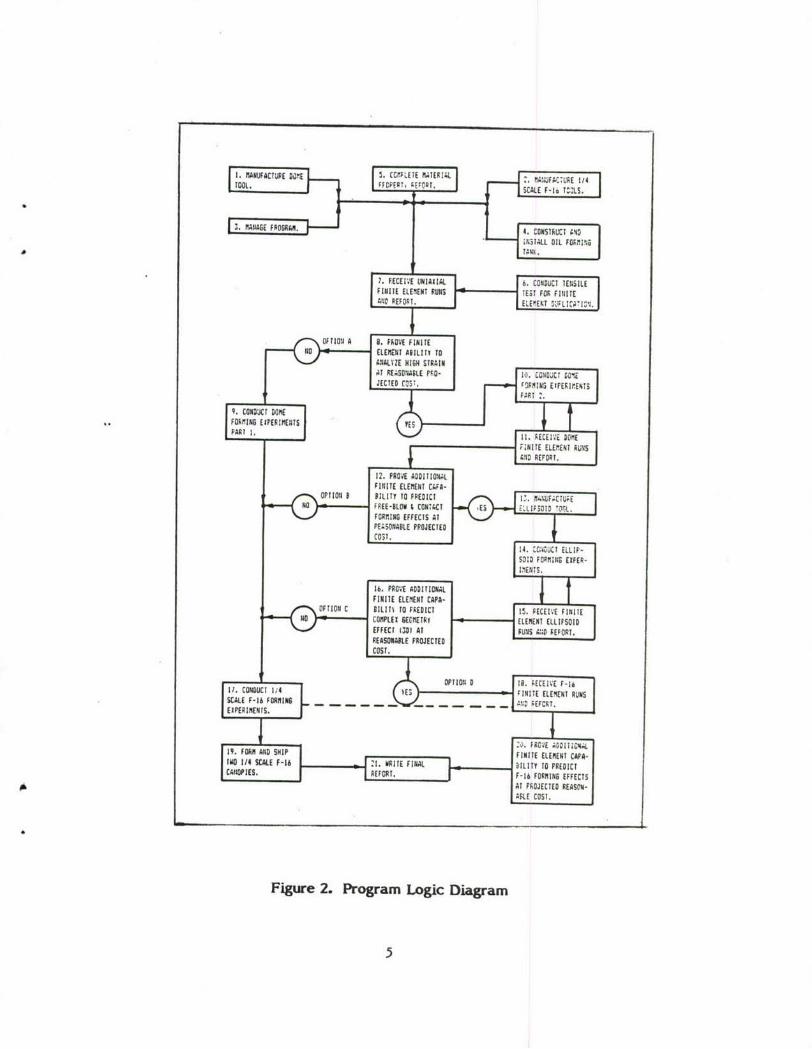
A more detailed description of the project plan is shown in Figure 2.The logic diagram shows 21 separate subtasks described within therectangular boxes. The yes/no circles are logical outputs of decisionsubtasks 8, 12, and 16. Four courses of action are possible based on theoutcomes at decision points. These are shown as option paths A, B, C,and D. As can be seen, option A has the least number of subtasks (12total), option B has 15, option C has 19, and option D has all 21subtasks.
During the program execution, option path B was found appropriate.This course of action resulted from the need to reconfigure the finiteelement program. The computer modeling of the acrylic hemisphere(subtask 11) was the most advanced shape analyzed by the computermodel. The uniform thickness canopy trials were based on experimentaliteration instead of computer modeling predictions.
4
3 - [VILE I MAFFCF[4t. REP MANUFAr",U!E S/4ETi L SSCALE F-Ij I JL
MANAGE FROSAM. :_ 4. IONSIAUCT ý40il.'3Z OIL FT I...ANK.
"C"I"', L"ll, IAL 6. CONDUCT TEII ILE
FINITE ELEMENT RIM TEST FOR FINITE
M TV PEFORT. ELEMENT
I0 OFTIO'll A 8. FADVE FINITE
ILMT ABILITY TOOALVIF HIGH STRAINAT REASONABLE FFO- To. CONDUCT colzJECT(D CDST. FORMINS EIPERVENTS
FTIO'll
A T
9. CONDUC I I .:DOPqIEl
PART
LF 1,
FORMING EIPERIMEUTS YE,PPART 1, 11. FECEIVE DOME
FINITE ELEMENT RUNSA111D REPORT.
12. PROK ADDITIONALFINITE ELEMENT Cf.FA-
OP1104 a BILITY TO FREDICtNO FREE-BLOW t CON3CT ES ?--o-4 t F
FORMING EFFECTS AT _jLL -DID 'LICL.
PE4SOnASLE PROJECTEDcost. i
IT. = -SO.D FOPýTSELLIF, M, N EIFER-
16. PRVE ADDITIONALFINITE ELEMENT CAPA-
t-'-\ OFTION C ITILITI TO FAEDICT t. FECEI'l FINITEELEMENT ELLIPSOIDCOMPLEX GEOMETRY -- EN DEFFECT (301 AT FUNS A11.10 AEFORT.
REASONABLE PROJECTEDCOST.
OPTION IT 10. FECEIVE F-16it. CONDUCT 1/4 YES FINITE ELE4ENT RUNSSCALE F-16 FORMING A,14 FEFCRT.EVERINENtS.
FROvE ADDITCi6L19. FOAM AND SHIP FINITE ELEMENT CAPA-TWO 1/4 SCALE F-16 :1. WRITE FINAL BILITY TO PREDICTCAIV JES. REPORT. F-16 FORMING EFFECTS
At FROJEETED REASON-ABLE COST.
Figure 2. Proqram Logric Dia-gapram
5
SECTION IM
FINITE ELEMENT ANALYSIS INVESTIGATION
In order to understand the limits of various forming processes, it isadvantageous to have a mathematical prediction technique. In the caseof forming a uniform thickness F-16 forward canopy, the predictionmethod should be capable of determining the original material thicknessprofile.
The predictive tool chosen to perform this analysis was a computerfinite element method. The finite element code would need to becapable of processing high material strains (greater than 200%) andmaterial property non-linearities.
The use of the finite element model predictions could potentially avoidthe high cost of experimentation associated with any new compoundcurved shape. The selected code execution must involve reasonablecosts in order to offset the cost of an experimental approach. The totalcost of performing each F-16 model run was chosen to be less than$3000. This was thought to be a reasonable trade-off limit based on thecost of experimentation and the iteration process of computer model-ing.
The objectives of the finite element phase of the program were asfollows:
a) Identify a code which, after possible modification, couldhandle thermoforming processes involving large strains (upto 200 percent).
b) Prove the capability of the code by a thorough analysis ofprogressively more difficult problems.
c) Estimate the computer costs of the true canopy modelingruns at each step of the code proof process.
d) Terminate the code development and future modeling runs ifthe technical accuracies or the cost of execution estimatesare found unfavorable.
The finite element code which was selected to model the thermoform-ing process was MARC. MARC is a non-linear general purpose finiteelement code offered by MARC Analysis Research Corporation in PaloAlto, California. It was selected over other codes based on a number offactors:
a) MARC was one of a few finite element codes which offereda proven method to model rubber-like materials of strainsexceeding 200 percent.
b) MARC offered the most comprehensive non-linear analysiscapabilities and recently added a new viscoelasticcapability 1.
6

c) Confidence expressed by Dr. Michael Burke of MARC Anal-ysis and his proposal to do this work was very influential.
d) Recommendations of finite element experts not a part ofMARC Analysis were positive.
The planned validation of the MARC code capability was based uponcomparison of the model results to the experimental results. Themodels and experiments were planned to increase in complexity until aF-16 canopy was modeled with the computer code. The plan called forthe modeling of four acrylic thermoforming experiments:
a) A uniaxially loaded tensile specimen
b) A hemisphere shape
c) An ellipsoidal dome shape
d) An F-16 canopy shape.
The first two experiments were to use MIL-P-8184 cast acrylic and thelast two experiments were to use MIL-P-25690 stretched acrylic. Thecast acrylic material was necessary for the tensile specimens in orderto obtain true uniaxial stress-strain data.
Only the first two finite element models a) and b) above wereperformed within the time period of this contract. Models c) and d)were not performed because of time constraints.
The tensile specimen was successfully modeled using constant strainrate material properties. The finite element model duplicated theexperimentally generated results for engineering strains up to 200%.
Prior to modeling of the hemisphere forming experiment, it was decidedto modify the MARC code. The modification would incorporate arubber-like shell element which would be less expensive to use than theexisting more complex rubber-like brick elements. Upon completion ofthis task, MARC modeled the hemisphere forming experiment. Theshape predictions were quite accurate, but the thickness and strainprofiles were inaccurate. These results indicated that some additionalmaterial property modifications were required. A further discussion ofthe tensile specimen and hemisphere models is given later in thissection.
A The general characteristics of the MARC code which were tested
include:
a) A Mooney strain energy material characterization.
b) A 2-D axisymmetric rubber-like shell element with largestrain and large rotational response capability.
7
c) An instantaneous stress-strain computation for a plane
stress condition.
d) A gap element interface between contact surfaces.
The results of this analysis work are encouraging. The technicalfeasibility of accurately modeling a canopy forming process is stillprobable. Code execution costs, while not demonstrated sufficiently,do not appear to be prohibitive.
MARC Analysis of Acrylic Tensile Specimens
The objective of modeling the acrylic tensile specimen was to demon-strate the ability of the MARC finite element code to simulateexperimental results. The general intent was for MARC to provide aninitial demonstration of its capability to analyze large strains (up to 200percent) and the non-linear response of acrylic. The constitutiveequations derived from the tensile tests were used in the hemisphereforming model.
The tensile tests were performed at a constant strain rate and auniform temperature. At forming temperatures above the glass transi-tion temperature, the acrylic is incompressible (i.e., Poisson's ratio =0.5). Over large strain ranges, the acrylic behaves in a non-linearelastic manner.
An analysis procedure exists with the MARC code for the largedeformation response of non-linear elastic and incompressiblestructures. This is the "Mooney" formulation. For the tensile model,the Mooney formulation was used and the capability was restricted toisotropic behavior.
The Mooney formulation requires that the constitutive law be describedin terms of a strain energy potential (W) which is a function of thestrain tensor. The strain energy function can be defined in terms of thethree invariants of the strain tensor:
W = W(II, 12, 13) (1)
The strain invariants (I), expressed in terms of the extension ratios (),are
I1 X12 + X2
2 + X32 (2)
12 ( X1 X2 )2 + ( X2 X3)2 + ( X3 Xl )2 (3)
13 (Xi )L X3 )2 ; 13 = I for incompressible deformation. (4)
where
ýn = instantaneous length/original length, n = 1, 2 or 3.
8
The particular functior;l f~rm of the strain energy function in the
MARC code is
W(II1, 2 ) = CIO(II-3) + C0 1 (12 -3) + C11(I1-3)(I2-3)
+ C 2 0 (I1-3)2 + C3 0 (II-3)3 (5)
The user has the option to include some or all of the terms. For smallto intermediate strains the first two terms are sufficient and thisexpression is commonly referred as the "Mooney-Rivlan" form. Thiswas not a sufficient description for this problem. The full availableexpresion was required for the tensile test modeling.
A stand alone computer program was generated in order to develop thefive material constants required by the strain energy function. Thestrain energy function is transformed into a true stress-true strainrelationship involving the five constants. Points selected from truestress-true strain test data are used in this determination.
It is further required, however, that the constitutive form be checkedfor stability at all regions within the strain space. This stabilityrequirement is a mathematical artifice and requires that the followingdeterminant be satisfied:
a 2 W > 0 (6)aci acj
A stand alone computer program was generated which can be used toverify stability over a broad range of principal extension ratios. Ifnecessary, the strain energy function coefficients are modified untilstability is achieved.
Two finite element models were used to analyze the tensile specimens.One was a two-dimensional plane strain element. The second was athree-dimensional element. Both models made use of the so-called"Herrmann elements", which are second order isoparametric elementshaving hydrostatic pressure variables at the corner nodes which enforcethe constraint of incompressibility.
Both of these models closely simulated test results. The test resultsand the result of generalized plane strain model are compared inFigures 3 and 4. The experimental tests resulted in approximately a16% variability in stress ((2000-1700)/1850 at 1.2 in/in) and a 20%variability in thickness reduction ((0.22-0.18)/0.20 at 100 lbs.). TheMARC finite element results fell between these two experimentalresults.
9

" Tensile Test #3- Tensile Test #4
* - MARC Generalized Plane Strain Finite Element Analysis
TRUE STRESS (psi)2500 - - - - -
2400 -2300
2200
2100
2000
1900
1700
1500
1400 .
1300 .
1200 • __11,1
1100------
1000---
eoo ,Z.7
500
200, .•
too . ••
0 ,05 -1 o13 .2 .25 .3 .33 .4 .43 .5 .53 .6 .65 .7 .75 .8 .63 .9 .95 1 1. 05 1. 1 1.Is1.h2 1.23 1.3TRUE STRAIN (in/in)
Figure 3. MIL-P-8184 Tensile Test Numerical/Experimental Comparison:True$Stess vs TrueStrain Curves
10

- Tensile Test #3N=-WE - Tensile Test #4
-- MARC Generalizeo Plane Strain Finite Element Analysis
LOAD (ib)140
'135
.130 -
125-- -
120--
1,15
.105--
100---------- - ----- - - - - ----
95--------
85
so o /
55 f
30 -- - - - - - - - - - - -
,25 -- -
20 ----
5 -- - - --- ---- -- --
0 .01 .02 .03 .04 .05 . .07 .06 .09 .1 .11 .12 .13 .14 .15 .14 .17 .18 .19 .2 .21 .22 .23 .24 .25THICKNESS REDUCTION (in)
Figure 4. MIL-P-8184 Tensile Test Numerical/Experimental Comparison:Load vs Lateral Thickness Reduction
11
MARC Analysis of Acrylic Hemisphere
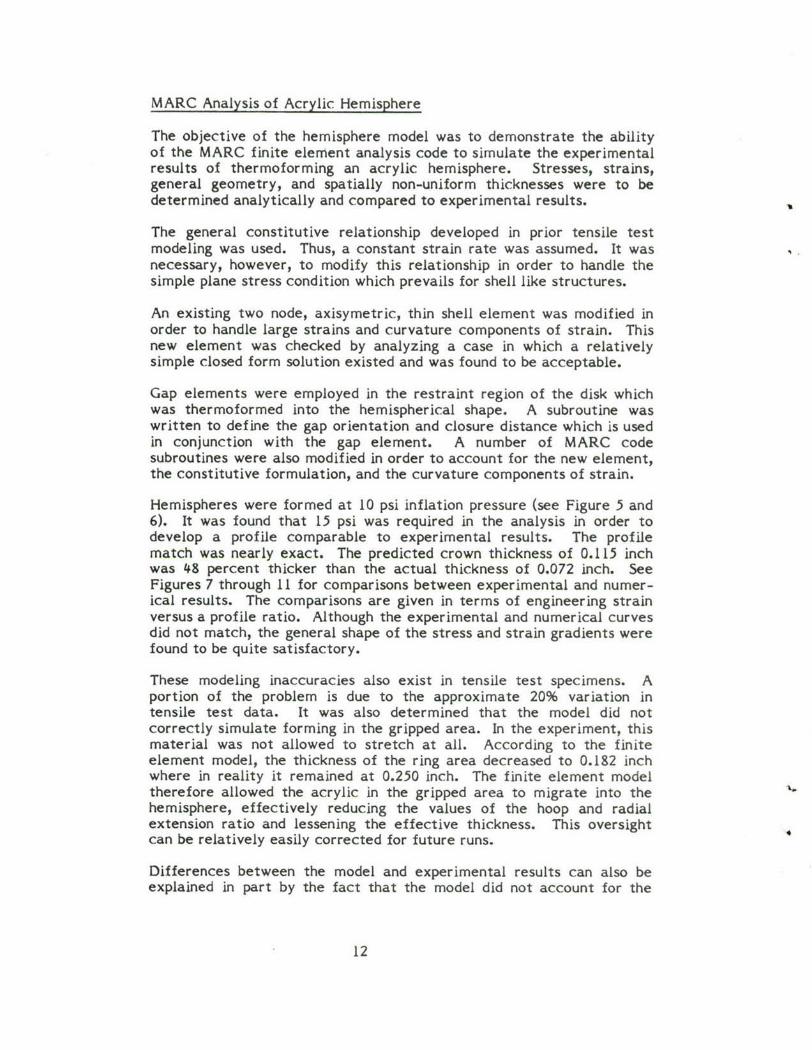
The objective of the hemisphere model was to demonstrate the abilityof the MARC finite element analysis code to simulate the experimentalresults of thermoforming an acrylic hemisphere. Stresses, strains,general geometry, and spatially non-uniform thicknesses were to bedetermined analytically and compared to experimental results.
The general constitutive relationship developed in prior tensile testmodeling was used. Thus, a constant strain rate was assumed. It wasnecessary, however, to modify this relationship in order to handle thesimple plane stress condition which prevails for shell like structures.
An existing two node, axisymetric, thin shell element was modified inorder to handle large strains and curvature components of strain. Thisnew element was checked by analyzing a case in which a relativelysimple closed form solution existed and was found to be acceptable.
Gap elements were employed in the restraint region of the disk whichwas thermoformed into the hemispherical shape. A subroutine waswritten to define the gap orientation and closure distance which is usedin conjunction with the gap element. A number of MARC codesubroutines were also modified in order to account for the new element,the constitutive formulation, and the curvature components of strain.
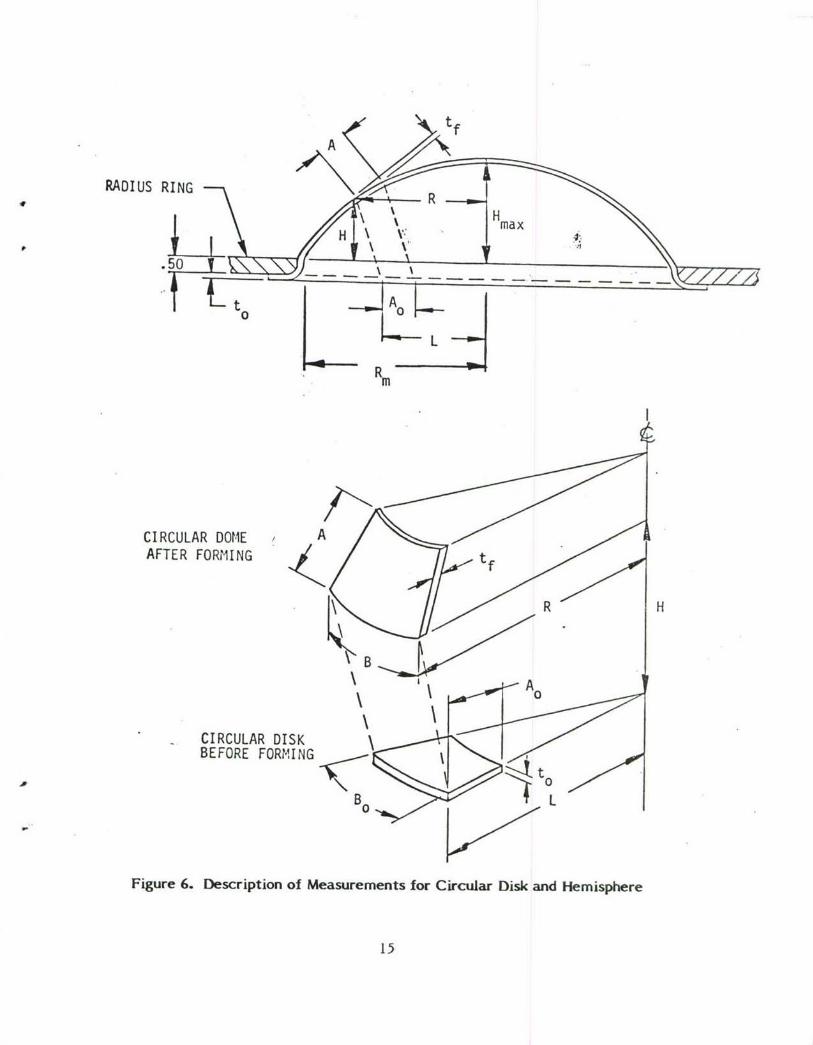
Hemispheres were formed at 10 psi inflation pressure (see Figure 5 and6). It was found that 15 psi was required in the analysis in order todevelop a profile comparable to experimental results. The profilematch was nearly exact. The predicted crown thickness of 0.115 inchwas 48 percent thicker than the actual thickness of 0.072 inch. SeeFigures 7 through I I for comparisons between experimental and numer-ical results. The comparisons are given in terms of engineering strainversus a profile ratio. Although the experimental and numerical curvesdid not match, the general shape of the stress and strain gradients werefound to be quite satisfactory.
These modeling inaccuracies also exist in tensile test specimens. Aportion of the problem is due to the approximate 20% variation intensile test data. It was also determined that the model did notcorrectly simulate forming in the gripped area. In the experiment, thismaterial was not allowed to stretch at all. According to the finiteelement model, the thickness of the ring area decreased to 0.182 inchwhere in reality it remained at 0.250 inch. The finite element modeltherefore allowed the acrylic in the gripped area to migrate into thehemisphere, effectively reducing the values of the hoop and radialextension ratio and lessening the effective thickness. This oversightcan be relatively easily corrected for future runs.
Differences between the model and experimental results can also beexplained in part by the fact that the model did not account for the
12

time-dependent effects of the acrylic. In the experiments, for anyý iven dome cross-section, the strain rates varied from the crownhighest strain rate) to the circular gripped area (no straining). In the
model, however, all elements were considered to have identical strainrates. Since acrylic is very sensitive to strain rates, if these time-dependent effects were properly modeled the computer results shouldbe much more accurate. This would require more material propertyequations which would be based upon tensile creep or relaxation testdata. The MARC code already is configured to accept these time-dependent effects and additional code modifications would thereforenot be necessary.
More work needs to be done to resolve the discrepancies betweennumerical and experimental results. Generally, however, the analysistechnique looks promising. Run-time information is still insufficient toadequately predict the cost of performing a full canopy model run.
The two-node axisymmetric shell element is a precursor to the 4-nodeshell element necessary for the more complex canopy geometries.Modifications to this 4-node shell element to become a viscoelastic orrubber-shell element will be required and will be similar to themodifications of the two-node shell elements. This process is straight-forward and should be relatively easy to perform.
Sp1
13

Jt
Figure 5. MRL-P-8184 Free-Blown Hemisphere
14
t fA
RADIUS RING R
50max
A0
L
Rm
CIRCULAR DOME ' AAFTER FORMING
f°
CIRCULAR DISKBEFORE FORMING
Figure 6. Description of Measurements for Circular Disk and Hemisphere
15

- % tgt R v LI 1 t 10 psi to f+rm* MARC Finite Element Results
F'rniile Ratio H Rm
I.I
I --- * ----- I- -" - -
.1 .2 .3 .4 .5 . .7 .8 .9 1 1.1 1.2 1.3 1.4
Prof ilIe Ratio R /Rm •
Figure 7. MIL-P-8184 Hemisphere Numerical/Experimental Comparison:
Normalized Deformed Shape vs Radius
16
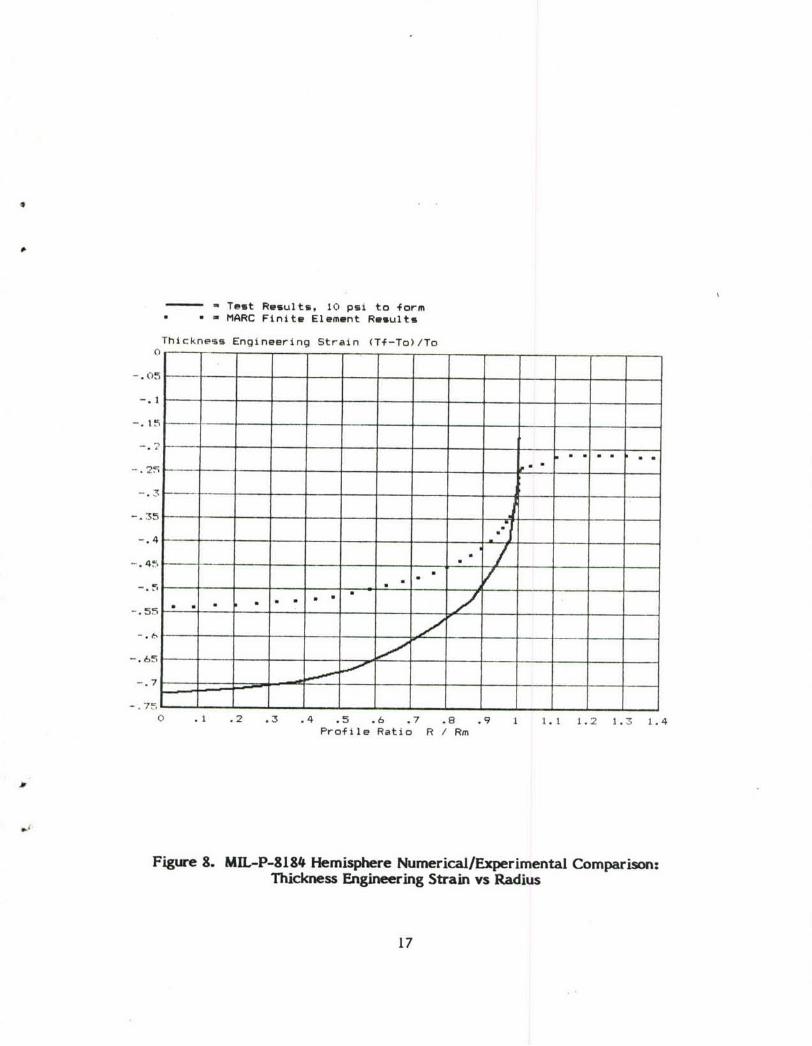
- - Test Results, 10 psi to form* , - MARC Finite Element Results
Thickness Engineering Strain (Tf-To)/To
05
-. 1---
-115
-. 43•,
-4!
-. 75
-7n
t __U
0 .1 .2 .3 .4 .5 .6 .7 e8 .9 1 1.1 1.2 1.3 1.4Profile Ratio R / Rm
Figure S. MEL-P-S814 Hemisphere Nurnerical/Experimental Comparison:Thickcness Engineering Strain vs Radius
17

- = Test Results, 10 psi to form* * - MARC Finite Flement Results
Radi.'L Enrjineerinq Strain (A-Ao)/Ao
1 .2 .. .4 5 -2
Profile Ratio R / Rm
Figure 9. MIIL-P-8184 Hemisphere Numerical/Experimental Comparison:Radial Engineering Strain vs Radius
18

p
-- = lest Results, 10 psi to form* * =' MARC Finite Element Results
Hcwvp Enqineerinq Strain (S-F3o)/Bo
'4.. .. ..... .. ... .. .
ii - I-_- L 1 .
. .2 .. .... .6 .7 ... 1 .1 1.2 1..7. 1.4Profile Ra'tio R / Rrn
Figure 10. MIL-P-8184 Hemisphere Numerical/Experimental Comparison:Hoop Engineering Strain vs Radius
19
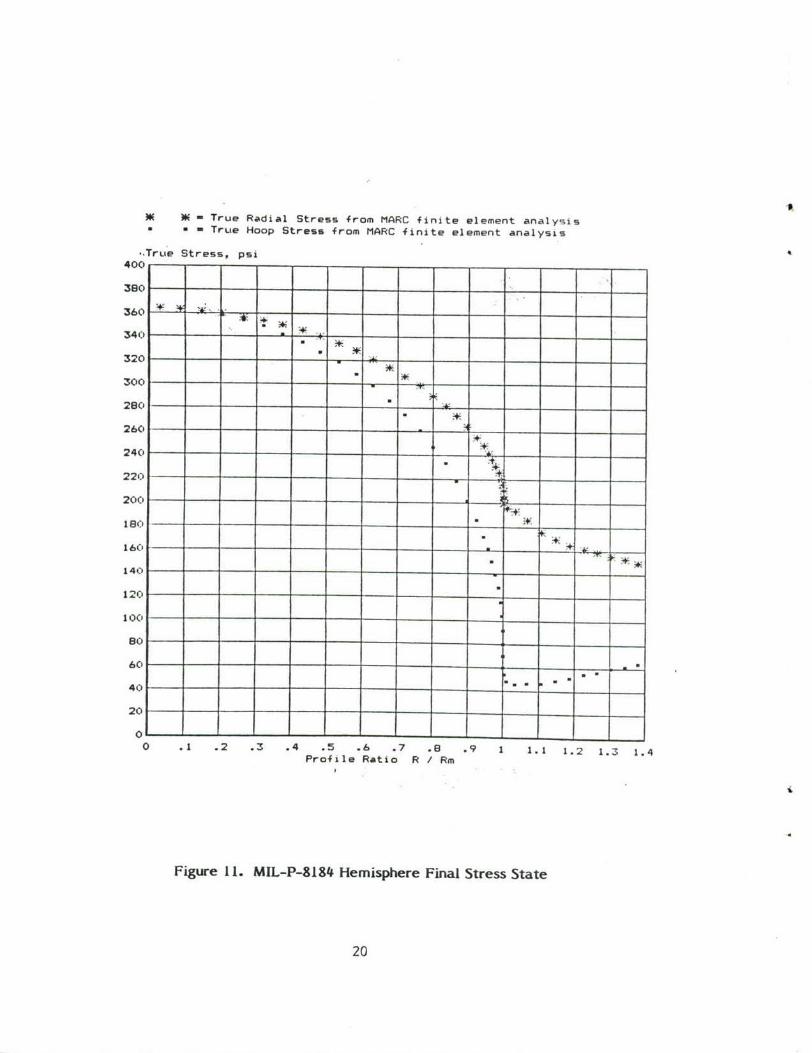
NE NE - True Radial Stress from MARC finite element analysis* * - True Hoop Stress from MARC finite element analysis
.. True Stress, psi400
3801
360
34" - - " + ..
340
3200
280 -"
260 -
+240C
220)
200:
180" "•
160
14t1
120
100
80
60 ---
40 - -
20
01 0 1- - - - - - - - - - - -
0 .1 .2 .3 .4 .5 .6 .7 .8 .9 1 1.1 1.2 1.73 1.4Profile Ratio R / Rm
Figure 11. MIL-P-81 84 Hemisphere Final Stress State
20

SECTION IV
ACRYLIC MATERIAL PROPERTIES ATTHERMOFORMING TEMPERATURES
Prediction of thermoforming characteristics using a finite elementstress analysis code requires an understanding of material properties atthermoforming temperatures. Thermoforming is generally done atmaterial temperatures which are well above the glass transition tem-perature. Physical properties of plastic materials used in aircrafttransparencies (specifically acrylic and polycarbonate) are poorly char-acterized at these temperatures.
The objective was to begin to develop the uniaxial tensile stress-straincharacteristics of acrylic at temperatures in the range of 2300F to350*F. As Cast MIL-P-8184 acrylic was used instead of stretchedacrylic in order to derive true uniaxial material properties.
In general, the tensile properties of a material at a constant tempera-ture (isothermal) may be described as a surface in the stress-strain-time domain as depicted below. 2
E creep curve
Temp : constant
isochronous
IE o
relaxation curve
Figure 12. Stress-Strain-Time Domain
Tests were conducted at three strain rates (approximately 0.05, 0.20and 1.00 in/in-min.) and at five temperatures (250, 260, 275, 300,350 0 F). A constant strain rate was used. Ninety tests were performed.Sixty-three tests were used in the properties data base generated.
21

A test technique was developed for the tensile specimens whichprovided a cooled gripping area while maintaining an elevated tempera-ture test section. A photographic method was used to provide measure-ment of the high strains.
The three dashed curves in Figure 12 (lines 01, 02 and 03) representlines on the surface which are based on constant strain rate testing atthree different rates. Curves such as these were generated by this testwork. From this data it is possible to provide a limited estimate (onlythree data points) of the isochronous, creep, and relaxation curves.Reduction of the available data necessary to present these curves hasnot been completed because of an insufficient data base.
Ignoring the differences in properties associated with different strainrates, a few of the general tensile properties are shown in Figures 13-16. A few conclusions can be made from these graphs.
1) The initial tensile modulus drops by about 2 1/2 orders ofmagnitude as the temperature increases from the glass transitiontemperature (235*F) to 300*F. The rates of change of the tensilemodulus on either side of this transition region are much less.
2) The ultimate tensile strain (strain at breakage) appears to plateauin the 250-300*F temperature region and above this temperaturethe strain allowable appears to decrease.
3) Maximum tensile strain appears to occur at about 260 - 2750F andis on the order of 200% (minimum). The maximum mean strainallowable measured was just over 300% but variation was large.
22

-7 F-- VtHr-
.3.3 T
4 - -- 44
Sojjrces of Data:-1 Mil Handbook-17A Part II. 1977-Swedlaw Tensile Tests, 1983
Lii
LLi
~10
___ -~- -
10 1.-- 1j4 ' .0 50 10 150 00 250 300 35
2312
4 1 L
(A
LLu
S[uce of Dta:
L 102
Figure 1 Ultimaedo Tensile STrests, 1sT98 rt3e p88
1024

10
CLJ
{tfi tL.~ --
00 50 100 150 20 5 0 544
Figure wdlo 15 Tensile Moulstvs, Te1 eaur,83--8
1022

10 5
T- - - -
104=4
V,)
Lii
Lii
U,
-100 0T0
1020
TEMPERATURE ('F)
Figure 16. Approximate Tensile StressAt Yield Point vs Temperature MIL-P-8184
26
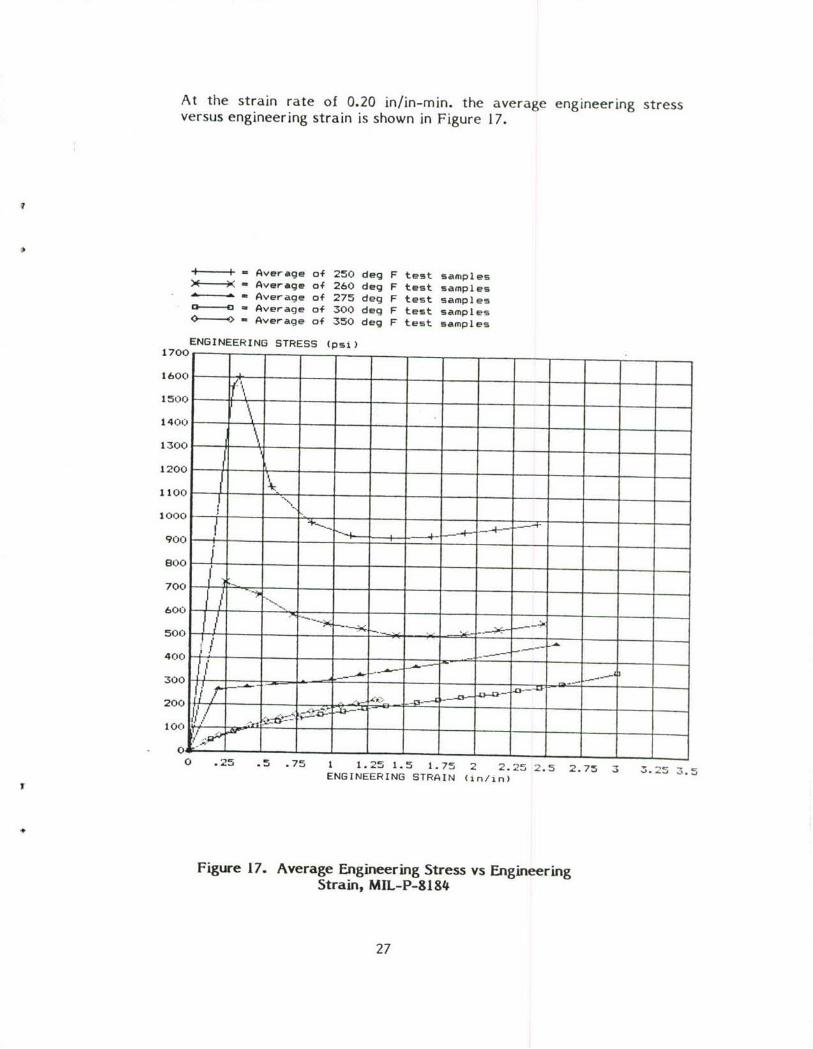
At the strain rate of 0.20 in/in-min. the average engineering stressversus engineering strain is shown in Figure 17.
S- Average of 250 deg F test samples- Average of 260 deg F test samples- Average of 275 deg F test samples- Average of 300 deg F test samples- Average of 350 deg F test samples
ENGINEERING STRESS (psi)1700
1600 --
1500 ---
1400 -
1300 ---
1200 I
11000
1000 - .-----------
900 -800
700
600 .
400 :. . . -
3 0 0 = --- _-
200 - - - - - -- -
1 I 00
0 .25 .5 .75 1 1.25 1.5 1.75 2 2.25 2.5 2.75 3 3.25 3.5ENGINEERING STRAIN (in/in)
Figure 17. Average Engineering Stress vs EngineeringStrain, MIL-P-818'
27

The effect of strain rate at 2500 F is depicted in Figure 18.
-+, - O.C75 in/in/min strain rate
- 0.30 in/in/min strain rate*.--• = 1.50 in/in/re-in strain rati'
ENGINUNE E RIN S"RE !-6 (ps 51920
184c)
1360 .. .. -- .........
1280 - ..-- .....
1200 .........
1120
1040 -.............
960 ..... . -• . . .. ... . - - - --.. ...... .... .. .
8 0 0.. . . .. .... ... .
720
64C0
480 - - -"- -...... ,-'
400 --
320 - -- __ __
-4---2 4 0 .... . . . ...... .. .. -_- -___ -:. ....
160 1 -- - - . .
5) .1 5 2.5 2 55 4 4.5 5 5 5 6 6.5
ENGINEERING STRAIN (in/in)
Figure 18. MIL-P-8184 Engineering Stress vs Engineering Strain, 250°F
28
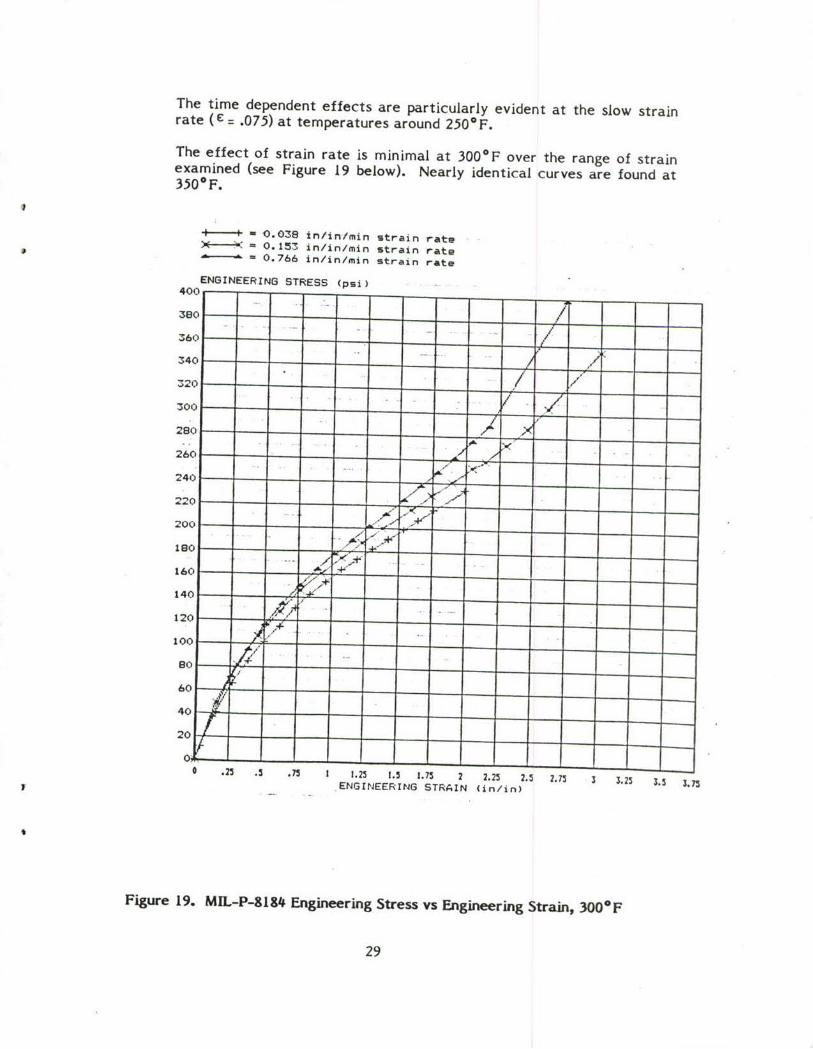
The time dependent effects are particularly evident at the slow strainrate (C = .075) at temperatures around 2500F.
The effect of strain rate is minimal at 3000F over the range of strainexamined (see Figure 19 below). Nearly identical curves are found at3500F.
1 0.038 tn/in/min strain rateX =- 0.153 in/in/min strain rate
- 0.766 in/in/min strain rate
ENGINEERING STRESS (psi) -
400
380
340 -
300
260
240
220 7
20-0"
ISO0
140 -20
40
0 .25 .5 .75 I 1.25 1.5 1.75 2 2.25 2.5 2.75 3 3.25 3.5 3.73ENGINEERING STRAIN (in/in)
Figure 19. MIL-P-8184 Engineering Stress vs Engineering Strain, 300°F
29

Although additional material characterization work is required in thishigh temperature regime, sufficient data has been generated to proceedwith finite element analysis of the thermoforming process. A basic testmethod has been established which is able to contend with the problemsof high temperature testing of plastic materials. Data on acrylictensile properties above the glass transition temperature has beengreatly expanded by this work.
30

SECTION V
SUB-SCALE F-16 CANOPY FORMING EXPERIMENTATION
The concept for developing a uniform thickness for a compoundcontoured canopy is based on the use of a non-uniform thickness sheetstock. This is in contrast to the possibility of subsequently grinding to auniform thickness, an otherwise non-uniform canopy.
In the absence of an analytical predictive technique, it is possible toarrive at the required sheet stock contour through a trial and errorexperimental process. The objective was to form stretched acrylic sub-scale F-16 canopies which would have a final uniform thickness (i.e.,thickness variation less than 15%). The method for achieving thisobjective should be based on the use of a non-uniform thickness sheetstock.
The experimental plan was based on the following steps:
1) Form a uniform thickness sheet to the canopy shape and measurethe resultant thickness profiles.
2) Prepare a new non-uniform thickness sheet wherein the thicknessvariations are based on the difference between the starting andfinal thicknesses found in step (1).
3) Form the non-uniform thickness sheet to the canopy shape andmeasure the resultant thickness profiles.
4) Adjust the non-uniform sheet thickness based on the variationfrom uniformity which are found.
A 1/4 scale F-16 canopy form die was manufactured in order to performthis experimentation. Sheet stock thickness profiling was accomplishedin a laboratory manner. Eleven forming trials were attempted. Sevenof these resulted in acceptable canopy shapes.
Thickness profiles of the F-16 canopy resulting from the forming of auniform thickness sheet are shown in Figure 20. Results of anintermediate trial are shown in Figure 21. The final trial (attempt 11)yielding the best uniformity is depicted in Figure 1. The flat blankcontour of this part prior to forming is shown in Figure 22. Figure 23illustrates the final thickness profile of this canopy after forming wasperformed. Only a very small region in the aft end of the canopyexceeds the 15% maximum thickness variation criteria. Correction ofthis small discrepancy could be easily corrected on any subsequentforming attempt.
It is anticipated that this iterative procedure, when employed for anynew shape, could yield an acceptable starting sheet thickness profile inthree to five forming attempts.
31
Two sub-scale F-16 canopies were submitted to the Air Force WrightAeronautical Laboratories (see Figure 24). One of these is highlythinned based on the use of a uniform thickness sheet stock. The otheris a uniform thickness canopy resulting from the thermoforming of anon-uniform thickness sheet. These parts illustrate the degree ofthickness correction which may be obtained by this process andconfirms the feasibility of the method.
It is possible to develop full-scale tools, based upon this work, whichwill produce uniform thickness acrylic F-16 canopies. Practical full-scale manufacturing methods are envisioned for making non-uniformthickness flat sheets.
32

=.200
.lýO
.160
PO I
Figure ~ ~ ~ ~ 40 N0 AvrgIhcns a fToAtmt 1ad#
330
• .110
I I 0 1.130! i !
S-~ .1 90 •
-;. 200.200
Figure 20. Average Thickness Map of Two Attempts #1 and #7Uniform Thickness Blank
Uniform Temperature
33

16bL
bJ o I Illi /
/ i Izu • ,
IFiue2. Finl.hiknssMa of Attmp No.1
FZ- \1
Vaial Thicnes Blan
t ~I • :
344
I ! I .! "0
Fiur 21.---ina Thcns MapL,,• of Attem.pt N. 10
Variable Thicknss BlankUniform Temperature
34

Figure 22. Variable Thickness Flat Blank Used inAttempt No. I1I Shown against a Gridboard
35

0(
IMI
I H
.110 l t ,: 1 100 •
Figure 23. Final Thickness Map of Attempt No. I IVariable Thickness Blank
Uniform Temperature
36

Figure 24. Two 1/4 Scale F-16 Canopy Transparencies(Attempts no. 6 and 10) Which Were Submitted to the US Air Force
37

SECTION VI
PROGRAM CONCLUSIONS
Four major conclusions were reached as a result of this program:
1. The feasibility of manufacturing uniform thickness stretchedacrylic F-16 canopies from non-uniform thickness sheet stock hasbeen demonstrated.
2. A method of testing uniaxial tensile specimens of thermoplasticmaterials above the glass transition temperature has beendeveloped.
3. Uniaxial tensile stress-strain properties of MIL-P-8184 acrylicwhich have been generated at temperatures above the glasstransition, are sufficient for use in finite element analysis of thethermoforming process.
4. Use of the modified version of the MARC finite element analysiscode for predicting characteristics of the thermoforming processappears to be feasible. A substantial start has been made indeveloping this capability.
4
38

SECTION VII
RECOMMENDATIONS
The major benefits of this program were the development of manufac-turing processes and testing the computer modeling feasibility forcreating uniform thickness transparencies. This program has identifiedareas where more in-depth studies are desirable. These are describedbelow.
I. Manufacture full-scale stretched acrylic F-16 canopies of uniformthickness for bird strike testing and to demonstrate other perfor-mance and cost values.
2. Continue to expand the characterization of acrylic at high tem-peratures.
3. Continue to develop the MARC code to deal with plastic thermo-forming processes.
4
39

REFERENCES
1. Fong, Henry H. "An Evaluation of Eight U.S. General Purpose Finite ElementComputer Programs," AIAA Materials Conference, 1982, pp 145-160.
2. Williams, J.G., Stress Analysis of Polymers, 2nd revised Edition (West Sussex,England, 1980).
3. MIL-HDBK-17A, Part II, Plastics for Aerospace Vehicles, Part IITransparency Glazing Materials, 8 June 1977.
4. Rohm and Haas Company, Philadelphia, Pennsylvania, "Plexiglass TechnicalHandbook", 1973.
5. Swedlow, Inc., Garden Grove, California "Swedlow, Inc. Handbook", 1980.
40
SU.S.Government Printing Office: 1984 - 759-062/779