Embed Size (px)
Citation preview

County Chartbook
of Social & Health Indicators
Monmouth County, New Jersey
Submitted by: Division of Addiction Services
New Jersey Department of Human Services June 2005
DAS - DHS
ii
ACKNOWLEDGMENTS We wish to gratefully acknowledge the contribution of public agencies for providing us with archival data on which this study is based. The selection of indicators, the collection and presentation of data, and the specific notes on interpretations are the work of the Division of Addictions Services (DAS), New Jersey Department of Human Services (NJDHS).
We also thank Carolann Kane-Cavaiola, (Assistant Commissioner, DAS/NJDHS), Donald Busch (Executive Assistant, DAS/DHS), Debra Fulcher (Program Officer SAMHSA/CSAT) and all members of the Office of Policy Development (DAS/NJDHS) for their guidance, patience and continued support of this project.
Reported by:
Allison Gertel-Rosenberg, M.S. Program Manager
Office of Policy Development Division of Addiction Services
NJ Department of Human Services
Yohannes Hailu, Ph.D. Office of Policy Development Division of Addiction Services
NJ Department of Human Services
This Chartbook was developed under grant No. GUR1 TI13432-03-3 from the Substance Abuse and Mental Health Services Administration (SAMSHA), U. S. Department of Health and Human Services (HHS). The views, policies, and opinions expressed are those of the authors and do not necessarily reflect those of SAMSHA, or HHS.

iii
Table of Contents Acknowledgments..............................................................................................................ii Table of Contents..............................................................................................................iii Introduction ....................................................................................................................... 1 Report Organization.....................................................................................................................2 Chapter One State Profile of Social Indicators Population Profile ........................................................................................................................5 Mortality Data: Mortality attributable to alcohol and drugs ................................................13 Criminal Justice Data: Alcohol and drug crime indicators...................................................18 Substance Abuse Treatment Admissions Data ......................................................................23 Supplemental Indicators............................................................................................................27
Chapter Two County Profile of Social Indicators Introduction...................................................................................................................... 29 General Profile of Monmouth County ............................................................................. 30 Population Distribution by Age and Ethnicity................................................................. 32 Drug and Alcohol Attributable Death by Gender & Race .............................................. 33 Alcohol Related Crime .................................................................................................... 34 Drug Related Crime ......................................................................................................... 35 Substance Abuse Admissions by Sex, Age, Race & Ethnicity........................................ 36 Substance Abuse Admissions by Modality of Care......................................................... 37 Supplemental Indicators................................................................................................... 38 Appendices: Appendix A: Population profile of New Jersey counties........................................... 40 Appendix B: Alcohol and drug attributable Mortality Data by counties................... 50 Appendix C: Alcohol and drug attributable crime by counties ................................. 56 Appendix D: Treatment admissions data by counties: ............................................. 69 Appendix E: Glossary of terms, Data Source & References .................................... 72

1
Introduction
Assessing the well-being of community health through social indicators has been a long-standing concern to the Center for Substance Abuse Treatment (CSAT). To meet this objective, CSAT has encouraged the use of social indicators to assess social and health risks related to substance misuse in order to inform policy makers. Recently, CSAT convened a group to draft a road map for such studies in the form of a “Social Indicators Core Protocol” to be used by states. Following the social indicators core protocol guidelines provided by CSAT, the Division of Addiction Services (DAS) developed this Chartbook of substance abuse related social and health indicators in the state of New Jersey. Enhancements to the Social Indicators Core Protocol are presented in the “Social Indicator Supplemental Studies” to provide a more comprehensive picture of treatment needs assessment at the county level.
The Social Indicators Chartbook is intended to identify health problems directly or
indirectly related to substance use and to aid in the assessment of needs for treatment services. This is achieved, in part, by using the key social indicators outlined in the core protocol by CSAT, and by identifying risk and protective factors affecting health outcomes. Summary analysis of the core indicators is presented using census data, mortality data, criminal justice data and substance abuse treatment admissions data. An adaptation of the “Communities That Care Survey” instruments originally developed by the Developmental Research Group of the University of Washington in Seattle (Hawkins, Catalano and Miller, 1992) was used to identify supplemental indicators. The supplemental indicators provide additional social, economic and health indicators related to the four domains of risk and protective factors (community environment, family structure, school involvement, and individual/peer group initiation of problem behaviors). The specific objectives of the Chartbook are to:
• Present an objective profile of each county and the State using key social indicators related to substance abuse. The Chartbook incorporates indices of core indicators based on historical data sources on population, mortality, crimes arrests, and substance abuse treatment admissions. In addition, supplemental indicators of risk and protective factors that affect health outcomes are presented for each county and the State.
• Show the effect of substance use and related health consequences in New Jersey’s counties and the State.
• Provide information to support needs assessment and prevention, as well as treatment planning, at community level
Data Sources
Data for the social indicators core protocol and supplemental studies are obtained from archival sources published by the U.S. Bureau of the Census and New Jersey governmental agencies, including the Departments of Human Services, Health & Senior Services, Education, and Law and Public Safety. Data are also obtained from DAS’ Alcohol & Drug Abuse Data System and from DAS-sponsored needs assessment surveys. An outline of the data sources used in this study is attached in Appendix E.

2
Report Organization
The Chartbook has three sections including The State Profile, County Profiles and The Supplemental Studies of social indicators. Selected indicators are displayed using thematic maps, charts and tables accompanied with brief descriptive text. The maps display patterns of specific health indicators of each county and the tables provide recent, as well as trend, data on selected indicators.
The State Profile and the County Profiles contain the four indicators listed in the CSAT
Core Protocol. These are indicators of population characteristics, substance abuse related mortality (e.g., drug related and alcohol related mortality), criminal justice cases (alcohol and drug related crime), and alcohol and drug treatment admissions by modalities and by primary and secondary drugs of abuse (alcohol, heroin, cocaine/crack, marijuana and other drugs).
The Supplemental Indicators are grouped according to the risk and protective factor domains identified in the “Communities That Care Survey.” They are organized according to the four major domains of the risk and protective factors. These are: (1) Community Environment; (2) Family Structure; (3) School Involvement; and (4) Individual/Peer Group Initiation of Problem Behaviors. It also includes the following selected social indicators that are relevant for treatment needs assessment:
County Summary Data Table: This table presents an overview of some of the basic indicator variables for the year 2000 - Population, Area, Median Household Income, Unemployment Rate, Total Crime Rate/1,000 population, Percent of High School Graduates, Percent of College Graduates, Married Parents/1,000 births, Teenage Births/1,000 births, and Birth weight >=2,500 grams/1,000 births.
Population by Age: This chart presents the distribution of the population by age groups – <12 years, 12-17 years, 18-24 years, 25-34 years, 35-64 years, and 65 years and over.
Drug Treatment Data: This chart presents the distribution of the drug treatment admissions by type – Alcohol, Heroin, Crack & Cocaine, Alcohol with drug, Marijuana, and Other Drugs.
Crime Rates: This chart presents the Violent Crime Rate, Non-violent Crime Rate and Domestic Violence Rate for each municipality.
Drug and Driving Under the Influence (DUI) Arrests: Here the Drug and DUI Arrests are presented by type – Marijuana, Opium & Cocaine, Synthetic Drugs, Other Drugs, and DUI.
Selected Demographics Characteristics Table: This table presents the population and poverty rate distribution by race/ethnicity – White alone, Black alone, Native American alone, Asian alone, Pacific Islanders alone, Other alone, and 2+ races.
Mothers by Prenatal Care: This chart presents the data on when prenatal care began for the mother. The four categories shown are: First Trimester, Second Trimester, Third Trimester and No care/No Statistics.
A complete set of tables regarding data on social and health indicators for each county is
provided in the Appendices. A short glossary of terms listed in Appendix E defines key technical terms.

3
New Jersey Department of Human Services, Division of Addiction Services, Office of Policy & Development
OCEAN
SUSSEX
BURLINGTON
MORRIS
ATLANTIC
SALEM
WARREN
MONMOUTH
CUMBERLAND
HUNTERDON
BERGEN
SOMERSET
MERCER
CAMDEN
GLOUCESTER
PASSAIC
CAPE MAY
ESSEX
MIDDLESEX
UNIONHUDSON
30 0 30 60 Miles
New Jersey Counties
N
4
Chapter One State Profile of Social and Health Indicators
• Population Profile • Mortality Data Attributable to Alcohol and Drug Abuse • Criminal Justice Data: Alcohol and Drug Crime Indicators • Treatment Admissions Data • Supplemental Indicators

Population Profile
Introduction This section describes the population characteristics of New Jersey in order to provide a context for analyzing and interpreting the social indicators that have potential effects on health status, treatment needs and type of treatment services provided. Population characteristics are of fundamental importance in estimating prevalence rates or in age-adjusting data when comparing indicators across counties. Data on population change, gender, age, race and ethnicity are obtained from the 1990 and 2000 decennial censuses. As listed in item 1 below, the population characteristics of New Jersey and its counties are displayed in the main body of this document. Population data by counties, as listed in item 2, are included in Appendix A. 1. General Profile of Census Population Data & Population estimates
• Population Distribution (1980-2000) • Population Growth • Regional Distribution of Population (1950-2000) • Age Structure • Population Distribution by Age • Population Distribution by Age and Gender • Population Distribution by Race/Ethnic Composition
2. Specific Population Data & Population Estimates by Counties in Appendix A.
• County Population Size and Change, 1990-2010 • County Population by Age, 2000-2010 • County Population by Gender, 2000 • County Population by Race/Ethnicity, 2000
5
6
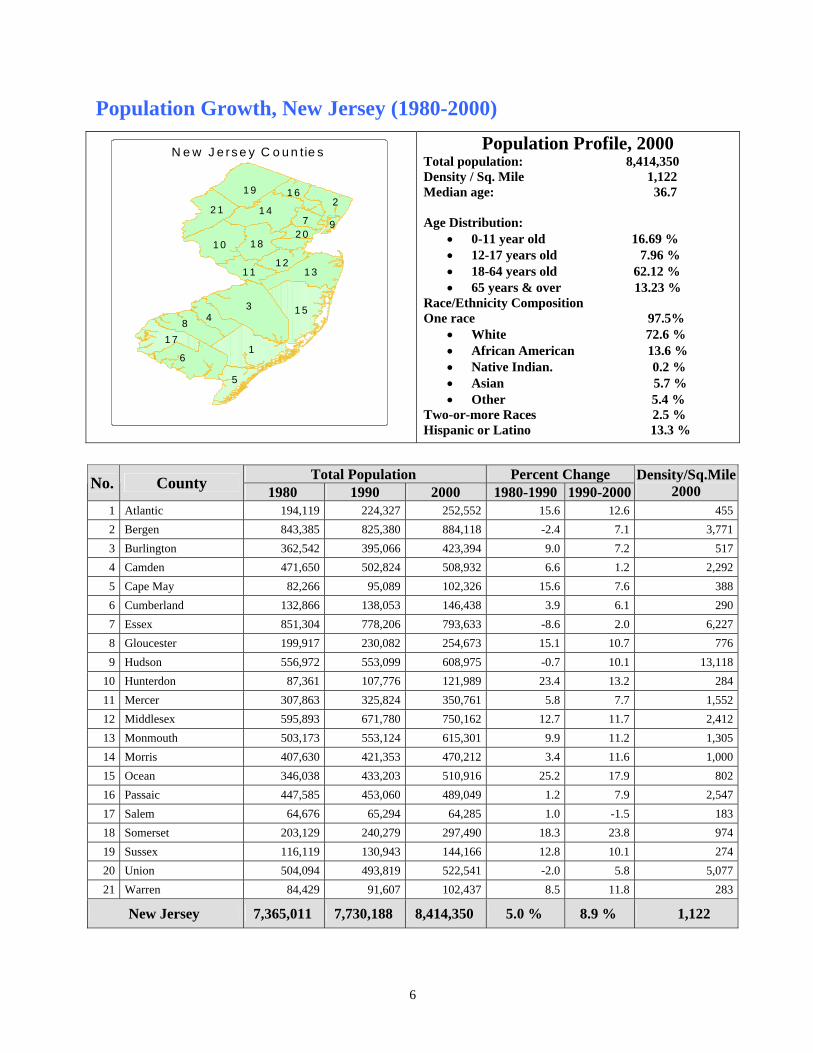
Population Growth, New Jersey (1980-2000)
Total Population Percent Change No. County 1980 1990 2000 1980-1990 1990-2000
Density/Sq.Mile2000
1 Atlantic 194,119 224,327 252,552 15.6 12.6 4552 Bergen 843,385 825,380 884,118 -2.4 7.1 3,7713 Burlington 362,542 395,066 423,394 9.0 7.2 5174 Camden 471,650 502,824 508,932 6.6 1.2 2,2925 Cape May 82,266 95,089 102,326 15.6 7.6 3886 Cumberland 132,866 138,053 146,438 3.9 6.1 2907 Essex 851,304 778,206 793,633 -8.6 2.0 6,2278 Gloucester 199,917 230,082 254,673 15.1 10.7 7769 Hudson 556,972 553,099 608,975 -0.7 10.1 13,118
10 Hunterdon 87,361 107,776 121,989 23.4 13.2 28411 Mercer 307,863 325,824 350,761 5.8 7.7 1,55212 Middlesex 595,893 671,780 750,162 12.7 11.7 2,41213 Monmouth 503,173 553,124 615,301 9.9 11.2 1,30514 Morris 407,630 421,353 470,212 3.4 11.6 1,00015 Ocean 346,038 433,203 510,916 25.2 17.9 80216 Passaic 447,585 453,060 489,049 1.2 7.9 2,54717 Salem 64,676 65,294 64,285 1.0 -1.5 18318 Somerset 203,129 240,279 297,490 18.3 23.8 97419 Sussex 116,119 130,943 144,166 12.8 10.1 27420 Union 504,094 493,819 522,541 -2.0 5.8 5,07721 Warren 84,429 91,607 102,437 8.5 11.8 283
New Jersey 7,365,011 7,730,188 8,414,350 5.0 % 8.9 % 1,122
3
16
81 5
1 9
1 42
1 3
4
1 0
5
2 1
1 7
1 8
7
1 11 2
1 6
2 09
N e w J e rs e y C o u n tie s
Population Profile, 2000 Total population: 8,414,350 Density / Sq. Mile 1,122 Median age: 36.7 Age Distribution:
• 0-11 year old 16.69 % • 12-17 years old 7.96 % • 18-64 years old 62.12 % • 65 years & over 13.23 %
Race/Ethnicity Composition One race 97.5%
• White 72.6 % • African American 13.6 % • Native Indian. 0.2 % • Asian 5.7 % • Other 5.4 %
Two-or-more Races 2.5 % Hispanic or Latino 13.3 %
7
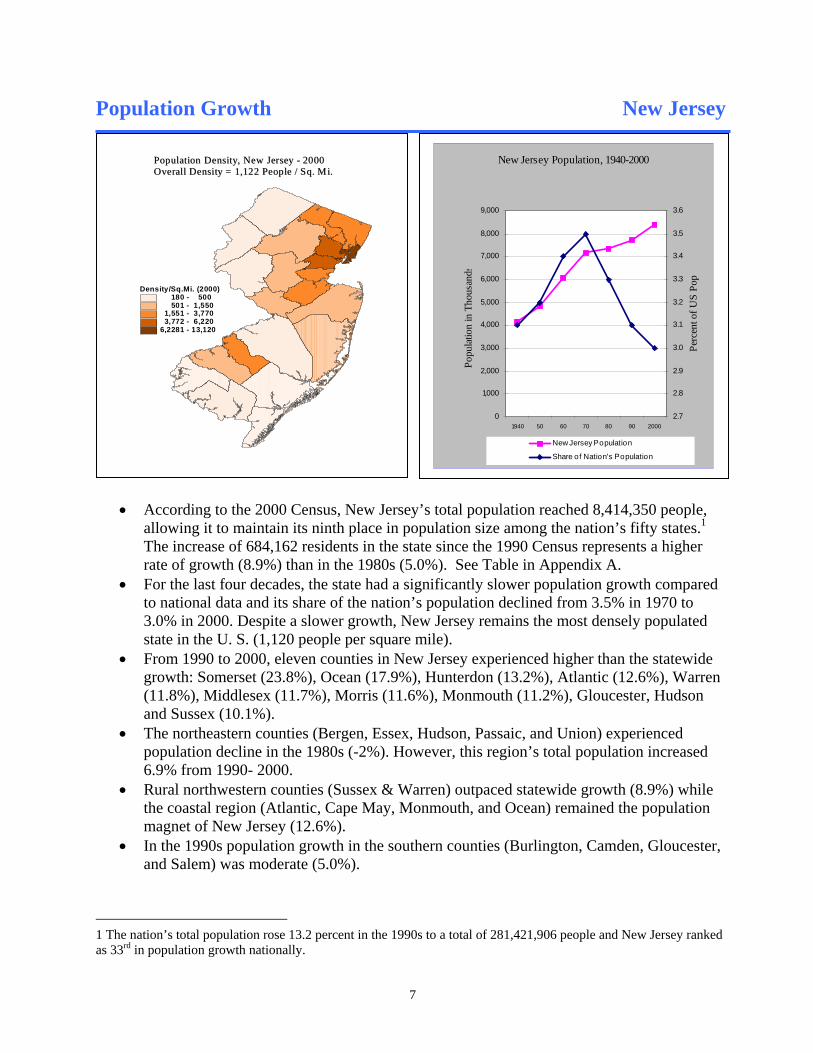
Population Growth New Jersey
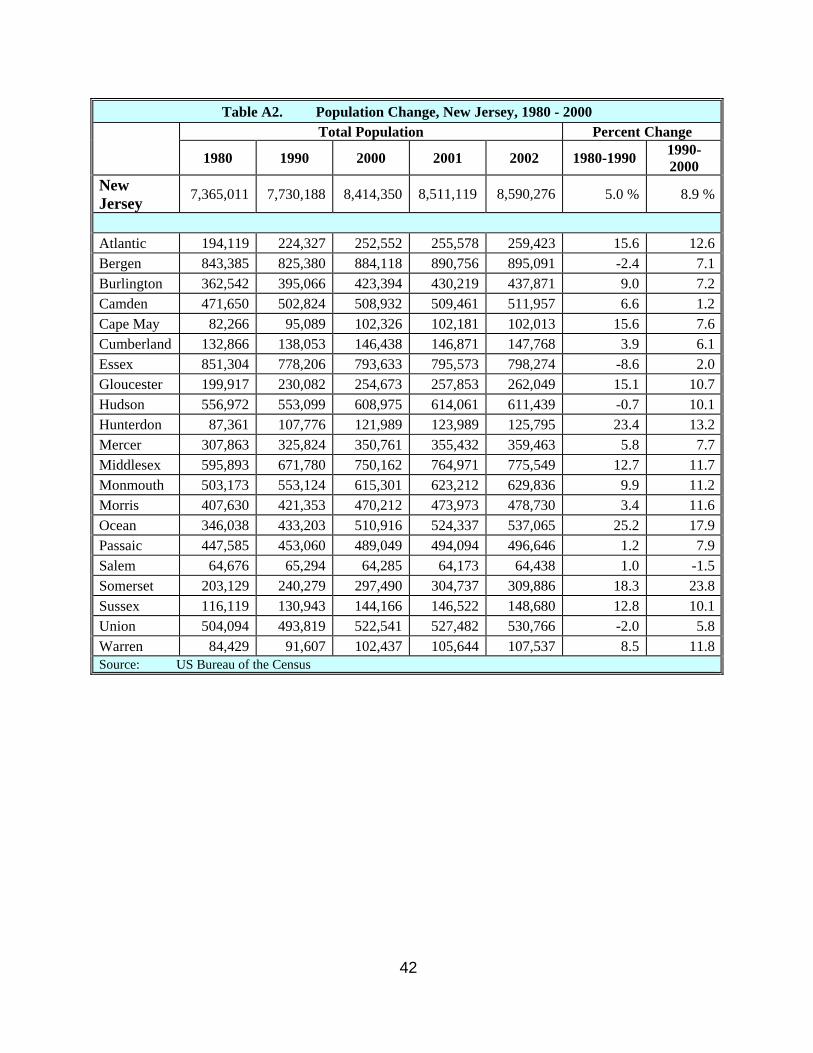
• According to the 2000 Census, New Jersey’s total population reached 8,414,350 people, allowing it to maintain its ninth place in population size among the nation’s fifty states.1 The increase of 684,162 residents in the state since the 1990 Census represents a higher rate of growth (8.9%) than in the 1980s (5.0%). See Table in Appendix A.
• For the last four decades, the state had a significantly slower population growth compared to national data and its share of the nation’s population declined from 3.5% in 1970 to 3.0% in 2000. Despite a slower growth, New Jersey remains the most densely populated state in the U. S. (1,120 people per square mile).
• From 1990 to 2000, eleven counties in New Jersey experienced higher than the statewide growth: Somerset (23.8%), Ocean (17.9%), Hunterdon (13.2%), Atlantic (12.6%), Warren (11.8%), Middlesex (11.7%), Morris (11.6%), Monmouth (11.2%), Gloucester, Hudson and Sussex (10.1%).
• The northeastern counties (Bergen, Essex, Hudson, Passaic, and Union) experienced population decline in the 1980s (-2%). However, this region’s total population increased 6.9% from 1990- 2000.
• Rural northwestern counties (Sussex & Warren) outpaced statewide growth (8.9%) while the coastal region (Atlantic, Cape May, Monmouth, and Ocean) remained the population magnet of New Jersey (12.6%).
• In the 1990s population growth in the southern counties (Burlington, Camden, Gloucester, and Salem) was moderate (5.0%).
1 The nation’s total population rose 13.2 percent in the 1990s to a total of 281,421,906 people and New Jersey ranked as 33rd in population growth nationally.
New Jersey Population, 1940-2000
0
1,000
2,000
3,000
4,000
5,000
6,000
7,000
8,000
9,000
1940 50 60 70 80 90 2000
Popu
latio
n in
Tho
usan
ds
2.7
2.8
2.9
3.0
3.1
3.2
3.3
3.4
3.5
3.6
Perc
ent o
f US
Pop
New Jersey Population
Share of Nation's Population
Density/Sq.Mi. (2000) 180 - 500 501 - 1,550 1,551 - 3,770 3,772 - 6,2206,2281 - 13,120
Population Density, New Jersey - 2000Overall Density = 1,122 People / Sq. Mi.Population Density, New Jersey - 2000Overall Density = 1,122 People / Sq. Mi.
8
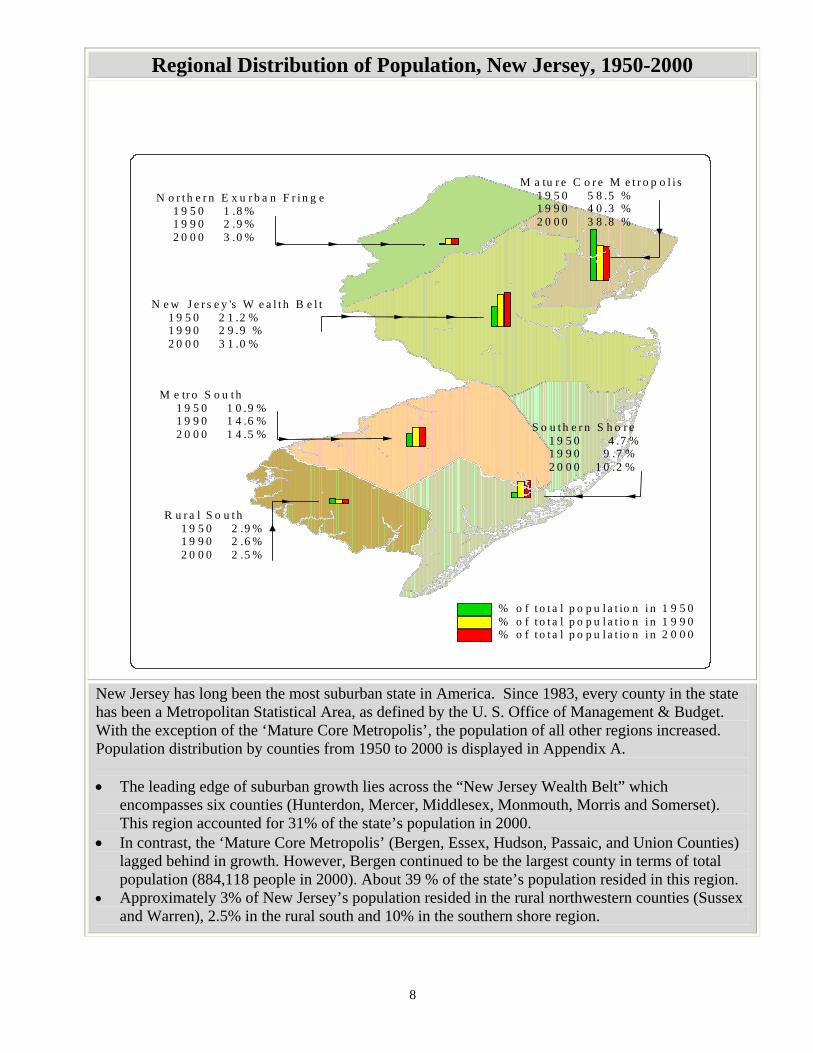
Regional Distribution of Population, New Jersey, 1950-2000
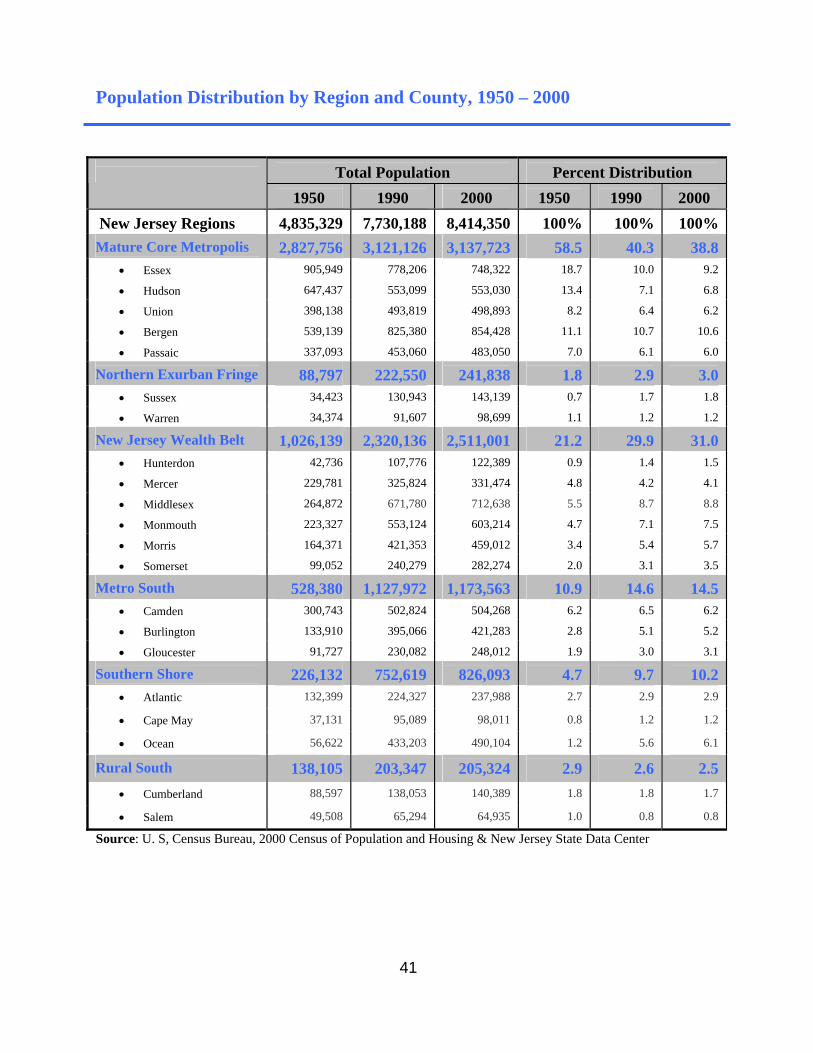
New Jersey has long been the most suburban state in America. Since 1983, every county in the state has been a Metropolitan Statistical Area, as defined by the U. S. Office of Management & Budget. With the exception of the ‘Mature Core Metropolis’, the population of all other regions increased. Population distribution by counties from 1950 to 2000 is displayed in Appendix A. • The leading edge of suburban growth lies across the “New Jersey Wealth Belt” which
encompasses six counties (Hunterdon, Mercer, Middlesex, Monmouth, Morris and Somerset). This region accounted for 31% of the state’s population in 2000.
• In contrast, the ‘Mature Core Metropolis’ (Bergen, Essex, Hudson, Passaic, and Union Counties) lagged behind in growth. However, Bergen continued to be the largest county in terms of total population (884,118 people in 2000). About 39 % of the state’s population resided in this region.
• Approximately 3% of New Jersey’s population resided in the rural northwestern counties (Sussex and Warren), 2.5% in the rural south and 10% in the southern shore region.
N e w J e r s e y 's W e a l t h B e l t 1 9 5 0 2 1 .2 % 1 9 9 0 2 9 .9 % 2 0 0 0 3 1 .0 %
M e tr o S o u t h 1 9 5 0 1 0 .9 % 1 9 9 0 1 4 .6 % 2 0 0 0 1 4 .5 %
R u r a l S o u t h 1 9 5 0 2 .9 % 1 9 9 0 2 .6 % 2 0 0 0 2 .5 %
N o r t h e r n E x u r b a n F r i n g e 1 9 5 0 1 .8 % 1 9 9 0 2 .9 % 2 0 0 0 3 .0 %
S o u t h e r n S h o r e 1 9 5 0 4 .7 % 1 9 9 0 9 .7 % 2 0 0 0 1 0 .2 %
M a tu r e C o r e M e t r o p o l i s 1 9 5 0 5 8 .5 % 1 9 9 0 4 0 .3 % 2 0 0 0 3 8 .8 %
% o f t o t a l p o p u l a t io n i n 1 9 5 0% o f t o t a l p o p u l a t io n i n 1 9 9 0% o f t o t a l p o p u l a t io n i n 2 0 0 0
9
Age Structure New Jersey
In general, differences in age distribution between groups reflect differences in death rates, fertility rates, and rates of net migration. It also contributes to differences in social, health, and economic status across population groups. Census 2000 shows the maturing of four major age-profile variations. Sequentially, they have assumed the widely used label of the depression era birth dearth, post-World War II baby boom, the baby bust, and the baby-boom echo. The dominant features in the Census 2000 landscape are: the 35-54 years old baby boom generation, the 5-19 years old baby-boom echo, and the 20-34 years old baby bust.
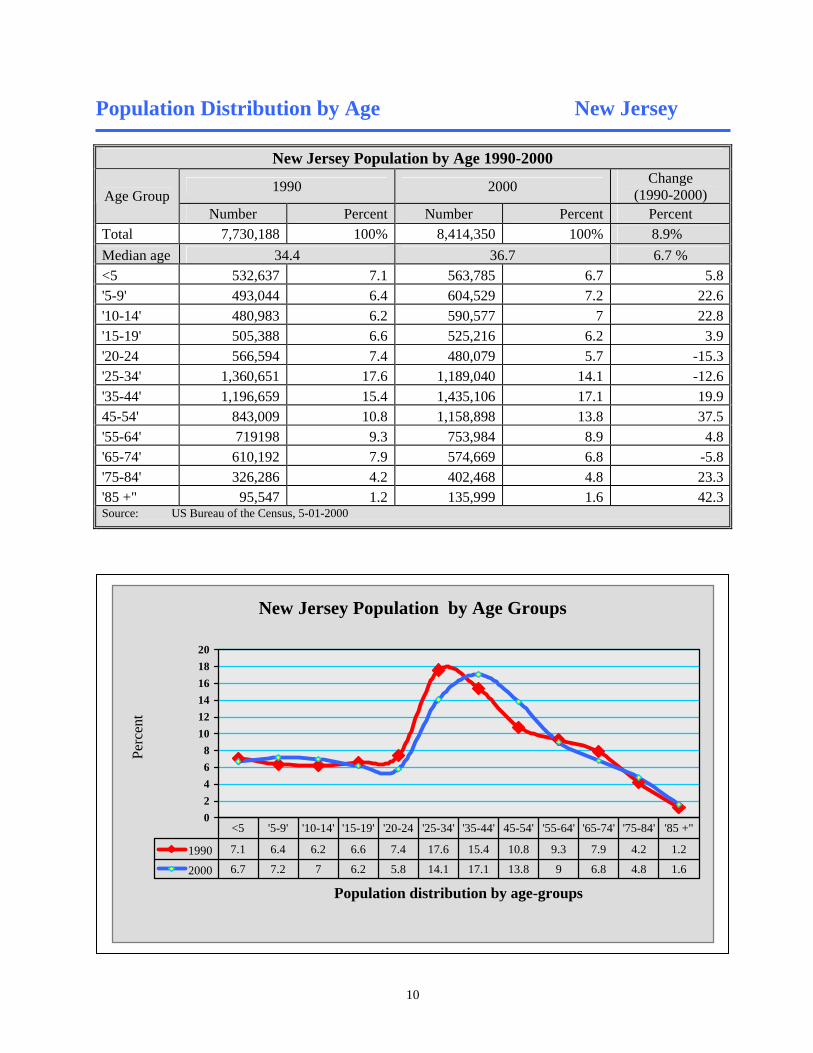
• The middle aging of the baby boom generation into the 35-54 years-old sector in 2000 created the largest age-group (30.8%) in New Jersey history. Almost one in three, or 2.6 million out of 8.4 million people, is a baby boomer. During the 1990’s the 35-44 years-old sector grew by 19.9%, while the 45-54 year-old age group grew by 28.6%. As the baby boom ages and passes through middle age, its sheer size creates pressure on New Jersey’s infrastructure and social services.
• The baby bust2 (20-34 years old) cohort matured fully in 2000. The baby bust generation accounts
for 19.9% of the population in 2000. This age group caused the 20-24 year-old population to shrink by 23% and the 25-34 year-old group by 20%. Since a large proportion of treatment populations fall in these age groups, the shrinking age groups suggest that there may be less demographic pressure for treatment services compared to the time when baby-boomers crossed these age group strata.
• The baby-boom echo3 is presently reflected in the sharp growth of the 5-19 year-old age group. The
5-9 year-old population grew by 12.5% while the 10-14 year old group grew by 13%. Thus, after a period of decline, the number of teenagers shows higher growth in 2000. These cohorts may challenge prevention services in the current decade as they enter adolescence.
• In 2000, the total number of the elderly population (65 years of age and over) grew at slower rate
than it had been in the past. The elderly accounts for 13.7% of the total population in 2000. Between 1990 and 2000, the 65-74 year old sector declined while those above 74 years old grew at a faster rate than any other age group.
• The size of the 55-64 years old age group declined from 9.3% in 1990 to 8.8% in 2000. • The median age of New Jersey’s population increased from 34.4 years in 1990 to 36.7 years in
2000. Among the counties in New Jersey, the median age is highest in Cape May (42.3 years) followed by Ocean County (41.0 years) and Hudson County is the youngest county (33.6 years).
2 The baby bust generation is an undersized population cohort produced during the low-birth era from 1965 to 1976. 3 The baby boom echo began to unfold in the 1970s, as the baby boomers began to pair, nest, reproduce and parent creating a second baby boom.
Population Distribution by Age New Jersey
New Jersey Population by Age 1990-2000
1990 2000 Change (1990-2000) Age Group
Number Percent Number Percent Percent Total 7,730,188 100% 8,414,350 100% 8.9% Median age 34.4 36.7 6.7 % <5 532,637 7.1 563,785 6.7 5.8'5-9' 493,044 6.4 604,529 7.2 22.6'10-14' 480,983 6.2 590,577 7 22.8'15-19' 505,388 6.6 525,216 6.2 3.9'20-24 566,594 7.4 480,079 5.7 -15.3'25-34' 1,360,651 17.6 1,189,040 14.1 -12.6'35-44' 1,196,659 15.4 1,435,106 17.1 19.945-54' 843,009 10.8 1,158,898 13.8 37.5'55-64' 719198 9.3 753,984 8.9 4.8'65-74' 610,192 7.9 574,669 6.8 -5.8'75-84' 326,286 4.2 402,468 4.8 23.3'85 +" 95,547 1.2 135,999 1.6 42.3Source: US Bureau of the Census, 5-01-2000
10
New Jersey Population by Age Groups
02468
101214161820
Population distribution by age-groups
Perc
ent
1990 7.1 6.4 6.2 6.6 7.4 17.6 15.4 10.8 9.3 7.9 4.2 1.2
2000 6.7 7.2 7 6.2 5.8 14.1 17.1 13.8 9 6.8 4.8 1.6
<5 '5-9' '10-14' '15-19' '20-24 '25-34' '35-44' 45-54' '55-64' '65-74' '75-84' '85 +"

11
3.3
4.9
4.0
7.1
8.6
7.1
3.0
3.9
4.7
3.8
1.2
0 1 2 3 4 5 6 7 8 9 10
3.42
5.12
4.09
4.20
7.03
8.42
6.67
4.26
3.02
1.83
0.46
0123456789
0-4
5-11
12-17
18-24
25-34
35-44
45-54
55-65
65-74
75-84
85 +MALE
FEMALE
Age
Population Distribution by Age and Gender, New Jersey
Population Distribution by Age and Gender, New Jersey 2000 Both Sexes Male Female
Age Population Counts % Total
Male
Percent of
Male
Percent of
Total
Total Female
Percent of
Female
Percent of Total
All ages 8,414,350 100.0 4,082,813 100.0 48.52 4,331,537 100.0 51.48
0-4 563,785 6.70 288,085 7.05 3.42 275,700 6.36 3.285-11 840,760 9.99 430,646 10.55 5.12 410,114 9.47 4.8712-17 669,476 7.96 344,237 8.43 4.09 325,239 7.51 3.8718-24 690,165 8.20 353,036 8.65 4.20 337,129 7.78 4.0125-34 1,189,040 14.13 591,904 14.5 7.03 597,136 13.79 7.1035-44 1,435,106 17.06 708,291 17.35 8.42 726,815 16.78 8.6445-54 1,158,898 13.77 561,202 13.75 6.67 597,696 13.80 7.1055-64 753,984 8.96 358,632 8.78 4.26 395,352 9.13 4.7065-74 574,669 6.83 254,197 6.23 3.02 320,472 7.40 3.8175-84 402,468 4.78 153,851 3.76 1.83 248,617 5.74 2.95>85 135,999 1.62 38,732 0.95 0.46 97,267 2.25 1.16Source: US Bureau of the Census, 5-01-2000

12
Population by Race and Hispanic Origin New Jersey The racial and ethnic changes resulting from the twentieth-century immigration pattern is firmly embedded in New Jersey’s new millennium population profile. According to Census 2000, the foreign born population is approximately 17%, which is far greater than the 1970s (10%) but still far below that of 1910 (25%). The new diversity of immigration observed during the last 35 years demonstrates that the dominance of European foreign born has been replaced by the foreign born from Latin America and Asia. As shown in the table below, this resulted in the explosive growth of Asians (77.3%) and Hispanics (55%), compared with 8.9% for the overall population. New Jersey’s white population growth lags significantly while the growth of African Americans increased by 10%. Asians are the fastest growing racial group in New Jersey. More than one in two (53.2%) of New Jersey’s Asians are concentrated in three counties: Middlesex (104,212), Bergen (94,324) and Hudson (56,924). Among Asians, Asian Indians was the fastest growing group during the 1990s. The number of Asian Indians more than doubled in the state as a whole (113%, from 79,440 to 169,180). Chinese are the second largest Asian group in New Jersey. Hispanics accounted for more than one-half (55%) of the state’s population growth in the past decade. More than one-third (34.8%) of the State’s Hispanic population resided in Hudson and Passaic counties. Newark City, Paterson, Jersey City, and Union City had the largest Hispanic populations in 2000. Change in New Jersey’s Population by Race & Hispanic Origin4: 1990-2000
1990 2000 Change 1990-2000 Race and Ethnic Origin Number % of
TotalNumber % of
Total Number %
Total 7,730,188 100.0 8,414,350 100.0 684,162 8.9One Race • White • Black or African American • American Indian & AN.* • Asian • Native Hawaiian & P.I.** • Other
7,730,188 6,130,465 1,036,825 14,970 270,839
1,682 275,407
100.0 79.3 13.4 0.2
3.5 0.0 3.6
8,200,595 6,104,705 1,141,821 19,492 480,276 3,329 450,972
97.5 72.6 13.6 0.2
5.7 0.0 5.4
470,407 -25,760 104,996
4,522 209,437
1,647 175,565
6.1-0.410.130.277.397.963.7
Two-or-more Races N.A N.A. 213,755 2.5 N.A N.A.Hispanic or Latino 739,861 9.6 1,117,191 13.3 377,330 55.0 * Alaska Native ** Pacific Islander
4 Categories defined by the Office of Management and Budget (OMB) in 1997.
13
Mortality Attributable to Drug and Alcohol Abuse, New Jersey
Introduction
This section presents mortality data attributable to alcohol and drug abuse in the state of New Jersey. Since the efficacy of public health policy is measured in terms of reductions in mortality, this data is most commonly used as indicator of the severity of health problems. Mortality data in the chartbook are based on information obtained from death certificates compiled by the Center for Health Statistics, New Jersey Department of Health. Causes-of-death statistics are classified in accordance with the Ninth and Tenth Revision, International Classification of Diseases (ICD-9 and ICD-10). Alcohol Associated Fraction (AAF) and Drug Associated Fraction (DAF) of deaths are applied to each of the ICD diagnostic codes related to alcohol and drug abuse and associated causality factors. A discussion of the cause-of-death classification attributable to alcohol and drugs is provided in Appendix B. Mortality rates attributable to alcohol and drugs for the adult population are presented using two types of ICD codes that specify a substantive association with substance abuse:
• ICD-9 & ICD-10 codes that are directly associated with alcohol and drug abuse, and • ICD9 & ICD-10 codes that are indirectly associated with alcohol and drug abuse
Core indicators regarding mortality data displayed in the main body of this document are listed in item one below. Mortality data attributable to alcohol and drugs for the adult population by counties is included in Appendix B. 1. Mortality data attributable to alcohol and drugs in New Jersey.
• Mortality rates attributable to alcohol and drug abuse, dependence and associate causality factors by county, gender and race.
• Mortality by ICD-10 diagnostic codes related to drug and alcohol dependence and associated causality factors.
2. Mortality data attributable to alcohol and drugs by County
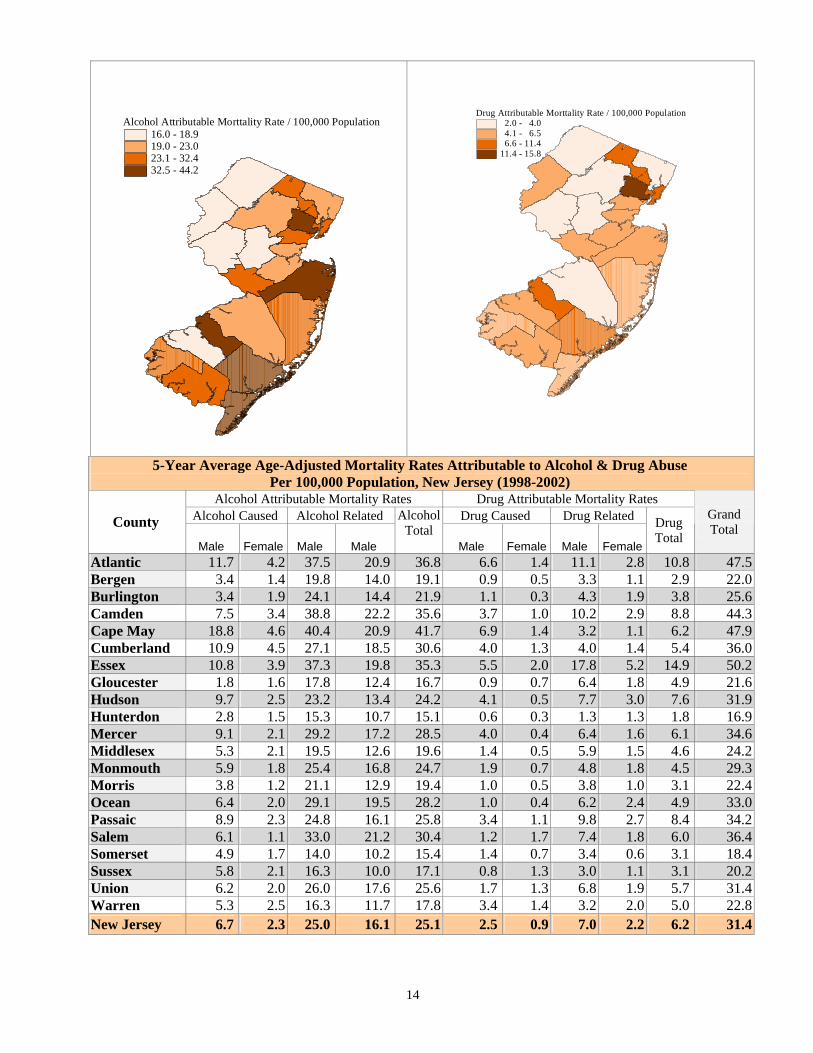
• Age-Adjusted Mortality Rate Attributable to Alcohol & Drug Abuse or Dependence/ 100,000 (5-Year Average, 1998-2002).
• The 2002 Mortality Rate Attributable to Alcohol & Drug Abuse or Dependence/100,000.
14
Alcohol Attributable Morttality Rate / 100,000 Population16.0 - 18.919.0 - 23.023.1 - 32.432.5 - 44.2
Drug Attributable Morttality Rate / 100,000 Population 2.0 - 4.0 4.1 - 6.5 6.6 - 11.411.4 - 15.8
5-Year Average Age-Adjusted Mortality Rates Attributable to Alcohol & Drug Abuse Per 100,000 Population, New Jersey (1998-2002)
Alcohol Attributable Mortality Rates Drug Attributable Mortality Rates Alcohol Caused Alcohol Related Drug Caused Drug Related County Male Female Male Male
AlcoholTotal
Male Female Male Female
Drug Total
Grand Total
Atlantic 11.7 4.2 37.5 20.9 36.8 6.6 1.4 11.1 2.8 10.8 47.5Bergen 3.4 1.4 19.8 14.0 19.1 0.9 0.5 3.3 1.1 2.9 22.0Burlington 3.4 1.9 24.1 14.4 21.9 1.1 0.3 4.3 1.9 3.8 25.6Camden 7.5 3.4 38.8 22.2 35.6 3.7 1.0 10.2 2.9 8.8 44.3Cape May 18.8 4.6 40.4 20.9 41.7 6.9 1.4 3.2 1.1 6.2 47.9Cumberland 10.9 4.5 27.1 18.5 30.6 4.0 1.3 4.0 1.4 5.4 36.0Essex 10.8 3.9 37.3 19.8 35.3 5.5 2.0 17.8 5.2 14.9 50.2Gloucester 1.8 1.6 17.8 12.4 16.7 0.9 0.7 6.4 1.8 4.9 21.6Hudson 9.7 2.5 23.2 13.4 24.2 4.1 0.5 7.7 3.0 7.6 31.9Hunterdon 2.8 1.5 15.3 10.7 15.1 0.6 0.3 1.3 1.3 1.8 16.9Mercer 9.1 2.1 29.2 17.2 28.5 4.0 0.4 6.4 1.6 6.1 34.6Middlesex 5.3 2.1 19.5 12.6 19.6 1.4 0.5 5.9 1.5 4.6 24.2Monmouth 5.9 1.8 25.4 16.8 24.7 1.9 0.7 4.8 1.8 4.5 29.3Morris 3.8 1.2 21.1 12.9 19.4 1.0 0.5 3.8 1.0 3.1 22.4Ocean 6.4 2.0 29.1 19.5 28.2 1.0 0.4 6.2 2.4 4.9 33.0Passaic 8.9 2.3 24.8 16.1 25.8 3.4 1.1 9.8 2.7 8.4 34.2Salem 6.1 1.1 33.0 21.2 30.4 1.2 1.7 7.4 1.8 6.0 36.4Somerset 4.9 1.7 14.0 10.2 15.4 1.4 0.7 3.4 0.6 3.1 18.4Sussex 5.8 2.1 16.3 10.0 17.1 0.8 1.3 3.0 1.1 3.1 20.2Union 6.2 2.0 26.0 17.6 25.6 1.7 1.3 6.8 1.9 5.7 31.4Warren 5.3 2.5 16.3 11.7 17.8 3.4 1.4 3.2 2.0 5.0 22.8New Jersey 6.7 2.3 25.0 16.1 25.1 2.5 0.9 7.0 2.2 6.2 31.4

Highlights
• The number of deaths in New Jersey attributable to alcohol and drugs during the 5-year
period between 1998 and 2002 was 13,985 persons. This amounts to an average of 2,744 deaths per year.
• The average age-adjusted death rates attributable to alcohol and drugs are 31.4 deaths per 100,000, of which, 6.2 deaths were due to drugs and 24.9 deaths were due to alcohol.
• Among New Jersey counties, the mortality rate due to drug use is highest in Essex County (15.8 per 100,000), followed by Atlantic County (11.5), Camden County (9.3) and Passaic County (8.9).
• The mortality rate attributable to alcohol is highest in Cape May County (44.2 per 100,000), followed by Atlantic County (38.9), Camden County (37.7) and Essex County (37.4).
• Among the direct causes of death that are attributable to drugs, drug dependency accounts for 52%, followed by drug psychoses (25%).
• Among direct causes of death due to alcohol, alcoholic cirrhosis of the liver ranks the highest (29%) followed by alcoholic dependence syndrome (17.2%), unspecified alcoholic liver damage (13.2 %) and accidental poisoning by alcohol (10%).
• Among the indirect causes of mortality due to alcohol, chronic pancreatitis contributed the most (21%), followed by malignant neoplasm of esophagus (11.4%), motor vehicle accidents (9.3%), cerebrovascular desease (8.7%) and cirrhosis of the liver (7.8%).
15
Mortality Rates per 100,000 population Attributable to Drugs and Alcohol New Jersey
5.6 7.4 6.1 6.2
15.7
29.829.3
27.9
0
1
2
3
4
5
6
7
8
Dru
g R
ates
0
5
10
15
20
25
30
35
Alc
ohol
Rat
es
Drugs Alcohol
Drugs 5.6 7.4 6.1 6.2
Alcohol 15.7 29.8 29.3 27.9
1999 2000 2001 2002

16
Mortality Counts Attributable to Alcohol and Drugs New Jersey, 2002 100 Percent Drug Caused Conditions Mortality ICD-9 Codes shown are equivalent to ICD-10 Codes ICD-9 Codes Male Female Total percent Drug psychoses 292 19.0 9.0 28.0 25.23 Drug dependence 304 49.0 9.0 58.0 52.25 Nondependent abuse of drugs 305.2-305.9 7.0 4.0 11.0 9.91 Poisoning by CNS stimulants 970 7.0 7.0 14.0 12.61
Total death due to drugs in 2002 82.0 29.0 111.0 100.0 100 Percent Alcohol Caused Conditions Alcohol Psychoses 291.0 17.0 7.0 24.0 7.95 Alcohol dependence syndrome 303.0 45.0 7.0 52.0 17.22 Nondependent abuse of alcohol 305.0 18.0 5.0 23.0 7.62 Alcoholic polyneuropathy 357.5 2.0 0.0 2.0 0.66 Alcoholic cardimoyopathy 425.5 19.0 3.0 22.0 7.28 Alcoholic gastritis 535.3 0.0 1.0 1.0 0.33 Alcoholic fatty liver 571.0 2.0 2.0 4.0 1.32 Acute alcoholic hepatitis 571.1 11.0 2.0 13.0 4.30 Alcoholic cirrhosis of the liver 571.2 68.0 20.0 88.0 29.14 Alcoholic liver damage, unspecified 571.3 21.0 19.0 40.0 13.25 Accidental poisoning by alcohol E860-E860.1 24.0 9.0 33.0 10.93
Sub-Total 227.0 75.0 302.0 100.0 Alcohol Related Conditions Respiratory tuberculosis 011-012 1.8 2.0 3.8 0.23 Malignant neoplasm of lip, oral cavity, & Pharyax 140-149 39.0 18.5 57.5 3.53 Malignant neoplasm of esophagus 150 133.5 51.8 185.3 11.36 Malignant neoplasm of stomach 151 43.2 34.6 77.8 4.77 Diabetes mellitus 250 31.1 34.9 66.0 4.05 Essential hypertension 401 12.2 20.2 32.4 1.98 Cerebrovascular disease 430-438 55.6 86.7 142.3 8.72 Pneumonia and influenza 480-487 21.4 29.0 50.4 3.08 Diseases of esophagus, stomach, and duodenum 530-537 2.2 4.3 6.5 0.40 Chronic hepatitis 571.4 8.0 7.5 15.5 0.95 Cirrhosis of liver without mention of Alcohol 571.5 74.5 54.0 128.5 7.88 Other chronic nonalcoholic liver damage 571.8 24.0 15.0 39.0 2.39 Unspecified chronic liver disease 571.9 1.0 1.0 2.0 0.12 Portal hypertension 752.3 0.5 1.5 2.0 0.12 Acute pancreatitis 577.0 5.9 8.0 13.9 0.85 Chronic pancreatitis 577.1 154.2 189.0 343.2 21.04
Sub-Total 608.1 558.0 1,166.1 Alcohol Related Incidents Motor vehicle traffic & nontrafic accidents E810-E825 109.2 42.8 152.0 9.32 Pedal cycle and other road vehicle accidents E826, E829 0.8 0.0 0.8 0.05 Water transport accidents E830-E838 1.2 0.4 1.6 0.10 Air & space transport accidents E840-E845 2.2 0.6 2.8 0.18 Accidental falls E880-E888 29.8 17.5 47.3 2.90 Accidents caused by fires and flames E890-E899 0.5 2.7 3.2 0.20 Accidental drowning and submersion E910 9.9 3.0 12.9 0.79 Suicide and self-inflicted injury E950-E959 90.2 21.8 112.0 6.87 Homicide & injury purposely inflicted by others E960-E969 81.0 43.7 124.7 7.64 Other injuries and adverse effects E917 - E920 5.5 2.5 8.0 0.49
Sub-Total 330.3 135.1 465.4 100.0 Total Counts Alcohol Attributable Deaths 1,165.1 767.9 1,933.0
Grand Total 1,247.1 796.9 2,044.0
17
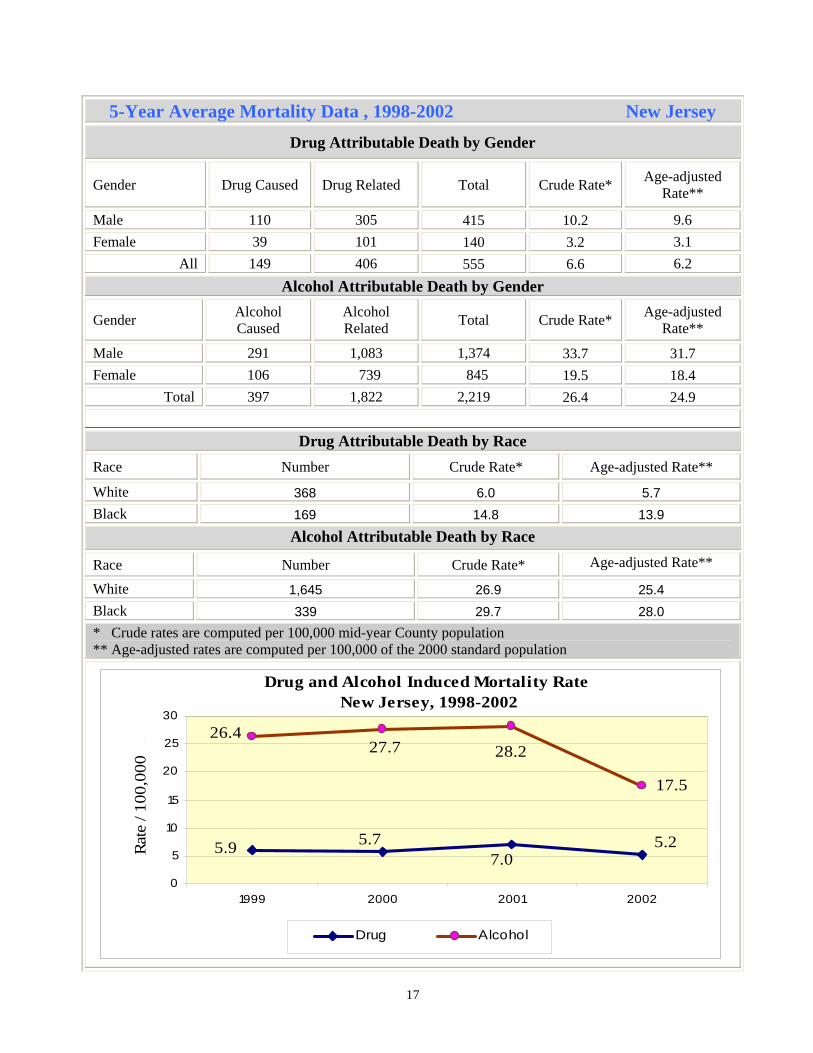
5-Year Average Mortality Data , 1998-2002 New Jersey
Drug Attributable Death by Gender
Gender Drug Caused Drug Related Total Crude Rate* Age-adjusted Rate**
Male 110 305 415 10.2 9.6 Female 39 101 140 3.2 3.1
All 149 406 555 6.6 6.2 Alcohol Attributable Death by Gender
Gender Alcohol Caused
Alcohol Related Total Crude Rate* Age-adjusted
Rate**
Male 291 1,083 1,374 33.7 31.7 Female 106 739 845 19.5 18.4
Total 397 1,822 2,219 26.4 24.9
Drug Attributable Death by Race
Race Number Crude Rate* Age-adjusted Rate**
White 368 6.0 5.7 Black 169 14.8 13.9
Alcohol Attributable Death by Race
Race Number Crude Rate* Age-adjusted Rate**
White 1,645 26.9 25.4 Black 339 29.7 28.0 * Crude rates are computed per 100,000 mid-year County population ** Age-adjusted rates are computed per 100,000 of the 2000 standard population
Drug and Alcohol Induced Mortality Rate New Jersey, 1998-2002
17.5
5.25.9 5.77.0
26.427.7 28.2
0
5
10
15
20
25
30
1999 2000 2001 2002
Rate
/ 10
0,00
0 .
Drug Alcohol

18
Criminal Justice Data: Alcohol and Drug Crime Indicators
Introduction
This section presents alcohol and drug related crime indicators drawn from the Uniform
Crime Report (UCR) for New Jersey. It should be noted that the UCR has limitations with respect to coverage and with respect to the accuracy in reflecting the amount of alcohol and drug involvement in reporting crimes. The types of crime included in the arrests data and the attribution “fractions” used in analyzing the data are listed in Appendix C. The “fractions” of arrests attributable to alcohol and drug are based on the literature search conducted by Harwood, et al. 1998.
Crime indicators displayed in the main body of this document are listed in item one below, and crime indicators displayed in item two are included in Appendix C. 1. Crime data attributable to alcohol and drugs, New Jersey, 1998-2003
• Number of alcohol related arrests and arrest rates by type of offense in New Jersey • Number of drug related arrests and arrest rates by type of offense in New Jersey
2. Yearly Average Drug Related arrests by county, 1998-2003
• Total alcohol related arrests by type of crime and by county • Total drug related arrests by type of crime and by county • Alcohol attributable rates/100,000 by crime type and by county • Alcohol drug rates/100,000 by crime type and by county

19
Alcohol Attributable Arrest Rates / 100,000 Population 406 - 532 533 - 772 773 - 12801281 - 2739
Drug Attributable Arrest Rates / 100,000 Population 369 - 612 613 - 988 989 - 1,3081,309 - 2,216
The two maps display adult arrest rates for 2003 Alcohol Related Arrests, 2003 Drug Related Arrests, 2003
Adults
Juvenile
Adults
Juvenile
County
Counts Rate Counts Rate
Total Rate per 100,000 Counts Rate Counts Rate
Total Rate per 100,000
Atlantic 2,529 1,280 277 421 1,065 2184 1,106 496 753 1,017Bergen 3,674 530 643 316 481 3356 484 660 324 447Burlington 2,293 680 410 383 608 2064 612 494 462 576Camden 3,921 1,032 471 351 855 4595 1,210 797 595 1,049Cape May 2,194 2,739 362 1,664 2,510 879 1,097 312 1,434 1,169Cumberland 1,305 1,167 157 419 979 1463 1,308 349 932 1,214Essex 2,566 438 362 172 368 12,982 2,216 1,203 571 1,781Gloucester 2,169 1,082 207 311 890 1671 834 312 469 743Hudson 1,900 406 340 243 369 5528 1,182 828 592 1,046Hunterdon 575 591 44 142 483 459 472 91 294 429Mercer 1,456 532 337 381 495 2040 746 568 642 720Middlesex 3,048 514 327 180 433 2785 469 520 277 423Monmouth 4,402 931 519 205 748 4351 920 738 462 805Morris 2,400 659 309 437 604 1561 428 324 273 390Ocean 3,058 724 423 250 617 2418 573 632 510 559Passaic 2,335 640 379 317 553 4,330 1,186 615 462 992Salem 504 1,026 53 2,407 1,362 435 886 77 489 789Somerset 1,198 516 141 67 401 951 410 229 288 379Sussex 864 772 82 360 665 413 369 121 309 353Union 1,830 462 256 61 361 3913 988 618 463 856Warren 566 689 56 945 753 442 538 101 373 497New Jersey 44,787 687 6,155 290 593 58,820 903 10,085 475 798
Highlights
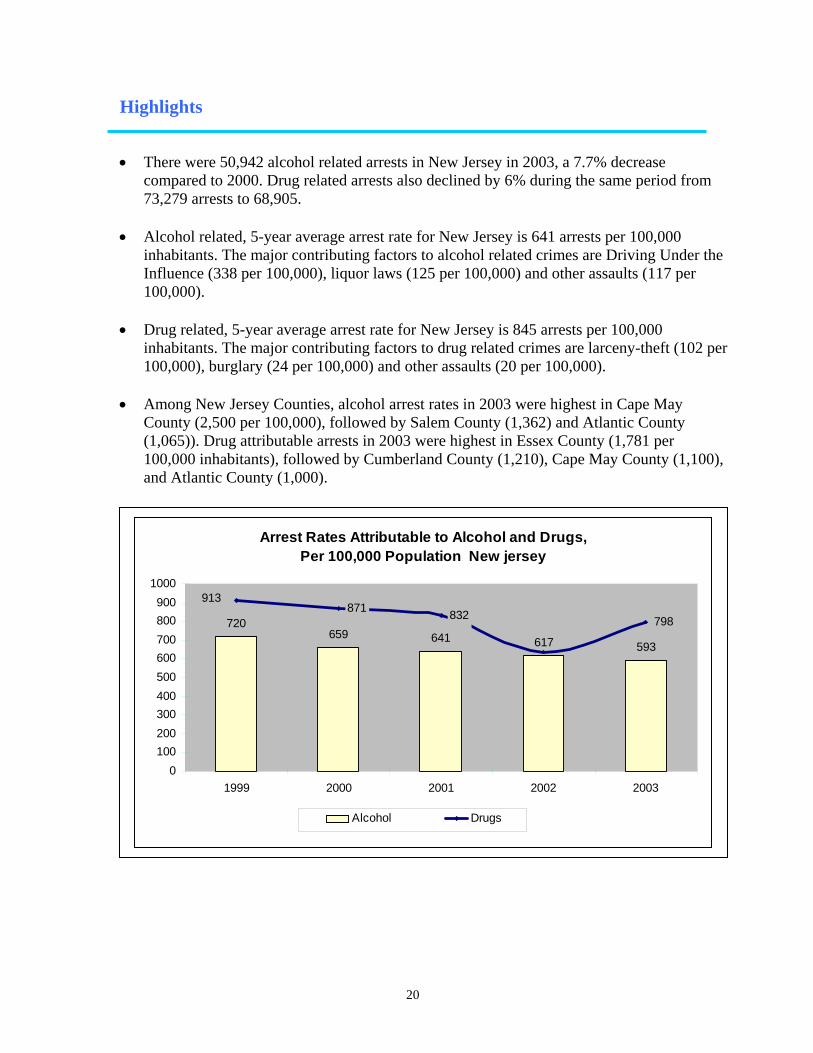
• There were 50,942 alcohol related arrests in New Jersey in 2003, a 7.7% decrease
compared to 2000. Drug related arrests also declined by 6% during the same period from 73,279 arrests to 68,905.
• Alcohol related, 5-year average arrest rate for New Jersey is 641 arrests per 100,000
inhabitants. The major contributing factors to alcohol related crimes are Driving Under the Influence (338 per 100,000), liquor laws (125 per 100,000) and other assaults (117 per 100,000).
• Drug related, 5-year average arrest rate for New Jersey is 845 arrests per 100,000
inhabitants. The major contributing factors to drug related crimes are larceny-theft (102 per 100,000), burglary (24 per 100,000) and other assaults (20 per 100,000).
• Among New Jersey Counties, alcohol arrest rates in 2003 were highest in Cape May
County (2,500 per 100,000), followed by Salem County (1,362) and Atlantic County (1,065)). Drug attributable arrests in 2003 were highest in Essex County (1,781 per 100,000 inhabitants), followed by Cumberland County (1,210), Cape May County (1,100), and Atlantic County (1,000).
20
Arrest Rates Attributable to Alcohol and Drugs,Per 100,000 Population New jersey
720659 641 617 593
871 832 798
913
0100200300400500600700800900
1000
1999 2000 2001 2002 2003
Alcohol Drugs

21
New Jersey Alcohol Related Crime
Alcohol Attributable Arrests, 1999-2003 (5-Year Average) Annual Arrests Attributable to Alcohol Use* Type of
Offenses Annual
Arrests in New Jersey
Adults Juvenile All Ages Arrest Rates / 100,000
Homicide 268 74 6 80 0.9 Aggravated Assault 10,712 2,595 619 6,214 37.8 Sexual Assault 611 115 22 137 1.6 Other Assault 33,102 8,050 1,881 9,931 116.8 Robbery 4,176 99 43 142 1.7 Burglary 6,710 171 71 242 2.8 Larceny 29,415 608 216 824 9.7 Auto Theft 1,453 330 179 509 6.0 DUI 28,703 28,345 358 28,703 337.8 Liquor Laws 10,697 7.527 3,170 10,697 125.8
Total 125,847 47,915 6,562 54,477 641 * “Alcohol Abuse Attribution Factor” used in this study is adapted from H. Harwood (Harwood et al. 1998)
Alcohol Attributable Arrest by Age 18 Years & Over 0-17 Years All Ages
Number Rate** Number Rate* * Number Rate** New Jersey 47,916 748 6,561 312 54,477 641 ** Arrest rates are computed per 100,000 population
Alcohol Related Arrest Rates, Monmouth County
748
767
833801
748
700720740760780800820840
1999 2000 2001 2002 2003
Rat
es /
100,
000
.
22
New Jersey Drug Related Crime
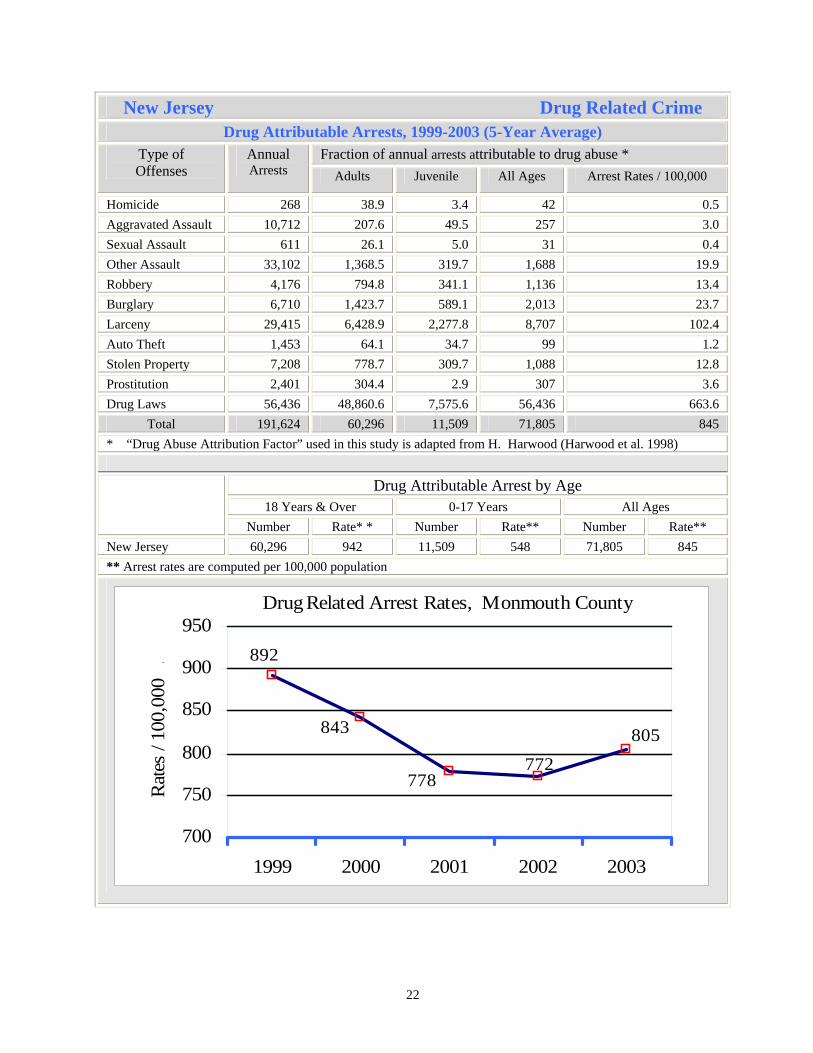
Drug Attributable Arrests, 1999-2003 (5-Year Average) Fraction of annual arrests attributable to drug abuse * Type of
Offenses Annual Arrests Adults Juvenile All Ages Arrest Rates / 100,000
Homicide 268 38.9 3.4 42 0.5 Aggravated Assault 10,712 207.6 49.5 257 3.0 Sexual Assault 611 26.1 5.0 31 0.4 Other Assault 33,102 1,368.5 319.7 1,688 19.9 Robbery 4,176 794.8 341.1 1,136 13.4 Burglary 6,710 1,423.7 589.1 2,013 23.7 Larceny 29,415 6,428.9 2,277.8 8,707 102.4 Auto Theft 1,453 64.1 34.7 99 1.2 Stolen Property 7,208 778.7 309.7 1,088 12.8 Prostitution 2,401 304.4 2.9 307 3.6 Drug Laws 56,436 48,860.6 7,575.6 56,436 663.6
Total 191,624 60,296 11,509 71,805 845 * “Drug Abuse Attribution Factor” used in this study is adapted from H. Harwood (Harwood et al. 1998)
Drug Attributable Arrest by Age 18 Years & Over 0-17 Years All Ages
Number Rate* * Number Rate** Number Rate** New Jersey 60,296 942 11,509 548 71,805 845 ** Arrest rates are computed per 100,000 population
Drug Related Arrest Rates, Monmouth County
805772
892
843
778
700
750
800
850
900
950
1999 2000 2001 2002 2003
Rat
es /
100,
000
.
23
Substance Abuse Treatment Admissions Data
Introduction
Substance abuse treatment admission indicators presented in this section are based on data
from New Jersey Substance Abuse Monitoring System (NJSAMS) and Alcohol & Drug Abuse Data System (ADADS)5 maintained by Division of Addictions, New Jersey Department of Human Services. Profiles of clients served are presented by primary and secondary substance of abuse, by modality, and by demographics. Unduplicated counts of treatment admissions data are used to show patterns and amounts of services provided annually across the 21 New Jersey counties.
Treatment indicators displayed in the main body of this document are listed in item one as shown below, and indicators displayed in item two are included in Appendix D. 1. Treatment Admissions According to Sex, Age and Ethnicity
• Treatment admissions by primary and secondary substance of abuse in New Jersey • Residential treatment admissions by modality of care in New Jersey • Outpatient treatment admissions by modality of care in New Jersey • County share of admissions by primary drug
1. Treatment Admissions According to Sex, Age and Ethnicity
• Treatment admissions by primary and secondary substance of abuse in New Jersey • Residential treatment admissions by modality of care in New Jersey • Outpatient treatment admissions by modality of care in New Jersey • County share of admissions by primary drug
5 ADADS (Alcohol and Drug Abuse Data System) was the surveillance system maintained by the Division of Addictions in New Jersey (before 2003) to monitor treatment activities for substance abuse and dependence in the state. It was replaced by NJSAMS, a web-based data reporting system for substance abuse providers.

24
Substance Abuse Treatment Admissions by Substance of Abuse
According to Sex, Age Group, Race and Ethnicity, New Jersey 2004 New Jersey
Primary Substance of Abuse Total Alcohol Heroin Cocaine/Crack Marijuana Other Drugs
No 50,825 12,086 21,928 5,656 6,261 4,894 % 100.0 23.8 43.1 11.1 12.3 9.6
Gender Male % 69.3 74.5 65.4 61.6 82.1 65.5 Female % 30.7 25.5 34.6 38.4 17.9 34.5
Total % 100.0 100.0 100.0 100.0 100.0 100.0
Age at Admission 12-17 % 5.0 2.4 0.5 1.5 29.3 3.7 18-24 % 17.6 11.0 16.3 11.9 38.9 18.7 25-44 % 58.1 53.8 65.7 70.2 29.0 57.7 45-64 % 18.9 31.3 17.4 16.2 2.7 18.9 65 & over % 0.4 1.5 0.1 0.2 0.1 0.2
Total % 100.0 100.0 100.0 100.0 100.0 100.0 Race & Ethnicity White alone % 54.4 68.9 48.3 45.7 43.2 70.4 Black alone % 29.1 15.8 33.5 40.6 36.5 16.9 Asian % 0.5 1.0 0.3 0.3 0.8 0.5 American Indian % 0.5 0.5 0.5 0.3 0.6 0.5 Hispanic % 15.1 12.7 17.4 13.1 18.9 8.6 Other % 0.4 0.2 0.1 0.1 0.1 3.1
Total % 100.0 100.0 100.0 100.0 100.0 100.0
Secondary Substance of Abuse Total Alcohol Heroin Cocaine/Crack Marijuana Other Drugs
No 26,394 5,233 2,221 11,618 5,232 2,090 % 100.0 19.8 8.4 44.0 19.8 7.9
Gender Male % 67.9 75.1 63.5 62.4 76.4 64.1 Female % 32.1 24.9 36.5 37.6 23.6 36.0
Total % 100.0 100.0 100.0 100.0 100.0 100.0 Age at Admission 12-17 % 5.6 15.6 1.8 1.3 7.0 5.7 18-24 % 20.1 22.6 17.3 14.5 29.6 23.8 25-44 % 59.6 49.3 61.4 68.4 52.6 51.5 45-64 % 14.6 12.4 19.3 15.7 10.7 18.5 65 & over % 0.1 0.1 0.2 0.1 0.1 0.5
Total % 100.0 100.0 100.0 100.0 100.0 100.0 Race & Ethnicity White alone % 53.4 44.3 71.0 46.2 62.5 75.0 Black alone % 31.9 39.8 20.0 38.4 22.2 13.5 Asian % 0.4 0.5 0.2 0.3 0.6 0.5 American Indian % 0.4 0.4 0.2 0.4 0.3 0.5 Hispanic % 13.9 15.0 8.6 14.7 14.4 10.5
Total % 100.0 100.0 100.0 100.0 100.0 100.0
25
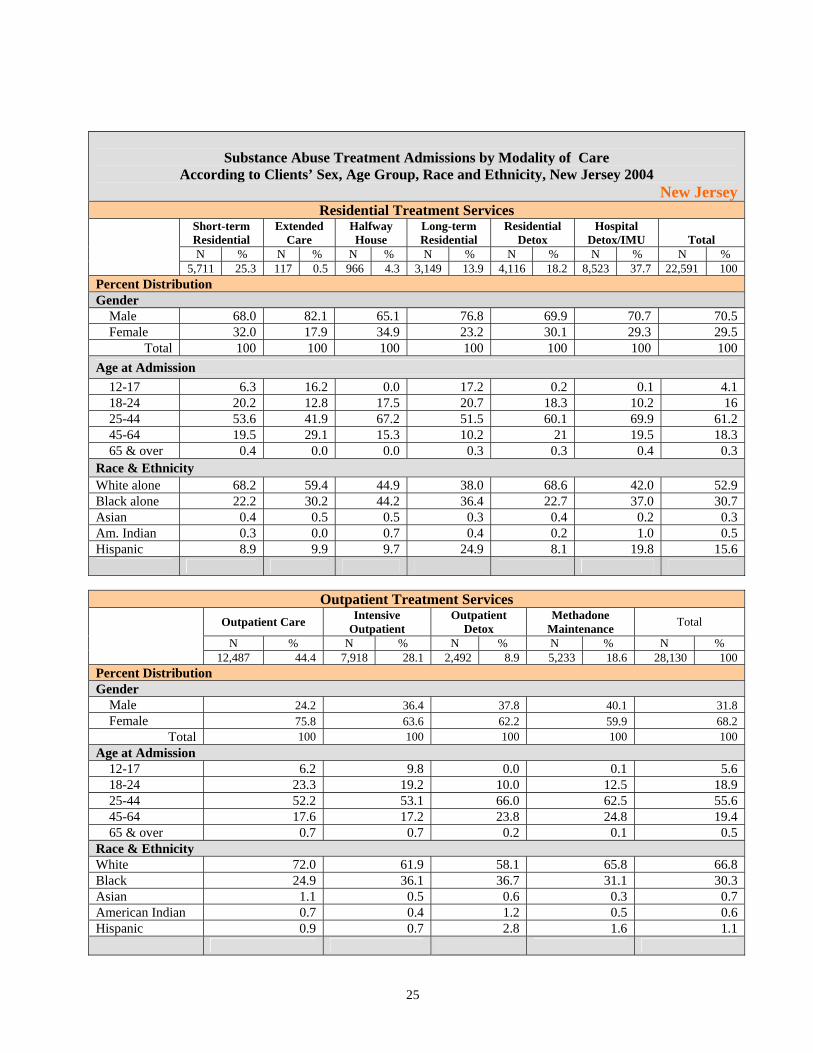
Substance Abuse Treatment Admissions by Modality of Care
According to Clients’ Sex, Age Group, Race and Ethnicity, New Jersey 2004 New Jersey
Residential Treatment Services Short-term Residential
Extended Care
Halfway House
Long-term Residential
Residential Detox
Hospital Detox/IMU
Total
N % N % N % N % N % N % N % 5,711 25.3 117 0.5 966 4.3 3,149 13.9 4,116 18.2 8,523 37.7 22,591 100
Percent Distribution Gender Male 68.0 82.1 65.1 76.8 69.9 70.7 70.5 Female 32.0 17.9 34.9 23.2 30.1 29.3 29.5
Total 100 100 100 100 100 100 100 Age at Admission 12-17 6.3 16.2 0.0 17.2 0.2 0.1 4.1 18-24 20.2 12.8 17.5 20.7 18.3 10.2 16 25-44 53.6 41.9 67.2 51.5 60.1 69.9 61.2 45-64 19.5 29.1 15.3 10.2 21 19.5 18.3 65 & over 0.4 0.0 0.0 0.3 0.3 0.4 0.3 Race & Ethnicity White alone 68.2 59.4 44.9 38.0 68.6 42.0 52.9 Black alone 22.2 30.2 44.2 36.4 22.7 37.0 30.7 Asian 0.4 0.5 0.5 0.3 0.4 0.2 0.3 Am. Indian 0.3 0.0 0.7 0.4 0.2 1.0 0.5 Hispanic 8.9 9.9 9.7 24.9 8.1 19.8 15.6
Outpatient Treatment Services Outpatient Care Intensive
Outpatient Outpatient
Detox Methadone
Maintenance Total
N % N % N % N % N % 12,487 44.4 7,918 28.1 2,492 8.9 5,233 18.6 28,130 100
Percent Distribution Gender Male 24.2 36.4 37.8 40.1 31.8 Female 75.8 63.6 62.2 59.9 68.2
Total 100 100 100 100 100 Age at Admission 12-17 6.2 9.8 0.0 0.1 5.6 18-24 23.3 19.2 10.0 12.5 18.9 25-44 52.2 53.1 66.0 62.5 55.6 45-64 17.6 17.2 23.8 24.8 19.4 65 & over 0.7 0.7 0.2 0.1 0.5 Race & Ethnicity White 72.0 61.9 58.1 65.8 66.8 Black 24.9 36.1 36.7 31.1 30.3 Asian 1.1 0.5 0.6 0.3 0.7 American Indian 0.7 0.4 1.2 0.5 0.6 Hispanic 0.9 0.7 2.8 1.6 1.1
26
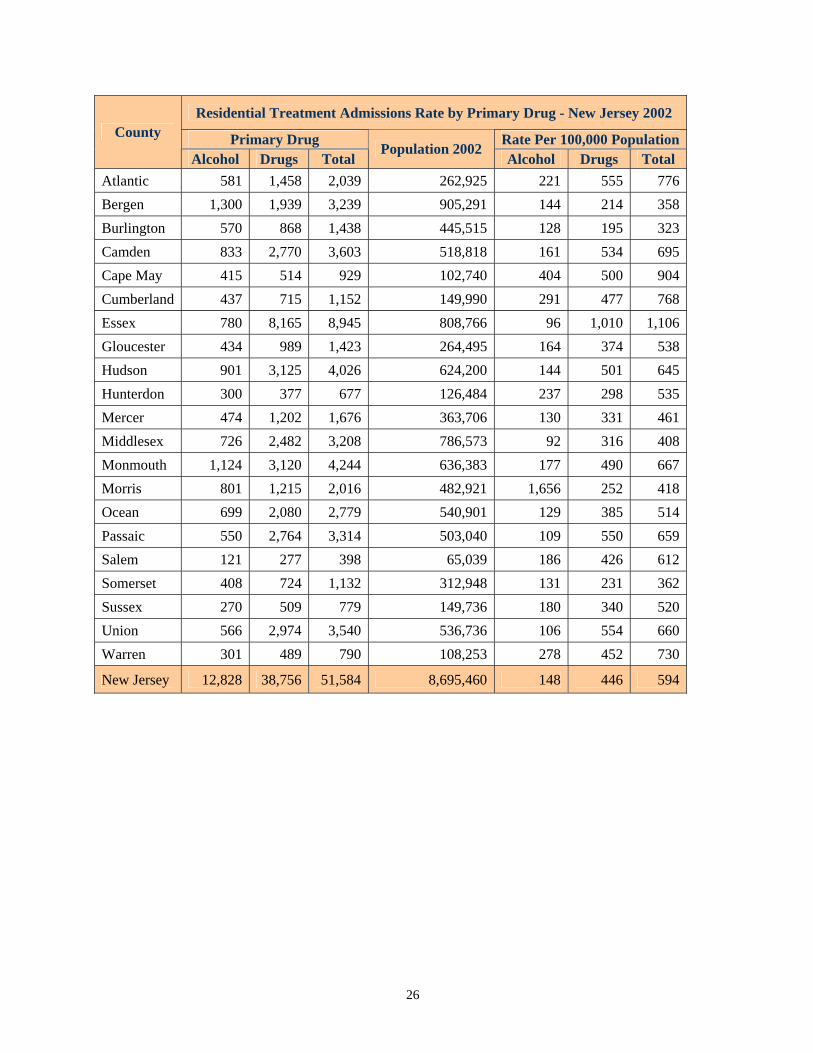
Residential Treatment Admissions Rate by Primary Drug - New Jersey 2002
Primary Drug Rate Per 100,000 PopulationCounty
Alcohol Drugs Total Population 2002
Alcohol Drugs Total Atlantic 581 1,458 2,039 262,925 221 555 776Bergen 1,300 1,939 3,239 905,291 144 214 358Burlington 570 868 1,438 445,515 128 195 323Camden 833 2,770 3,603 518,818 161 534 695Cape May 415 514 929 102,740 404 500 904Cumberland 437 715 1,152 149,990 291 477 768Essex 780 8,165 8,945 808,766 96 1,010 1,106Gloucester 434 989 1,423 264,495 164 374 538Hudson 901 3,125 4,026 624,200 144 501 645Hunterdon 300 377 677 126,484 237 298 535Mercer 474 1,202 1,676 363,706 130 331 461Middlesex 726 2,482 3,208 786,573 92 316 408Monmouth 1,124 3,120 4,244 636,383 177 490 667Morris 801 1,215 2,016 482,921 1,656 252 418Ocean 699 2,080 2,779 540,901 129 385 514Passaic 550 2,764 3,314 503,040 109 550 659Salem 121 277 398 65,039 186 426 612Somerset 408 724 1,132 312,948 131 231 362Sussex 270 509 779 149,736 180 340 520Union 566 2,974 3,540 536,736 106 554 660Warren 301 489 790 108,253 278 452 730
New Jersey 12,828 38,756 51,584 8,695,460 148 446 594
27
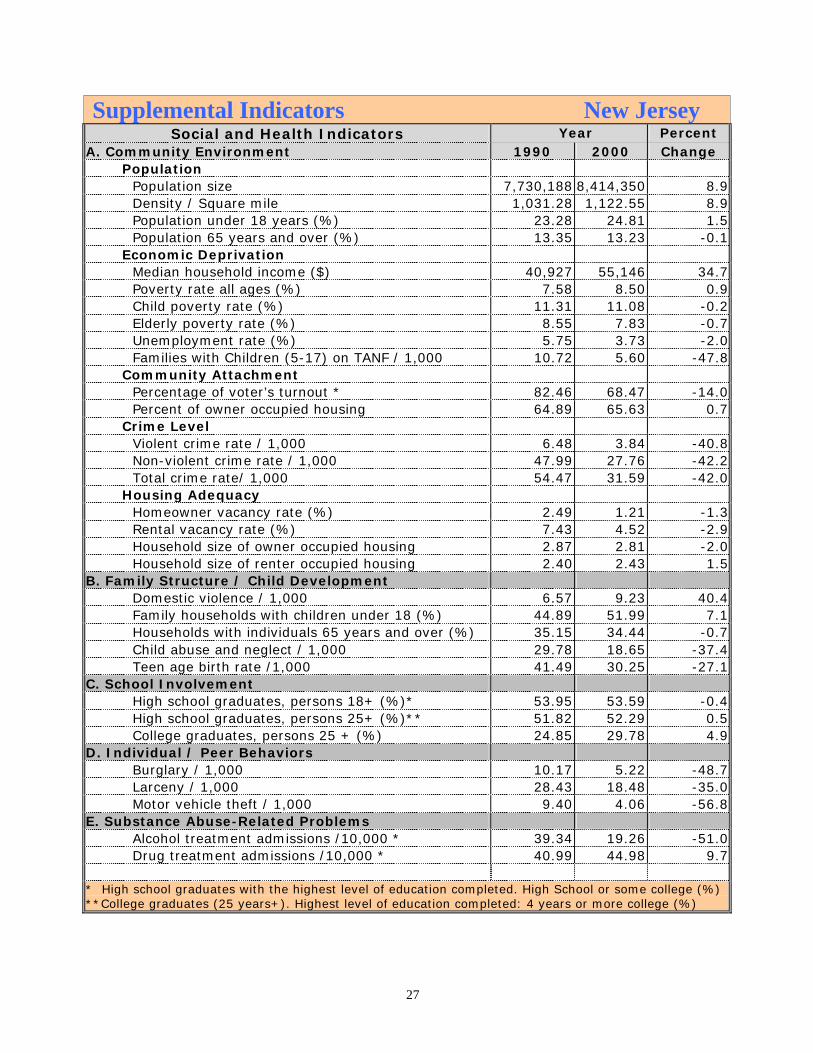
Supplemental Indicators New Jersey Social and Health Indicators Year Percent
A. Community Environment 1990 2000 Change Population Population size 7,730,188 8,414,350 8.9 Density / Square mile 1,031.28 1,122.55 8.9 Population under 18 years (%) 23.28 24.81 1.5 Population 65 years and over (%) 13.35 13.23 -0.1 Economic Deprivation Median household income ($) 40,927 55,146 34.7 Poverty rate all ages (%) 7.58 8.50 0.9 Child poverty rate (%) 11.31 11.08 -0.2 Elderly poverty rate (%) 8.55 7.83 -0.7 Unemployment rate (%) 5.75 3.73 -2.0 Families with Children (5-17) on TANF / 1,000 10.72 5.60 -47.8 Community Attachment Percentage of voter’s turnout * 82.46 68.47 -14.0 Percent of owner occupied housing 64.89 65.63 0.7 Crime Level Violent crime rate / 1,000 6.48 3.84 -40.8 Non-violent crime rate / 1,000 47.99 27.76 -42.2 Total crime rate/ 1,000 54.47 31.59 -42.0 Housing Adequacy Homeowner vacancy rate (%) 2.49 1.21 -1.3 Rental vacancy rate (%) 7.43 4.52 -2.9 Household size of owner occupied housing 2.87 2.81 -2.0 Household size of renter occupied housing 2.40 2.43 1.5B. Family Structure / Child Development Domestic violence / 1,000 6.57 9.23 40.4 Family households with children under 18 (%) 44.89 51.99 7.1 Households with individuals 65 years and over (%) 35.15 34.44 -0.7 Child abuse and neglect / 1,000 29.78 18.65 -37.4 Teen age birth rate /1,000 41.49 30.25 -27.1C. School Involvement High school graduates, persons 18+ (%)* 53.95 53.59 -0.4 High school graduates, persons 25+ (%)** 51.82 52.29 0.5 College graduates, persons 25 + (%) 24.85 29.78 4.9D. Individual / Peer Behaviors Burglary / 1,000 10.17 5.22 -48.7 Larceny / 1,000 28.43 18.48 -35.0 Motor vehicle theft / 1,000 9.40 4.06 -56.8E. Substance Abuse-Related Problems Alcohol treatment admissions /10,000 * 39.34 19.26 -51.0 Drug treatment admissions /10,000 * 40.99 44.98 9.7
* High school graduates with the highest level of education completed. High School or some college (%) **College graduates (25 years+). Highest level of education completed: 4 years or more college (%)

28
New Jersey Population Median Household Income ($) Unemployment Rate (%) Total Crime Rate / 1,000 Pop.
8,414,350 55,146
3.75 31.59
Married couple family (%) Teenage Births / 1,000 births (%) Female householder, no husband present (%) Grandparents responsible for grandchildren (%)
53.5 4.0
12.6 31.6
New Jersey Population by Age, 2000
16.9
8.2 7.713.4 13.3
40.6
0
10
20
30
40
50
< 12 12-17 18-24 25-34 35-64 >=65
Age in Years
Perc
ent
Drug Treatment Data, New Jersey 2001
16.1
11.9
10.1
10.7
3.5
47.6
0 10 20 30 40 50
Alchohol
Heroin
Crack & Cocaine
Alcohol w ith drug
Marijuana
Other Drugs
Percent
Crime Rates, 2000
3.3
9.6
26.4
0.0 5.0 10.0 15.0 20.0 25.0 30.0
Violent Crime
Non ViolentCrime
DomesticViolence
Per 1,000 Population
Drug & DUI Arrests, New Jersey - 20005.0
1.90.1 0.2
3.3
0.01.02.03.04.05.06.0
Marijuana Opium & Cocaine
SyntheticDrugs
Other Drugs
DUI
Per 1
,000
Pop
ulat
ion
Selected Demographic Characteristics, 2000
Race/Ethnicity Population Distribution (%)
Poverty Rate (%)
White alone Black alone Native American alone Asian alone Pacific Islanders alone Other alone 2+ Races
72.6 13.6 0.2 5.7 0.0 5.4 2.5
5.3 10.5 7.0 6.5 2.9
10.9 -
Total 100.0 8.5
Hispanic 13.3 11.1
Distribution of Mothers by Prenatal Care, 2000
1.0%
8.0%
11.1%
79.8%
First Trimester Second TrimesterThird Trimester No care / No Statistics

29
Chapter Two
County Profile of Social and Health Indicators
Introduction The County Profile of Social and Health Indicators is derived from archival sources
published by the U.S. Bureau of the Census and New Jersey governmental agencies, including the Departments of Human Services, Health & Senior Services, Education, and Law and Public Safety. Data are also obtained from DAS’ Alcohol & Drug Abuse Data System and from DAS-sponsored needs assessment surveys. The presentation of information is organized according to the four major categories of social indicators specified in the core protocol. A table of supplemental indicators is included at the end of the core indicators data. Maps and tables display current demographic profiles, mortality indicators that are related to drug and alcohol abuse causality factors, criminal justice data specific to alcohol related arrests and drug related arrests, and substance abuse treatment indicators. Population: • Population size, growth, and crime rate by municipalities • County demographic characteristics (age, race, density and poverty level) Mortality Data: • Drug attributable death by gender and race • Alcohol attributable death by gender and race
Criminal Justice Data: • Alcohol related crime by age and by type of offences • Drug related crime by age and by type of offences Substance Abuse Treatment Admissions Data: • Substance abuse treatment admissions by primary substance of abuse • Substance abuse treatment admissions by secondary substance of abuse • Substance abuse treatment admissions by modality of care • Substance abuse treatment admissions by demographics Supplemental Indicators Table

30
Monmouth County General Profile Population, 2000
• Population Size 625,301.0 • Density 472.0 • Median age: 37.7 • 18 years old and over :(%) 73.9 • 65 years old and over :(%) 12.5
Mortality Rates/100,000 Attributable To:
• Alcohol 26.2 • Drug 4.8
Arrest Rates/100,000 Attributable To: • Alcohol 785.0 • Drug 817.0
Treatment Admissions Rate Per 10,000 Crime Rate Per 1,000
No. Municipality Population Median
Household Income ($) Alcohol Drug Violent Crime Total Crime
1 Aberdeen Township 17,454 68,125 23.58 47.74 2.1 24.1 2 Allenhurst Borough 718 85,000 55.33 152.14 0.0 46.0 3 Allentown Borough 1,882 71,193 69.08 95.64 0.0 22.3 4 Asbury Park City 16,930 23,081 109.86 288.84 19.9 72.3 5 Atlantic Highlands Borough 4,705 64,955 72.26 165.78 2.1 16.1 6 Avon-By-The-Sea Borough 2,244 60,192 58.11 40.23 3.6 26.8 7 Belmar Borough 6,045 44,896 52.94 90.98 3.5 55.1 8 Bradley Beach Borough 4,793 40,878 68.85 100.15 1.5 40.1 9 Brielle Borough 4,893 68,368 28.61 20.44 0.8 13.9
10 Colts Neck Township 12,331 109,190 9.73 18.65 1.3 9.7 11 Deal Borough 1,070 58,472 46.73 37.38 0.9 42.0 12 Eatontown Borough 14,008 53,833 27.86 50.72 1.4 41.7 13 Englishtown Borough 1,764 57,557 90.70 124.72 3.4 10.8 14 Fair Haven Borough 5,937 97,220 13.47 6.74 0.5 8.1 15 Farmingdale Borough 1,587 48,889 113.42 75.61 0.0 15.8 16 Freehold Borough 10,976 48,654 44.64 71.06 5.2 35.3 17 Freehold Township 31,537 77,185 16.81 23.15 0.7 31.3 18 Hazlet Township 21,378 65,697 14.50 30.41 0.7 16.1 19 Highlands Borough 5,097 45,692 66.71 84.36 1.6 17.1 20 Holmdel Township 15,781 112,879 15.84 12.67 0.8 14.7 21 Howell Township 48,903 68,069 15.13 23.11 1.2 13.0 22 Interlaken Borough 900 82,842 44.44 111.11 0.0 18.9 23 Keansburg Borough 10,732 36,383 62.43 87.59 2.6 27.7 24 Keyport Borough 7,568 43,869 38.32 75.32 1.2 19.8 25 Little Silver Borough 6,170 94,094 21.07 27.55 1.1 13.6 26 Loch Arbour Village 280 68,542 145.45 254.55 0.0 28.6
21
51
17
32
33
1028
52
30
20
49
23
37
1
35
5
12
18
27
41
9
38
53
4
25
31
44
16
7
40
50
3914
24
48 47
11
29
38
43
34
366
19
42
2
13
15
22
46
45
26
Density (Sq. Mi.) 83 - 16671668 - 41984199 - 12288

31
Monmouth County Continued
Treatment Admissions Rate Per 10,000
Crime Rate Per 1,000 No.
Municipality
Population
Median Household Income ($)
Alcohol Drug Violent Crime Total Crime
27 Long Branch City 31,340 38,651 21.38 78.81 4.8 35.0
28 Manalapan Township 33,423 83,575 9.87 12.87 0.7 10.7
29 Manasquan Borough 6,310 63,079 49.13 64.98 2.2 31.2
30 Marlboro Township 36,398 101,322 8.79 16.76 0.9 11.6
31 Matawan Borough 8,910 63,594 25.62 69.07 1.2 16.7
32 Middletown Township 66,327 75,566 17.64 26.23 0.9 12.0
33 Millstone Township 8,970 94,561 20.07 31.22 0.3 9.4
34 Monmouth Beach Borough 3,595 80,484 19.47 63.98 0.3 8.6
35 Neptune City Borough 5,218 43,451 47.31 95.70 3.1 38.1
36 Neptune Township 27,690 46,250 63.24 153.32 2.1 41.5
37 Ocean Township 26,959 62,058 15.95 28.56 1.3 23.3
38 Oceanport Borough 5,807 71,458 29.23 20.64 0.5 10.0
39 Red Bank Borough 11,844 47,282 59.95 80.21 2.2 29.3
40 Roosevelt Borough 933 61,979 21.55 53.88 1.1 11.8
41 Rumson Borough 7,137 120,865 15.41 14.01 0.7 10.4
42 Sea Bright Borough 1,818 65,563 38.36 54.79 2.2 30.8
43 Sea Girt Borough 2,148 86,104 27.93 23.28 1.4 7.0
44 Shrewsbury Borough 3,590 86,911 8.36 13.93 1.1 34.0
45 Shrewsbury Township 1,098 36,875 27.32 45.54 0.9 8.2
46 South Belmar Borough 1,806 47,566 16.61 22.15 1.1 17.7
47 Spring Lake Borough 3,567 89,885 25.23 33.64 0.6 22.5
48 Spring Lake Heights Borough 5,227 51,330 17.22 30.61 0.6 10.7
49 Tinton Falls Borough 15,053 68,697 18.60 29.23 1.3 17.4
50 Union Beach Borough 6,649 59,946 57.15 81.22 2.0 15.1
51 Upper Freehold Township 4,282 71,250 23.35 14.01 0.0 9.3
52 Wall Township 25,261 73,989 13.06 19.00 1.0 18.5
53 West Long Branch Borough 8,258 71,852 15.74 26.64 1.2 48.3
Monmouth County 615,301 64,271 26.80 48.24 2.0 22.3
32
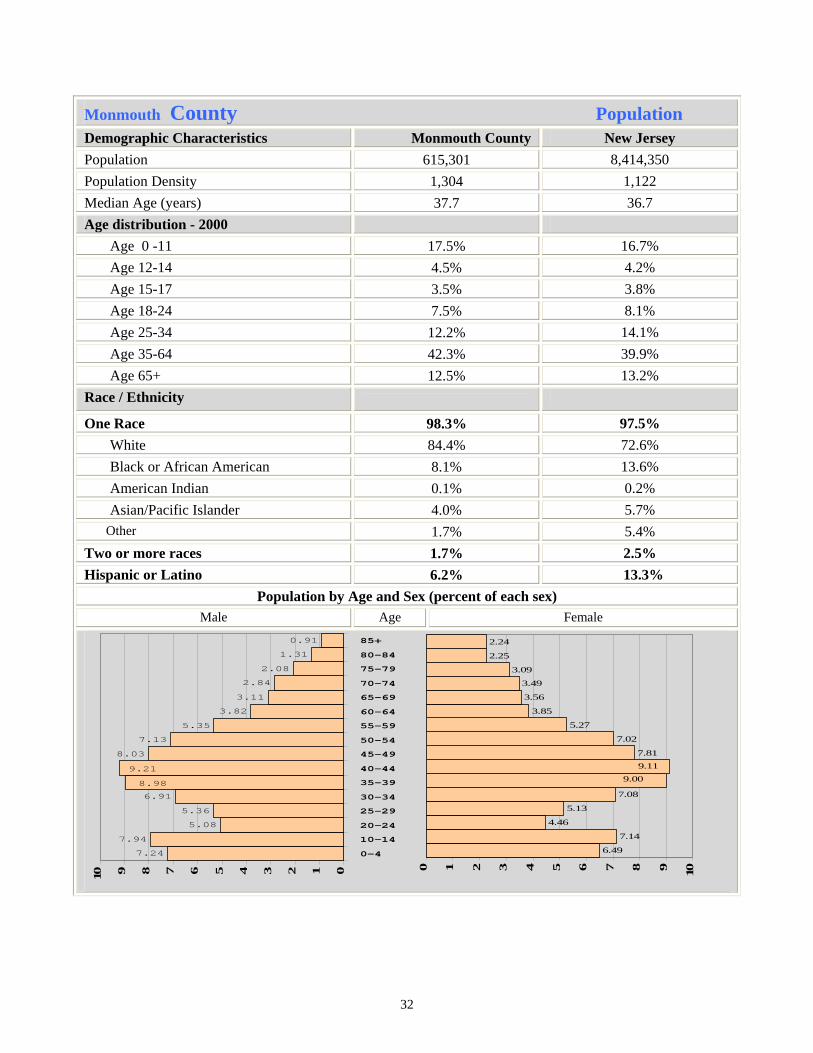
Monmouth County Population Demographic Characteristics Monmouth County New Jersey Population 615,301 8,414,350 Population Density 1,304 1,122 Median Age (years) 37.7 36.7 Age distribution - 2000 Age 0 -11 17.5% 16.7% Age 12-14 4.5% 4.2% Age 15-17 3.5% 3.8% Age 18-24 7.5% 8.1% Age 25-34 12.2% 14.1% Age 35-64 42.3% 39.9% Age 65+ 12.5% 13.2% Race / Ethnicity
One Race 98.3% 97.5% White 84.4% 72.6% Black or African American 8.1% 13.6% American Indian 0.1% 0.2% Asian/Pacific Islander 4.0% 5.7% Other 1.7% 5.4% Two or more races 1.7% 2.5% Hispanic or Latino 6.2% 13.3%
Population by Age and Sex (percent of each sex) Male Age Female
6.49
7.14
4.46
7.08
7.81
7.02
5.27
3.85
3.56
3.49
3.09
2.25
2.24
9.119.00
5.13
0 1 2 3 4 5 6 7 8 9 10
7.24
7.94
5.08
5.36
6.91
8.03
7.13
5.35
3.82
3.11
2.84
2.08
1.31
0.91
8.98
9.21
012345678910
0-4
10-14
20-24
25-29
30-34
35-39
40-44
45-49
50-54
55-59
60-64
65-69
70-74
75-79
80-84
85+

33
5-Year Average Mortality Data , 1998-2002 Monmouth County
Drug Attributable Death by Gender
Age-adjusted Rate** Gender Drug Caused Drug Related Total Crude Rate*
County State Male 6.0 15.0 21.0 7.1 6.7 9.6 Female 3.0 6.0 9.0 2.7 2.5 3.1
All 9.0 21.0 30.0 4.8 4.5 6.2
Alcohol Attributable Death by Gender Age-adjusted Rate** Gender Alcohol Caused Alcohol
Related Total Crude Rate* County State
Male 19.0 80.0 99.0 33.1 31.2 31.7 Female 6.0 56.0 62.0 19.7 18.6 18.4
All 25.0 136.0 161.4 24.8 23.4 24.9
Drug Attributable Death by Race Age-adjusted Rate** Race Number Crude Rate* County State
White 30.0 5.8 5.4 7.8 Black 5.0 10.3 9.7 19.2
Alcohol Attributable Death by Race
Age-adjusted Rate** Race Number Crude Rate*
County State White 1150.0 28.8 27.2 29.0 Black 19.0 37.8 35.7 32.0
* Crude rates are computed per 100,000 mid-year County population ** Age-adjusted rates are computed per 100,000 of the 2000 standard population
34
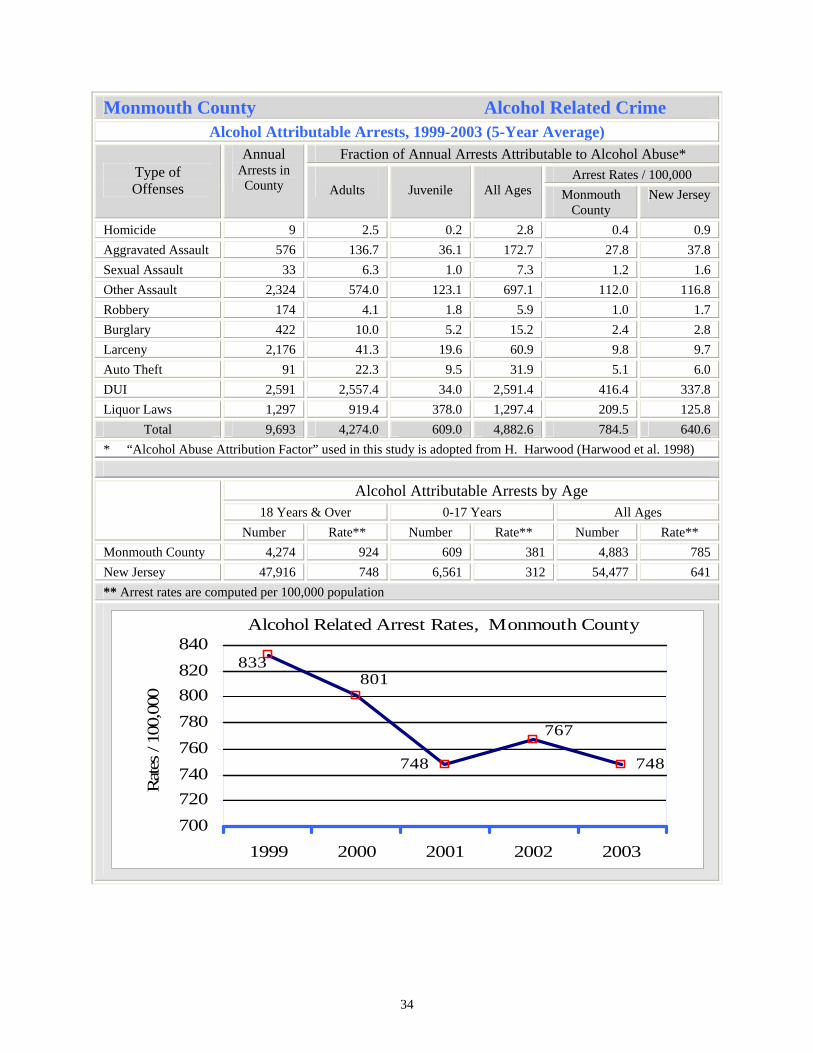
Monmouth County Alcohol Related Crime
Alcohol Attributable Arrests, 1999-2003 (5-Year Average) Fraction of Annual Arrests Attributable to Alcohol Abuse*
Arrest Rates / 100,000 Type of Offenses
Annual Arrests in County
Adults
Juvenile
All Ages Monmouth
County New Jersey
Homicide 9 2.5 0.2 2.8 0.4 0.9 Aggravated Assault 576 136.7 36.1 172.7 27.8 37.8 Sexual Assault 33 6.3 1.0 7.3 1.2 1.6 Other Assault 2,324 574.0 123.1 697.1 112.0 116.8 Robbery 174 4.1 1.8 5.9 1.0 1.7 Burglary 422 10.0 5.2 15.2 2.4 2.8 Larceny 2,176 41.3 19.6 60.9 9.8 9.7 Auto Theft 91 22.3 9.5 31.9 5.1 6.0 DUI 2,591 2,557.4 34.0 2,591.4 416.4 337.8 Liquor Laws 1,297 919.4 378.0 1,297.4 209.5 125.8
Total 9,693 4,274.0 609.0 4,882.6 784.5 640.6 * “Alcohol Abuse Attribution Factor” used in this study is adopted from H. Harwood (Harwood et al. 1998)
Alcohol Attributable Arrests by Age 18 Years & Over 0-17 Years All Ages
Number Rate** Number Rate** Number Rate** Monmouth County 4,274 924 609 381 4,883 785 New Jersey 47,916 748 6,561 312 54,477 641 ** Arrest rates are computed per 100,000 population
Alcohol Related Arrest Rates, Monmouth County
748
767
833801
748
700720740760780800820840
1999 2000 2001 2002 2003
Rat
es /
100,
000
35
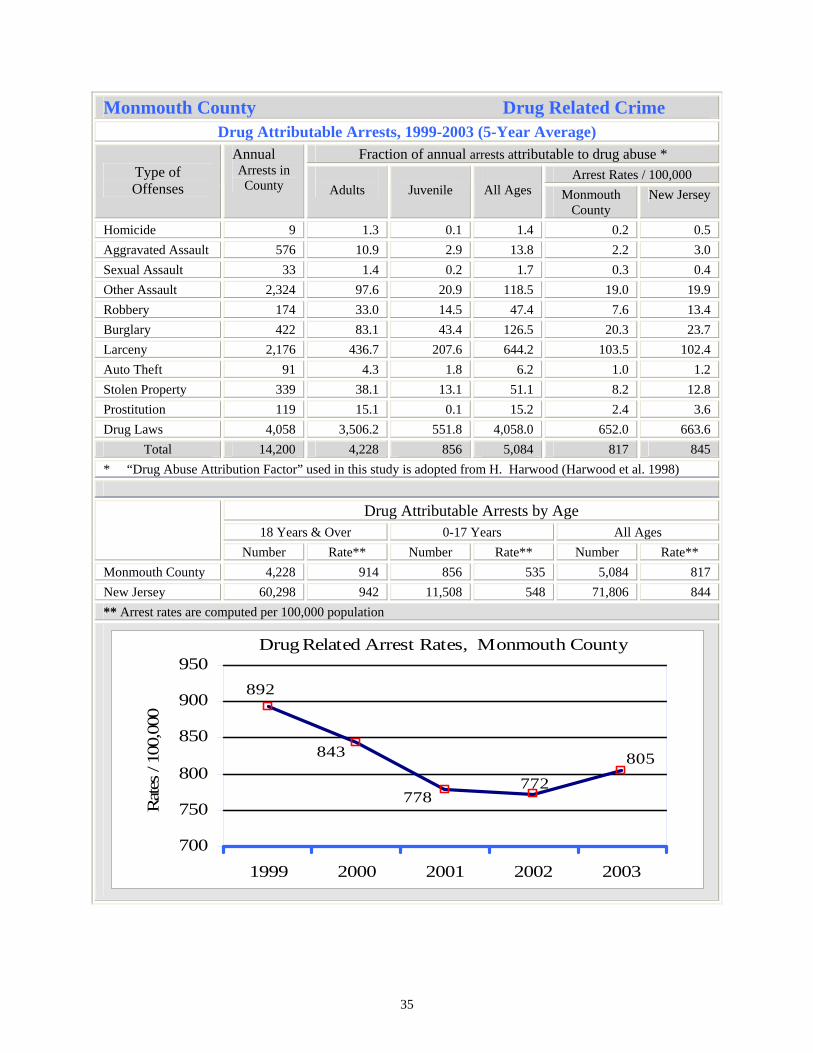
Monmouth County Drug Related Crime
Drug Attributable Arrests, 1999-2003 (5-Year Average) Fraction of annual arrests attributable to drug abuse *
Arrest Rates / 100,000 Type of Offenses
Annual Arrests in County
Adults
Juvenile
All Ages Monmouth
County New Jersey
Homicide 9 1.3 0.1 1.4 0.2 0.5 Aggravated Assault 576 10.9 2.9 13.8 2.2 3.0 Sexual Assault 33 1.4 0.2 1.7 0.3 0.4 Other Assault 2,324 97.6 20.9 118.5 19.0 19.9 Robbery 174 33.0 14.5 47.4 7.6 13.4 Burglary 422 83.1 43.4 126.5 20.3 23.7 Larceny 2,176 436.7 207.6 644.2 103.5 102.4 Auto Theft 91 4.3 1.8 6.2 1.0 1.2 Stolen Property 339 38.1 13.1 51.1 8.2 12.8 Prostitution 119 15.1 0.1 15.2 2.4 3.6 Drug Laws 4,058 3,506.2 551.8 4,058.0 652.0 663.6
Total 14,200 4,228 856 5,084 817 845 * “Drug Abuse Attribution Factor” used in this study is adopted from H. Harwood (Harwood et al. 1998)
Drug Attributable Arrests by Age 18 Years & Over 0-17 Years All Ages
Number Rate** Number Rate** Number Rate** Monmouth County 4,228 914 856 535 5,084 817 New Jersey 60,298 942 11,508 548 71,806 844 ** Arrest rates are computed per 100,000 population
Drug Related Arrest Rates, Monmouth County
805772
892
843
778
700
750
800
850
900
950
1999 2000 2001 2002 2003
Rat
es /
100,
000
36
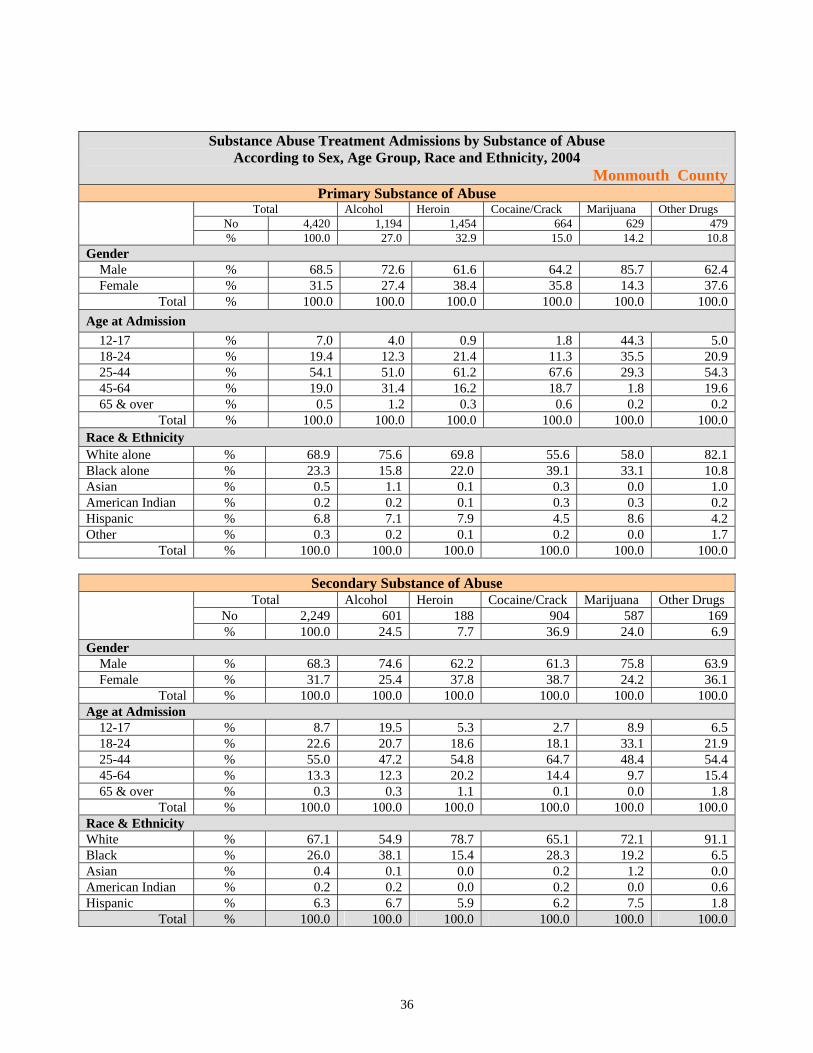
Substance Abuse Treatment Admissions by Substance of Abuse According to Sex, Age Group, Race and Ethnicity, 2004
Monmouth County Primary Substance of Abuse
Total Alcohol Heroin Cocaine/Crack Marijuana Other Drugs No 4,420 1,194 1,454 664 629 479 % 100.0 27.0 32.9 15.0 14.2 10.8
Gender Male % 68.5 72.6 61.6 64.2 85.7 62.4 Female % 31.5 27.4 38.4 35.8 14.3 37.6
Total % 100.0 100.0 100.0 100.0 100.0 100.0 Age at Admission 12-17 % 7.0 4.0 0.9 1.8 44.3 5.0 18-24 % 19.4 12.3 21.4 11.3 35.5 20.9 25-44 % 54.1 51.0 61.2 67.6 29.3 54.3 45-64 % 19.0 31.4 16.2 18.7 1.8 19.6 65 & over % 0.5 1.2 0.3 0.6 0.2 0.2
Total % 100.0 100.0 100.0 100.0 100.0 100.0 Race & Ethnicity White alone % 68.9 75.6 69.8 55.6 58.0 82.1 Black alone % 23.3 15.8 22.0 39.1 33.1 10.8 Asian % 0.5 1.1 0.1 0.3 0.0 1.0 American Indian % 0.2 0.2 0.1 0.3 0.3 0.2 Hispanic % 6.8 7.1 7.9 4.5 8.6 4.2 Other % 0.3 0.2 0.1 0.2 0.0 1.7
Total % 100.0 100.0 100.0 100.0 100.0 100.0
Secondary Substance of Abuse Total Alcohol Heroin Cocaine/Crack Marijuana Other Drugs
No 2,249 601 188 904 587 169 % 100.0 24.5 7.7 36.9 24.0 6.9
Gender Male % 68.3 74.6 62.2 61.3 75.8 63.9 Female % 31.7 25.4 37.8 38.7 24.2 36.1
Total % 100.0 100.0 100.0 100.0 100.0 100.0 Age at Admission 12-17 % 8.7 19.5 5.3 2.7 8.9 6.5 18-24 % 22.6 20.7 18.6 18.1 33.1 21.9 25-44 % 55.0 47.2 54.8 64.7 48.4 54.4 45-64 % 13.3 12.3 20.2 14.4 9.7 15.4 65 & over % 0.3 0.3 1.1 0.1 0.0 1.8
Total % 100.0 100.0 100.0 100.0 100.0 100.0 Race & Ethnicity White % 67.1 54.9 78.7 65.1 72.1 91.1 Black % 26.0 38.1 15.4 28.3 19.2 6.5 Asian % 0.4 0.1 0.0 0.2 1.2 0.0 American Indian % 0.2 0.2 0.0 0.2 0.0 0.6 Hispanic % 6.3 6.7 5.9 6.2 7.5 1.8
Total % 100.0 100.0 100.0 100.0 100.0 100.0

37
Substance Abuse Treatment Admissions by Modality of Care According to Clients’ Sex, Age Group, Race and Ethnicity, 2004
Monmouth County Residential Treatment Services
Short-term Residential
Extended Care
Halfway House
Long-term Residential
Residential Detox
Hospital Detox/IMU
Total
N % N % N % N % N % N % N % 468 29.6 18 1.2 65 4.1 231 14.6 541 32.6 282 17.9 1,578 100
Percent Distribution Gender Male 67.3 83.3 52.3 71.0 72.8 63.8 68.6 Female 32.7 16.7 47.7 29.0 27.2 36.2 31.4
Both 100 100 100 100 100 100 100 Age at Admission 12-17 10.7 0.0 0.0 7.8 0.2 0.0 4.4 18-24 18.3 27.8 18.5 23.8 14.0 21.3 18.4 25-44 51.8 50 61.5 54.5 65.7 58.5 58.3 45-64 19.2 22.2 20 13.4 19.7 19.5 18.6 65 & over 0.0 0.0 0.0 0.4 0.4 0.7 0.3 Race & Ethnicity White alone 75.9 94.4 53.9 59.7 66.3 80.5 70.6 Black alone 19.3 0.0 36.9 29.9 26.1 16.0 22.9 Asian 0.6 0.0 1.5 0.0 0.8 0.3 0.5 Am. Indian 0.4 0.0 0.0 1.3 0.0 0.0 0.3 Hispanic 3.8 5.6 7.7 8.1 6.8 3.2 5.7
Outpatient Treatment Services Outpatient Care Intensive
Outpatient Outpatient
Detox Methadone
Maintenance Total
N % N % N % N % N %
1,224 43.2 894 31.5 113 4.0 604 21.3 2,835 100 Percent Distribution Gender Male 25.8 32.6 36.3 41.2 31.6 Female 74.2 67.4 63.7 58.8 68.4
Both 100 100 100 100 100 Age at Admission 12-17 10.9 11.4 0.0 0.2 8.3 18-24 23.6 19.8 15.9 13.7 20.0 25-44 49.3 46.3 67.3 62.1 51.8 45-64 15.4 21.7 16.8 23.8 19.2 65 & over 0.8 0.9 0.0 0.2 0.7 Race & Ethnicity White 68.4 79.2 82.3 74.8 73.7 Black 30.3 19.7 16.8 25.0 25.3 Asian 0.7 0.6 0.0 0.0 0.5 American Indian 0.3 0.3 0.9 0.2 0.3 Hispanic 0.2 0.2 0.0 0.0 0.2
38
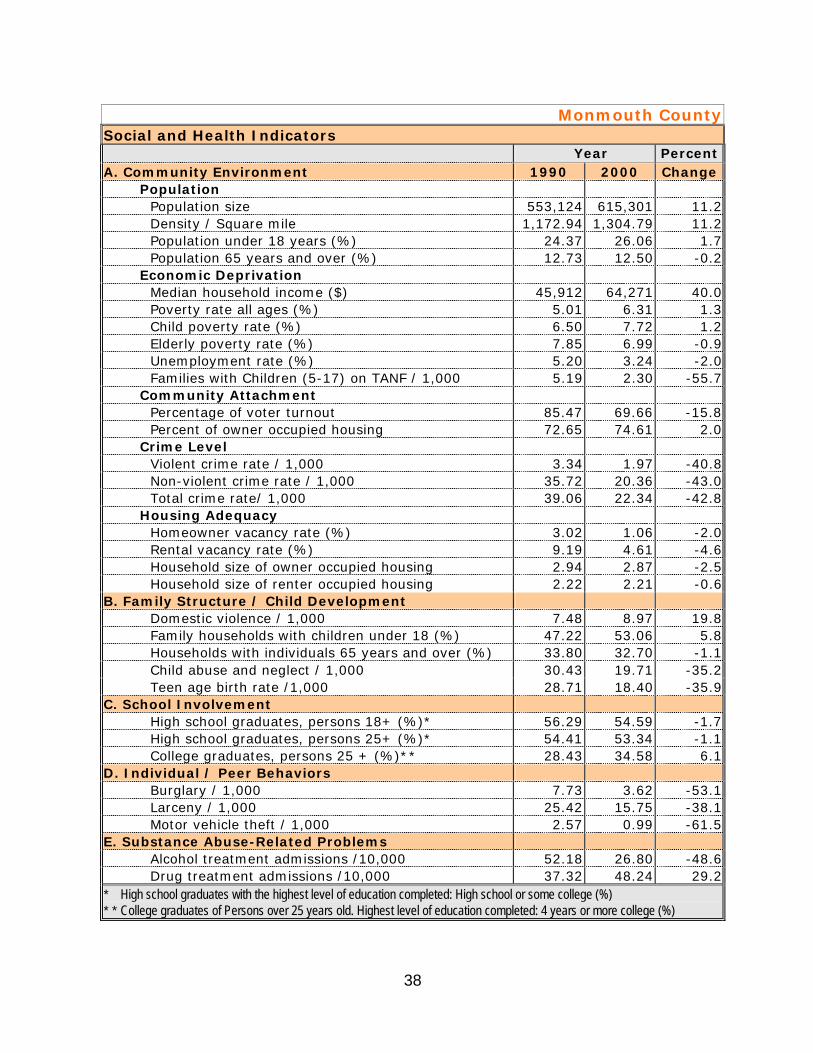
Monmouth County
Social and Health Indicators Year Percent
A. Community Environment 1990 2000 Change Population Population size 553,124 615,301 11.2 Density / Square mile 1,172.94 1,304.79 11.2 Population under 18 years (%) 24.37 26.06 1.7 Population 65 years and over (%) 12.73 12.50 -0.2 Economic Deprivation Median household income ($) 45,912 64,271 40.0 Poverty rate all ages (%) 5.01 6.31 1.3 Child poverty rate (%) 6.50 7.72 1.2 Elderly poverty rate (%) 7.85 6.99 -0.9 Unemployment rate (%) 5.20 3.24 -2.0 Families with Children (5-17) on TANF / 1,000 5.19 2.30 -55.7 Community Attachment Percentage of voter turnout 85.47 69.66 -15.8 Percent of owner occupied housing 72.65 74.61 2.0 Crime Level Violent crime rate / 1,000 3.34 1.97 -40.8 Non-violent crime rate / 1,000 35.72 20.36 -43.0 Total crime rate/ 1,000 39.06 22.34 -42.8 Housing Adequacy Homeowner vacancy rate (%) 3.02 1.06 -2.0 Rental vacancy rate (%) 9.19 4.61 -4.6 Household size of owner occupied housing 2.94 2.87 -2.5 Household size of renter occupied housing 2.22 2.21 -0.6B. Family Structure / Child Development Domestic violence / 1,000 7.48 8.97 19.8 Family households with children under 18 (%) 47.22 53.06 5.8 Households with individuals 65 years and over (%) 33.80 32.70 -1.1 Child abuse and neglect / 1,000 30.43 19.71 -35.2 Teen age birth rate /1,000 28.71 18.40 -35.9C. School Involvement High school graduates, persons 18+ (%)* 56.29 54.59 -1.7 High school graduates, persons 25+ (%)* 54.41 53.34 -1.1 College graduates, persons 25 + (%)** 28.43 34.58 6.1D. Individual / Peer Behaviors Burglary / 1,000 7.73 3.62 -53.1 Larceny / 1,000 25.42 15.75 -38.1 Motor vehicle theft / 1,000 2.57 0.99 -61.5E. Substance Abuse-Related Problems Alcohol treatment admissions /10,000 52.18 26.80 -48.6 Drug treatment admissions /10,000 37.32 48.24 29.2* High school graduates with the highest level of education completed: High school or some college (%) **College graduates of Persons over 25 years old. Highest level of education completed: 4 years or more college (%)

39
Monmouth County
Population Median Household Income ($) Unemployment Rate (%) Total Crime Rate / 1,000 Pop.
615,301 64,271
3.3 22.3
Married couple family (%) Teenage Births / 1,000 births (%) Female householder, no husband present (%) Grandparents responsible for grandchildren (%)
58.2 2.6
10.0 28.4
Population by Age, 2000
17.8
8.2 6.812.1 12.6
42.5
0
10
20
30
40
50
< 12 12-17 18-24 25-34 35-64 >=65
Age in Years
Perc
ent
Drug Treatment Data, 2000
22.5
14.0
10.5
13.5
4.5
35.0
0 10 20 30 40 50 60
Alchohol
Crack & Cocaine
Marijuana
Percent
Crime Rates, 2000
2.0
24.0
9.1
0.0 5.0 10.0 15.0 20.0 25.0 30.0
Violent Crime
Non ViolentCrime
DomesticViolence
Per 1,000 Population
Drug & DUI Arrests, 2000
6.1
0.40.31.8
7.1
0.0
2.0
4.0
6.0
8.0
Marijuana Opium & Cocaine
SyntheticDrugs
Other Drugs
DUI
Per 1
,000
Pop
ulat
ion
Selected Demographic Characteristics, 2000
Race/Ethnicity Population Distribution (%)
Poverty Rate (%)
White alone Black alone Native American alone Asian alone Pacific Islanders alone Other alone 2+ Races
84.4 8.1 0.1 4.0 0.0 1.7 1.7
5.6 8.0 3.1 4.5 2.2 9.2 -
Total 100 6.3
Hispanic 6.2 11.3
Distribution of Mothers by Prenatal Care, 2000
0.7%
5.8%
12.0%
81.5%
First Trimester Second TrimesterThird Trimester No care / No Statistics
40
Appendix A – Population Profile
Summary Data Tables of New Jersey Population by County
41
Population Distribution by Region and County, 1950 – 2000
Total Population
Percent Distribution
1950
1990
2000
1950
1990
2000
New Jersey Regions 4,835,329
7,730,188
8,414,350
100%
100%
100%
Mature Core Metropolis 2,827,756 3,121,126 3,137,723
58.5
40.3
38.8
• Essex
905,949
778,206
748,322
18.7
10.0
9.2
• Hudson
647,437
553,099
553,030
13.4
7.1
6.8
• Union
398,138
493,819
498,893
8.2
6.4
6.2
• Bergen
539,139
825,380
854,428
11.1
10.7
10.6
• Passaic
337,093
453,060
483,050
7.0
6.1
6.0
Northern Exurban Fringe 88,797 222,550
241,838
1.8
2.9
3.0
• Sussex
34,423
130,943
143,139
0.7
1.7
1.8
• Warren
34,374
91,607
98,699
1.1
1.2
1.2 New Jersey Wealth Belt 1,026,139 2,320,136
2,511,001
21.2
29.9
31.0
• Hunterdon
42,736
107,776
122,389
0.9
1.4
1.5
• Mercer
229,781
325,824
331,474
4.8
4.2
4.1
• Middlesex
264,872
671,780
712,638
5.5
8.7
8.8
• Monmouth
223,327
553,124
603,214
4.7
7.1
7.5
• Morris
164,371
421,353
459,012
3.4
5.4
5.7
• Somerset
99,052
240,279
282,274
2.0
3.1
3.5
Metro South 528,380 1,127,972 1,173,563
10.9
14.6
14.5
• Camden
300,743
502,824
504,268
6.2
6.5
6.2
• Burlington
133,910
395,066
421,283
2.8
5.1
5.2
• Gloucester
91,727
230,082
248,012
1.9
3.0
3.1
Southern Shore 226,132 752,619
826,093
4.7
9.7
10.2
• Atlantic
132,399
224,327
237,988
2.7
2.9
2.9
• Cape May
37,131
95,089
98,011
0.8
1.2
1.2
• Ocean
56,622
433,203
490,104
1.2
5.6
6.1 Rural South 138,105 203,347
205,324
2.9
2.6
2.5
• Cumberland
88,597
138,053
140,389
1.8
1.8
1.7
• Salem
49,508
65,294
64,935
1.0
0.8
0.8
Source: U. S, Census Bureau, 2000 Census of Population and Housing & New Jersey State Data Center
42
Table A2. Population Change, New Jersey, 1980 - 2000 Total Population Percent Change
1980 1990 2000 2001 2002 1980-1990 1990-2000
New Jersey 7,365,011 7,730,188 8,414,350 8,511,119 8,590,276 5.0 % 8.9 %
Atlantic 194,119 224,327 252,552 255,578 259,423 15.6 12.6Bergen 843,385 825,380 884,118 890,756 895,091 -2.4 7.1Burlington 362,542 395,066 423,394 430,219 437,871 9.0 7.2Camden 471,650 502,824 508,932 509,461 511,957 6.6 1.2Cape May 82,266 95,089 102,326 102,181 102,013 15.6 7.6Cumberland 132,866 138,053 146,438 146,871 147,768 3.9 6.1Essex 851,304 778,206 793,633 795,573 798,274 -8.6 2.0Gloucester 199,917 230,082 254,673 257,853 262,049 15.1 10.7Hudson 556,972 553,099 608,975 614,061 611,439 -0.7 10.1Hunterdon 87,361 107,776 121,989 123,989 125,795 23.4 13.2Mercer 307,863 325,824 350,761 355,432 359,463 5.8 7.7Middlesex 595,893 671,780 750,162 764,971 775,549 12.7 11.7Monmouth 503,173 553,124 615,301 623,212 629,836 9.9 11.2Morris 407,630 421,353 470,212 473,973 478,730 3.4 11.6Ocean 346,038 433,203 510,916 524,337 537,065 25.2 17.9Passaic 447,585 453,060 489,049 494,094 496,646 1.2 7.9Salem 64,676 65,294 64,285 64,173 64,438 1.0 -1.5Somerset 203,129 240,279 297,490 304,737 309,886 18.3 23.8Sussex 116,119 130,943 144,166 146,522 148,680 12.8 10.1Union 504,094 493,819 522,541 527,482 530,766 -2.0 5.8Warren 84,429 91,607 102,437 105,644 107,537 8.5 11.8Source: US Bureau of the Census

43
Table A3 County Population by Age, New Jersey, 2000 Age Groups Year
2000 Total 0-11 12-14 15-17 18-24 25-44 45-64 65+ New Jersey 8,414,350 1,404,544 354,346 315,130 690,165 2,624,146 1,912,882 1,113,136 Counties Atlantic 252,552 42,954 11,008 9,580 20,680 77,332 56,561 34,437Bergen 884,118 136,895 34,141 29,310 61,436 270,628 216,888 134,820Burlington 423,394 70,051 18,731 16,115 33,180 133,494 98,605 53,218Camden 508,932 89,155 24,154 21,143 42,851 155,392 112,468 63,769Cape May 102,326 14,626 4,262 3,649 6,883 26,079 26,146 20,681Cumberland 146,438 24,314 6,557 6,035 12,775 45,650 32,020 19,087Essex 793,633 140,778 34,194 31,635 74,651 247,139 170,856 94,380Gloucester 254,673 43,689 11,986 11,192 22,974 77,478 57,676 29,678Hudson 608,975 92,856 22,600 22,430 62,982 216,800 122,036 69,271Hunterdon 121,989 21,026 5,567 4,150 7,738 38,182 33,098 12,228Mercer 350,761 56,375 14,489 14,879 34,518 107,282 79,078 44,140Middlesex 750,162 120,006 29,524 29,057 70,335 245,944 162,706 92,590Monmouth 615,301 107,722 27,787 22,865 44,541 186,989 148,474 76,923Morris 470,212 80,110 19,455 15,959 31,210 150,154 118,794 54,530Ocean 510,916 80,136 20,339 17,214 35,004 132,976 111,987 113,260Passaic 489,049 87,217 20,866 19,405 45,476 153,019 104,033 59,033Salem 64,285 10,527 2,908 2,793 5,261 17,939 15,546 9,311Somerset 297,490 53,212 12,332 9,249 18,713 100,664 69,939 33,381Sussex 144,166 26,433 7,258 5,739 9,778 45,382 36,424 13,152Union 522,541 88,609 21,586 18,871 42,344 163,587 115,503 72,041Warren 102,437 17,853 4,603 3,860 6,835 32,036 24,044 13,206Source: US Bureau of the Census
44
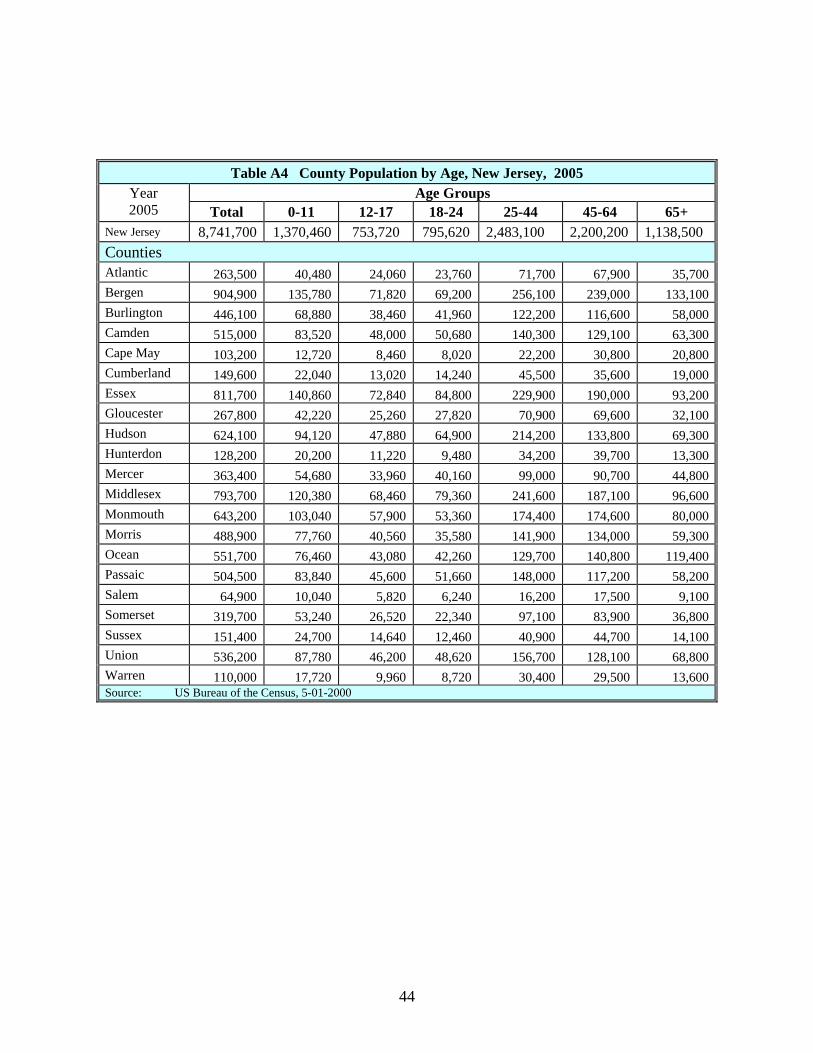
Table A4 County Population by Age, New Jersey, 2005 Age Groups Year
2005 Total 0-11 12-17 18-24 25-44 45-64 65+ New Jersey 8,741,700 1,370,460 753,720 795,620 2,483,100 2,200,200 1,138,500 Counties Atlantic 263,500 40,480 24,060 23,760 71,700 67,900 35,700Bergen 904,900 135,780 71,820 69,200 256,100 239,000 133,100Burlington 446,100 68,880 38,460 41,960 122,200 116,600 58,000Camden 515,000 83,520 48,000 50,680 140,300 129,100 63,300Cape May 103,200 12,720 8,460 8,020 22,200 30,800 20,800Cumberland 149,600 22,040 13,020 14,240 45,500 35,600 19,000Essex 811,700 140,860 72,840 84,800 229,900 190,000 93,200Gloucester 267,800 42,220 25,260 27,820 70,900 69,600 32,100Hudson 624,100 94,120 47,880 64,900 214,200 133,800 69,300Hunterdon 128,200 20,200 11,220 9,480 34,200 39,700 13,300Mercer 363,400 54,680 33,960 40,160 99,000 90,700 44,800Middlesex 793,700 120,380 68,460 79,360 241,600 187,100 96,600Monmouth 643,200 103,040 57,900 53,360 174,400 174,600 80,000Morris 488,900 77,760 40,560 35,580 141,900 134,000 59,300Ocean 551,700 76,460 43,080 42,260 129,700 140,800 119,400Passaic 504,500 83,840 45,600 51,660 148,000 117,200 58,200Salem 64,900 10,040 5,820 6,240 16,200 17,500 9,100Somerset 319,700 53,240 26,520 22,340 97,100 83,900 36,800Sussex 151,400 24,700 14,640 12,460 40,900 44,700 14,100Union 536,200 87,780 46,200 48,620 156,700 128,100 68,800Warren 110,000 17,720 9,960 8,720 30,400 29,500 13,600Source: US Bureau of the Census, 5-01-2000
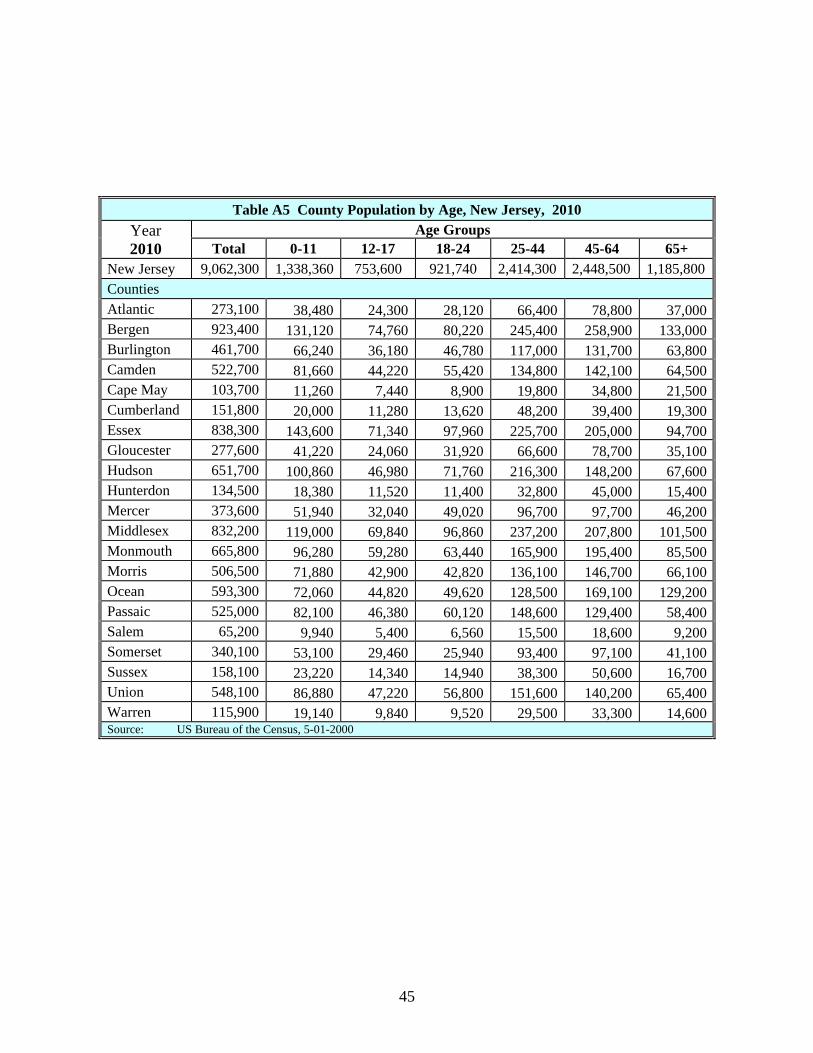
45
Table A5 County Population by Age, New Jersey, 2010 Age Groups Year
2010 Total 0-11 12-17 18-24 25-44 45-64 65+ New Jersey 9,062,300 1,338,360 753,600 921,740 2,414,300 2,448,500 1,185,800 Counties Atlantic 273,100 38,480 24,300 28,120 66,400 78,800 37,000Bergen 923,400 131,120 74,760 80,220 245,400 258,900 133,000Burlington 461,700 66,240 36,180 46,780 117,000 131,700 63,800Camden 522,700 81,660 44,220 55,420 134,800 142,100 64,500Cape May 103,700 11,260 7,440 8,900 19,800 34,800 21,500Cumberland 151,800 20,000 11,280 13,620 48,200 39,400 19,300Essex 838,300 143,600 71,340 97,960 225,700 205,000 94,700Gloucester 277,600 41,220 24,060 31,920 66,600 78,700 35,100Hudson 651,700 100,860 46,980 71,760 216,300 148,200 67,600Hunterdon 134,500 18,380 11,520 11,400 32,800 45,000 15,400Mercer 373,600 51,940 32,040 49,020 96,700 97,700 46,200Middlesex 832,200 119,000 69,840 96,860 237,200 207,800 101,500Monmouth 665,800 96,280 59,280 63,440 165,900 195,400 85,500Morris 506,500 71,880 42,900 42,820 136,100 146,700 66,100Ocean 593,300 72,060 44,820 49,620 128,500 169,100 129,200Passaic 525,000 82,100 46,380 60,120 148,600 129,400 58,400Salem 65,200 9,940 5,400 6,560 15,500 18,600 9,200Somerset 340,100 53,100 29,460 25,940 93,400 97,100 41,100Sussex 158,100 23,220 14,340 14,940 38,300 50,600 16,700Union 548,100 86,880 47,220 56,800 151,600 140,200 65,400Warren 115,900 19,140 9,840 9,520 29,500 33,300 14,600Source: US Bureau of the Census, 5-01-2000

46
Table A6 County Male Population by Age, New Jersey Counties, 2000 Age Groups Year
2000 Total 0-11 12-14 15-17 18-24 25-44 45-64 65+
New Jersey 4,082,813 718,731 181,625 162,612 353,036 1,300,195 919,834 446,780 Counties Atlantic 122,074 21,813 5,642 4,917 10,454 37,879 27,335 14,034Bergen 425,436 69,958 17,536 15,232 31,524 132,884 103,576 54,726Burlington 209,402 35,760 9,681 8,419 18,281 67,455 47,846 21,960Camden 245,577 45,853 12,429 10,844 21,504 75,992 53,542 25,413Cape May 49,190 7,547 2,219 1,921 3,567 12,703 12,633 8,600Cumberland 74,730 12,500 3,394 3,143 6,896 25,482 15,716 7,599Essex 377,533 71,918 17,337 16,124 36,898 119,385 79,209 36,662Gloucester 123,207 22,278 6,152 5,693 11,480 37,521 28,057 12,026Hudson 299,064 47,520 11,542 11,566 32,387 111,632 57,695 26,722Hunterdon 60,240 10,792 2,801 2,158 4,409 18,203 16,630 5,247Mercer 170,750 28,674 7,429 7,577 17,657 53,829 37,994 17,590Middlesex 368,260 61,710 15,135 15,047 35,594 124,273 79,141 37,360Monmouth 298,839 55,109 14,239 11,978 23,169 91,035 72,687 30,622Morris 230,039 41,156 10,063 8,195 15,959 74,268 57,735 22,663Ocean 242,596 41,152 10,424 8,807 17,952 65,485 52,977 45,799Passaic 237,008 44,269 10,667 9,975 22,982 76,067 49,813 23,235Salem 31,047 5,313 1,465 1,486 2,673 8,656 7,675 3,779Somerset 145,241 27,263 6,361 4,834 9,737 49,297 34,044 13,705Sussex 71,338 13,446 3,753 2,981 5,029 22,212 18,469 5,448Union 251,372 45,481 10,984 9,727 21,420 80,332 55,099 28,329Warren 49,870 9,218 2,372 1,988 3,464 15,605 11,961 5,261Source: US Bureau of the Census, 5-01-2000
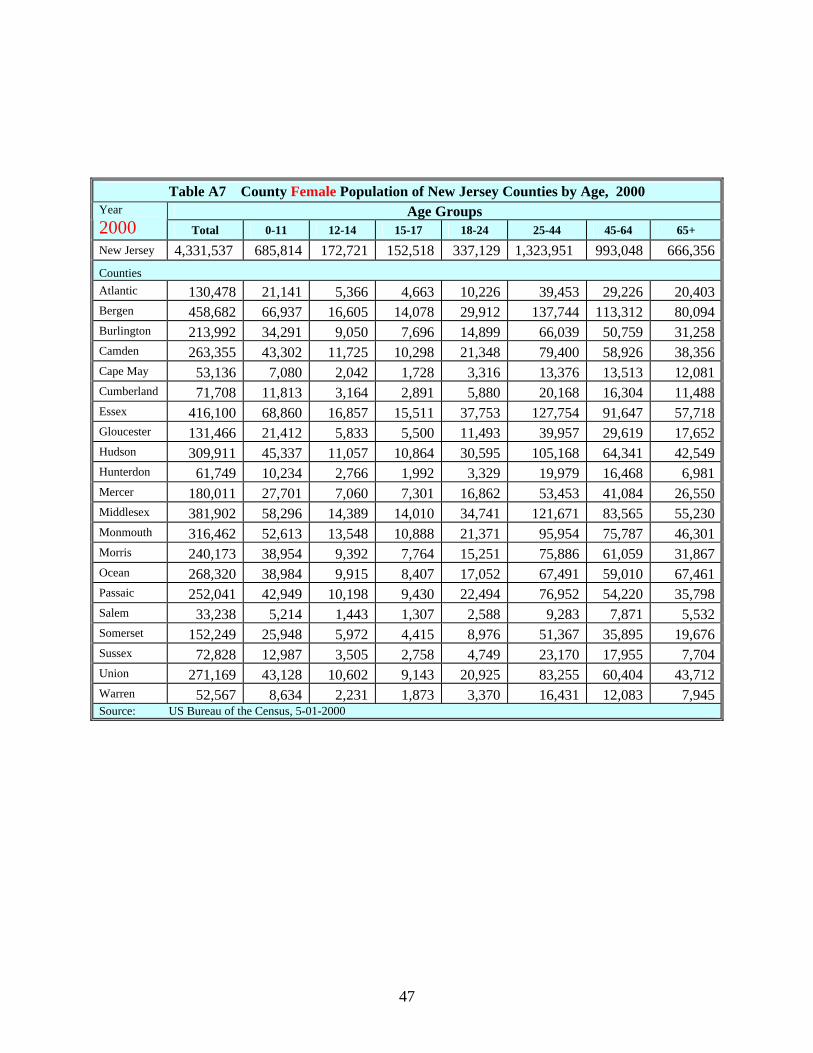
47
Table A7 County Female Population of New Jersey Counties by Age, 2000 Age Groups Year
2000 Total 0-11 12-14 15-17 18-24 25-44 45-64 65+
New Jersey 4,331,537 685,814 172,721 152,518 337,129 1,323,951 993,048 666,356Counties Atlantic 130,478 21,141 5,366 4,663 10,226 39,453 29,226 20,403Bergen 458,682 66,937 16,605 14,078 29,912 137,744 113,312 80,094Burlington 213,992 34,291 9,050 7,696 14,899 66,039 50,759 31,258Camden 263,355 43,302 11,725 10,298 21,348 79,400 58,926 38,356Cape May 53,136 7,080 2,042 1,728 3,316 13,376 13,513 12,081Cumberland 71,708 11,813 3,164 2,891 5,880 20,168 16,304 11,488Essex 416,100 68,860 16,857 15,511 37,753 127,754 91,647 57,718Gloucester 131,466 21,412 5,833 5,500 11,493 39,957 29,619 17,652Hudson 309,911 45,337 11,057 10,864 30,595 105,168 64,341 42,549Hunterdon 61,749 10,234 2,766 1,992 3,329 19,979 16,468 6,981Mercer 180,011 27,701 7,060 7,301 16,862 53,453 41,084 26,550Middlesex 381,902 58,296 14,389 14,010 34,741 121,671 83,565 55,230Monmouth 316,462 52,613 13,548 10,888 21,371 95,954 75,787 46,301Morris 240,173 38,954 9,392 7,764 15,251 75,886 61,059 31,867Ocean 268,320 38,984 9,915 8,407 17,052 67,491 59,010 67,461Passaic 252,041 42,949 10,198 9,430 22,494 76,952 54,220 35,798Salem 33,238 5,214 1,443 1,307 2,588 9,283 7,871 5,532Somerset 152,249 25,948 5,972 4,415 8,976 51,367 35,895 19,676Sussex 72,828 12,987 3,505 2,758 4,749 23,170 17,955 7,704Union 271,169 43,128 10,602 9,143 20,925 83,255 60,404 43,712Warren 52,567 8,634 2,231 1,873 3,370 16,431 12,083 7,945Source: US Bureau of the Census, 5-01-2000

48
Table A8 Predicted Adult Population in New Jersey by Counties 2000 to 2005
County Census 2000 2001 2002 2003 2004 2005
Atlantic 188,697 191,077 194,065 197,555 198,308 199,060
Bergen 681,064 687,912 690,846 693,807 695,604 697,400
Burlington 316,873 324,120 331,142 337,426 338,093 338,760
Camden 372,784 374,725 377,472 379,908 381,644 383,380
Cape May 79,467 79,671 79,747 80,093 80,957 81,820
Cumberland 109,235 109,756 110,722 111,872 113,106 114,340
Essex 586,683 586,484 586,618 585,806 591,853 597,900
Gloucester 187,554 191,248 195,834 200,434 200,427 200,420
Hudson 471,477 473,160 470,288 467,672 474,936 482,200
Hunterdon 90,615 93,939 95,677 97,310 96,995 96,680
Mercer 266,424 267,660 270,301 273,539 274,100 274,660
Middlesex 572,534 580,783 587,431 593,570 599,115 604,660
Monmouth 454,959 462,464 467,844 472,687 477,524 482,360
Morris 353,374 356,686 360,541 364,316 367,548 370,780
Ocean 391,870 403,760 414,474 422,240 427,200 432,160
Passaic 361,563 364,019 364,930 365,112 370,086 375,060
Salem 47,835 48,239 48,815 49,110 49,075 49,040
Somerset 221,499 226,108 229,382 232,215 236,178 240,140
Sussex 103,948 106,997 109,482 111,957 112,059 112,160
Union 392,600 395,022 396,257 395,924 399,072 402,220
Warren 75,747 78,746 80,504 82,118 82,169 82,220
Total 6,326,792 6,402,576 6,462,372 6,514,671 6,566,049 6,617,420

49
Table A 9 County Population by Race and Hispanic or Latino Origin, New Jersey, 2000 RACE 6
One Race
Total Population
Total White Black or African American
American Indian
Asian Native Hawaiian Other
Two or More Races
Hispanic
Or Latino Origin
New Jersey 8,414,350 8,200,595 6,104,705 1,141,821 19,492 480,276 3,329 450,972 213,755 1,117,151Percent 100 % 97.5 % 72.6 % 13.6 % 0.2 % 5.7 % 5.4 % 2.5 % 13.3 %
Counties Atlantic 252,552 246,027 172,632 44,534 669 12,771 114 15,307 6,525 30,729Bergen 884,118 864,160 693,236 46,568 1,336 94,324 193 28,503 19,958 91,337Burlington 423,394 414,644 331,898 64,071 898 11,378 144 6,255 8,750 17,632Camden 508,932 499,121 360,756 92,059 1,300 18,910 187 25,909 9,811 49,166Cape May 102,326 101,144 93,700 5,178 186 661 40 1,379 1,182 3,378Cumberland 146,438 142,261 96,478 29,585 1,419 1,397 82 13,300 4,177 27,823Essex 793,633 766,478 352,859 327,324 1,861 29,429 417 54,588 27,155 122,347Gloucester 254,673 251,366 221,742 23,084 487 3,805 75 2,173 3,307 6,583Hudson 608,975 574,680 338,457 82,098 2,547 56,942 383 94,253 34,295 242,123Hunterdon 121,989 120,779 114,563 2,743 169 2,348 35 921 1,210 3,371Mercer 350,761 343,142 240,206 69,502 688 17,340 352 15,054 7,619 33,898Middlesex 750,162 730,665 513,298 68,467 1,521 104,212 300 42,867 19,497 101,940Monmouth 615,301 604,990 519,261 49,609 879 24,403 153 10,685 10,311 38,175Morris 470,212 462,886 410,042 13,181 572 29,432 188 9,471 7,326 36,626Ocean 510,916 504,347 475,391 15,268 702 6,550 103 6,333 6,569 25,638Passaic 489,049 469,261 304,786 64,647 2,166 18,064 175 79,423 19,788 146,492Salem 64,285 63,344 52,195 9,498 226 396 19 1,010 941 2,498Somerset 297,490 292,033 236,042 22,396 375 24,941 121 8,158 5,457 25,811Sussex 144,166 142,516 138,015 1,502 161 1,738 28 1,072 1,650 4,822Union 522,541 505,581 342,302 108,593 1,215 19,993 201 33,277 16,960 103,011Warren 102,437 101,170 96,846 1,914 115 1,242 19 1,034 1,267 3,751Source: U.S. Census Bureau, Census 2000
6 Race / Ethnicity classification is based on the 1977 Office of Management and Budget (OMB) classification
50
Appendix B – Mortality Data
The Center for Health Statistics, New Jersey Department of Health and the National
Center for Health Statistics (NCHS) are the sources of the mortality data presented in this Chartbook. The data are based on death certificates filed for New Jersey residents and are compiled by county of the decedent's residence (regardless of where the death occurred). Based on the combination of all contributory causes of death listed on the death certificate, NCHS assigns a single underlying cause for each death. For the period covered in this report, the NCHS coded cause of death according to the International Classification of Diseases, ICD-9 and ICD-10 diagnostic codes as shown of the following table. Measures of mortality in this report include the number of deaths; crude, gender specific and age-adjusted death rates based on year 2000 standard population. Death rates are computed on the bases of population denominators provided by the U.S. Bureau of the Census.
The rates employed in the core analysis of mortality employ two types of ICD codes that specify a quantitative association with substance abuse:
o ICD codes that are directly associated with alcohol and drug abuse o ICD codes that are indirectly associated with alcohol and drug abuse
A death certificate with an ICD code is counted as a fraction of a single death. The fraction of death with a given ICD code associated with alcohol or drug is known as an Alcohol Associated Fraction (AAF) or Drug Associated Fraction (DAF). Death denoted with AAF, in general, contribute significantly to overall proportion of death. This is also true in the case of New Jersey (as shown in the following table) where 11,222 counts of death were alcohol associated compared to 2,745 that were drug associated. The ICD-9 codes and the AAF & DAF fractions used to estimate drug and alcohol associated mortality is shown on the following table.
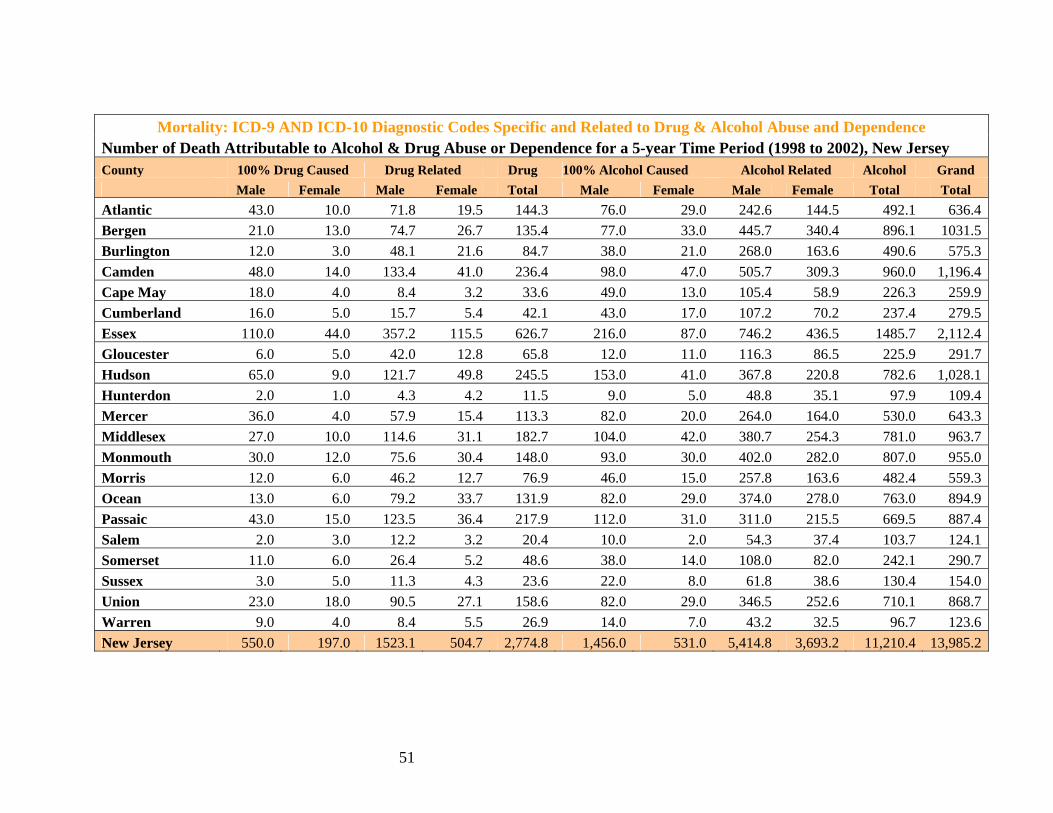
51
Mortality: ICD-9 AND ICD-10 Diagnostic Codes Specific and Related to Drug & Alcohol Abuse and Dependence
Number of Death Attributable to Alcohol & Drug Abuse or Dependence for a 5-year Time Period (1998 to 2002), New Jersey County 100% Drug Caused Drug Related Drug 100% Alcohol Caused Alcohol Related Alcohol Grand Male Female Male Female Total Male Female Male Female Total Total Atlantic 43.0 10.0 71.8 19.5 144.3 76.0 29.0 242.6 144.5 492.1 636.4 Bergen 21.0 13.0 74.7 26.7 135.4 77.0 33.0 445.7 340.4 896.1 1031.5 Burlington 12.0 3.0 48.1 21.6 84.7 38.0 21.0 268.0 163.6 490.6 575.3 Camden 48.0 14.0 133.4 41.0 236.4 98.0 47.0 505.7 309.3 960.0 1,196.4 Cape May 18.0 4.0 8.4 3.2 33.6 49.0 13.0 105.4 58.9 226.3 259.9 Cumberland 16.0 5.0 15.7 5.4 42.1 43.0 17.0 107.2 70.2 237.4 279.5 Essex 110.0 44.0 357.2 115.5 626.7 216.0 87.0 746.2 436.5 1485.7 2,112.4 Gloucester 6.0 5.0 42.0 12.8 65.8 12.0 11.0 116.3 86.5 225.9 291.7 Hudson 65.0 9.0 121.7 49.8 245.5 153.0 41.0 367.8 220.8 782.6 1,028.1 Hunterdon 2.0 1.0 4.3 4.2 11.5 9.0 5.0 48.8 35.1 97.9 109.4 Mercer 36.0 4.0 57.9 15.4 113.3 82.0 20.0 264.0 164.0 530.0 643.3 Middlesex 27.0 10.0 114.6 31.1 182.7 104.0 42.0 380.7 254.3 781.0 963.7 Monmouth 30.0 12.0 75.6 30.4 148.0 93.0 30.0 402.0 282.0 807.0 955.0 Morris 12.0 6.0 46.2 12.7 76.9 46.0 15.0 257.8 163.6 482.4 559.3 Ocean 13.0 6.0 79.2 33.7 131.9 82.0 29.0 374.0 278.0 763.0 894.9 Passaic 43.0 15.0 123.5 36.4 217.9 112.0 31.0 311.0 215.5 669.5 887.4 Salem 2.0 3.0 12.2 3.2 20.4 10.0 2.0 54.3 37.4 103.7 124.1 Somerset 11.0 6.0 26.4 5.2 48.6 38.0 14.0 108.0 82.0 242.1 290.7 Sussex 3.0 5.0 11.3 4.3 23.6 22.0 8.0 61.8 38.6 130.4 154.0 Union 23.0 18.0 90.5 27.1 158.6 82.0 29.0 346.5 252.6 710.1 868.7 Warren 9.0 4.0 8.4 5.5 26.9 14.0 7.0 43.2 32.5 96.7 123.6 New Jersey 550.0 197.0 1523.1 504.7 2,774.8 1,456.0 531.0 5,414.8 3,693.2 11,210.4 13,985.2
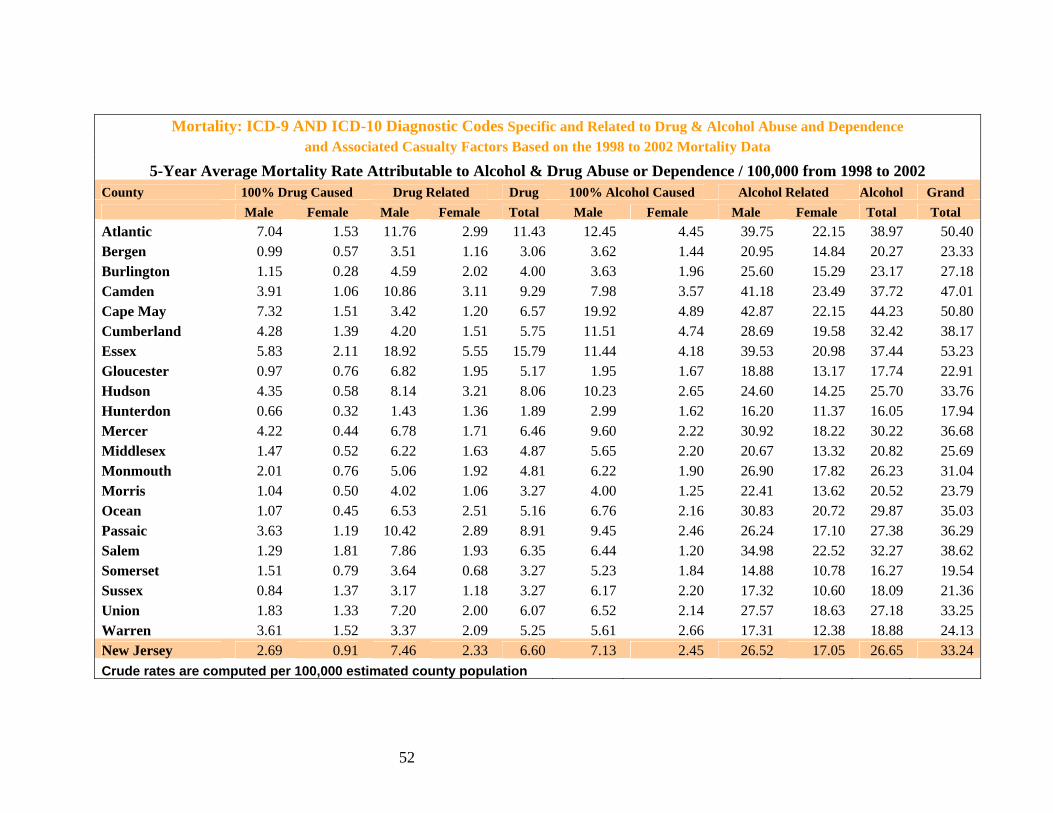
52
Mortality: ICD-9 AND ICD-10 Diagnostic Codes Specific and Related to Drug & Alcohol Abuse and Dependence
and Associated Casualty Factors Based on the 1998 to 2002 Mortality Data
5-Year Average Mortality Rate Attributable to Alcohol & Drug Abuse or Dependence / 100,000 from 1998 to 2002 County 100% Drug Caused Drug Related Drug 100% Alcohol Caused Alcohol Related Alcohol Grand Male Female Male Female Total Male Female Male Female Total Total Atlantic 7.04 1.53 11.76 2.99 11.43 12.45 4.45 39.75 22.15 38.97 50.40Bergen 0.99 0.57 3.51 1.16 3.06 3.62 1.44 20.95 14.84 20.27 23.33Burlington 1.15 0.28 4.59 2.02 4.00 3.63 1.96 25.60 15.29 23.17 27.18Camden 3.91 1.06 10.86 3.11 9.29 7.98 3.57 41.18 23.49 37.72 47.01Cape May 7.32 1.51 3.42 1.20 6.57 19.92 4.89 42.87 22.15 44.23 50.80Cumberland 4.28 1.39 4.20 1.51 5.75 11.51 4.74 28.69 19.58 32.42 38.17Essex 5.83 2.11 18.92 5.55 15.79 11.44 4.18 39.53 20.98 37.44 53.23Gloucester 0.97 0.76 6.82 1.95 5.17 1.95 1.67 18.88 13.17 17.74 22.91Hudson 4.35 0.58 8.14 3.21 8.06 10.23 2.65 24.60 14.25 25.70 33.76Hunterdon 0.66 0.32 1.43 1.36 1.89 2.99 1.62 16.20 11.37 16.05 17.94Mercer 4.22 0.44 6.78 1.71 6.46 9.60 2.22 30.92 18.22 30.22 36.68Middlesex 1.47 0.52 6.22 1.63 4.87 5.65 2.20 20.67 13.32 20.82 25.69Monmouth 2.01 0.76 5.06 1.92 4.81 6.22 1.90 26.90 17.82 26.23 31.04Morris 1.04 0.50 4.02 1.06 3.27 4.00 1.25 22.41 13.62 20.52 23.79Ocean 1.07 0.45 6.53 2.51 5.16 6.76 2.16 30.83 20.72 29.87 35.03Passaic 3.63 1.19 10.42 2.89 8.91 9.45 2.46 26.24 17.10 27.38 36.29Salem 1.29 1.81 7.86 1.93 6.35 6.44 1.20 34.98 22.52 32.27 38.62Somerset 1.51 0.79 3.64 0.68 3.27 5.23 1.84 14.88 10.78 16.27 19.54Sussex 0.84 1.37 3.17 1.18 3.27 6.17 2.20 17.32 10.60 18.09 21.36Union 1.83 1.33 7.20 2.00 6.07 6.52 2.14 27.57 18.63 27.18 33.25Warren 3.61 1.52 3.37 2.09 5.25 5.61 2.66 17.31 12.38 18.88 24.13New Jersey 2.69 0.91 7.46 2.33 6.60 7.13 2.45 26.52 17.05 26.65 33.24Crude rates are computed per 100,000 estimated county population
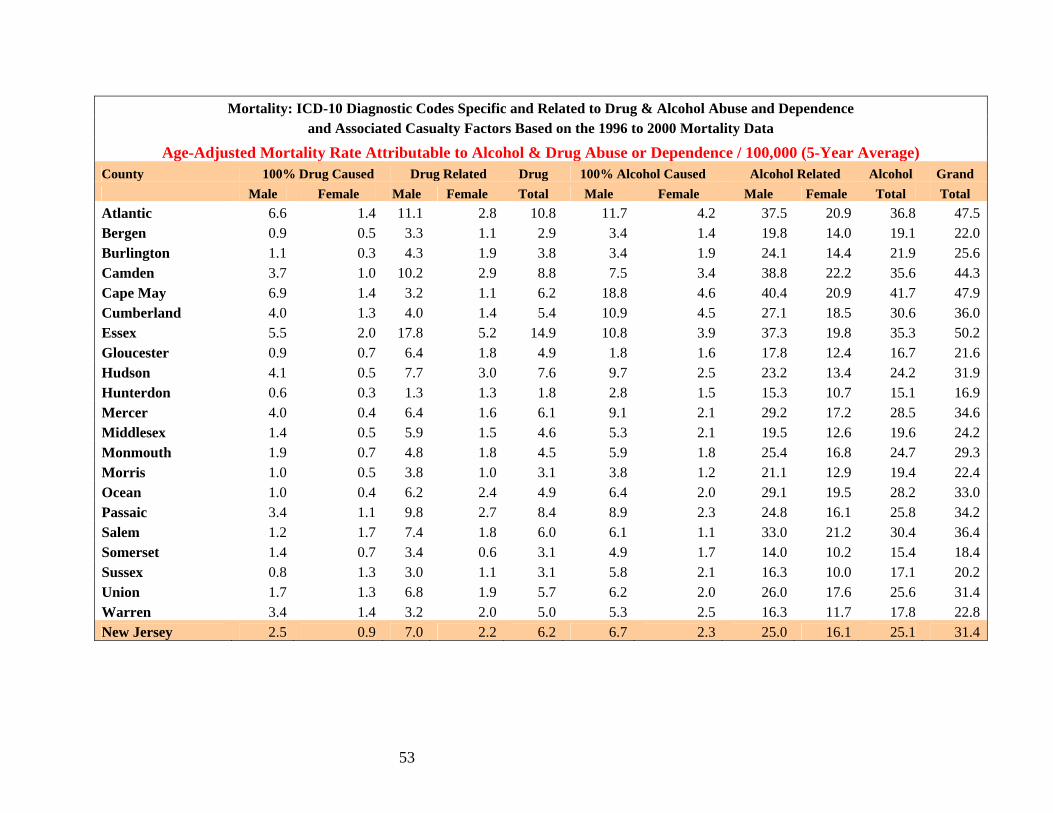
53
Mortality: ICD-10 Diagnostic Codes Specific and Related to Drug & Alcohol Abuse and Dependence and Associated Casualty Factors Based on the 1996 to 2000 Mortality Data
Age-Adjusted Mortality Rate Attributable to Alcohol & Drug Abuse or Dependence / 100,000 (5-Year Average) County 100% Drug Caused Drug Related Drug 100% Alcohol Caused Alcohol Related Alcohol Grand Male Female Male Female Total Male Female Male Female Total Total Atlantic 6.6 1.4 11.1 2.8 10.8 11.7 4.2 37.5 20.9 36.8 47.5Bergen 0.9 0.5 3.3 1.1 2.9 3.4 1.4 19.8 14.0 19.1 22.0Burlington 1.1 0.3 4.3 1.9 3.8 3.4 1.9 24.1 14.4 21.9 25.6Camden 3.7 1.0 10.2 2.9 8.8 7.5 3.4 38.8 22.2 35.6 44.3Cape May 6.9 1.4 3.2 1.1 6.2 18.8 4.6 40.4 20.9 41.7 47.9Cumberland 4.0 1.3 4.0 1.4 5.4 10.9 4.5 27.1 18.5 30.6 36.0Essex 5.5 2.0 17.8 5.2 14.9 10.8 3.9 37.3 19.8 35.3 50.2Gloucester 0.9 0.7 6.4 1.8 4.9 1.8 1.6 17.8 12.4 16.7 21.6Hudson 4.1 0.5 7.7 3.0 7.6 9.7 2.5 23.2 13.4 24.2 31.9Hunterdon 0.6 0.3 1.3 1.3 1.8 2.8 1.5 15.3 10.7 15.1 16.9Mercer 4.0 0.4 6.4 1.6 6.1 9.1 2.1 29.2 17.2 28.5 34.6Middlesex 1.4 0.5 5.9 1.5 4.6 5.3 2.1 19.5 12.6 19.6 24.2Monmouth 1.9 0.7 4.8 1.8 4.5 5.9 1.8 25.4 16.8 24.7 29.3Morris 1.0 0.5 3.8 1.0 3.1 3.8 1.2 21.1 12.9 19.4 22.4Ocean 1.0 0.4 6.2 2.4 4.9 6.4 2.0 29.1 19.5 28.2 33.0Passaic 3.4 1.1 9.8 2.7 8.4 8.9 2.3 24.8 16.1 25.8 34.2Salem 1.2 1.7 7.4 1.8 6.0 6.1 1.1 33.0 21.2 30.4 36.4Somerset 1.4 0.7 3.4 0.6 3.1 4.9 1.7 14.0 10.2 15.4 18.4Sussex 0.8 1.3 3.0 1.1 3.1 5.8 2.1 16.3 10.0 17.1 20.2Union 1.7 1.3 6.8 1.9 5.7 6.2 2.0 26.0 17.6 25.6 31.4Warren 3.4 1.4 3.2 2.0 5.0 5.3 2.5 16.3 11.7 17.8 22.8New Jersey 2.5 0.9 7.0 2.2 6.2 6.7 2.3 25.0 16.1 25.1 31.4
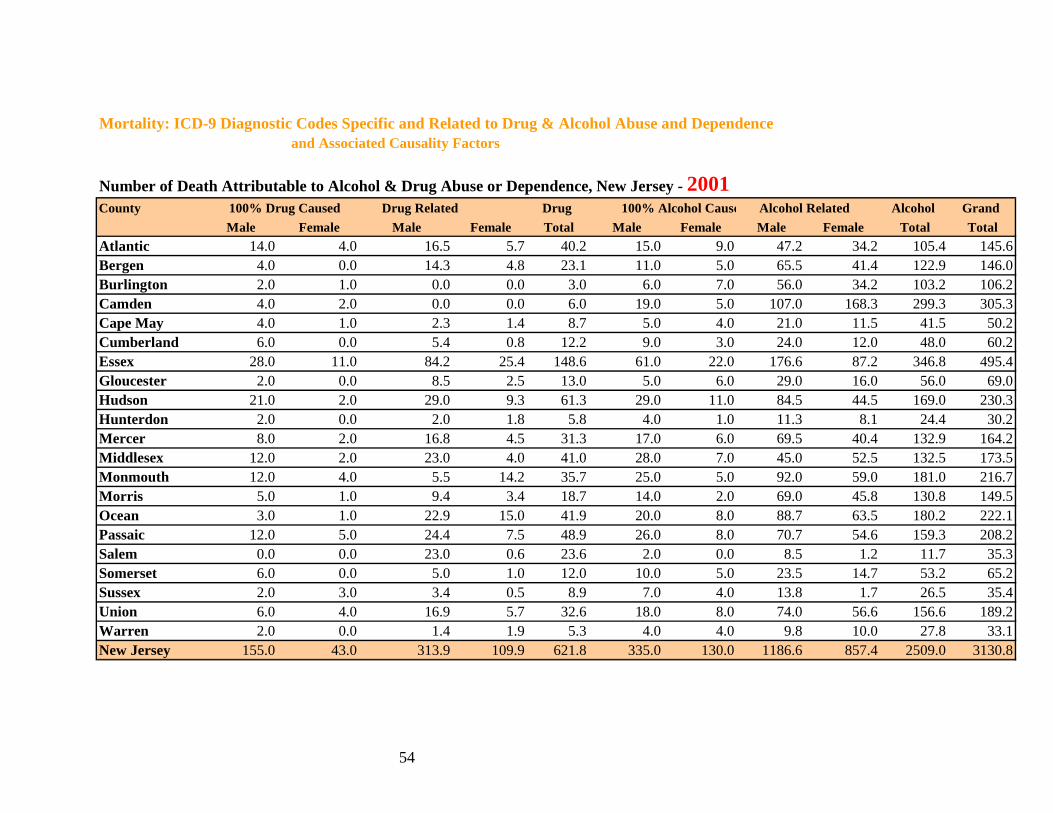
54
Mortality: ICD-9 Diagnostic Codes Specific and Related to Drug & Alcohol Abuse and Dependence
and Associated Causality Factors
Number of Death Attributable to Alcohol & Drug Abuse or Dependence, New Jersey - 2001County 100% Drug Caused Drug Related Drug 100% Alcohol Cause Alcohol Related Alcohol Grand
Male Female Male Female Total Male Female Male Female Total TotalAtlantic 14.0 4.0 16.5 5.7 40.2 15.0 9.0 47.2 34.2 105.4 145.6Bergen 4.0 0.0 14.3 4.8 23.1 11.0 5.0 65.5 41.4 122.9 146.0Burlington 2.0 1.0 0.0 0.0 3.0 6.0 7.0 56.0 34.2 103.2 106.2Camden 4.0 2.0 0.0 0.0 6.0 19.0 5.0 107.0 168.3 299.3 305.3Cape May 4.0 1.0 2.3 1.4 8.7 5.0 4.0 21.0 11.5 41.5 50.2Cumberland 6.0 0.0 5.4 0.8 12.2 9.0 3.0 24.0 12.0 48.0 60.2Essex 28.0 11.0 84.2 25.4 148.6 61.0 22.0 176.6 87.2 346.8 495.4Gloucester 2.0 0.0 8.5 2.5 13.0 5.0 6.0 29.0 16.0 56.0 69.0Hudson 21.0 2.0 29.0 9.3 61.3 29.0 11.0 84.5 44.5 169.0 230.3Hunterdon 2.0 0.0 2.0 1.8 5.8 4.0 1.0 11.3 8.1 24.4 30.2Mercer 8.0 2.0 16.8 4.5 31.3 17.0 6.0 69.5 40.4 132.9 164.2Middlesex 12.0 2.0 23.0 4.0 41.0 28.0 7.0 45.0 52.5 132.5 173.5Monmouth 12.0 4.0 5.5 14.2 35.7 25.0 5.0 92.0 59.0 181.0 216.7Morris 5.0 1.0 9.4 3.4 18.7 14.0 2.0 69.0 45.8 130.8 149.5Ocean 3.0 1.0 22.9 15.0 41.9 20.0 8.0 88.7 63.5 180.2 222.1Passaic 12.0 5.0 24.4 7.5 48.9 26.0 8.0 70.7 54.6 159.3 208.2Salem 0.0 0.0 23.0 0.6 23.6 2.0 0.0 8.5 1.2 11.7 35.3Somerset 6.0 0.0 5.0 1.0 12.0 10.0 5.0 23.5 14.7 53.2 65.2Sussex 2.0 3.0 3.4 0.5 8.9 7.0 4.0 13.8 1.7 26.5 35.4Union 6.0 4.0 16.9 5.7 32.6 18.0 8.0 74.0 56.6 156.6 189.2Warren 2.0 0.0 1.4 1.9 5.3 4.0 4.0 9.8 10.0 27.8 33.1New Jersey 155.0 43.0 313.9 109.9 621.8 335.0 130.0 1186.6 857.4 2509.0 3130.8
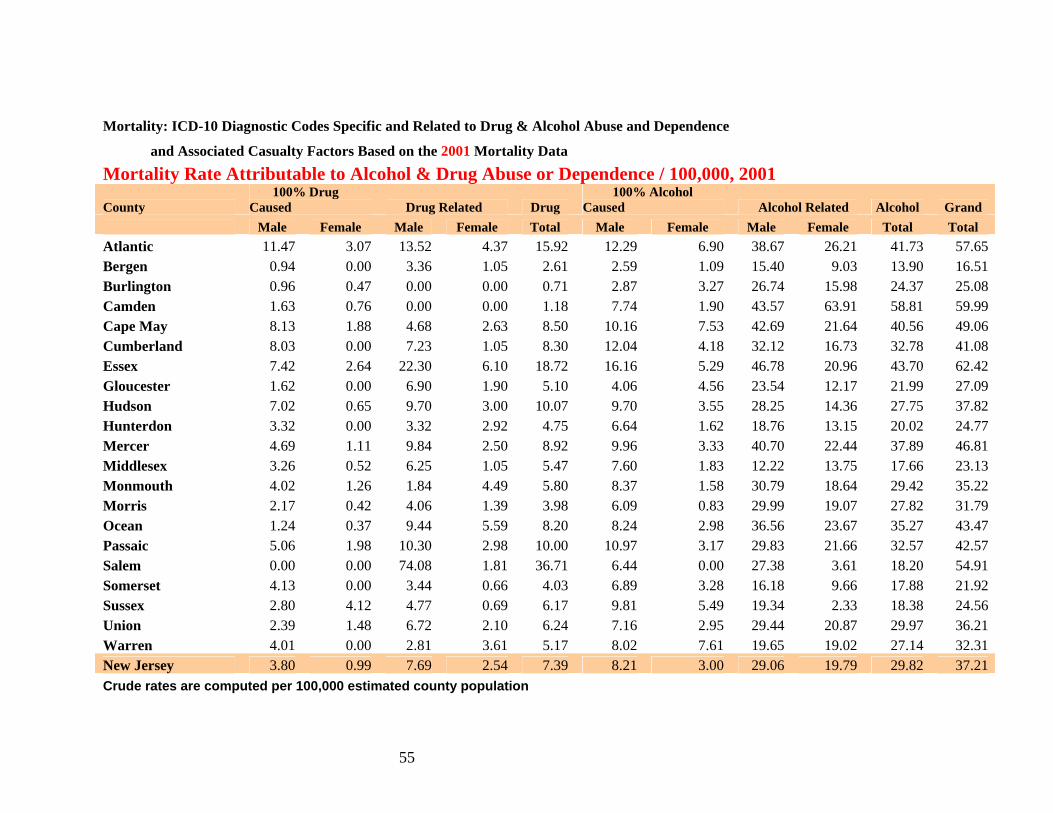
55
Mortality: ICD-10 Diagnostic Codes Specific and Related to Drug & Alcohol Abuse and Dependence
and Associated Casualty Factors Based on the 2001 Mortality Data
Mortality Rate Attributable to Alcohol & Drug Abuse or Dependence / 100,000, 2001
County 100% Drug Caused Drug Related Drug
100% Alcohol Caused Alcohol Related Alcohol Grand
Male Female Male Female Total Male Female Male Female Total Total Atlantic 11.47 3.07 13.52 4.37 15.92 12.29 6.90 38.67 26.21 41.73 57.65 Bergen 0.94 0.00 3.36 1.05 2.61 2.59 1.09 15.40 9.03 13.90 16.51 Burlington 0.96 0.47 0.00 0.00 0.71 2.87 3.27 26.74 15.98 24.37 25.08 Camden 1.63 0.76 0.00 0.00 1.18 7.74 1.90 43.57 63.91 58.81 59.99 Cape May 8.13 1.88 4.68 2.63 8.50 10.16 7.53 42.69 21.64 40.56 49.06 Cumberland 8.03 0.00 7.23 1.05 8.30 12.04 4.18 32.12 16.73 32.78 41.08 Essex 7.42 2.64 22.30 6.10 18.72 16.16 5.29 46.78 20.96 43.70 62.42 Gloucester 1.62 0.00 6.90 1.90 5.10 4.06 4.56 23.54 12.17 21.99 27.09 Hudson 7.02 0.65 9.70 3.00 10.07 9.70 3.55 28.25 14.36 27.75 37.82 Hunterdon 3.32 0.00 3.32 2.92 4.75 6.64 1.62 18.76 13.15 20.02 24.77 Mercer 4.69 1.11 9.84 2.50 8.92 9.96 3.33 40.70 22.44 37.89 46.81 Middlesex 3.26 0.52 6.25 1.05 5.47 7.60 1.83 12.22 13.75 17.66 23.13 Monmouth 4.02 1.26 1.84 4.49 5.80 8.37 1.58 30.79 18.64 29.42 35.22 Morris 2.17 0.42 4.06 1.39 3.98 6.09 0.83 29.99 19.07 27.82 31.79 Ocean 1.24 0.37 9.44 5.59 8.20 8.24 2.98 36.56 23.67 35.27 43.47 Passaic 5.06 1.98 10.30 2.98 10.00 10.97 3.17 29.83 21.66 32.57 42.57 Salem 0.00 0.00 74.08 1.81 36.71 6.44 0.00 27.38 3.61 18.20 54.91 Somerset 4.13 0.00 3.44 0.66 4.03 6.89 3.28 16.18 9.66 17.88 21.92 Sussex 2.80 4.12 4.77 0.69 6.17 9.81 5.49 19.34 2.33 18.38 24.56 Union 2.39 1.48 6.72 2.10 6.24 7.16 2.95 29.44 20.87 29.97 36.21 Warren 4.01 0.00 2.81 3.61 5.17 8.02 7.61 19.65 19.02 27.14 32.31 New Jersey 3.80 0.99 7.69 2.54 7.39 8.21 3.00 29.06 19.79 29.82 37.21 Crude rates are computed per 100,000 estimated county population
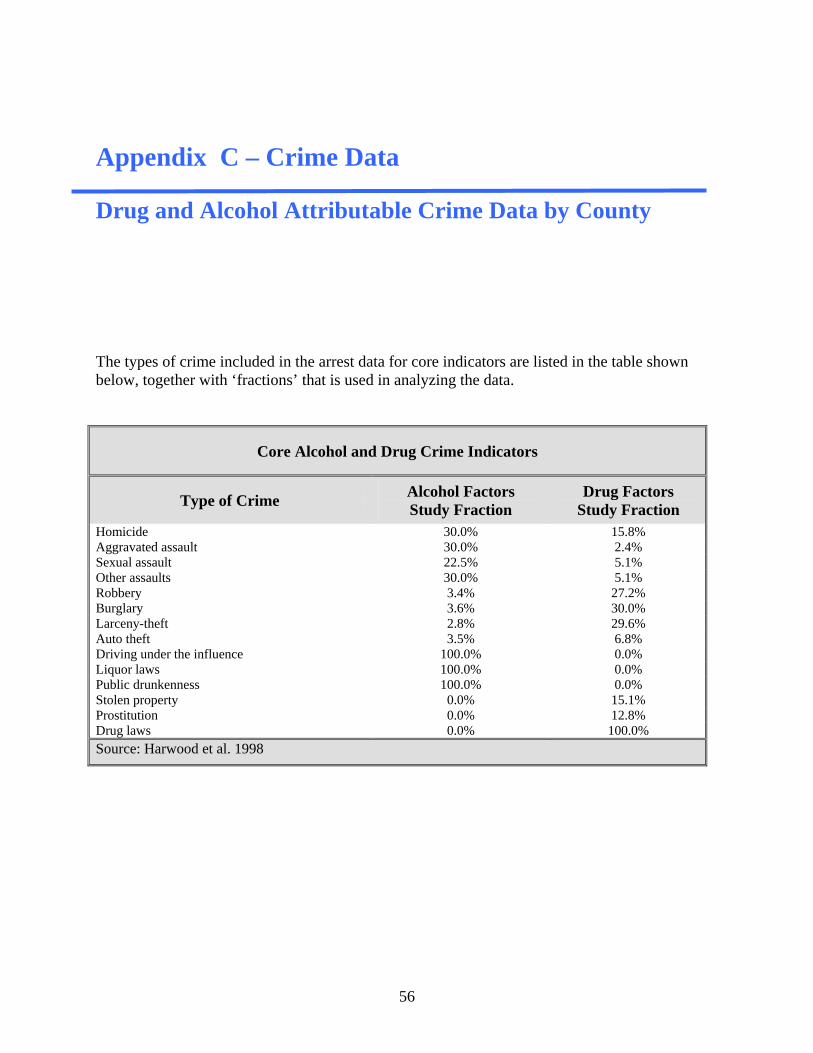
56
Appendix C – Crime Data Drug and Alcohol Attributable Crime Data by County The types of crime included in the arrest data for core indicators are listed in the table shown below, together with ‘fractions’ that is used in analyzing the data.
Core Alcohol and Drug Crime Indicators
Type of Crime Alcohol Factors Study Fraction
Drug Factors Study Fraction
Homicide 30.0% 15.8% Aggravated assault 30.0% 2.4% Sexual assault 22.5% 5.1% Other assaults 30.0% 5.1% Robbery 3.4% 27.2% Burglary 3.6% 30.0% Larceny-theft 2.8% 29.6% Auto theft 3.5% 6.8% Driving under the influence 100.0% 0.0% Liquor laws 100.0% 0.0% Public drunkenness 100.0% 0.0% Stolen property 0.0% 15.1% Prostitution 0.0% 12.8% Drug laws 0.0% 100.0% Source: Harwood et al. 1998

57
Total Arrests by County – All Ages 5-year average criminal justice data, 1999 - 2003
County Homicide Aggravated Assault
Sexual Assault
Other Assault Robbery Burglary Larceny Auto
Theft DUI Liquor Laws
Stolen Property Prostitution Drug
Laws Atlantic 10 528 34 1964 199 334 1943 70 1,875 221 224 195 2,086 Bergen 8 592 30 2348 203 407 2860 80 2,520 731 419 50 2,680 Burlington 6 347 23 2041 142 304 1310 85 1,729 458 274 29 2,005 Camden 31 1025 59 3096 287 538 2316 93 2,714 555 612 83 4,218 Cape May 2 192 13 662 47 191 639 29 868 2,292 84 2 1,007 Cumberland 6 399 32 1301 187 405 1024 53 990 49 182 48 1,137 Essex 71 2117 118 3507 936 975 2874 150 992 365 1886 513 11,933 Gloucester 5 267 20 1254 76 241 1203 66 1,264 495 194 6 1,566 Hudson 29 1437 26 2430 707 486 2037 65 899 297 687 200 5,731 Hunterdon 0 36 2 196 3 45 155 16 482 63 27 1 549 Mercer 17 407 47 1555 228 296 1358 82 1,012 1,097 508 108 2,955 Middlesex 9 631 48 1924 185 389 2225 91 2,131 372 417 79 2,590 Monmouth 9 576 33 2324 174 422 2176 91 2,591 1,297 339 119 4,058 Morris 5 280 13 891 61 230 1001 52 1,893 516 162 26 1,574 Ocean 4 472 26 1507 93 372 1197 67 2,044 761 139 50 2,672 Passaic 27 721 31 2159 272 405 1599 185 1,364 240 356 336 3,692 Salem 2 88 6 374 17 96 206 15 452 63 43 1 383 Somerset 4 82 9 835 39 97 777 26 925 192 68 20 756 Sussex 1 76 5 415 11 94 228 22 600 115 27 0 370 Union 23 383 30 1989 295 319 1970 96 972 398 534 536 4,054 Warren 1 58 4 329 15 65 316 18 386 120 28 0 421 New Jersey 268 10,712 611 33,102 4,176 6,710 29,415 1,453 28,703 10,697 7208 2,401 56,436
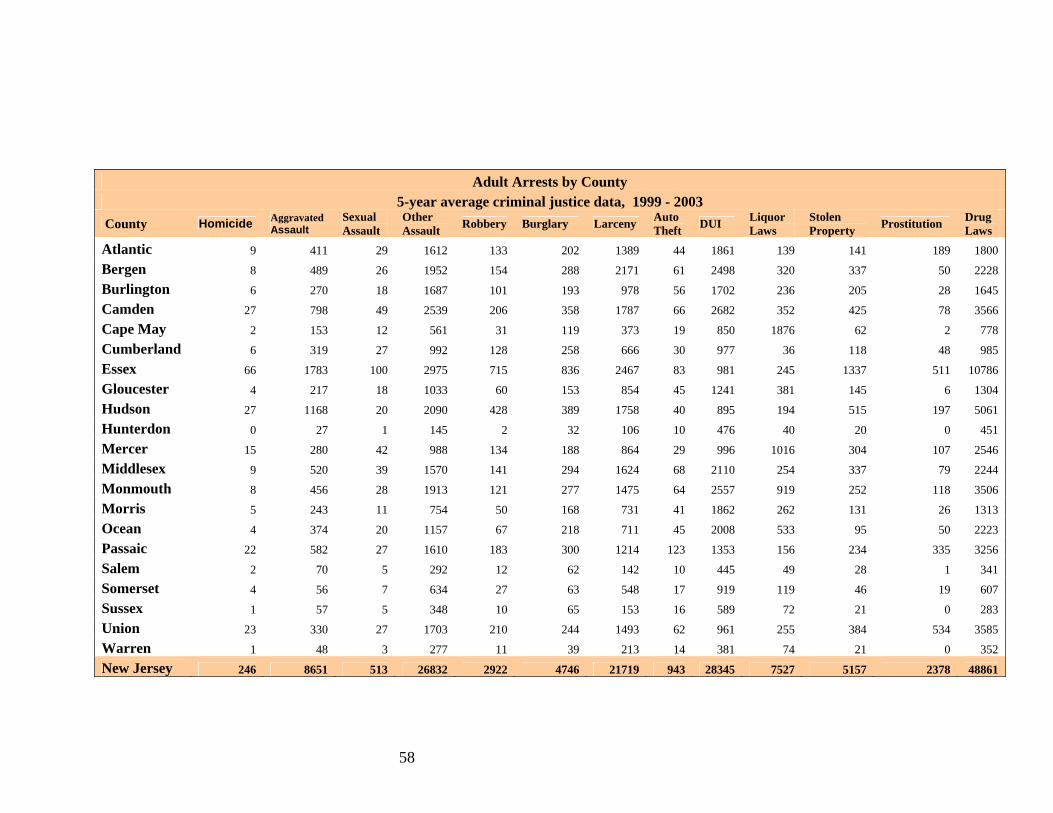
58
Adult Arrests by County 5-year average criminal justice data, 1999 - 2003
County Homicide Aggravated Assault
Sexual Assault
Other Assault Robbery Burglary Larceny Auto
Theft DUI Liquor Laws
Stolen Property Prostitution Drug
Laws Atlantic 9 411 29 1612 133 202 1389 44 1861 139 141 189 1800 Bergen 8 489 26 1952 154 288 2171 61 2498 320 337 50 2228 Burlington 6 270 18 1687 101 193 978 56 1702 236 205 28 1645 Camden 27 798 49 2539 206 358 1787 66 2682 352 425 78 3566 Cape May 2 153 12 561 31 119 373 19 850 1876 62 2 778 Cumberland 6 319 27 992 128 258 666 30 977 36 118 48 985 Essex 66 1783 100 2975 715 836 2467 83 981 245 1337 511 10786 Gloucester 4 217 18 1033 60 153 854 45 1241 381 145 6 1304 Hudson 27 1168 20 2090 428 389 1758 40 895 194 515 197 5061 Hunterdon 0 27 1 145 2 32 106 10 476 40 20 0 451 Mercer 15 280 42 988 134 188 864 29 996 1016 304 107 2546 Middlesex 9 520 39 1570 141 294 1624 68 2110 254 337 79 2244 Monmouth 8 456 28 1913 121 277 1475 64 2557 919 252 118 3506 Morris 5 243 11 754 50 168 731 41 1862 262 131 26 1313 Ocean 4 374 20 1157 67 218 711 45 2008 533 95 50 2223 Passaic 22 582 27 1610 183 300 1214 123 1353 156 234 335 3256 Salem 2 70 5 292 12 62 142 10 445 49 28 1 341 Somerset 4 56 7 634 27 63 548 17 919 119 46 19 607 Sussex 1 57 5 348 10 65 153 16 589 72 21 0 283 Union 23 330 27 1703 210 244 1493 62 961 255 384 534 3585 Warren 1 48 3 277 11 39 213 14 381 74 21 0 352 New Jersey 246 8651 513 26832 2922 4746 21719 943 28345 7527 5157 2378 48861
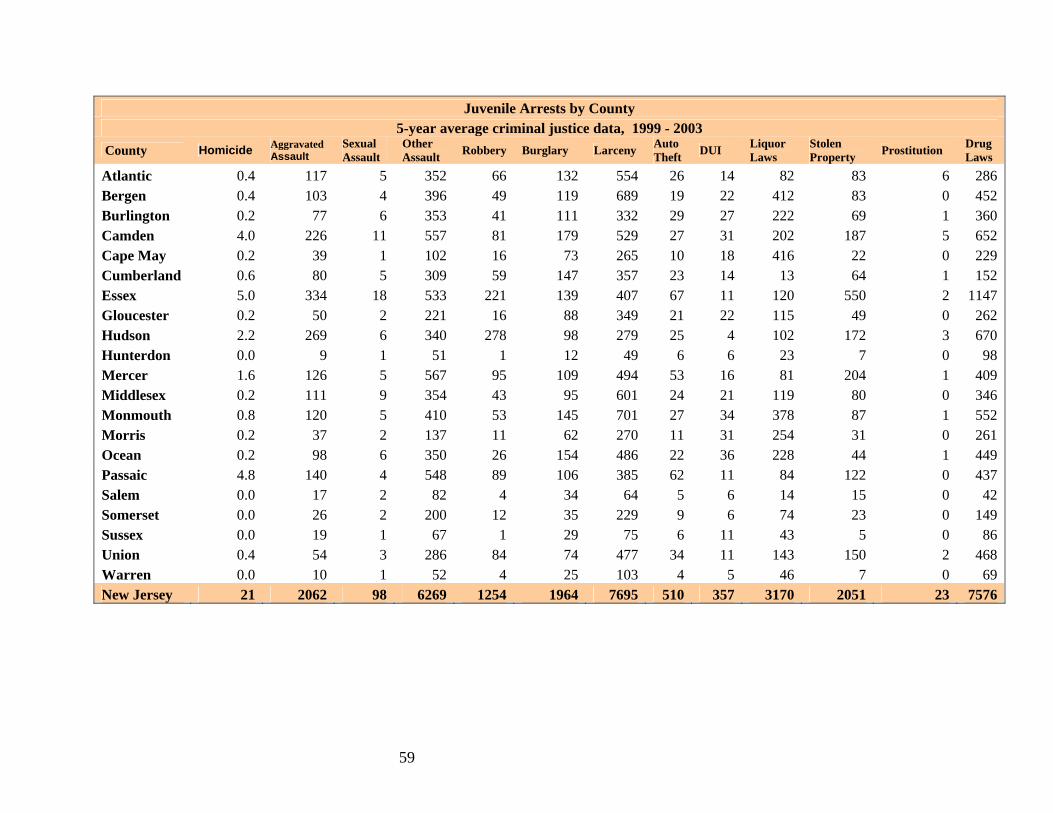
59
Juvenile Arrests by County 5-year average criminal justice data, 1999 - 2003
County Homicide Aggravated Assault
Sexual Assault
Other Assault Robbery Burglary Larceny Auto
Theft DUI Liquor Laws
Stolen Property Prostitution Drug
Laws Atlantic 0.4 117 5 352 66 132 554 26 14 82 83 6 286 Bergen 0.4 103 4 396 49 119 689 19 22 412 83 0 452 Burlington 0.2 77 6 353 41 111 332 29 27 222 69 1 360 Camden 4.0 226 11 557 81 179 529 27 31 202 187 5 652 Cape May 0.2 39 1 102 16 73 265 10 18 416 22 0 229 Cumberland 0.6 80 5 309 59 147 357 23 14 13 64 1 152 Essex 5.0 334 18 533 221 139 407 67 11 120 550 2 1147 Gloucester 0.2 50 2 221 16 88 349 21 22 115 49 0 262 Hudson 2.2 269 6 340 278 98 279 25 4 102 172 3 670 Hunterdon 0.0 9 1 51 1 12 49 6 6 23 7 0 98 Mercer 1.6 126 5 567 95 109 494 53 16 81 204 1 409 Middlesex 0.2 111 9 354 43 95 601 24 21 119 80 0 346 Monmouth 0.8 120 5 410 53 145 701 27 34 378 87 1 552 Morris 0.2 37 2 137 11 62 270 11 31 254 31 0 261 Ocean 0.2 98 6 350 26 154 486 22 36 228 44 1 449 Passaic 4.8 140 4 548 89 106 385 62 11 84 122 0 437 Salem 0.0 17 2 82 4 34 64 5 6 14 15 0 42 Somerset 0.0 26 2 200 12 35 229 9 6 74 23 0 149 Sussex 0.0 19 1 67 1 29 75 6 11 43 5 0 86 Union 0.4 54 3 286 84 74 477 34 11 143 150 2 468 Warren 0.0 10 1 52 4 25 103 4 5 46 7 0 69 New Jersey 21 2062 98 6269 1254 1964 7695 510 357 3170 2051 23 7576
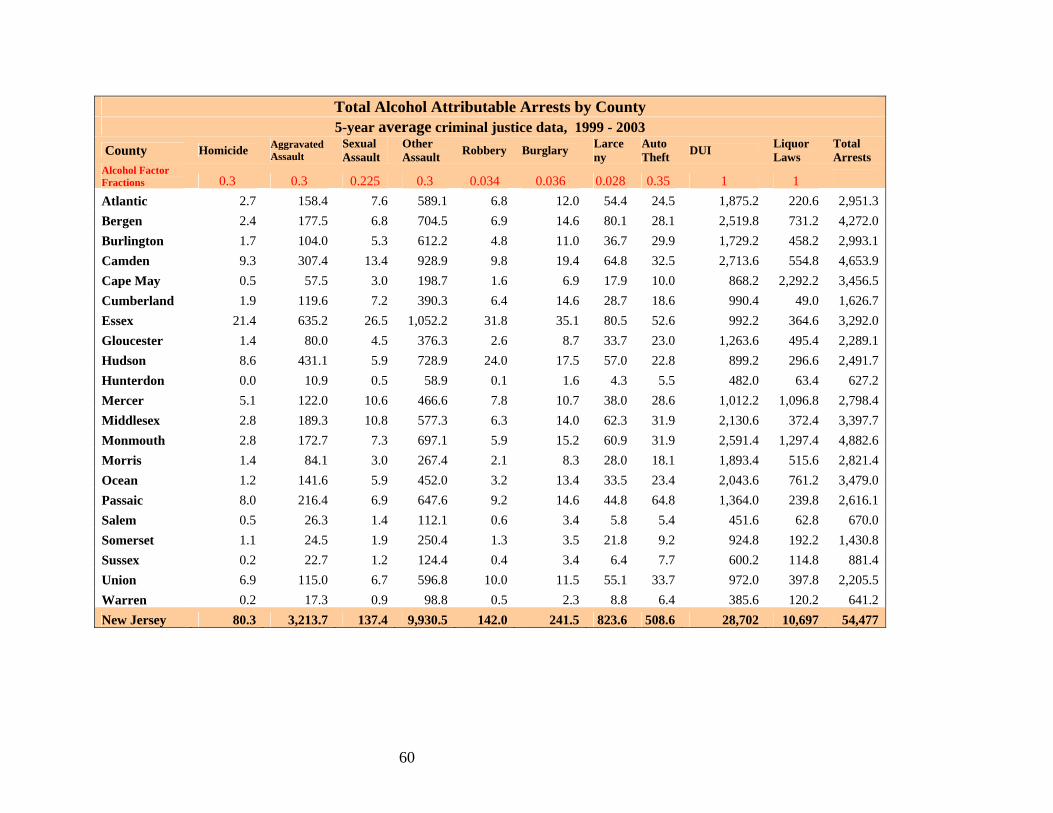
60
Total Alcohol Attributable Arrests by County 5-year average criminal justice data, 1999 - 2003
County Homicide Aggravated Assault
Sexual Assault
Other Assault Robbery Burglary Larce
ny Auto Theft DUI Liquor
Laws Total Arrests
Alcohol Factor Fractions 0.3 0.3 0.225 0.3 0.034 0.036 0.028 0.35 1 1
Atlantic 2.7 158.4 7.6 589.1 6.8 12.0 54.4 24.5 1,875.2 220.6 2,951.3 Bergen 2.4 177.5 6.8 704.5 6.9 14.6 80.1 28.1 2,519.8 731.2 4,272.0 Burlington 1.7 104.0 5.3 612.2 4.8 11.0 36.7 29.9 1,729.2 458.2 2,993.1 Camden 9.3 307.4 13.4 928.9 9.8 19.4 64.8 32.5 2,713.6 554.8 4,653.9 Cape May 0.5 57.5 3.0 198.7 1.6 6.9 17.9 10.0 868.2 2,292.2 3,456.5 Cumberland 1.9 119.6 7.2 390.3 6.4 14.6 28.7 18.6 990.4 49.0 1,626.7 Essex 21.4 635.2 26.5 1,052.2 31.8 35.1 80.5 52.6 992.2 364.6 3,292.0 Gloucester 1.4 80.0 4.5 376.3 2.6 8.7 33.7 23.0 1,263.6 495.4 2,289.1 Hudson 8.6 431.1 5.9 728.9 24.0 17.5 57.0 22.8 899.2 296.6 2,491.7 Hunterdon 0.0 10.9 0.5 58.9 0.1 1.6 4.3 5.5 482.0 63.4 627.2 Mercer 5.1 122.0 10.6 466.6 7.8 10.7 38.0 28.6 1,012.2 1,096.8 2,798.4 Middlesex 2.8 189.3 10.8 577.3 6.3 14.0 62.3 31.9 2,130.6 372.4 3,397.7 Monmouth 2.8 172.7 7.3 697.1 5.9 15.2 60.9 31.9 2,591.4 1,297.4 4,882.6 Morris 1.4 84.1 3.0 267.4 2.1 8.3 28.0 18.1 1,893.4 515.6 2,821.4 Ocean 1.2 141.6 5.9 452.0 3.2 13.4 33.5 23.4 2,043.6 761.2 3,479.0 Passaic 8.0 216.4 6.9 647.6 9.2 14.6 44.8 64.8 1,364.0 239.8 2,616.1 Salem 0.5 26.3 1.4 112.1 0.6 3.4 5.8 5.4 451.6 62.8 670.0 Somerset 1.1 24.5 1.9 250.4 1.3 3.5 21.8 9.2 924.8 192.2 1,430.8 Sussex 0.2 22.7 1.2 124.4 0.4 3.4 6.4 7.7 600.2 114.8 881.4 Union 6.9 115.0 6.7 596.8 10.0 11.5 55.1 33.7 972.0 397.8 2,205.5 Warren 0.2 17.3 0.9 98.8 0.5 2.3 8.8 6.4 385.6 120.2 641.2 New Jersey 80.3 3,213.7 137.4 9,930.5 142.0 241.5 823.6 508.6 28,702 10,697 54,477
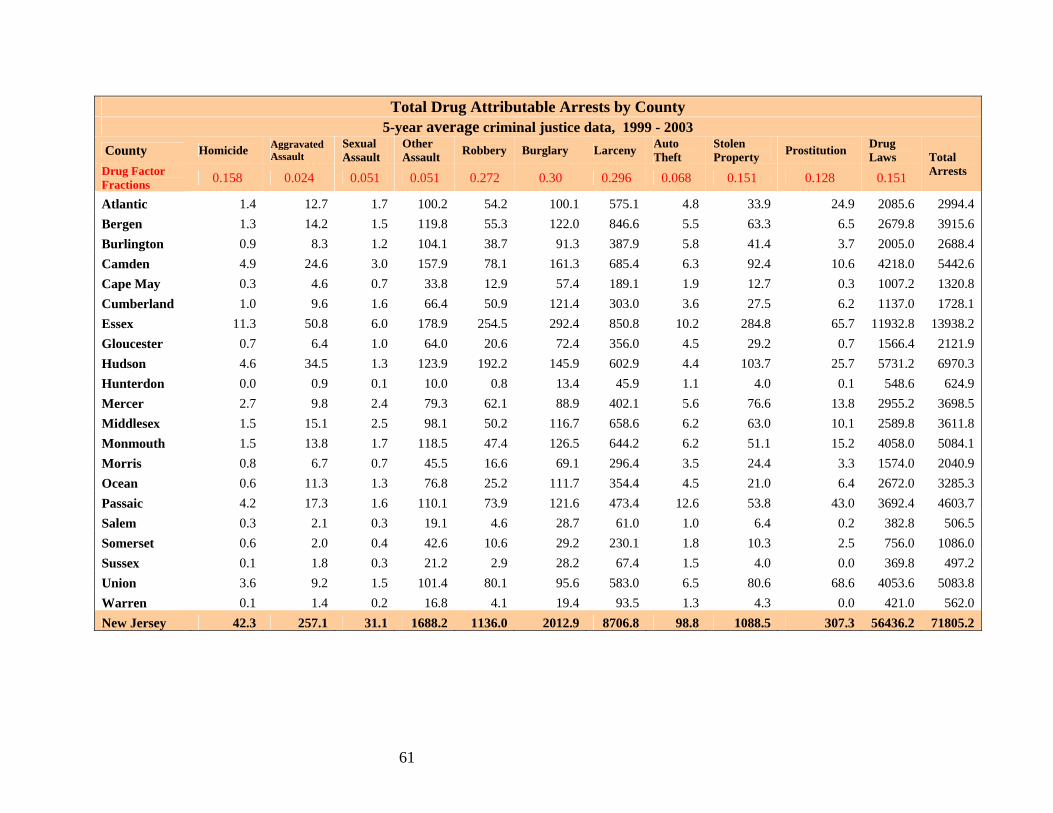
61
Total Drug Attributable Arrests by County 5-year average criminal justice data, 1999 - 2003
County Homicide Aggravated Assault
Sexual Assault
Other Assault Robbery Burglary Larceny Auto
Theft Stolen Property Prostitution Drug
Laws Drug Factor Fractions 0.158 0.024 0.051 0.051 0.272 0.30 0.296 0.068 0.151 0.128 0.151
Total Arrests
Atlantic 1.4 12.7 1.7 100.2 54.2 100.1 575.1 4.8 33.9 24.9 2085.6 2994.4 Bergen 1.3 14.2 1.5 119.8 55.3 122.0 846.6 5.5 63.3 6.5 2679.8 3915.6 Burlington 0.9 8.3 1.2 104.1 38.7 91.3 387.9 5.8 41.4 3.7 2005.0 2688.4 Camden 4.9 24.6 3.0 157.9 78.1 161.3 685.4 6.3 92.4 10.6 4218.0 5442.6 Cape May 0.3 4.6 0.7 33.8 12.9 57.4 189.1 1.9 12.7 0.3 1007.2 1320.8 Cumberland 1.0 9.6 1.6 66.4 50.9 121.4 303.0 3.6 27.5 6.2 1137.0 1728.1 Essex 11.3 50.8 6.0 178.9 254.5 292.4 850.8 10.2 284.8 65.7 11932.8 13938.2 Gloucester 0.7 6.4 1.0 64.0 20.6 72.4 356.0 4.5 29.2 0.7 1566.4 2121.9 Hudson 4.6 34.5 1.3 123.9 192.2 145.9 602.9 4.4 103.7 25.7 5731.2 6970.3 Hunterdon 0.0 0.9 0.1 10.0 0.8 13.4 45.9 1.1 4.0 0.1 548.6 624.9 Mercer 2.7 9.8 2.4 79.3 62.1 88.9 402.1 5.6 76.6 13.8 2955.2 3698.5 Middlesex 1.5 15.1 2.5 98.1 50.2 116.7 658.6 6.2 63.0 10.1 2589.8 3611.8 Monmouth 1.5 13.8 1.7 118.5 47.4 126.5 644.2 6.2 51.1 15.2 4058.0 5084.1 Morris 0.8 6.7 0.7 45.5 16.6 69.1 296.4 3.5 24.4 3.3 1574.0 2040.9 Ocean 0.6 11.3 1.3 76.8 25.2 111.7 354.4 4.5 21.0 6.4 2672.0 3285.3 Passaic 4.2 17.3 1.6 110.1 73.9 121.6 473.4 12.6 53.8 43.0 3692.4 4603.7 Salem 0.3 2.1 0.3 19.1 4.6 28.7 61.0 1.0 6.4 0.2 382.8 506.5 Somerset 0.6 2.0 0.4 42.6 10.6 29.2 230.1 1.8 10.3 2.5 756.0 1086.0 Sussex 0.1 1.8 0.3 21.2 2.9 28.2 67.4 1.5 4.0 0.0 369.8 497.2 Union 3.6 9.2 1.5 101.4 80.1 95.6 583.0 6.5 80.6 68.6 4053.6 5083.8 Warren 0.1 1.4 0.2 16.8 4.1 19.4 93.5 1.3 4.3 0.0 421.0 562.0 New Jersey 42.3 257.1 31.1 1688.2 1136.0 2012.9 8706.8 98.8 1088.5 307.3 56436.2 71805.2
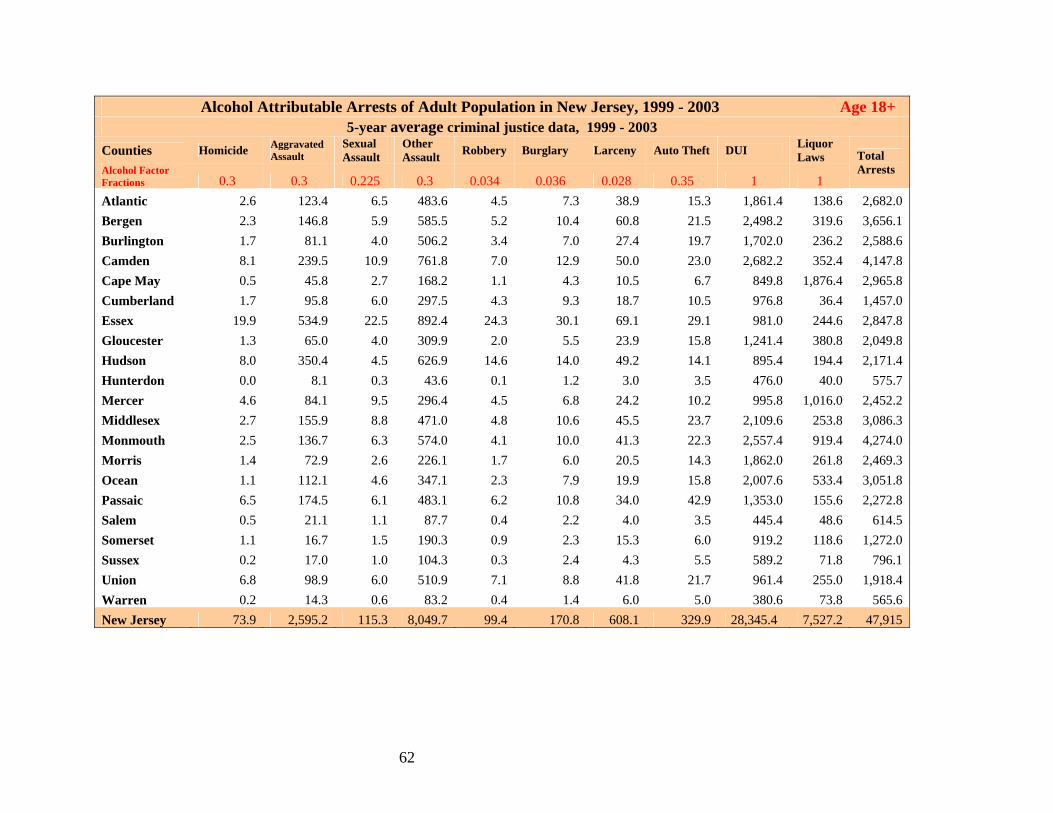
62
Alcohol Attributable Arrests of Adult Population in New Jersey, 1999 - 2003 Age 18+ 5-year average criminal justice data, 1999 - 2003
Counties Homicide Aggravated Assault
Sexual Assault
Other Assault Robbery Burglary Larceny Auto Theft DUI Liquor
Laws Alcohol Factor Fractions 0.3 0.3 0.225 0.3 0.034 0.036 0.028 0.35 1 1
Total Arrests
Atlantic 2.6 123.4 6.5 483.6 4.5 7.3 38.9 15.3 1,861.4 138.6 2,682.0 Bergen 2.3 146.8 5.9 585.5 5.2 10.4 60.8 21.5 2,498.2 319.6 3,656.1 Burlington 1.7 81.1 4.0 506.2 3.4 7.0 27.4 19.7 1,702.0 236.2 2,588.6 Camden 8.1 239.5 10.9 761.8 7.0 12.9 50.0 23.0 2,682.2 352.4 4,147.8 Cape May 0.5 45.8 2.7 168.2 1.1 4.3 10.5 6.7 849.8 1,876.4 2,965.8 Cumberland 1.7 95.8 6.0 297.5 4.3 9.3 18.7 10.5 976.8 36.4 1,457.0 Essex 19.9 534.9 22.5 892.4 24.3 30.1 69.1 29.1 981.0 244.6 2,847.8 Gloucester 1.3 65.0 4.0 309.9 2.0 5.5 23.9 15.8 1,241.4 380.8 2,049.8 Hudson 8.0 350.4 4.5 626.9 14.6 14.0 49.2 14.1 895.4 194.4 2,171.4 Hunterdon 0.0 8.1 0.3 43.6 0.1 1.2 3.0 3.5 476.0 40.0 575.7 Mercer 4.6 84.1 9.5 296.4 4.5 6.8 24.2 10.2 995.8 1,016.0 2,452.2 Middlesex 2.7 155.9 8.8 471.0 4.8 10.6 45.5 23.7 2,109.6 253.8 3,086.3 Monmouth 2.5 136.7 6.3 574.0 4.1 10.0 41.3 22.3 2,557.4 919.4 4,274.0 Morris 1.4 72.9 2.6 226.1 1.7 6.0 20.5 14.3 1,862.0 261.8 2,469.3 Ocean 1.1 112.1 4.6 347.1 2.3 7.9 19.9 15.8 2,007.6 533.4 3,051.8 Passaic 6.5 174.5 6.1 483.1 6.2 10.8 34.0 42.9 1,353.0 155.6 2,272.8 Salem 0.5 21.1 1.1 87.7 0.4 2.2 4.0 3.5 445.4 48.6 614.5 Somerset 1.1 16.7 1.5 190.3 0.9 2.3 15.3 6.0 919.2 118.6 1,272.0 Sussex 0.2 17.0 1.0 104.3 0.3 2.4 4.3 5.5 589.2 71.8 796.1 Union 6.8 98.9 6.0 510.9 7.1 8.8 41.8 21.7 961.4 255.0 1,918.4 Warren 0.2 14.3 0.6 83.2 0.4 1.4 6.0 5.0 380.6 73.8 565.6 New Jersey 73.9 2,595.2 115.3 8,049.7 99.4 170.8 608.1 329.9 28,345.4 7,527.2 47,915

63
Alcohol Attributable Arrests of Juvenile Population in New Jersey, 1999 - 2003 Age <18 5-year average criminal justice data, 1999 - 2003
County Homicide Aggravated Assault
Sexual Assault
Other Assault Robbery Burglary Larceny Auto
Theft DUI Liquor Laws
Alcohol Factor Fractions 0.3 0.3 0.225 0.3 0.034 0.036 0.028 0.35 1 1
Total Arrests
Atlantic 0.1 35.0 1.1 105.5 2.3 4.7 15.5 9.2 13.8 82.0 269 Bergen 0.1 30.8 0.9 118.9 1.7 4.3 19.3 6.7 21.6 411.6 616 Burlington 0.1 23.0 1.3 106.0 1.4 4.0 9.3 10.2 27.2 222.0 404 Camden 1.2 67.9 2.4 167.2 2.8 6.5 14.8 9.5 31.4 202.4 506 Cape May 0.1 11.7 0.3 30.5 0.6 2.6 7.4 3.4 18.4 415.8 491 Cumberland 0.2 23.9 1.2 92.8 2.0 5.3 10.0 8.1 13.6 12.6 170 Essex 1.5 100.3 4.0 159.8 7.5 5.0 11.4 23.5 11.2 120.0 444 Gloucester 0.1 14.9 0.5 66.4 0.5 3.2 9.8 7.2 22.2 114.6 239 Hudson 0.7 80.7 1.4 102.1 9.5 3.5 7.8 8.7 3.8 102.2 320 Hunterdon 0.0 2.8 0.2 15.2 0.0 0.4 1.4 2.0 6.0 23.4 51 Mercer 0.5 37.9 1.1 170.2 3.2 3.9 13.8 18.4 16.4 80.8 346 Middlesex 0.1 33.4 2.1 106.3 1.5 3.4 16.8 8.3 21.0 118.6 311 Monmouth 0.2 36.1 1.0 123.1 1.8 5.2 19.6 9.5 34.0 378.0 609 Morris 0.1 11.2 0.4 41.2 0.4 2.2 7.6 3.9 31.4 253.8 352 Ocean 0.1 29.5 1.4 104.9 0.9 5.5 13.6 7.6 36.0 227.8 427 Passaic 1.4 41.9 0.8 164.5 3.0 3.8 10.8 21.8 11.0 84.2 343 Salem 0.0 5.2 0.4 24.5 0.1 1.2 1.8 1.9 6.2 14.2 56 Somerset 0.0 7.7 0.5 60.1 0.4 1.2 6.4 3.3 5.6 73.6 159 Sussex 0.0 5.7 0.1 20.2 0.0 1.0 2.1 2.2 11.0 43.0 85 Union 0.1 16.1 0.7 85.9 2.9 2.7 13.4 12.0 10.6 142.8 287 Warren 0.0 2.9 0.3 15.6 0.1 0.9 2.9 1.4 5.0 46.4 76 New Jersey 6.42 618.54 22.05 1880.76 42.64 70.70 215.47 178.64 357.40 3,169.8 6,562
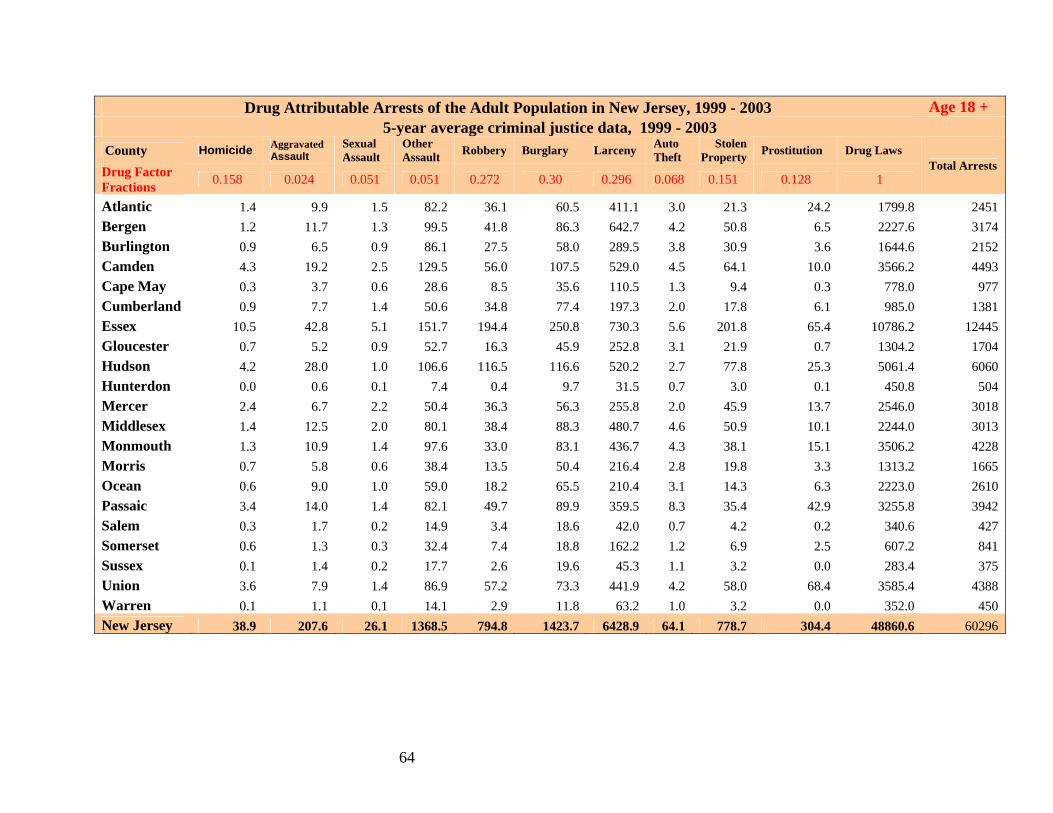
64
Drug Attributable Arrests of the Adult Population in New Jersey, 1999 - 2003 Age 18 + 5-year average criminal justice data, 1999 - 2003
County Homicide Aggravated Assault
Sexual Assault
Other Assault Robbery Burglary Larceny Auto
Theft Stolen
Property Prostitution Drug Laws
Drug Factor Fractions 0.158 0.024 0.051 0.051 0.272 0.30 0.296 0.068 0.151 0.128 1
Total Arrests
Atlantic 1.4 9.9 1.5 82.2 36.1 60.5 411.1 3.0 21.3 24.2 1799.8 2451 Bergen 1.2 11.7 1.3 99.5 41.8 86.3 642.7 4.2 50.8 6.5 2227.6 3174 Burlington 0.9 6.5 0.9 86.1 27.5 58.0 289.5 3.8 30.9 3.6 1644.6 2152 Camden 4.3 19.2 2.5 129.5 56.0 107.5 529.0 4.5 64.1 10.0 3566.2 4493 Cape May 0.3 3.7 0.6 28.6 8.5 35.6 110.5 1.3 9.4 0.3 778.0 977 Cumberland 0.9 7.7 1.4 50.6 34.8 77.4 197.3 2.0 17.8 6.1 985.0 1381 Essex 10.5 42.8 5.1 151.7 194.4 250.8 730.3 5.6 201.8 65.4 10786.2 12445 Gloucester 0.7 5.2 0.9 52.7 16.3 45.9 252.8 3.1 21.9 0.7 1304.2 1704 Hudson 4.2 28.0 1.0 106.6 116.5 116.6 520.2 2.7 77.8 25.3 5061.4 6060 Hunterdon 0.0 0.6 0.1 7.4 0.4 9.7 31.5 0.7 3.0 0.1 450.8 504 Mercer 2.4 6.7 2.2 50.4 36.3 56.3 255.8 2.0 45.9 13.7 2546.0 3018 Middlesex 1.4 12.5 2.0 80.1 38.4 88.3 480.7 4.6 50.9 10.1 2244.0 3013 Monmouth 1.3 10.9 1.4 97.6 33.0 83.1 436.7 4.3 38.1 15.1 3506.2 4228 Morris 0.7 5.8 0.6 38.4 13.5 50.4 216.4 2.8 19.8 3.3 1313.2 1665 Ocean 0.6 9.0 1.0 59.0 18.2 65.5 210.4 3.1 14.3 6.3 2223.0 2610 Passaic 3.4 14.0 1.4 82.1 49.7 89.9 359.5 8.3 35.4 42.9 3255.8 3942 Salem 0.3 1.7 0.2 14.9 3.4 18.6 42.0 0.7 4.2 0.2 340.6 427 Somerset 0.6 1.3 0.3 32.4 7.4 18.8 162.2 1.2 6.9 2.5 607.2 841 Sussex 0.1 1.4 0.2 17.7 2.6 19.6 45.3 1.1 3.2 0.0 283.4 375 Union 3.6 7.9 1.4 86.9 57.2 73.3 441.9 4.2 58.0 68.4 3585.4 4388 Warren 0.1 1.1 0.1 14.1 2.9 11.8 63.2 1.0 3.2 0.0 352.0 450 New Jersey 38.9 207.6 26.1 1368.5 794.8 1423.7 6428.9 64.1 778.7 304.4 48860.6 60296
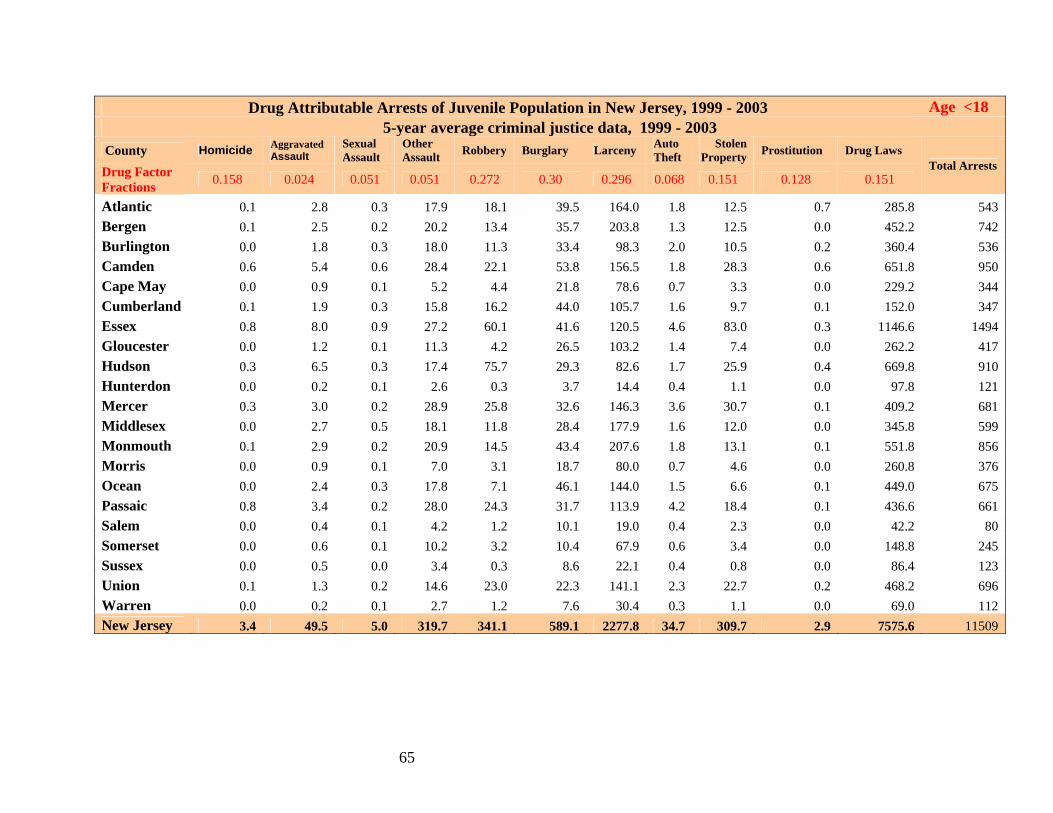
65
Drug Attributable Arrests of Juvenile Population in New Jersey, 1999 - 2003 Age <18 5-year average criminal justice data, 1999 - 2003
County Homicide Aggravated Assault
Sexual Assault
Other Assault Robbery Burglary Larceny Auto
Theft Stolen
Property Prostitution Drug Laws
Drug Factor Fractions 0.158 0.024 0.051 0.051 0.272 0.30 0.296 0.068 0.151 0.128 0.151
Total Arrests
Atlantic 0.1 2.8 0.3 17.9 18.1 39.5 164.0 1.8 12.5 0.7 285.8 543 Bergen 0.1 2.5 0.2 20.2 13.4 35.7 203.8 1.3 12.5 0.0 452.2 742 Burlington 0.0 1.8 0.3 18.0 11.3 33.4 98.3 2.0 10.5 0.2 360.4 536 Camden 0.6 5.4 0.6 28.4 22.1 53.8 156.5 1.8 28.3 0.6 651.8 950 Cape May 0.0 0.9 0.1 5.2 4.4 21.8 78.6 0.7 3.3 0.0 229.2 344 Cumberland 0.1 1.9 0.3 15.8 16.2 44.0 105.7 1.6 9.7 0.1 152.0 347 Essex 0.8 8.0 0.9 27.2 60.1 41.6 120.5 4.6 83.0 0.3 1146.6 1494 Gloucester 0.0 1.2 0.1 11.3 4.2 26.5 103.2 1.4 7.4 0.0 262.2 417 Hudson 0.3 6.5 0.3 17.4 75.7 29.3 82.6 1.7 25.9 0.4 669.8 910 Hunterdon 0.0 0.2 0.1 2.6 0.3 3.7 14.4 0.4 1.1 0.0 97.8 121 Mercer 0.3 3.0 0.2 28.9 25.8 32.6 146.3 3.6 30.7 0.1 409.2 681 Middlesex 0.0 2.7 0.5 18.1 11.8 28.4 177.9 1.6 12.0 0.0 345.8 599 Monmouth 0.1 2.9 0.2 20.9 14.5 43.4 207.6 1.8 13.1 0.1 551.8 856 Morris 0.0 0.9 0.1 7.0 3.1 18.7 80.0 0.7 4.6 0.0 260.8 376 Ocean 0.0 2.4 0.3 17.8 7.1 46.1 144.0 1.5 6.6 0.1 449.0 675 Passaic 0.8 3.4 0.2 28.0 24.3 31.7 113.9 4.2 18.4 0.1 436.6 661 Salem 0.0 0.4 0.1 4.2 1.2 10.1 19.0 0.4 2.3 0.0 42.2 80 Somerset 0.0 0.6 0.1 10.2 3.2 10.4 67.9 0.6 3.4 0.0 148.8 245 Sussex 0.0 0.5 0.0 3.4 0.3 8.6 22.1 0.4 0.8 0.0 86.4 123 Union 0.1 1.3 0.2 14.6 23.0 22.3 141.1 2.3 22.7 0.2 468.2 696 Warren 0.0 0.2 0.1 2.7 1.2 7.6 30.4 0.3 1.1 0.0 69.0 112 New Jersey 3.4 49.5 5.0 319.7 341.1 589.1 2277.8 34.7 309.7 2.9 7575.6 11509

66
Total Alcohol Attributable Arrest Rates / 100,000 in New Jersey 5-year average criminal justice data, 1999 - 2003
County Homicide Aggravated Assault
Sexual Assault
Other Assault Robbery Burglary Larceny Auto
Theft DUI Liquor Laws
Total Arrests
Atlantic 1.1 62.0 3.0 230.7 2.7 4.7 21.3 9.6 734.3 86.4 1155.8 Bergen 0.3 19.9 0.8 79.1 0.8 1.6 9.0 3.2 282.8 82.1 479.5 Burlington 0.4 24.2 1.2 142.3 1.1 2.5 8.5 6.9 401.9 106.5 695.6 Camden 1.8 60.4 2.6 182.4 1.9 3.8 12.7 6.4 532.9 109.0 913.9 Cape May 0.5 56.4 3.0 194.7 1.6 6.7 17.5 9.8 850.9 2246.6 3387.8 Cumberland 1.3 81.5 4.9 265.8 4.3 9.9 19.5 12.7 674.6 33.4 1108.0 Essex 2.7 80.0 3.3 132.4 4.0 4.4 10.1 6.6 124.9 45.9 414.4 Gloucester 0.5 31.0 1.7 145.9 1.0 3.4 13.1 8.9 490.0 192.1 887.6 Hudson 1.4 70.3 1.0 118.9 3.9 2.9 9.3 3.7 146.6 48.4 406.3 Hunterdon 0.0 8.7 0.4 47.1 0.1 1.3 3.5 4.4 385.7 50.7 501.9 Mercer 1.4 34.4 3.0 131.5 2.2 3.0 10.7 8.1 285.2 309.1 788.6 Middlesex 0.4 24.8 1.4 75.6 0.8 1.8 8.2 4.2 279.1 48.8 445.1 Monmouth 0.4 27.8 1.2 112.0 1.0 2.4 9.8 5.1 416.4 208.5 784.5 Morris 0.3 17.8 0.6 56.4 0.4 1.7 5.9 3.8 399.5 108.8 595.4 Ocean 0.2 27.0 1.1 86.3 0.6 2.6 6.4 4.5 390.0 145.3 664.0 Passaic 1.6 43.8 1.4 131.0 1.9 3.0 9.1 13.1 276.0 48.5 529.3 Salem 0.8 40.9 2.2 174.6 0.9 5.4 9.0 8.4 703.0 97.8 1042.9 Somerset 0.4 8.1 0.6 82.6 0.4 1.2 7.2 3.0 305.1 63.4 472.0 Sussex 0.2 15.5 0.8 84.9 0.3 2.3 4.3 5.3 409.5 78.3 601.4 Union 1.3 21.8 1.3 113.3 1.9 2.2 10.5 6.4 184.6 75.6 418.9 Warren 0.2 16.4 0.9 93.5 0.5 2.2 8.4 6.1 365.0 113.8 606.9 New Jersey 0.9 37.8 1.6 116.8 1.7 2.8 9.7 6.0 337.5 125.8 640.6
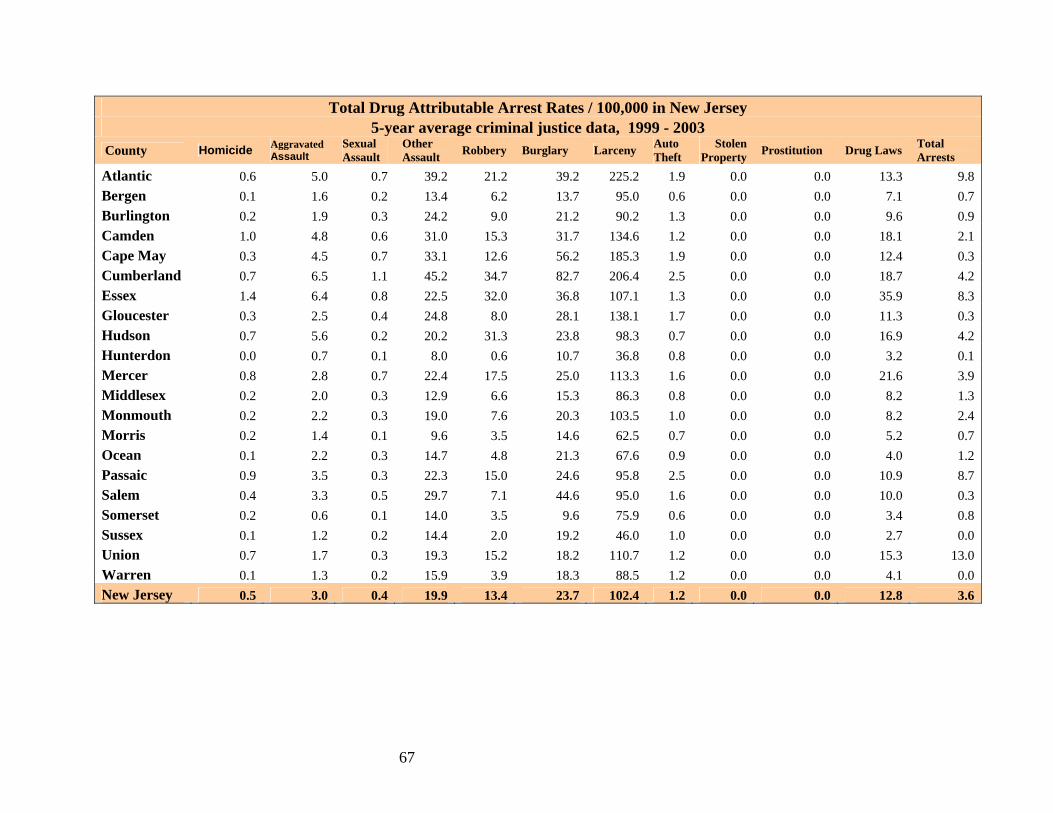
67
Total Drug Attributable Arrest Rates / 100,000 in New Jersey 5-year average criminal justice data, 1999 - 2003
County Homicide Aggravated Assault
Sexual Assault
Other Assault Robbery Burglary Larceny Auto
Theft Stolen
Property Prostitution Drug Laws Total Arrests
Atlantic 0.6 5.0 0.7 39.2 21.2 39.2 225.2 1.9 0.0 0.0 13.3 9.8 Bergen 0.1 1.6 0.2 13.4 6.2 13.7 95.0 0.6 0.0 0.0 7.1 0.7 Burlington 0.2 1.9 0.3 24.2 9.0 21.2 90.2 1.3 0.0 0.0 9.6 0.9 Camden 1.0 4.8 0.6 31.0 15.3 31.7 134.6 1.2 0.0 0.0 18.1 2.1 Cape May 0.3 4.5 0.7 33.1 12.6 56.2 185.3 1.9 0.0 0.0 12.4 0.3 Cumberland 0.7 6.5 1.1 45.2 34.7 82.7 206.4 2.5 0.0 0.0 18.7 4.2 Essex 1.4 6.4 0.8 22.5 32.0 36.8 107.1 1.3 0.0 0.0 35.9 8.3 Gloucester 0.3 2.5 0.4 24.8 8.0 28.1 138.1 1.7 0.0 0.0 11.3 0.3 Hudson 0.7 5.6 0.2 20.2 31.3 23.8 98.3 0.7 0.0 0.0 16.9 4.2 Hunterdon 0.0 0.7 0.1 8.0 0.6 10.7 36.8 0.8 0.0 0.0 3.2 0.1 Mercer 0.8 2.8 0.7 22.4 17.5 25.0 113.3 1.6 0.0 0.0 21.6 3.9 Middlesex 0.2 2.0 0.3 12.9 6.6 15.3 86.3 0.8 0.0 0.0 8.2 1.3 Monmouth 0.2 2.2 0.3 19.0 7.6 20.3 103.5 1.0 0.0 0.0 8.2 2.4 Morris 0.2 1.4 0.1 9.6 3.5 14.6 62.5 0.7 0.0 0.0 5.2 0.7 Ocean 0.1 2.2 0.3 14.7 4.8 21.3 67.6 0.9 0.0 0.0 4.0 1.2 Passaic 0.9 3.5 0.3 22.3 15.0 24.6 95.8 2.5 0.0 0.0 10.9 8.7 Salem 0.4 3.3 0.5 29.7 7.1 44.6 95.0 1.6 0.0 0.0 10.0 0.3 Somerset 0.2 0.6 0.1 14.0 3.5 9.6 75.9 0.6 0.0 0.0 3.4 0.8 Sussex 0.1 1.2 0.2 14.4 2.0 19.2 46.0 1.0 0.0 0.0 2.7 0.0 Union 0.7 1.7 0.3 19.3 15.2 18.2 110.7 1.2 0.0 0.0 15.3 13.0 Warren 0.1 1.3 0.2 15.9 3.9 18.3 88.5 1.2 0.0 0.0 4.1 0.0 New Jersey 0.5 3.0 0.4 19.9 13.4 23.7 102.4 1.2 0.0 0.0 12.8 3.6

68
Total Alcohol and Drug Attributable Arrest Rates Per 100,000 Population 5-year average criminal justice data, 1999 - 2003
Alcohol Related Arrest Rates Drug Related Arrest Rates Adults Juveniles Total Adults Juveniles Total County
Number Rates Number Rates Number Rates Number Rate Number Rates Number Rates Atlantic 2,682 1,404 269 418 2,951 1,156 2451 1,283 543 845 2994 1,172 Bergen 3,656 531 616 303 4,272 479 3174 461 742 365 3916 440 Burlington 2,589 799 404 381 2,993 696 2152 664 536 505 2688 625 Camden 4,148 1,107 506 376 4,654 914 4493 1,199 950 706 5443 1,069 Cape May 2,966 3,723 491 2,196 3,457 3,388 977 1,226 344 1,539 1321 1,295 Cumberland 1,457 1,327 170 459 1,627 1,108 1381 1,258 347 936 1728 1,177 Essex 2,848 486 444 214 3,292 414 12445 2,122 1494 719 13939 1,755 Gloucester 2,050 1,072 239 359 2,289 888 1704 891 417 626 2121 822 Hudson 2,171 459 320 228 2,491 406 6060 1,281 910 649 6970 1,136 Hunterdon 576 613 51 164 627 502 504 537 121 390 625 500 Mercer 2,452 916 346 397 2,798 788 3018 1,128 681 781 3699 1,042 Middlesex 3,086 531 311 170 3,397 445 3013 519 599 328 3612 473 Monmouth 4,274 924 609 381 4,883 785 4228 914 856 535 5084 817 Morris 2,469 692 352 300 2,821 595 1665 467 376 321 2041 431 Ocean 3,052 756 427 355 3,479 664 2610 646 675 562 3285 627 Passaic 2,273 624 343 263 2,616 529 3942 1,083 661 508 4603 931 Salem 615 1,275 56 350 671 1,045 427 885 80 500 507 789 Somerset 1,272 563 159 206 1,431 472 841 372 245 318 1086 358 Sussex 796 744 85 215 881 601 375 350 123 311 498 340 Union 1,918 486 287 218 2,205 419 4388 1,111 696 529 5084 966 Warren 566 719 76 283 642 608 450 571 112 416 562 532 New Jersey 47,916 748 6,561 312 54,477 641 60298 942 11508 548 71806 844
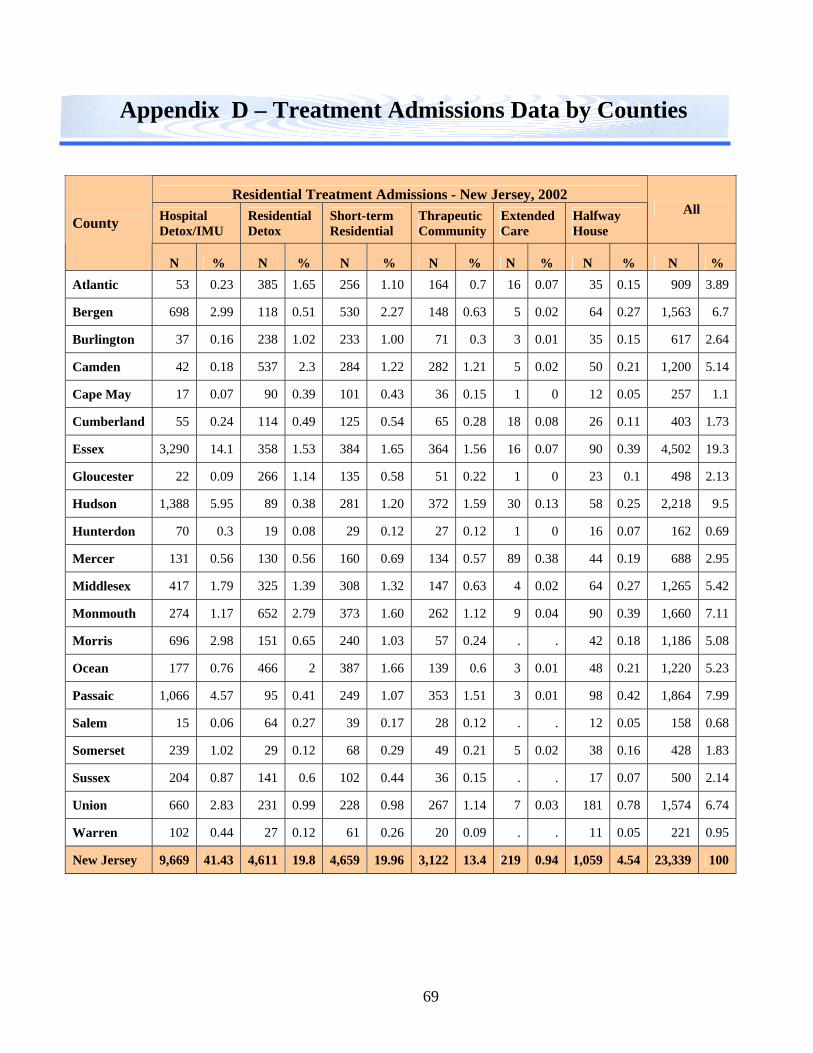
69
Appendix D – Treatment Admissions Data by Counties
Residential Treatment Admissions - New Jersey, 2002
Hospital Detox/IMU
Residential Detox
Short-term Residential
Thrapeutic Community
Extended Care
Halfway House
All County
N % N % N % N % N % N % N % Atlantic 53 0.23 385 1.65 256 1.10 164 0.7 16 0.07 35 0.15 909 3.89
Bergen 698 2.99 118 0.51 530 2.27 148 0.63 5 0.02 64 0.27 1,563 6.7
Burlington 37 0.16 238 1.02 233 1.00 71 0.3 3 0.01 35 0.15 617 2.64
Camden 42 0.18 537 2.3 284 1.22 282 1.21 5 0.02 50 0.21 1,200 5.14
Cape May 17 0.07 90 0.39 101 0.43 36 0.15 1 0 12 0.05 257 1.1
Cumberland 55 0.24 114 0.49 125 0.54 65 0.28 18 0.08 26 0.11 403 1.73
Essex 3,290 14.1 358 1.53 384 1.65 364 1.56 16 0.07 90 0.39 4,502 19.3
Gloucester 22 0.09 266 1.14 135 0.58 51 0.22 1 0 23 0.1 498 2.13
Hudson 1,388 5.95 89 0.38 281 1.20 372 1.59 30 0.13 58 0.25 2,218 9.5
Hunterdon 70 0.3 19 0.08 29 0.12 27 0.12 1 0 16 0.07 162 0.69
Mercer 131 0.56 130 0.56 160 0.69 134 0.57 89 0.38 44 0.19 688 2.95
Middlesex 417 1.79 325 1.39 308 1.32 147 0.63 4 0.02 64 0.27 1,265 5.42
Monmouth 274 1.17 652 2.79 373 1.60 262 1.12 9 0.04 90 0.39 1,660 7.11
Morris 696 2.98 151 0.65 240 1.03 57 0.24 . . 42 0.18 1,186 5.08
Ocean 177 0.76 466 2 387 1.66 139 0.6 3 0.01 48 0.21 1,220 5.23
Passaic 1,066 4.57 95 0.41 249 1.07 353 1.51 3 0.01 98 0.42 1,864 7.99
Salem 15 0.06 64 0.27 39 0.17 28 0.12 . . 12 0.05 158 0.68
Somerset 239 1.02 29 0.12 68 0.29 49 0.21 5 0.02 38 0.16 428 1.83
Sussex 204 0.87 141 0.6 102 0.44 36 0.15 . . 17 0.07 500 2.14
Union 660 2.83 231 0.99 228 0.98 267 1.14 7 0.03 181 0.78 1,574 6.74
Warren 102 0.44 27 0.12 61 0.26 20 0.09 . . 11 0.05 221 0.95
New Jersey 9,669 41.43 4,611 19.8 4,659 19.96 3,122 13.4 219 0.94 1,059 4.54 23,339 100
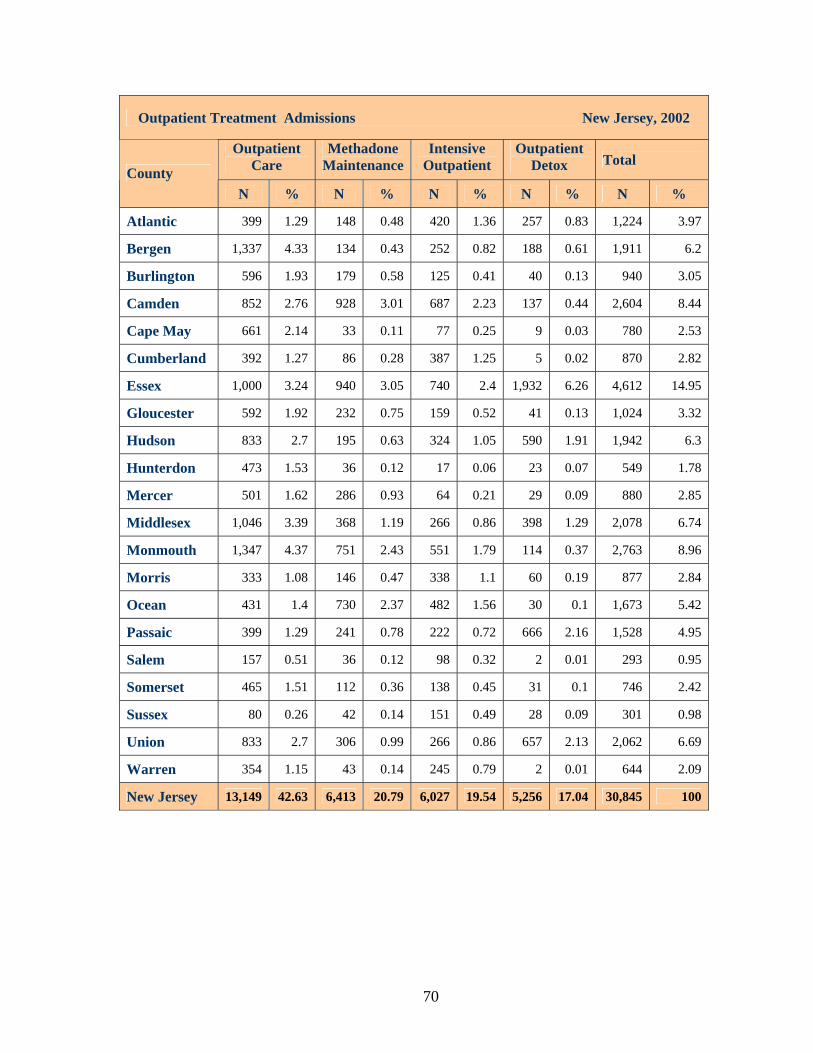
70
Outpatient Treatment Admissions New Jersey, 2002
Outpatient Care
Methadone Maintenance
Intensive Outpatient
Outpatient Detox Total
County N % N % N % N % N %
Atlantic 399 1.29 148 0.48 420 1.36 257 0.83 1,224 3.97
Bergen 1,337 4.33 134 0.43 252 0.82 188 0.61 1,911 6.2
Burlington 596 1.93 179 0.58 125 0.41 40 0.13 940 3.05
Camden 852 2.76 928 3.01 687 2.23 137 0.44 2,604 8.44
Cape May 661 2.14 33 0.11 77 0.25 9 0.03 780 2.53
Cumberland 392 1.27 86 0.28 387 1.25 5 0.02 870 2.82
Essex 1,000 3.24 940 3.05 740 2.4 1,932 6.26 4,612 14.95
Gloucester 592 1.92 232 0.75 159 0.52 41 0.13 1,024 3.32
Hudson 833 2.7 195 0.63 324 1.05 590 1.91 1,942 6.3
Hunterdon 473 1.53 36 0.12 17 0.06 23 0.07 549 1.78
Mercer 501 1.62 286 0.93 64 0.21 29 0.09 880 2.85
Middlesex 1,046 3.39 368 1.19 266 0.86 398 1.29 2,078 6.74
Monmouth 1,347 4.37 751 2.43 551 1.79 114 0.37 2,763 8.96
Morris 333 1.08 146 0.47 338 1.1 60 0.19 877 2.84
Ocean 431 1.4 730 2.37 482 1.56 30 0.1 1,673 5.42
Passaic 399 1.29 241 0.78 222 0.72 666 2.16 1,528 4.95
Salem 157 0.51 36 0.12 98 0.32 2 0.01 293 0.95
Somerset 465 1.51 112 0.36 138 0.45 31 0.1 746 2.42
Sussex 80 0.26 42 0.14 151 0.49 28 0.09 301 0.98
Union 833 2.7 306 0.99 266 0.86 657 2.13 2,062 6.69
Warren 354 1.15 43 0.14 245 0.79 2 0.01 644 2.09
New Jersey 13,149 42.63 6,413 20.79 6,027 19.54 5,256 17.04 30,845 100
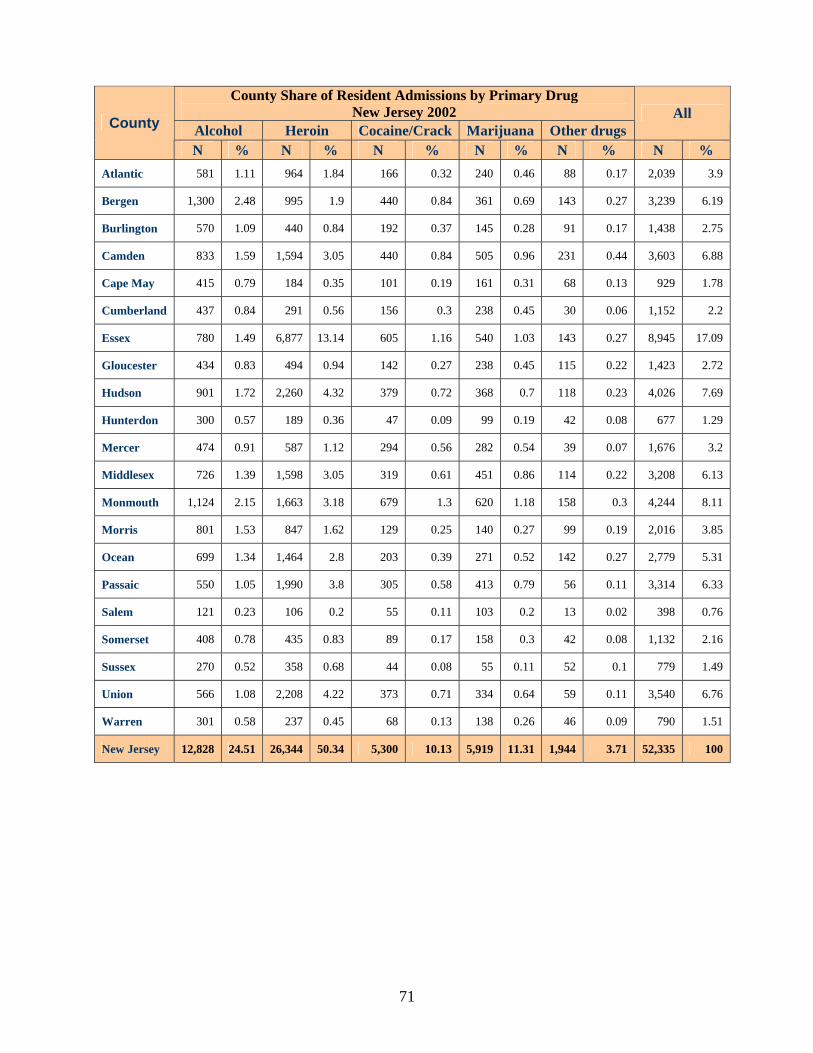
71
County Share of Resident Admissions by Primary Drug New Jersey 2002
Alcohol Heroin Cocaine/Crack Marijuana Other drugs All County
N % N % N % N % N % N % Atlantic 581 1.11 964 1.84 166 0.32 240 0.46 88 0.17 2,039 3.9
Bergen 1,300 2.48 995 1.9 440 0.84 361 0.69 143 0.27 3,239 6.19
Burlington 570 1.09 440 0.84 192 0.37 145 0.28 91 0.17 1,438 2.75
Camden 833 1.59 1,594 3.05 440 0.84 505 0.96 231 0.44 3,603 6.88
Cape May 415 0.79 184 0.35 101 0.19 161 0.31 68 0.13 929 1.78
Cumberland 437 0.84 291 0.56 156 0.3 238 0.45 30 0.06 1,152 2.2
Essex 780 1.49 6,877 13.14 605 1.16 540 1.03 143 0.27 8,945 17.09
Gloucester 434 0.83 494 0.94 142 0.27 238 0.45 115 0.22 1,423 2.72
Hudson 901 1.72 2,260 4.32 379 0.72 368 0.7 118 0.23 4,026 7.69
Hunterdon 300 0.57 189 0.36 47 0.09 99 0.19 42 0.08 677 1.29
Mercer 474 0.91 587 1.12 294 0.56 282 0.54 39 0.07 1,676 3.2
Middlesex 726 1.39 1,598 3.05 319 0.61 451 0.86 114 0.22 3,208 6.13
Monmouth 1,124 2.15 1,663 3.18 679 1.3 620 1.18 158 0.3 4,244 8.11
Morris 801 1.53 847 1.62 129 0.25 140 0.27 99 0.19 2,016 3.85
Ocean 699 1.34 1,464 2.8 203 0.39 271 0.52 142 0.27 2,779 5.31
Passaic 550 1.05 1,990 3.8 305 0.58 413 0.79 56 0.11 3,314 6.33
Salem 121 0.23 106 0.2 55 0.11 103 0.2 13 0.02 398 0.76
Somerset 408 0.78 435 0.83 89 0.17 158 0.3 42 0.08 1,132 2.16
Sussex 270 0.52 358 0.68 44 0.08 55 0.11 52 0.1 779 1.49
Union 566 1.08 2,208 4.22 373 0.71 334 0.64 59 0.11 3,540 6.76
Warren 301 0.58 237 0.45 68 0.13 138 0.26 46 0.09 790 1.51
New Jersey 12,828 24.51 26,344 50.34 5,300 10.13 5,919 11.31 1,944 3.71 52,335 100
72
Appendix E – Glossary of terms, Data Source & References
Glossary of Terms Community Environment
Population: Population: The total census population for each County. Density: The ratio of the total population to the total area of each County per square mile. Black or African American: A person having origins in any of the black racial groups of Africa. It includes people who indicate their race as Black, African American, or Nigerian, Kenyan, Haitian…etc. Child abuse / neglect referrals: The number of child abuse and neglect referrals to New Jersey Division of Youth and Family Services (DYFS) for intervention, per 1,000 children 0-17 years old in the population. Hispanic: Defined by self-identification, Hispanic origin refers to ethnicity, not race. Persons of Hispanic origin may be of any race. The terms “Spanish”, “Hispanic origin” and “Latino” are used interchangeably by those who identify themselves in one of the specific categories listed in the census questionnaires as Mexican, Puerto Rican, or Cuban as well as those who indicate that they are “other Spanish /Hispanic/ Latino”. “Other Spanish/Hispanic/Latino” are those whose origins are from Spain, the Spanish speaking countries of Central and South America, the Dominican Republic, or people who identify themselves as Spanish. White: A person having origins in any of the original peoples of Europe, the Middle East, or North Africa. It includes people who indicate their race as ‘white, Irish, German, Italian, Lebanese, Near-easterner, Arab, or Polish’. Economic Deprivation: Poverty Rate, all ages (%): The percentage of persons who live in families with incomes below the poverty line. It is computed by dividing the number of persons in poverty by the total number of the population for whom poverty status has been determined. Child Poverty Rate (%): The percentage of children 0-17 years old who live in families with income below the poverty line. It is computed by dividing the number of children in poverty by the total number of children for whom poverty status has been determined. Elderly Poverty Rate (%): The percentage of people 65 years old and over who live in families with income below the poverty line. It is computed by dividing the number of elderly people in poverty by the total number of the population for whom poverty status has been determined.
73
Unemployment Rate (%): The percentage of unemployed workers per total labor force. Median Household Income: This measure divides income distribution of households into two equal groups, one having incomes above the median, and other having incomes below the median. The median household income is the income level where half of the households in the municipality have a lower income and half have a higher income. The median is based on all households. Families with children (under 18 years) on TANF (Temporary Assistance for Needy Families): Assistance provided by the federal government to assist needy families with Children aged 5-17 years so that children can be cared for in their own homes. This rate is calculated by dividing the total number of TANF cases in each municipality, by families with children less than 18 years, and then multiplying by 1,000. Community Attachment: Voter Turnout (%): The number of ballots cast as a percentage of the number of persons registered to vote in the general elections. Owner occupied housing (%): A housing unit is owner occupied if the owner or co-owner lives in the unit even if it is mortgaged or not fully paid. The percentage of owner occupied housing is computed by dividing the number of owner occupied housing units, by the total number of occupied housing units, and then multiplying by 100. Crime Level: Violent crime rate /1,000: The number of crime offences related to murder, rape, robbery and aggravated assault reported to police per 1,000 of the total population. Non-violent crime rate /1,000: The number of crime offences related to burglary, larceny-theft, and motor vehicle theft reported to police per 1,000 of the total population. Total crime rate /1,000: The number of index offences (violent & non-violent crime) reported per 1,000 of the total population. The ‘index’ refers to FBI groupings of crimes. This only includes the most serious categories of crime, as categorized by the FBI. It does not include lesser crimes such as fraud, vandalism, etc. Housing Adequacy: Homeowner vacancy rate (%): The proportion of homeowner housing inventory that is vacant for sale. It is computed by dividing the number of vacant units for sale only, by the sum of the owner-occupied units and vacant units that are for sale only, and then multiplying by 100. Rental vacancy rate (%): The proportion of rental inventory that is vacant for rent. It is computed by dividing the number of vacant units for rent by the sum of the renter occupied units and the number of vacant units for rent, and then multiplied by 100. Household size of owner-occupied housing: A measure obtained by dividing the number of people living in owner-occupied housing units by the total number of owner-occupied housing units. Household size of renter-occupied housing: A measure obtained by dividing the number of people living in renter-occupied housing units by the total number of renter-occupied housing units.
74
Family Structure/Child Development Domestic violence/1,000: The number of domestic violence cases reported to police per 1,000 of the total population. Family households with own children under 18 (%): This is computed by dividing the number of family households with children under 18 years, by the total number of family households, and then multiplying by 100. Households with individuals 65 years old and over (%): This is computed by dividing the households with individuals 65 years and over, by the total number of households, and then multiplying by 100. Child abuse and neglect /1,000: The number of child abuse and neglect referrals to New Jersey Division of Youth and Family Services (DYFS) for intervention, per 1,000 children 0-17 years old in the population. Teenage birth rate/1,000: The number of births to women 15-19 years old, per 1,000 females in this age group.
School Involvement High school graduates, 18 years & over (%): The percentage of population (18 years and over) with a High School Graduate diploma (including GED or equivalent). It also includes the population that attended some college but who obtained less than a Bachelor’s degree. Highest level of education obtained: The percentage of population (25 years and over) with a High School Graduate diploma (including GED or equivalent). It also includes the population that attended some college but who obtained less than a Bachelor’s degree. College graduates, 25 years & over (%): The percentage of population (25 years and over) with a Bachelor’s degree or higher. Individual/Peer Behavior Burglary/1,000: The number of burglary cases reported to police per 1,000 of the total population. Larceny/1,000: The number of larceny cases reported to police per 1,000 of the total population. Motor vehicle theft/1,000: The number of motor vehicle theft cases reported to police per 1,000 of the total population. Substance Abuse Related Problems Alcohol treatment admissions/10,000: The number of alcohol treatment admissions per 10,000 of the total population. Drug treatment admissions/10,000: The number of drug treatment admissions per 10,000 of the total population.

75
References Hawkins, J. D., & Weis, J. G. (1985). ‘The Social Development Model’: An integrated approach to delinquency prevention. Journal of Primary Prevention, 6, 73-97. Hawkins, J.D.,Catalano, R.F., and Miller, J.Y. (1992). Risk and protective factors for Alcohol and other drug problems in adolescence and early adulthood. Implications for substance abuse prevention: Psychological Bulletin 112(1):64-105. Gruenewald, Paul J., Treno, A. J., Taff, G., and Klitzner, M. (1997) Measureing Community Indicators: A system Approach to Drug and Alcohol Problems. Thousand Oaks, Ca.: Sage Publication. Gruenewald, Paul J. (2000). Small area estimates from a geo-statistical Perspective: Current status and future directions. The Epidemiology of Alcohol Problems in Small Geographic Areas. National Institute of Alcohol Abuse and Alcoholism. Kim and Mueller (1982). Introduction to Factor Analysis, I & II. Sage Publications. Kimmel, Wayne A. (1992). Need, demand, and problem assessment for substance abuse services.
Office for Treatment Improvement, Technical Assistance Publication Series Number 3, U.S. Department of Health and Human Service, Alcohol, Drug Abuse, and Mental Health Administration. DHHS Publication Number (ADM) 92-1741.
Mammo, Abate and John F. French (1996). On the construction of a relative needs assessment scale.
Substance Use and Misuse (formerly the International Journal of the Addictions), 31(6),753-765.
Mammo, Abate and John F. French (1998). “Using Social Indicators to Predict Addictions”
Substance Use & Misuse, 33(12), 2499-2513. Schnieder, M. (1976). The "quality of life" and social indicators research. Public Administration
Review, 36,297-305. Simeone, Roland S., Blanche Frank and Zahra Aryan (1993). Needs assessment in substance
misuse:A comparison of approaches and case study, The International Journal of the Addictions, 28(8), 767-792.
Wasserman, I. M. and L. A. Chua (1980). Objective and Subjective indicators of the quality of life in
American SMSA's: A reanalysis. Social Indicators Research, 8, 365-381. Wision, R.A., and Dufour, M. (2000). The Epidemiology of Alcohol Problems in Small Geographic Areas. National Institute of Alcohol Abuse and Alcoholism. Memogrph No. 36. Zautra, A. and D. Goodhart (1979). Quality of Life indicators: A review of literature. Community
Health Review, 4, 3-10. Zautra, A. and L. S. Simons (1978). An assessment of a community's mental health needs. American Journal of Community Psychology, 6, 351-362.
76
Data Sources Population Characteristics GeoLytics, Inc. ‘CensusCD 2000 Long Form (SF3)’, http://www.geolytics.html Hughes, J., J. Seneca, & C. Hughes. (2000) ‘Anticipating Census 2000: New Jersey’s Emerging Demographic Profile’ Edward J. Bloustein. School of Planning & Public Policy. Rutgers University, New Brunswick,2000. U.S. Census Bureau. ‘Census 2000 Data for state of New Jersey’.
http://www.census.gov/census2000/states/nj.html , (February, 2002).
U.S. Census Bureau. Decennial Census, http://www.census.gov/prod/www/abs/decenial.html (Feb2002).
U.S. Census Bureau. ‘Data Access Tools’ http://www.census.gov/main/www/access.html
(July, 2001). U.S. Census Bureau. ‘Cartographic Files’, http://www.census.gov/geo/www/cob/ (July, 2001). U.S. Census Bureau. ‘State and County Quick Facts’,
http://quickfacts.census.gov/qfd/states/34000.html U.S. Census Bureau. ‘American Fact Finder’, http://factfinder.census.gov/servlet/BasicFactsServlet Community Environment Risk Factors Association for Children of New Jersey. ‘New Jersey 2000 State & County Profile of Child Well-Being’. http://www.acnj.org/KidsCount2000/county_profiles.html. (NJPRI). Gordon M.Fisher. The Development and History of the Poverty Threshold,
Social Security Bulletin 55, no 4 (1992:3-14). Kristin A. Mateo. ‘Hard Times Amid Prosperity: A Current Profile of Poverty in New Jersey.’ http://www.lsnj.org New Jersey Poverty Research Institute (NJPRI). New Jersey Division of State Police. ‘Municipal-County Offense & Demographic Data’, http://www.state.nj.us/lps/njsp/info/ucr2000/. Crime in New Jersey, 2000 Uniform Crime Report, New Jersey Department of Law & Public Safety (Trenton, 2000). New Jersey Division of Elections. ‘2000 General Election Registered Voters’ http://www.state.nj.us/lps/elections/elec2000.html New Jersey Department of Law & Public Safety (Trenton, 2000). Social Security Administration. ‘Small Area Income & Poverty Estimates’ http://www.ssa.gov/statistics/state_fact_sheets/nj.pdf . U.S. Census Bureau, 2000. http://www.census.gov/hhes/www/saipe.html (1998). U.S. Department of Health and Human Services. ‘The 2000 HHS Poverty Guidelines’ http://aspe.hhs.gov/poverty/00poverty.htm.
77
Family Structure/Child Development Risk Factors Association for Children of New Jersey. ‘Kids Count New Jersey 2000 –Birth to Teens’. http://www.acnj.org/KidsCount2000/county_profiles.html. (NJPRI). Center for Health Statistics. ‘Marriage and Divorces’, http://www.state.nj.us./health/chs/stats98/marriage.htm New Jersey Department Of Health & Senior Services, 1988. The N. J. Division of Youth and Family Services. ‘1999 Child Abuse & Neglect in New Jersey’, http://www.state.nj.us/humanservices/dyfs/canreport/childabusereports.html The National Campaign to Prevent Teen Pregnancy. ‘Teen pregnancy in New Jersey’, http://www.teenpregnancy.org/america/states/nj.asp N. J. Department of Human Services, 1999.
School Involvement/Educational Level Risk Factors Edward J. Bloustein. School of Planning & Public Policy, ‘2000 New Jersey Legislative District Data Book.’ Rutgers University (New Brunswick, 2000). N. J. Department of Education. ‘Selected educational statistics’, http://www.state.nj.us/njded/schools/achievement http://www.state.nj.us/njded/data/grd00/grd_county_1.html New Jersey Educational Statistics, 1999. U.S. Census Bureau ‘State and County Profile Quick Facts – Adults 25 years & over High SchoolGraduates’ http://quickfacts.census.gov/qfd/states/34000.html. Individual/Peer Group Initiation of Problem Behavior Becker, L., Berga, V., Sandberg, M. & Stanley, M. (2000) Risk and Protection Profile for Substance Abuse Prevention Planning in Washington State. Washington State, Department of Social and Health Services, Research and Data Analysis. Seattle, Washington. New Jersey Division of State Police. ‘State & County Arrest Summary’, Crime in New Jersey, 2000 Uniform Crime Report. http://www.state.nj.us/lps/njsp/info/ucr2000/ New Jersey Department of Law & Public Safety (Trenton, 2000). Mortality, Crime & Substance Abuse Treatment Indicators. State of N.J., Department of Health and Human Services. ‘New Jersey Health Statistics, List of Data Tables’ http://www.state.nj.us./health/chs/stats98/tabsills.htm U.S. Department of Health and Human Services. ‘Community Health Status Indicators Project’, http://www.communityhealth.hrsa.gov/default.asp HRSA 2000.