Embed Size (px)
Citation preview

Monitoring the VMware View RDS
eG Enterprise v6.x

Restricted Rights Legend
The information contained in this document is confidential and subject to change without notice. No part of this
document may be reproduced or disclosed to others without the prior permission of eG Innovations, Inc. eG
Innovations, Inc. makes no warranty of any kind with regard to the software and documentation, including, but not
limited to, the implied warranties of merchantability and fitness for a particular purpose.
Trademarks
Microsoft Windows, Windows NT, Windows 2003, and Windows 2000 are either registered trademarks or trademarks
of Microsoft Corporation in United States and/or other countries.
The names of actual companies and products mentioned herein may be the trademarks of their respective owners.
Copyright
© 2015 eG Innovations, Inc. All rights reserved.
The copyright in this document belongs to eG Innovations, Inc. Complying with all applicable copyright laws is the
responsibility of the user.

Table of Contents
MONITORING THE VMWARE VIEW RDS ............................................................................................................................. 2
1.1 The RDS Server Layer ...................................................................................................................................................... 4
1.1.1 Terminal Connection Test ......................................................................................................................................... 5
1.1.2 Terminal Authentication Test .................................................................................................................................... 6
1.1.3 Redirector Test .......................................................................................................................................................... 7
1.1.4 Session Login Status Test ......................................................................................................................................... 9
1.1.5 User Logon Test ...................................................................................................................................................... 10
1.2 The RDS Application Layer ............................................................................................................................................ 18
1.2.1 RDS Applications Test ............................................................................................................................................ 19
1.3 The RDS Users Layer ..................................................................................................................................................... 22
1.3.1 RDS Listeners Test ................................................................................................................................................. 22
1.3.2 RDS Sessions Test .................................................................................................................................................. 23
1.3.3 RDS Users Test ....................................................................................................................................................... 26
1.3.4 RDS Disconnects Test ............................................................................................................................................. 31
1.3.5 RDS Logins Test ..................................................................................................................................................... 33

MONITORING THE VMWAR E VIEW RDS
2
Monitoring the VMware View RDS VMware is already known for providing virtualized applications through VMware ThinApp™, and centralized
application and desktop management through View™. Horizon now adds a new option: application remoting based
on Microsoft Remote Desktop Services (RDS).
RDS, formerly known as Terminal Services, is a Microsoft technology that enables remote users to share applications
installed on servers in the data center, as well as to share session-based desktops.
RDS hosting of applications is also sometimes referred to as app publishing or app remoting. RDS hosting provides
users with access to applications that are installed on a remote RDS host. In Horizon, Remote Desktop Services hosts
(RDS hosts) deliver Windows-based applications or desktops. The RDS host is a server containing both Microsoft RDS
and View Agent™. By installing an application on an RDS host, you can make a single instance of an application
available to thousands of users, who access it remotely.
For a more than satisfactory user experience with RDS hosting, administrators must make sure that these remote
users are able to access applications on the RDS hosts quickly and are able to use them continuously. Inexplicable
delays in application access, prolonged slowness when running applications on the RDS hosts, sudden session log
outs, are some of the key spoilers of a user’s experience with VMware View RDS. To proactively detect and avert
such anomalies before end-users notice, an administrator should monitor the VMware View RDS environment 24x7.
The eG Enterprise suite offers 100% web-based monitoring of application delivery via View’s RDS hosting option. For
this purpose, eG Enterprise provides a specialized VMware View RDS monitoring model. This model defines the key
performance metrics that need to be tracked to determine the service level achieved by View’s RDS farms.

MONITORING THE VMWAR E VIEW RDS
3
Figure 1.1: Layer model of VMware View RDS
Each layer of the Figure 1.1 is mapped to a variety of tests that provide valuable insights into the overall health and
performance of the RDS farm. With the help of the metrics reported by these tests, you can find quick and accurate
answers for the following queries:

MONITORING THE VMWAR E VIEW RDS
4
VMware RDS server
Monitoring
Are the VMware RDS servers available to service user requests?
Are there sporadic disconnects from the VMware RDS server?
At what times do peak usage of the servers happen and is the server capacity
adequate?
Is the user load being balanced across all the servers?
User Monitoring Are users able to login to the server farm? How long is the login process taking?
What is the average response time that a user sees when connecting to a VMware
RDS server?
How many users are logged in to each server in the VMware RDS server farm?
What is the resource usage (CPU and memory) for each user?
What is the I/O activity generated by every user?
How much network bandwidth is consumed by every user?
Are too many page faults occurring in the processes executed on a server?
If so, what are those processes, and who are the users executing them?
Which user is using a lot of handles?
Operating System
Monitoring
What is the average CPU and memory usage on all the servers in the farm?
Is any unusual memory scanning/paging activity happening on the systems?
Are the critical VMware RDS server processes up?
What is their resource consumption?
Hosted Application
Monitoring
What are the applications hosted on a VMware RDS server?
Who is using each application?
What is the resource usage for each published application?
The sections that follow will focus on the top 4 layers of Figure 1.2. The remaining layers have already been dealt
with in the Monitoring Unix and Windows Servers document.
1.1 The RDS Server Layer The tests associated with this layer (see Figure 1.2) enable administrators to measure the health of the client to
server connectivity, using metrics such as the following:
The availability of the VMware RDS server and its responsiveness to client requests
Login time to the server
The status of file serving as seen by a RDS client

MONITORING THE VMWAR E VIEW RDS
5
Figure 1. 2: The tests mapped to the RDS Server layer
1.1.1 Terminal Connection Test
This test tracks various statistics pertaining to VMware View RDS connections to and from a host, from an external
perspective.
Purpose Tracks various statistics pertaining to VMware View RDS connections to and from a host, from
an external perspective
Target of the
test
A VMware RDS server
Agent
deploying the
test
An external agent
Configurable
parameters for
the test
1. TEST PERIOD - How often should the test be executed
2. HOST - Host name of the server for which the test is to be configured
3. PORT - Enter the port to which the specified HOST listens
4. TARGETPORTS – Specify a comma-separated list of port numbers that are to be tested
(eg., 80,7077,1521). By default, the default terminal sever port, 3389, will be displayed
here.
Outputs of the
test
One set of results for every port being monitored
Measurements
made by the
test Measurement
Measurement
Unit Interpretation
Connection availability:
Whether the VMware View
RDS server connection is
available
Percent An availability problem can be caused by
different factors – e.g., the server process
may not be up, a network problem may exist,
or there could be a configuration problem
with the DNS server.
Connection time:
Time taken (in seconds) by
the server to respond to a
request.
Secs An increase in response time can be caused
by several factors such as a server
bottleneck, a configuration problem with the
DNS server, a network problem, etc.

MONITORING THE VMWAR E VIEW RDS
6
1.1.2 Terminal Authentication Test
This test emulates the user login process at the system level on a VMware View RDS server and reports whether the
login succeeded and how long it took.
Purpose emulates the user login process at the system level on a VMware View RDS server and reports
whether the login succeeded and how long it took
Target of the
test
A VMware View RDS server
Agent
deploying the
test
An internal agent
Configurable
parameters for
the test
1. TEST PERIOD – How often should the test be executed
2. HOST – The host for which the test is to be configured
3. PORT – Refers to the port used by the VMware View RDS server
4. USERNAME - This test emulates the user login process at the system level on a VMware
View RDS server. Therefore, specify the login name of a user with both interactive logon
and logon locally privileges.
5. PASSWORD - Enter the password that corresponds to the specified USERNAME.
6. CONFIRM PASSWORD – Confirm the password by retyping it here.
7. DOMAIN - Specify the name of the domain to which the test will try to login. If the test is
to login to a local host, specify 'none' here.
8.
9. REPORT BY DOMAIN - By default, this flag is set to Yes. This implies that by default, this
test will report metrics for every domainname\username configured for this test. This way,
administrators will be able to quickly determine which user logged in from which domain. If
you want the detailed diagnosis to display the username alone, then set this flag to No.
Outputs of the
test
One set of results for every user account being checked
Measurements
made by the Measurement
Measurement
Unit Interpretation
Note:
If users are spread across multiple domains, then, you can configure this test with
multiple DOMAIN specifications; in this case, for every DOMAIN, a USER-
PASSWORD pair might also have to be configured. Sometimes, you might want the
test to login as specific users from the same domain, to check how long each user
login takes. Both these scenarios require the configuration of multiple DOMAINs
and/or multiple USER names and PASSWORDs. In order to enable users to specify
these details with ease, eG Enterprise provides a special page; to access this page,
click on the Click here hyperlink at the top of the parameters in the test configuration
page. To know how to use this page, refer to the Configuring Multiple Users for the
Citrix Authentication Test section in the Monitoring Citrix Environments document.
MONITORING THE VMWAR E VIEW RDS
7
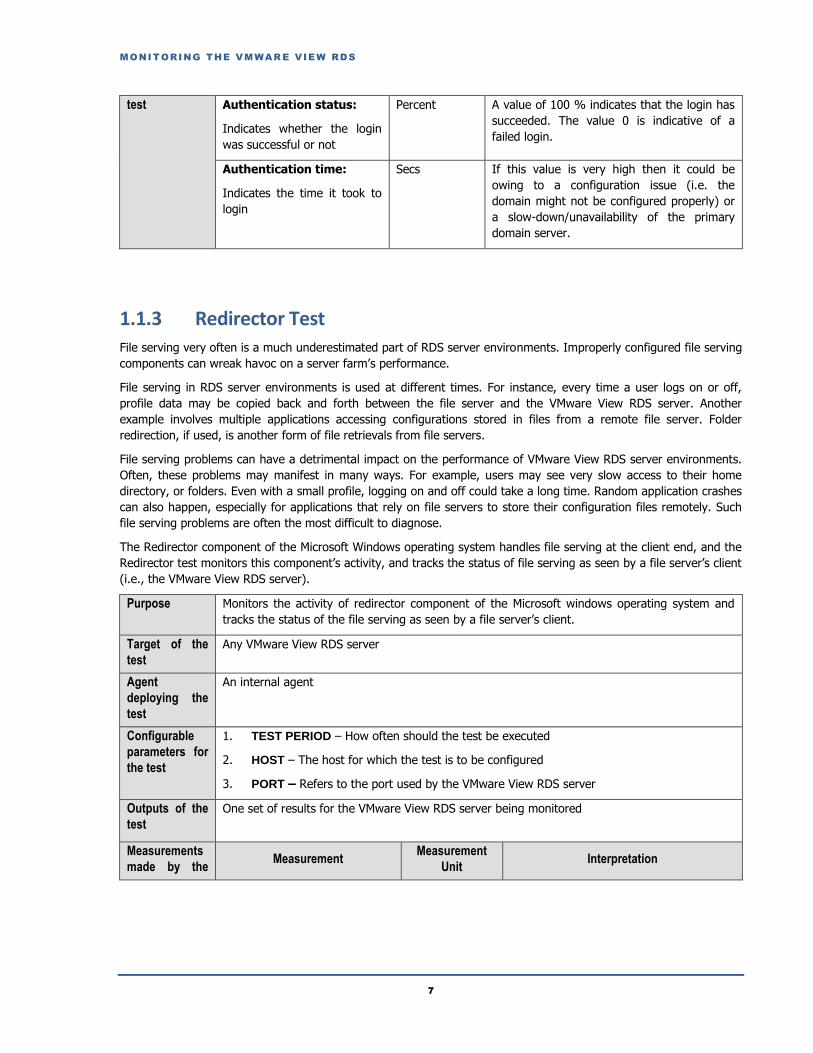
test Authentication status:
Indicates whether the login
was successful or not
Percent A value of 100 % indicates that the login has
succeeded. The value 0 is indicative of a
failed login.
Authentication time:
Indicates the time it took to
login
Secs If this value is very high then it could be
owing to a configuration issue (i.e. the
domain might not be configured properly) or
a slow-down/unavailability of the primary
domain server.
1.1.3 Redirector Test
File serving very often is a much underestimated part of RDS server environments. Improperly configured file serving
components can wreak havoc on a server farm’s performance.
File serving in RDS server environments is used at different times. For instance, every time a user logs on or off,
profile data may be copied back and forth between the file server and the VMware View RDS server. Another
example involves multiple applications accessing configurations stored in files from a remote file server. Folder
redirection, if used, is another form of file retrievals from file servers.
File serving problems can have a detrimental impact on the performance of VMware View RDS server environments.
Often, these problems may manifest in many ways. For example, users may see very slow access to their home
directory, or folders. Even with a small profile, logging on and off could take a long time. Random application crashes
can also happen, especially for applications that rely on file servers to store their configuration files remotely. Such
file serving problems are often the most difficult to diagnose.
The Redirector component of the Microsoft Windows operating system handles file serving at the client end, and the
Redirector test monitors this component’s activity, and tracks the status of file serving as seen by a file server’s client
(i.e., the VMware View RDS server).
Purpose Monitors the activity of redirector component of the Microsoft windows operating system and
tracks the status of the file serving as seen by a file server’s client.
Target of the
test
Any VMware View RDS server
Agent
deploying the
test
An internal agent
Configurable
parameters for
the test
1. TEST PERIOD – How often should the test be executed
2. HOST – The host for which the test is to be configured
3. PORT – Refers to the port used by the VMware View RDS server
Outputs of the
test
One set of results for the VMware View RDS server being monitored
Measurements
made by the Measurement
Measurement
Unit Interpretation

MONITORING THE VMWAR E VIEW RDS
8
test Data received:
This metric shows the rate of
data that were received by the
local server from the network.
This includes all the application
data as well as network protocol
information.
MB/Sec
Data sent:
This metric represents the rate
at which data is leaving the
Redirector to the network. This
includes all the application data
as well as network protocol
information.
MB/sec
Current commands:
This metric indicates the
number of requests to the
Redirector that are currently
queued for service.
Number The Current Commands measure
indicates the number of pending
commands from the local computer to all
destination servers. This means that if
one of the destination servers does not
respond in a timely manner, the number
of current commands on the local
computer may increase.
If the local computer is serving many
sessions, a high number of current
commands does not necessarily indicate a
problem or a bottleneck. However, if the
Current Commands measure shows a
high number and the local computer is
idle, this may indicate a network-related
problem or a redirector bottleneck on the
local computer. For example, there may
be a network-related problem or a local
bottleneck if the computer is idle
overnight but the counter shows a high
number during that period.
Network errors:
This metric denotes the rate at
which serious unexpected errors
are occurring during file system
access from a remote server.
Errors/sec Such errors generally indicate that the
Redirector and one or more Servers are
having serious communication difficulties.
For example an SMB (Server Manager
Block) protocol error is a Network Error.
An entry is written to the System Event
Log and provides details.
MONITORING THE VMWAR E VIEW RDS
9
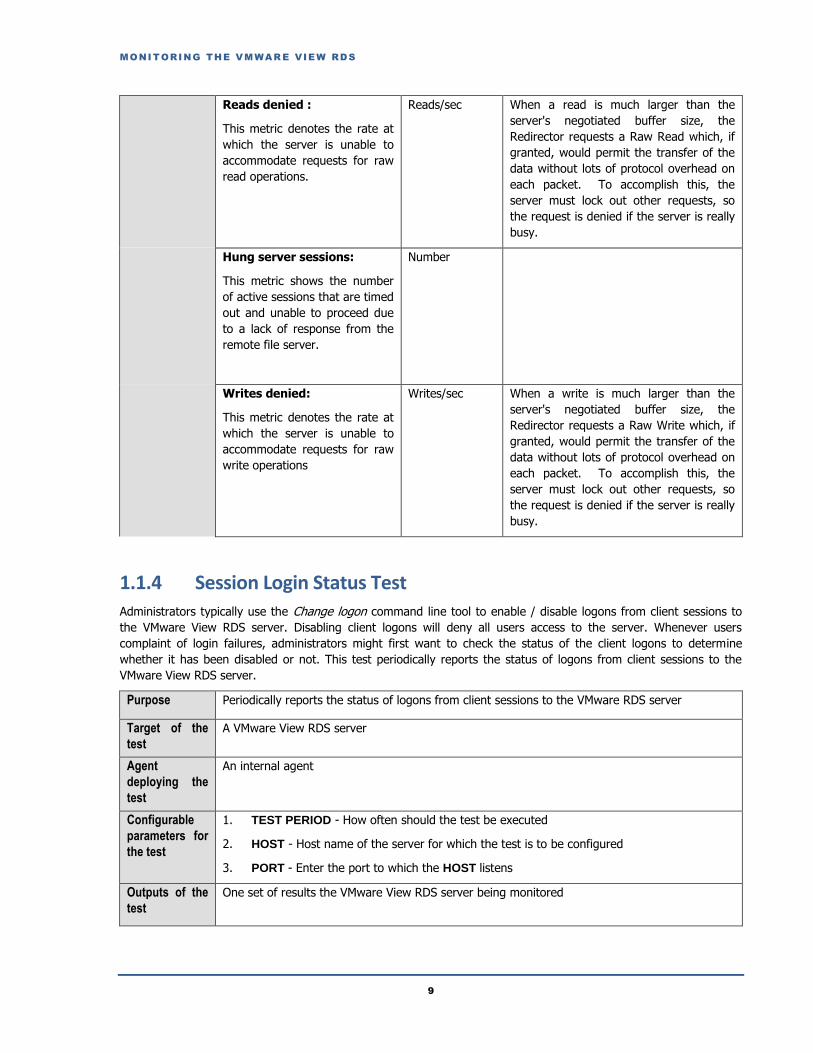
Reads denied :
This metric denotes the rate at
which the server is unable to
accommodate requests for raw
read operations.
Reads/sec When a read is much larger than the
server's negotiated buffer size, the
Redirector requests a Raw Read which, if
granted, would permit the transfer of the
data without lots of protocol overhead on
each packet. To accomplish this, the
server must lock out other requests, so
the request is denied if the server is really
busy.
Hung server sessions:
This metric shows the number
of active sessions that are timed
out and unable to proceed due
to a lack of response from the
remote file server.
Number
Writes denied:
This metric denotes the rate at
which the server is unable to
accommodate requests for raw
write operations
Writes/sec When a write is much larger than the
server's negotiated buffer size, the
Redirector requests a Raw Write which, if
granted, would permit the transfer of the
data without lots of protocol overhead on
each packet. To accomplish this, the
server must lock out other requests, so
the request is denied if the server is really
busy.
1.1.4 Session Login Status Test Administrators typically use the Change logon command line tool to enable / disable logons from client sessions to
the VMware View RDS server. Disabling client logons will deny all users access to the server. Whenever users
complaint of login failures, administrators might first want to check the status of the client logons to determine
whether it has been disabled or not. This test periodically reports the status of logons from client sessions to the
VMware View RDS server.
Purpose Periodically reports the status of logons from client sessions to the VMware RDS server
Target of the
test
A VMware View RDS server
Agent
deploying the
test
An internal agent
Configurable
parameters for
the test
1. TEST PERIOD - How often should the test be executed
2. HOST - Host name of the server for which the test is to be configured
3. PORT - Enter the port to which the HOST listens
Outputs of the
test
One set of results the VMware View RDS server being monitored
MONITORING THE VMWAR E VIEW RDS
10
Measurements
made by the
test Measurement
Measurement
Unit Interpretation
Session login status:
Indicates whether the client
sessions to the server are
currently enabled or not.
Percent If the value for this measure is 100, it
indicates all client logons are enabled. If the
value of this measure is 0, it indicates that
client logons are disabled.
1.1.5 User Logon Test
The process of a user logging into a VMware RDS server is fairly complex. First, the domain controller is discovered
and the login credentials are authenticated. Then, the corresponding user profile is identified and loaded. Next, group
policies are applied and logon scripts are processed to setup the user environment. In the meantime, additional
processing may take place for a user – say, applying system profiles, creating new printers for the user, and so on. A
slowdown in any of these steps can significantly delay the logon process for a user. Since logons on Windows happen
sequentially, this may adversely impact the logins for other users who may be trying to access the VMware RDS
server at the same time. Hence, if a user complains that he/she is unable to access an application published on
VMware RDS, administrators must be able to rapidly isolate exactly where the logon process is stalling and for which
user. The typical process for monitoring and troubleshooting the login process on Windows 2003 is to use the user
environment debugging mechanism. To enable this on Windows 2003 and to set the logging level associated with the
userenv.log file, perform the following steps:
Start a registry editor (e.g., regedit.exe).
Navigate to the HKEY_LOCAL_MACHINE\SOFTWARE\Microsoft\Windows NT\CurrentVersion\Winlogon
registry subkey.
From the Edit menu, select New, DWORD Value.
Enter the name UserEnvDebugLevel, then press Enter.
Double-click the new value, set it to 65538 (decimal) - which corresponds to the debugger output.
Once these changes are enabled, details about the Windows login process are logged into the file
%systemroot%\debug\usermode\userenv.log. The log file is written to the
%Systemroot%\Debug\UserMode\Userenv.log file. If the Userenv.log file is larger than 300 KB, the file is renamed
Userenv.bak, and a new Userenv.log file is created. This action occurs when a user logs on locally or by using
Terminal Services, and the Winlogon process starts. However, because the size check only occurs when a user logs
on, the Userenv.log file may grow beyond the 300 KB limit. The 300 KB limit cannot be modified.

MONITORING THE VMWAR E VIEW RDS
11
The User Logon test periodically checks the userenv log file on Windows 2003 to monitor the user login and profile
loading process and accurately identify where the process is bottlenecked. On Windows 2008 (or above), this test
takes the help of the Windows event logs to capture anomalies in the user login and profile loading process and
report where the process is bottlenecked - – in the authentication process? during profile loading? during GPO
processing and if so, which GPO?
By default, this test is disabled. To enable the test, go to the ENABLE / DISABLE TESTS page using the menu sequence
: Agents -> Tests -> Enable/Disable, pick VMware RDS as the Component type, Performance as the Test type,
choose the test from the DISABLED TESTS list, and click on the >> button to move the test to the ENABLED TESTS list.
Finally, click the Update button.
Purpose Periodically checks the userenv log file on Windows 2003 to monitor the user login and profile
loading process and accurately identify where the process is bottlenecked. On Windows 2008 (or
above), this test takes the help of the Windows event logs to capture anomalies in the user login
and profile loading process and report its root-cause.
Target of the
test
Any VMware RDS server
Agent
deploying the
test
An internal agent

MONITORING THE VMWAR E VIEW RDS
12
Configurable
parameters for
the test
1. TEST PERIOD – How often should the test be executed
2. HOST – The host for which the test is to be configured
3. PORT – Refers to the port used by the VMware RDS server
4. REPORT TOTAL – By default, this flag is set to No. In this case therefore, the test will
only report metrics for every user to the RDS server. If this flag is set to Yes, then the test
will report metrics for a Total descriptor – the metrics reported by this descriptor will be
aggregated across all users to the RDS server. This way, administrators will receive a
system-wide overview of the health of the profile loading/unloading process.
5. REPORT FOR EACH USER – By default, this flag is set to Yes. This implies that, by
default, the test will report metrics for each user to the RDS server. If you set this flag to
No, then make sure that the REPORT TOTAL flag is set to ‘Yes’. Because, if both the
REPORT FOR EACH USER and the REPORT TOTAL flags are set to No, then the test
will not run! On the other hand, if only the REPORT TOTAL flag is set to Yes, the test will
only report metrics for the Total descriptor. Moreover, if both the REPORT TOTAL and
the REPORT FOR EACH USER flags are set to Yes, then the test will report metrics per
user and will additionally report metrics for the Total descriptor as well.
6. REPORT BY DOMAIN NAME – By default, this flag is set to No. This means that, by
default, the test will report metrics for each username only. You can set this flag to Yes, to
ensure that the test reports metrics for each domainname\username.
7. REPORT UNKNOWN – By default, this flag is set to No. Accordingly, the test, by default,
disregards user sessions that have remained active on the server for a duration lesser than
the TEST PERIOD. If you want the test to report metrics for such users as well, then set
this flag to Yes. In this case, the test will additionally support an Unknown descriptor – the
metrics reported by this descriptor will be aggregated across all such user sessions that
have been active on the server only for a limited duration.
8. DETAILED DIAGNOSIS - To make diagnosis more efficient and accurate, the eG
Enterprise suite embeds an optional detailed diagnostic capability. With this capability, the
eG agents can be configured to run detailed, more elaborate tests as and when specific
problems are detected. To enable the detailed diagnosis capability of this test for a
particular server, choose the On option. To disable the capability, click on the Off option.
The option to selectively enable/disable the detailed diagnosis capability will be available
only if the following conditions are fulfilled:
The eG manager license should allow the detailed diagnosis capability
Both the normal and abnormal frequencies configured for the detailed diagnosis
measures should not be 0.
Outputs of the
test
One set of results for every user to the VMware RDS server monitored
Measurements
made by the
test
Measurement Measurement
Unit Interpretation

MONITORING THE VMWAR E VIEW RDS
13
Logon duration:
Indicates the average time
taken by this user for logging
in during the last
measurement period.
Msecs If this value is abnormally high for any user,
then, you can compare the User account
discovery time, LDAP bind time to Active
Directory, Client side extension processed
time, DC discovery time, Total group policy
object file access time, Avg system policy
processing time and User profile load time
measures to know exactly where that user’s
login process experienced a bottleneck - is it
when loading the profile? is it when
processing system policies? is it when
processing group policies? is it when
interacting with AD for authenticating the
user login?
This measure will not be available for VMware
RDS servers operating on Windows 2003.
User account discovery:
Indicates the amount of time
taken by the system call to
get account information for
this user during the last
measurement period.
Msecs Compare the value of this measure across
users to know which user’s logon process
spent maximum time in retrieving account
information.
This measure will not be available for VMware
RDS servers operating on Windows 2003.
LDAP bind time to Active
Directory:
Indicates the amount of time
taken by the LDAP call for
this user to connect and bind
to Active Directory during the
last measurement period.
MSecs Compare the value of this measure across
users to know which user’s logon process
spent maximum time in connecting to Active
Directory. Besides impacting authentication
time, high LDAP bind time may also affect
group policy processing.
This measure will not be available for VMware
RDS servers operating on Windows 2003.

MONITORING THE VMWAR E VIEW RDS
14
Client side extension
processed time:
Indicates the amount of time
that client side extensions
took for processing group
policies for this user during
the last measurement period.
MSecs Compare the value of this measure across
users to know which user’s logon process
spent maximum time in group policy
processing.
If this measure reports an unusually high
value for any user, then, you may want to
check the value of the LDAP bind time to
Active Directory measure for that user to
figure out if a delay in connecting to AD is
affecting group policy processing. This is
because, group policies are built on top of
AD, and hence rely on the directory service’s
infrastructure for their operation. As a
consequence, DNS and AD issues may affect
Group Policies severely. One could say that if
an AD issue does not interfere with
authentication, at the very least it will
hamper group policy processing.
You can also use the detailed diagnosis of
this measure to know which client side
extension was used to process which group
policy for a particular user.
This measure will not be available for VMware
RDS servers operating on Windows 2003.
DC discovery time:
Indicates the time taken to
discover the domain
controller to be used for
processing group policies for
this user during the last
measurement period.
MSecs Compare the value of this measure across
users to know which user’s logon process
spent maximum time in domain controller
discovery.
This measure will not be available for VMware
RDS servers operating on Windows 2003.
Total group policy object
file accessed tme:
Indicates the amount of time
the logon process took to
access group policy object
files for this user during the
last measurement period.
MSecs Compare the value of this measure across
users to know which user’s logon process
spent maximum time in accessing the group
policy object file.
This measure will not be available for VMware
RDS servers operating on Windows 2003.
MONITORING THE VMWAR E VIEW RDS
15
User profile load time:
Indicates the amount of time
it took to load this user’s
profile successfully in the last
measurement period.
MSecs Compare the value of this measure across
users to know which user’s profile took the
longest time to load. One of the common
reasons for long profile load times is large
profile size. In such circumstances, you can
use the User Profile test to determine the
current size of this user’s profile. If the profile
size is found to be large, you can conclude
that it is indeed the size of the profile which
is affecting the profile load time.
Another reason would be the absence of a
profile. If the user does not already have a
profile a new one is created. This slows down
the initial logon quite a bit compared to
subsequent logons. The main reason is that
Active Setup runs the IE/Mail/Theme
initialization routines.
Moreover, this measure reports the average
time taken for loading a user’s profile across
all the sessions of that user. To know the
profile load time per user session, use the
detailed diagnosis of this measure. This will
accurately pinpoint the session in which the
profile took the longest to load.
This measure will not be available for VMware
RDS servers operating on Windows 2003.
Profile load starts:
Indicates the number of
times this user’s profile was
loaded in the last
measurement period.
Number This metric gives an idea of the rate at which
users are logging in to the server.
Group policy starts:
Indicates the number of
group policy applications
started for this user in the
last measurement period.
Number Logon performance improves when fewer
Group Policies are applied. Merge GPOs when
possible instead of having multiple GPOs.
Group policy completes:
Indicates the number of
group policy applications
completed for this user in the
last measurement period.
Number
MONITORING THE VMWAR E VIEW RDS
16
Client side extensions
applied:
Indicates the number of client
side extensions used for
processing group policies for
this user during the last
measurement period.
Number
Max group policy time:
Indicates the maximum time
taken for applying group
policies for this user in the
last measurement period.
Msecs This measure will be available only for
VMware RDS servers operating on Windows
2003.
Profile load starts:
Indicates the number of
profile loads started for this
user in the last measurement
period.
Number Use the detailed diagnosis of this measure to
know the details of the user sessions in which
profile loads were started.
Profile load successes:
Indicates the number of
successful profile loads for
this user in the last
measurement period.
Number
Profile loading failures:
Indicates the number of
profile load failures for this
user in the last measurement
period.
Number An unusual increase in number of profile
loading failures is a cause for concern. The
userenv.log/event logs file will have details of
what profile loads failed and why.
Profile load failures
percent:
Indicates the percentage of
profile loads that failed for
this user in the last
measurement period.
Percent A low value is desired for this measure.
Compare the value of this measure across
users to know which user’s profile failed to
load most often.

MONITORING THE VMWAR E VIEW RDS
17
Avg user profile load time:
Indicates the average time it
took to load this user’s
profile successfully in the last
measurement period.
Msecs Ideally, profile load time should be low for
any user. A high value or a consistent rise in
this value is a cause for concern, as it
indicates a delay in profile loading. This in
turn will have a negative impact on user
experience. One of the common reasons for
long profile load times is large profile size.
Compare the value of this measure across
users to identify that user whose profile took
the longest to load. Then, use the User
Profile test to determine the current size of
this user’s profile. If the profile size is found
to be large, you can conclude that it is indeed
the size of the profile which is affecting the
profile load time.
This measure will be available only for
VMware RDS servers operating on Windows
2003.
Max profile load time:
Indicates the maximum time
it took to load a profile during
the last measurement period.
Msecs This measure will be available only for
VMware RDS servers operating on Windows
2003.
Profile unload starts:
Indicates the number of
profile unloads started for this
user during the last
measurement period.
Number Use the detailed diagnosis of this measure
measure to know when a user’s session was
initiated and how long each session remained
active on the RDS server. From this, you can
infer how many sessions were active for a
user on the server and the duration of each
session, and thus identify long-running
sessions for the user.
Profile unload successes:
Indicates the number of
successful profile unloads for
this user during the last
measurement period.
Number
Profile unload failures:
Indicates the number of
unsuccessful profile unloads
during the last measurement
period.
Number
Profile unload failures
percent:
Indicates the profile unload
failures as a percentage of
the total profile unloads.
Percent

MONITORING THE VMWAR E VIEW RDS
18
Avg user profile unload
time:
Indicates the average time
for unloading a profile during
the last measurement period.
Msecs This measure will be available only for
VMware RDS servers operating on Windows
2003.
Max profile unload time:
Indicates the maximum time
for unloading a profile during
the last measurement period.
Msecs This measure will be available only for
VMware RDS servers operating on Windows
2003.
System policy starts:
Indicates the number of
system policy processes that
were started for this user in
the last measurement period.
Number
System policy completes:
Indicates the number of
system policy completions for
this user in the last
measurement period.
Number Compare the total number of starts to
completions. if there is a significant
discrepancy, this denotes a bottleneck in
system policy application. Check the
userenv.log file for more details.
Avg system policy
processing time:
Indicates the average time
taken for applying system
policies in the last
measurement period for this
user.
Msecs If the system policy times are long, check the
detailed diagnosis to view if the policy
handling is taking time for all users. Analyze
the userenv.log to determine the reason for
any slowdown.
Max system policy time:
Indicates the maximum time
for applying system policies
for this user in the last
measurement period.
Msecs
As stated earlier, the user logon process includes a series of steps – eg., domain discovery,
authentication, GPO application, profile loading, etc. - that culminate in a user gaining access to an
application deployed on an RDS server. These individual steps may not always occur in sequence –
i.e., one after another; in fact usually, they occur parallely. This is why, the value of the Logon
duration measure will not be an aggregate of the time values reported by the other metrics of the
User Logon test.
1.2 The RDS Application Layer The health of a VMware RDS server depends upon the health of the applications it hosts. The RDS Applications test
associated with this layer monitors application health.

MONITORING THE VMWAR E VIEW RDS
19
Figure 1. 3: The test mapped to the RDS Applications layer
1.2.1 RDS Applications Test
This test reports statistics pertaining to the different applications deployed within the VMware RDS server and their
usage by its clients.
Purpose Returns the performance measures pertaining to the applications published on the VMware RDS
server
Target of the
test
A VMware RDS server
Agent
deploying the
test
An internal agent

MONITORING THE VMWAR E VIEW RDS
20
Configurable
parameters for
the test
1. TEST PERIOD – How often should the test be executed
2. HOST – The host for which the test is to be configured
3. PORT – Refers to the port used by the VMware RDS server
4. APPS - By default, all is displayed here, which will auto-discover and monitor all the
applications that are running on the VMware RDS server. To monitor specific applications
instead, you have to enter a comma separated list of processName:processPattern pairs
which identify the applications published on the server being considered. processName is a
string that will be used for display purposes only. processPattern is an expression of the
form - *expr* or expr or *expr or expr* or *expr1*expr2*... or expr1*expr2, etc. A leading
'*' signifies any number of leading characters, while a trailing '*' signifies any number of
trailing characters. The pattern(s) used vary from one application to another and must be
configured per application. For example, if a Microsoft Word application has been published
on the VMware RDS server, then the PROCESS to be specified is: Word:*winword*,
where Word is the string to be displayed in the monitor interface, and *winword* is the
application’s executable. Other special characters such as slashes (\) can also be used
while defining the process pattern. For example, if a server’s root directory is
/home/egurkha/apache and the server executable named httpd exists in the bin directory,
then, the process pattern is “*/home/egurkha/apache/bin/httpd*”.
The test will rediscover the applications every 6th time the test runs.
5. REPORT BY DOMAIN NAME – By default, this flag is set to Yes. This implies that by
default, the detailed diagnosis of this test will display the domainname\username of each
user who accessed an application on the server. This way, administrators will be able to
quickly determine which user logged into the server from which domain. If you want the
detailed diagnosis to display only the username of these users, set this flag to No.
6. ENABLE BROWSER MONITORING – By default, this flag is set to No, indicating that the
eG agent does not monitor browser activity on the VMware RDS server. If this flag is set to
Yes, then, whenever one/more IE (Internet Explorer) browser instances on the RDS server
are accessed, the detailed diagnosis of the Processes running measure will additionally
reveal the URL being accessed via each IE instance and the resources consumed by every
URL. Armed with this information, administrators can identify the web sites that are
responsible for excessive resource usage by an IE instance.
7. DETAILED DIAGNOSIS - To make diagnosis more efficient and accurate, the eG
Enterprise suite embeds an optional detailed diagnostic capability. With this capability, the
eG agents can be configured to run detailed, more elaborate tests as and when specific
problems are detected. To enable the detailed diagnosis capability of this test for a
particular server, choose the On option. To disable the capability, click on the Off option.
The option to selectively enabled/disable the detailed diagnosis capability will be available
only if the following conditions are fulfilled:
The eG manager license should allow the detailed diagnosis capability
Both the normal and abnormal frequencies configured for the detailed diagnosis
measures should not be 0.
Outputs of the
test
One set of results is reported for each application
Measurements
made by the Measurement
Measurement
Unit Interpretation
MONITORING THE VMWAR E VIEW RDS
21
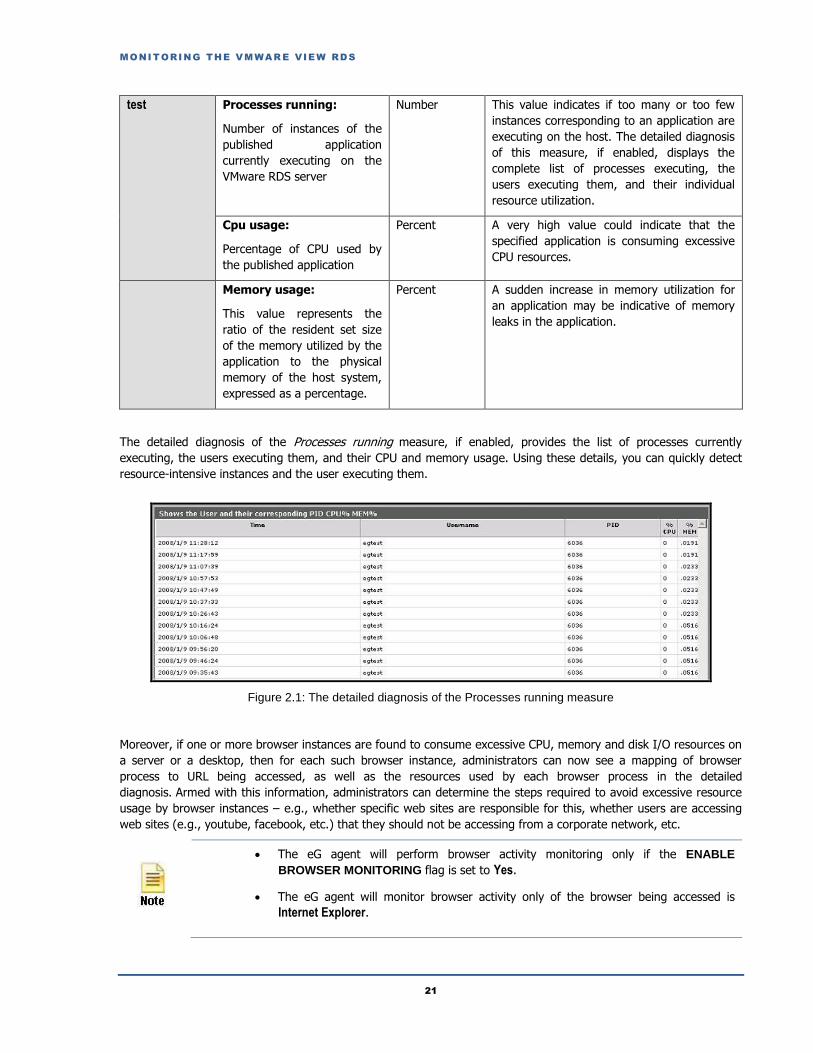
test Processes running:
Number of instances of the
published application
currently executing on the
VMware RDS server
Number This value indicates if too many or too few
instances corresponding to an application are
executing on the host. The detailed diagnosis
of this measure, if enabled, displays the
complete list of processes executing, the
users executing them, and their individual
resource utilization.
Cpu usage:
Percentage of CPU used by
the published application
Percent A very high value could indicate that the
specified application is consuming excessive
CPU resources.
Memory usage:
This value represents the
ratio of the resident set size
of the memory utilized by the
application to the physical
memory of the host system,
expressed as a percentage.
Percent A sudden increase in memory utilization for
an application may be indicative of memory
leaks in the application.
The detailed diagnosis of the Processes running measure, if enabled, provides the list of processes currently
executing, the users executing them, and their CPU and memory usage. Using these details, you can quickly detect
resource-intensive instances and the user executing them.
Figure 2.1: The detailed diagnosis of the Processes running measure
Moreover, if one or more browser instances are found to consume excessive CPU, memory and disk I/O resources on
a server or a desktop, then for each such browser instance, administrators can now see a mapping of browser
process to URL being accessed, as well as the resources used by each browser process in the detailed
diagnosis. Armed with this information, administrators can determine the steps required to avoid excessive resource
usage by browser instances – e.g., whether specific web sites are responsible for this, whether users are accessing
web sites (e.g., youtube, facebook, etc.) that they should not be accessing from a corporate network, etc.
The eG agent will perform browser activity monitoring only if the ENABLE
BROWSER MONITORING flag is set to Yes.
The eG agent will monitor browser activity only of the browser being accessed is
Internet Explorer.

MONITORING THE VMWAR E VIEW RDS
22
1.3 The RDS Users Layer By continuously monitoring the user behavior on a VMware RDS server, administrators can accurately gauge resource
usage per user, and derive guidelines for upgrading server capacity and imposing stricter access rules. The tests
associated with this layer (see Figure 1.4) facilitate such user-related analysis.
Figure 1. 4: The tests mapped to the RDS Users layer
1.3.1 RDS Listeners Test The listener component runs on the VMware RDS server and is responsible for listening for and accepting new client
connections. If this listener component is down, users may not be able to access applications on the RDS hosts!
This is why, if a user complains of the inaccessibility of an application, administrators should first check whether the
RDS listener component is up and running or not. The RDS Listeners test helps administrators perform this check.
This test tracks the status of the default listener ports and reports whether any of the ports is down.
Purpose Tracks the status of the default listener ports and reports whether any of the ports is down
Target A VMware RDS server
Agent deploying
this test
Internal agent
Configurable
parameters for
this test
1. TEST PERIOD - How often should the test be executed
2. HOST - The host for which the test is to be configured.
3. PORT - The port at which the HOST listens
4. SESSION IDS – The default listener ports - 65536,65537,65538 – will be displayed here
by default. You can override this default specification by adding more ports or by
removing one/more existing ports.
Outputs of the
test
One set of outputs for every listener port configured
Measurements of
the test Measurement Measurement
Unit Interpretation
MONITORING THE VMWAR E VIEW RDS
23
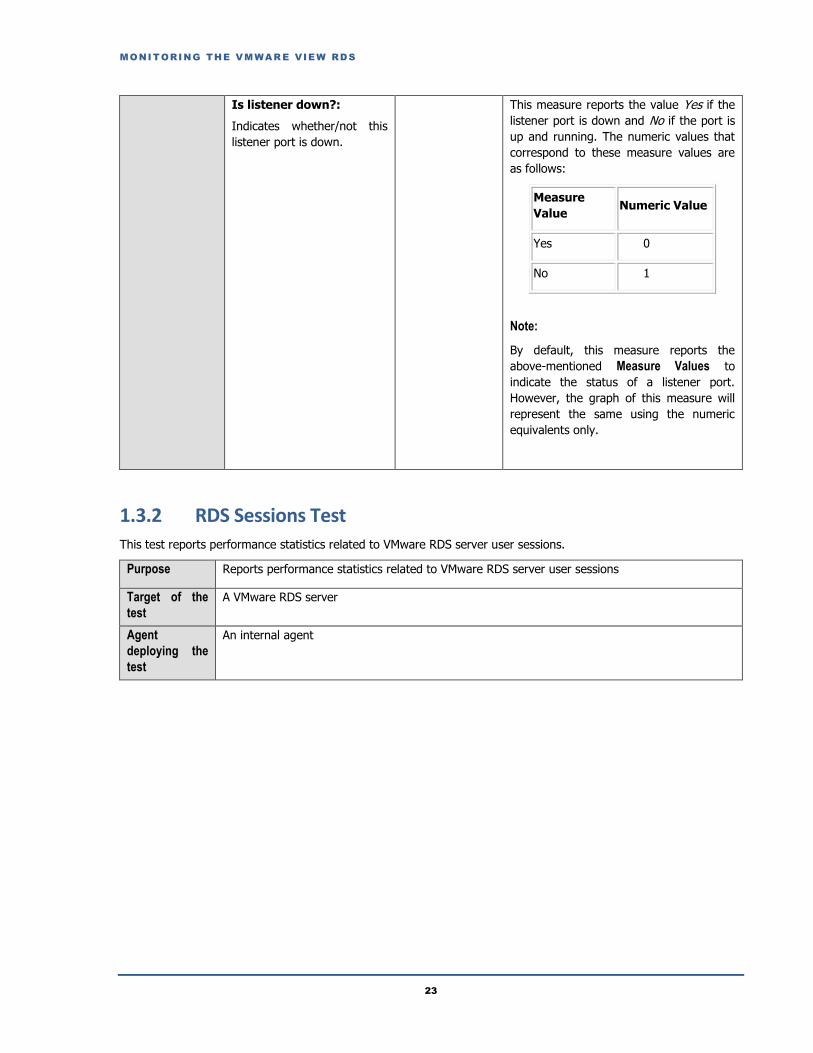
Is listener down?:
Indicates whether/not this
listener port is down.
This measure reports the value Yes if the
listener port is down and No if the port is
up and running. The numeric values that
correspond to these measure values are
as follows:
Measure
Value Numeric Value
Yes 0
No 1
Note:
By default, this measure reports the
above-mentioned Measure Values to
indicate the status of a listener port.
However, the graph of this measure will
represent the same using the numeric
equivalents only.
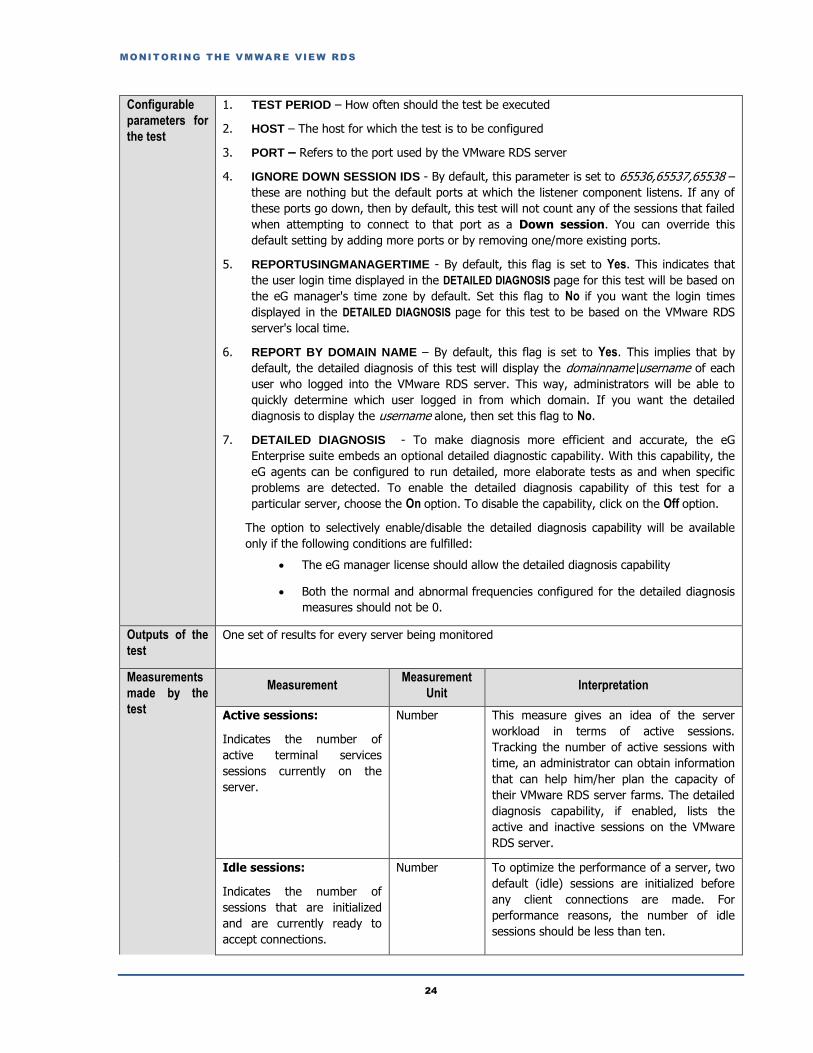
1.3.2 RDS Sessions Test
This test reports performance statistics related to VMware RDS server user sessions.
Purpose Reports performance statistics related to VMware RDS server user sessions
Target of the
test
A VMware RDS server
Agent
deploying the
test
An internal agent
MONITORING THE VMWAR E VIEW RDS
24
Configurable
parameters for
the test
1. TEST PERIOD – How often should the test be executed
2. HOST – The host for which the test is to be configured
3. PORT – Refers to the port used by the VMware RDS server
4. IGNORE DOWN SESSION IDS - By default, this parameter is set to 65536,65537,65538 –
these are nothing but the default ports at which the listener component listens. If any of
these ports go down, then by default, this test will not count any of the sessions that failed
when attempting to connect to that port as a Down session. You can override this
default setting by adding more ports or by removing one/more existing ports.
5. REPORTUSINGMANAGERTIME - By default, this flag is set to Yes. This indicates that
the user login time displayed in the DETAILED DIAGNOSIS page for this test will be based on
the eG manager's time zone by default. Set this flag to No if you want the login times
displayed in the DETAILED DIAGNOSIS page for this test to be based on the VMware RDS
server's local time.
6. REPORT BY DOMAIN NAME – By default, this flag is set to Yes. This implies that by
default, the detailed diagnosis of this test will display the domainname\username of each
user who logged into the VMware RDS server. This way, administrators will be able to
quickly determine which user logged in from which domain. If you want the detailed
diagnosis to display the username alone, then set this flag to No.
7. DETAILED DIAGNOSIS - To make diagnosis more efficient and accurate, the eG
Enterprise suite embeds an optional detailed diagnostic capability. With this capability, the
eG agents can be configured to run detailed, more elaborate tests as and when specific
problems are detected. To enable the detailed diagnosis capability of this test for a
particular server, choose the On option. To disable the capability, click on the Off option.
The option to selectively enable/disable the detailed diagnosis capability will be available
only if the following conditions are fulfilled:
The eG manager license should allow the detailed diagnosis capability
Both the normal and abnormal frequencies configured for the detailed diagnosis
measures should not be 0.
Outputs of the
test
One set of results for every server being monitored
Measurements
made by the
test
Measurement Measurement
Unit Interpretation
Active sessions:
Indicates the number of
active terminal services
sessions currently on the
server.
Number This measure gives an idea of the server
workload in terms of active sessions.
Tracking the number of active sessions with
time, an administrator can obtain information
that can help him/her plan the capacity of
their VMware RDS server farms. The detailed
diagnosis capability, if enabled, lists the
active and inactive sessions on the VMware
RDS server.
Idle sessions:
Indicates the number of
sessions that are initialized
and are currently ready to
accept connections.
Number To optimize the performance of a server, two
default (idle) sessions are initialized before
any client connections are made. For
performance reasons, the number of idle
sessions should be less than ten.

MONITORING THE VMWAR E VIEW RDS
25
Connected sessions:
Indicates the current number
of sessions that are
connected, but no user has
logged on to the server.
Number A consistent increase in the value of this
measure could indicate that users are having
trouble logging in. Further investigation may
hence be required.
Connecting sessions:
Indicates the number of
sessions that are in the
process of connecting.
Number A very high value for this measure indicates a
problem with the session or connection.
Disconnected sessions:
Indicates the number of
sessions from which users
have disconnected, but which
are still active and can be
reconnected.
Number Too many disconnected sessions running
indefinitely on a VMware RDS server cause
excessive consumption of the server
resources. To avoid this, a session limit is
typically configured for disconnected sessions
on the VMware RDS server. When a session
limit is reached for a disconnected session,
the session ends, which permanently deletes
it from the server.
Listen sessions:
Indicates the current number
of sessions that are ready to
accept connections.
Number
Shadow sessions:
Indicates the current number
of sessions that are remotely
controlling other sessions.
Number A non-zero value for this measure indicates
the existence of shadow sessions that are
allowed to view and control the user activity
on another session. Such sessions help in
troubleshooting/resolving problems with
other sessions under their control.
Down sessions:
Indicates the current number
of sessions that could not be
initialized or terminated.
Number Ideally, the value of this measure should be
0.
By default, if sessions to any of these ports –
65536, 65537, 65538 – could not be initialized
or terminated, they will not be counted as a
‘down session’.
Init sessions:
Indicates the current number
of sessions that are
initializing.
Number A high value for this measure could indicate
that many sessions are currently experiencing
initialization problems.
The detailed diagnosis capability of the Active sessions measure, if enabled, lists the active and inactive sessions on
the VMware RDS server, and provides details such as the user who initiated the sessions, the session login time, the
duration for which the session was idle, etc.

MONITORING THE VMWAR E VIEW RDS
26
Figure 2.2: The detailed diagnosis of the Active sessions measure
1.3.3 RDS Users Test
A VMware RDS server environment is a shared environment in which multiple users connect to a server/server farm
and access a wide variety of applications. When server resources are shared, excessive resource utilization by a
single user could impact the performance for other users. Therefore, continuous monitoring of the activities of each
and every user on the server is critical. Towards this end, the RDS Users test assesses the traffic between the user
terminal and the server, and also monitors the resources taken up by a user's session on the server. The results of
this test can be used in troubleshooting and proactive monitoring. For example, when a user reports a performance
problem, an administrator can quickly check the bandwidth usage of the user's session, the CPU/memory/disk usage
of this user's session as well as the resource usage of other user sessions. The admin also has access to details on
what processes/applications the user is accessing and their individual resource usage. This information can be used
to spot any offending processes/ applications.
Purpose Tracks every user connection from the VMware View client to the RDS server, and monitors the
resource utilization of every user on the RDS server
Target of the
test
A VMware RDS server
Agent
deploying the
test
An internal agent

MONITORING THE VMWAR E VIEW RDS
27
Configurable
parameters for
the test
1. TEST PERIOD – How often should the test be executed
2. HOST – The host for which the test is to be configured
3. PORT – Refers to the port used by the VMware RDS server
4. USERNAMES - Specify the name of the user whose performance statistics need to be
generated. Multiple user names can be specified as a comma-separated list. all is used to
indicate that all users of the VMware RDS server are to be monitored.
5. REPORT BY DOMAIN NAME – By default, this flag is set to Yes. This implies that by
default, this test will report metrics for every domainname\username. This way,
administrators will know which user logged in from which domain. If you want the test to
report metrics for every username only, then set this flag to No.
6. ENABLE BROWSER MONITORING – By default, this flag is set to No, indicating that the
eG agent does not monitor browser activity on the VMware RDS server. If this flag is set to
Yes, then, whenever one/more IE (Internet Explorer) browser instances on the RDS server
are accessed, the detailed diagnosis of the User sessions measure will additionally reveal
the URL being accessed via each IE instance and the resources consumed by every
URL. Armed with this information, administrators can identify the web sites that are
responsible for excessive resource usage by an IE instance.
7. DETAILED DIAGNOSIS - To make diagnosis more efficient and accurate, the eG
Enterprise suite embeds an optional detailed diagnostic capability. With this capability, the
eG agents can be configured to run detailed, more elaborate tests as and when specific
problems are detected. To enable the detailed diagnosis capability of this test for a
particular server, choose the On option. To disable the capability, click on the Off option.
The option to selectively enable/disable the detailed diagnosis capability will be available
only if the following conditions are fulfilled:
The eG manager license should allow the detailed diagnosis capability
Both the normal and abnormal frequencies configured for the detailed diagnosis
measures should not be 0.
Outputs of the
test
One set of results for every user logged into the VMware RDS server
Measurements
made by the
test
Measurement Measurement
Unit Interpretation
User sessions:
Represents the current number
of sessions for a particular user
Number A value of 0 indicates that the user is not
currently connected to the VMware RDS
server.
CPU usage of user’s
processes:
The cpu utilization for a session
is the percentage of time that
all of the threads/processes of a
user session used the processor
to execute instructions. If a
user is connected via multiple
sessions, the value reported is
the sum of all cpu utilizations
across all the sessions.
Percent This value indicates the percentage of
Cpu resources that are used by
applications run by this user. Excessive
CPU usage by a user can impact
performance for other users. Check the
detailed diagnosis to view the offending
processes/applications.
MONITORING THE VMWAR E VIEW RDS
28
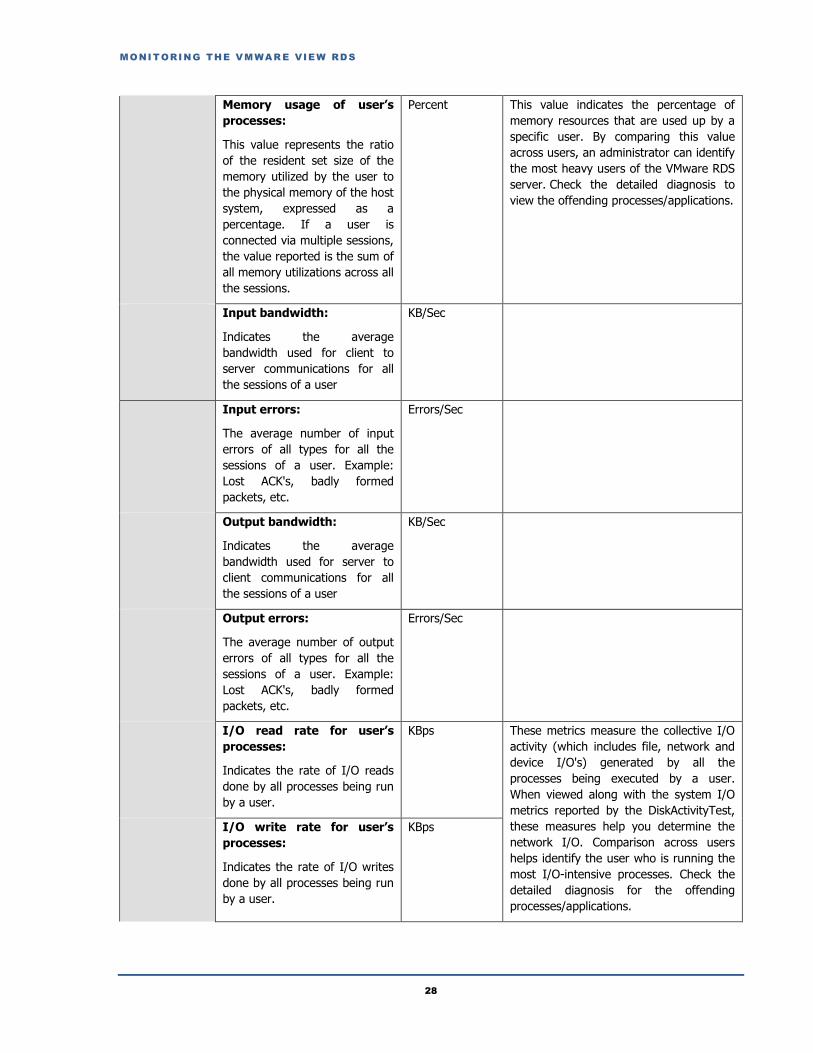
Memory usage of user’s
processes:
This value represents the ratio
of the resident set size of the
memory utilized by the user to
the physical memory of the host
system, expressed as a
percentage. If a user is
connected via multiple sessions,
the value reported is the sum of
all memory utilizations across all
the sessions.
Percent This value indicates the percentage of
memory resources that are used up by a
specific user. By comparing this value
across users, an administrator can identify
the most heavy users of the VMware RDS
server. Check the detailed diagnosis to
view the offending processes/applications.
Input bandwidth:
Indicates the average
bandwidth used for client to
server communications for all
the sessions of a user
KB/Sec
Input errors:
The average number of input
errors of all types for all the
sessions of a user. Example:
Lost ACK's, badly formed
packets, etc.
Errors/Sec
Output bandwidth:
Indicates the average
bandwidth used for server to
client communications for all
the sessions of a user
KB/Sec
Output errors:
The average number of output
errors of all types for all the
sessions of a user. Example:
Lost ACK's, badly formed
packets, etc.
Errors/Sec
I/O read rate for user’s
processes:
Indicates the rate of I/O reads
done by all processes being run
by a user.
KBps These metrics measure the collective I/O
activity (which includes file, network and
device I/O's) generated by all the
processes being executed by a user.
When viewed along with the system I/O
metrics reported by the DiskActivityTest,
these measures help you determine the
network I/O. Comparison across users
helps identify the user who is running the
most I/O-intensive processes. Check the
detailed diagnosis for the offending
processes/applications.
I/O write rate for user’s
processes:
Indicates the rate of I/O writes
done by all processes being run
by a user.
KBps
MONITORING THE VMWAR E VIEW RDS
29
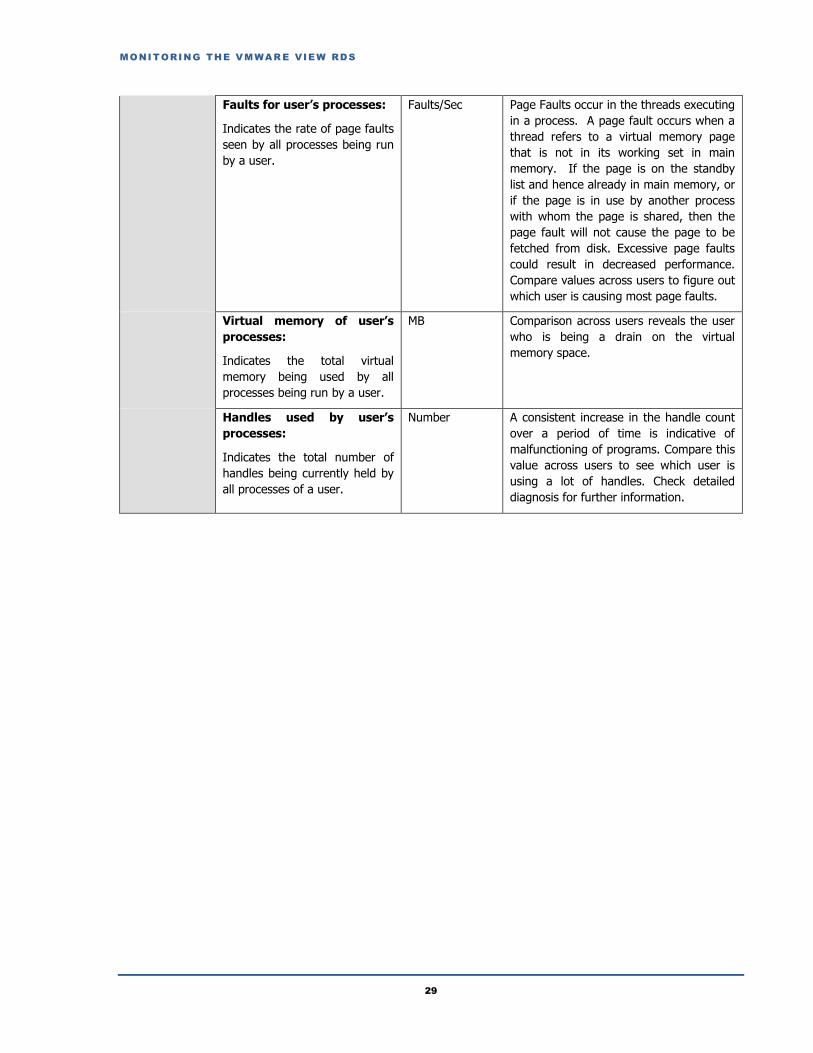
Faults for user’s processes:
Indicates the rate of page faults
seen by all processes being run
by a user.
Faults/Sec Page Faults occur in the threads executing
in a process. A page fault occurs when a
thread refers to a virtual memory page
that is not in its working set in main
memory. If the page is on the standby
list and hence already in main memory, or
if the page is in use by another process
with whom the page is shared, then the
page fault will not cause the page to be
fetched from disk. Excessive page faults
could result in decreased performance.
Compare values across users to figure out
which user is causing most page faults.
Virtual memory of user’s
processes:
Indicates the total virtual
memory being used by all
processes being run by a user.
MB Comparison across users reveals the user
who is being a drain on the virtual
memory space.
Handles used by user’s
processes:
Indicates the total number of
handles being currently held by
all processes of a user.
Number A consistent increase in the handle count
over a period of time is indicative of
malfunctioning of programs. Compare this
value across users to see which user is
using a lot of handles. Check detailed
diagnosis for further information.

MONITORING THE VMWAR E VIEW RDS
30
CPU time used by user’s
sessions:
Indicates the percentage of
time, across all processors, this
user hogged the CPU.
Percent The CPU usage for user’s processes
measure averages out the total CPU
usage of a user on the basis of the
number of processors. For instance, if
your VMware RDS server is using an 8-
core processor and the total CPU usage of
a user across all his/her sessions amounts
to 80%, then the value of the CPU usage
for user’s processes measure for that
user will be 10 % (80/8 processors = 10).
This accurately denotes the extent of CPU
usage in an environment where load is
uniformly balanced across multiple
processors. However, in environments
where load is not well-balanced, the CPU
usage for user’s processes measure may
not be an accurate indicator of CPU usage
per user. For instance, if a single
processor is used nearly 80% of the time
by a user, and other 7 processors in the
8-core processor environment are idle,
the CPU usage for user’s processes
measure will still report CPU usage as
10%. This may cause administrators to
miss out on the fact that the user is
actually hogging a particular processor! In
such environments therefore, its best to
use the CPU time used by user’s sessions
measure! By reporting the total CPU
usage of a user across all his/her sessions
and across all the processors the target
VMware RDS server supports, this
measure serves as the true indicator of
the level of CPU usage by a user in
dynamic environments. For instance, in
the example above, the CPU time used by
user’s sessions of the user will be 80%
(and not 10%, as in the case of the CPU
usage for user’s processes measure). A
high value or a consistent increase in the
value of this measure is hence serious and
demands immediate attention. In such
situations, use the detailed diagnosis of
the CPU usage for user’s processes
measure to know what CPU-intensive
activities are being performed by the user.
The detailed diagnosis of the User sessions, CPU usage of user’s processes, and Memory usage of user’s processes
measures lists the processes executed by a user on the VMware RDS server, and reports the resource usage of each
process (see Figure 2.3).

MONITORING THE VMWAR E VIEW RDS
31
Figure 2.3: The detailed diagnosis of the User sessions measure
Where one/more instances of the Internet Explorer browser are running, the detailed diagnosis additionally displays
the website URL accessed using each IE instance, the domain of every URL, and the website title. In the event of
excessive resource usage by an IE instance, this information will shed light on the resource-intensive web site that
was being accessed.
The eG agent will perform browser activity monitoring only if the ENABLE
BROWSER MONITORING flag is set to Yes.
The eG agent will monitor browser activity only of the browser being accessed is
Internet Explorer.
1.3.4 RDS Disconnects Test
A user session is terminated when a user logs off from the VMware RDS server or when the session is abruptly
interrupted (e.g., due to server, network, or application errors). When a user logs off, all the applications started by
the user are terminated. However, when a user disconnects, the applications started by the user will keep running on
the server consuming resources. Hence, the number of disconnected sessions on a VMware RDS server should be
kept to a minimum. Abrupt disconnects can significantly impact the end user experience, and hence, it is important
to monitor the number of disconnected sessions at any point of time.
Purpose Measures the number of disconnected VMware RDS server sessions
Target of the
test
A VMware RDS server
Agent
deploying the
test
An internal agent
MONITORING THE VMWAR E VIEW RDS
32
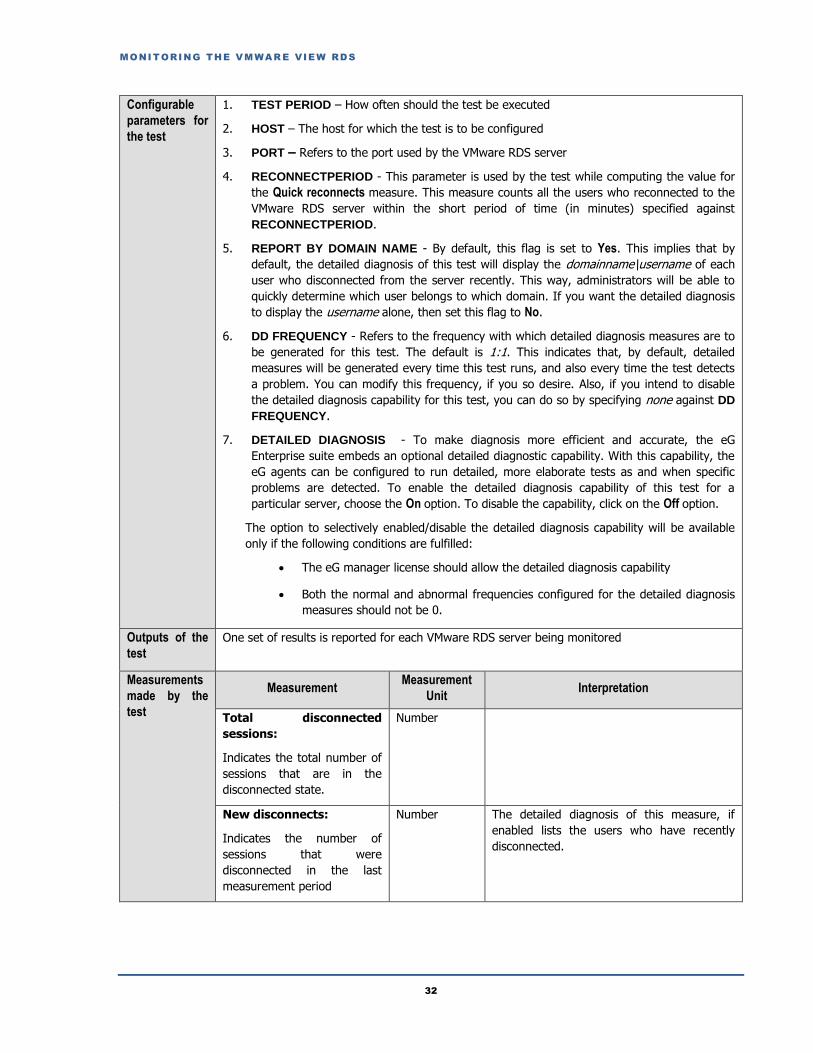
Configurable
parameters for
the test
1. TEST PERIOD – How often should the test be executed
2. HOST – The host for which the test is to be configured
3. PORT – Refers to the port used by the VMware RDS server
4. RECONNECTPERIOD - This parameter is used by the test while computing the value for
the Quick reconnects measure. This measure counts all the users who reconnected to the
VMware RDS server within the short period of time (in minutes) specified against
RECONNECTPERIOD.
5. REPORT BY DOMAIN NAME - By default, this flag is set to Yes. This implies that by
default, the detailed diagnosis of this test will display the domainname\username of each
user who disconnected from the server recently. This way, administrators will be able to
quickly determine which user belongs to which domain. If you want the detailed diagnosis
to display the username alone, then set this flag to No.
6. DD FREQUENCY - Refers to the frequency with which detailed diagnosis measures are to
be generated for this test. The default is 1:1. This indicates that, by default, detailed
measures will be generated every time this test runs, and also every time the test detects
a problem. You can modify this frequency, if you so desire. Also, if you intend to disable
the detailed diagnosis capability for this test, you can do so by specifying none against DD
FREQUENCY.
7. DETAILED DIAGNOSIS - To make diagnosis more efficient and accurate, the eG
Enterprise suite embeds an optional detailed diagnostic capability. With this capability, the
eG agents can be configured to run detailed, more elaborate tests as and when specific
problems are detected. To enable the detailed diagnosis capability of this test for a
particular server, choose the On option. To disable the capability, click on the Off option.
The option to selectively enabled/disable the detailed diagnosis capability will be available
only if the following conditions are fulfilled:
The eG manager license should allow the detailed diagnosis capability
Both the normal and abnormal frequencies configured for the detailed diagnosis
measures should not be 0.
Outputs of the
test
One set of results is reported for each VMware RDS server being monitored
Measurements
made by the
test
Measurement Measurement
Unit Interpretation
Total disconnected
sessions:
Indicates the total number of
sessions that are in the
disconnected state.
Number
New disconnects:
Indicates the number of
sessions that were
disconnected in the last
measurement period
Number The detailed diagnosis of this measure, if
enabled lists the users who have recently
disconnected.

MONITORING THE VMWAR E VIEW RDS
33
Quick reconnects:
Indicates the number of users
who reconnected soon after a
disconnect.
Number The detailed diagnosis of this measure, if
enabled lists the users who have reconnected
quickly.
The detailed diagnosis for the New disconnects measurement indicates the user, session ID, and client type for each
newly disconnected session. This information can be used to track whether specific users are being disconnected
often (see Figure 2.4).
Figure 2.4: The detailed diagnosis of the New disconnects measure
The detailed diagnosis for the Quick reconnects measurement indicates the user, session ID, client type, the exact
time at which the session disconnected, and duration of the disconnect, for each session that quickly reconnected.
This information can be used to track whether specific users are being disconnected often (see Figure 2.5).
Figure 2.5: The detailed diagnosis of the Quick reconnects measure
1.3.5 RDS Logins Test
This test monitors the new logins to the VMware RDS server.
Purpose Monitors the new logins to the VMware RDS server
Target of the
test
Any VMware RDS server
Agent
deploying the
test
An internal agent

MONITORING THE VMWAR E VIEW RDS
34
Configurable
parameters for
the test
1. TEST PERIOD – How often should the test be executed
2. HOST – The host for which the test is to be configured
3. PORT – Refers to the port used by the VMware RDS server
4. REPORTUSINGMANAGERTIME - By default, this flag is set to Yes. This indicates that
the user login time displayed in the DETAILED DIAGNOSIS page for this test will be based on
the eG manager's time zone by default. Set this flag to No if you want the login times
displayed in the DETAILED DIAGNOSIS page for this test to be based on the VMware RDS
server's local time.
5. REPORT BY DOMAIN NAME – By default, this flag is set to Yes. This implies that by
default, the detailed diagnosis of this test will display the domainname\username of each
user session that logged out. This default setting ensures that administrators are able to
quickly determine the domains to which the users who logged out belonged. You can set
this flag to No if you want detailed diagnosis to display only the username of the users who
logged out.
6. DD FREQUENCY - Refers to the frequency with which detailed diagnosis measures are to
be generated for this test. The default is 1:1. This indicates that, by default, detailed
measures will be generated every time this test runs, and also every time the test detects
a problem. You can modify this frequency, if you so desire. Also, if you intend to disable
the detailed diagnosis capability for this test, you can do so by specifying none against DD
FREQUENCY.
7. DETAILED DIAGNOSIS - To make diagnosis more efficient and accurate, the eG
Enterprise suite embeds an optional detailed diagnostic capability. With this capability, the
eG agents can be configured to run detailed, more elaborate tests as and when specific
problems are detected. To enable the detailed diagnosis capability of this test for a
particular server, choose the On option. To disable the capability, click on the Off option.
The option to selectively enabled/disable the detailed diagnosis capability will be available
only if the following conditions are fulfilled:
The eG manager license should allow the detailed diagnosis capability
Both the normal and abnormal frequencies configured for the detailed diagnosis
measures should not be 0.
Outputs of the
test
One set of results is reported for each VMware RDS server being monitored
Measurements
made by the
test
Measurement Measurement
Unit Interpretation
New logins:
Indicates the number of new
logins to the VMware RDS
server in the last
measurement period.
Number A consistent zero value could indicate a
connection issue.
Percent new logins:
Indicates the percentage of
current sessions that logged
in during the last
measurement period.
Percent

MONITORING THE VMWAR E VIEW RDS
35
Sessions logging out:
Indicates the number of
sessions that logged out.
Number If all the current sessions suddenly log out, it
indicates a problem condition that requires
investigation.
The detailed diagnosis of the Sessions logging out measure lists the sessions that logged out.
Figure 2.6: The detailed diagnosis of the Sessions logging out measure
CONCLUSION
36
Conclusion This document has described in detail the monitoring paradigm used and the measurement capabilities of the eG
Enterprise suite of products with respect to the VMware View. For details of how to administer and use the eG
Enterprise suite of products, refer to the user manuals.
We will be adding new measurement capabilities into the future versions of the eG Enterprise suite. If you can
identify new capabilities that you would like us to incorporate in the eG Enterprise suite of products, please contact
[email protected]. We look forward to your support and cooperation. Any feedback regarding this manual
or any other aspects of the eG Enterprise suite can be forwarded to [email protected].


![VMware ThinApp[1]](https://img.dokumen.tips/doc/110x75/577dabde1a28ab223f8d112b/vmware-thinapp1.jpg)