Embed Size (px)
Citation preview

Monitoring the Safety Monitoring the Safety of of Influenza A (H1N1) 2009 Influenza A (H1N1) 2009
Monovalent VaccinesMonovalent Vaccines
Claudia Vellozzi, MD, MPHClaudia Vellozzi, MD, MPHImmunization Safety OfficeImmunization Safety Office
Division of Healthcare Quality Promotion Division of Healthcare Quality Promotion Centers for Disease Control and PreventionCenters for Disease Control and Prevention
Atlanta, GAAtlanta, GA
November 18, 2009November 18, 2009

Overall Objectives for 2009 H1N1 Vaccine Safety Monitoring
Identify clinically significant adverse events following receipt of 2009 HINI vaccine in a timely manner
Rapidly evaluate serious adverse events following receipt of 2009 H1N1 vaccine and determine public health importance
Evaluate if there is a risk of Guillain-Barré syndrome (GBS) associated with the 2009 H1N1 vaccine
Communicate vaccine safety information in a clear and transparent manner to healthcare providers, public health officials, and the public

Today’s Objectives
Describe the CDC’s Immunization Safety Office surveillance systems for monitoring the safety of 2009 H1N1 vaccine
Provide preliminary data from each of these systems

Routine SystemsEnhanced for 2009
H1N1
Vaccine Adverse Event Reporting System (VAERS)
Enhanced VAERS
Real Time Immunization
Monitoring System (RTIMS)
Clinical Immunization
Safety Assessment (CISA)
Vaccine Safety Datalink (VSD)
Post licensure Rapid
Immuniztion Safety Monitoring
Monitoring Influenza A (H1N1) 2009 Monovalent Vaccine Adverse Events
Signal Detection(Identification of
Potential Vaccine Adverse Events)
Verification of Signal
Defense Medical Surveillance
System (DMSS)
GBS Active Case Findings (EIP)
Collaborations: FDA, American Academy of Neurology (AAN), International, VA, IHS, CMS

Vaccine Safety Datalink (VSD): Background
Established in 1990 A collaborative project among CDC and 8 managed care
organizations (MCOs) Allows for planned immunization safety studies as well as timely
investigations arising from– hypotheses from medical literature and pre-licensure – reports to the Vaccine Adverse Event Reporting System
(VAERS)– changes in immunization schedules, or the introduction of new
vaccines Since 2005, conducts routine Rapid Cycle Analysis (RCA) of newly
licensed and approved vaccines or modifications to existing vaccine recommendations

VSD Population
Collects medical care and vaccination data on more than 9.5 million members annually (3.1% of the US population)
As of 12/31/2008: 2,252,024 children (<18) enrolled
– 3.0% of US population
7,245,835 adults (≥18) enrolled – 3.1% of US population
Average yearly birth cohort ~ 95,000

VSD Sites: 2009
Northwest Kaiser Permanente
No. CA Kaiser Permanente
Harvard Pilgrim
Group Health Cooperative
So. CA Kaiser Permanente
Kaiser Permanente Colorado
Health Partners
Marshfield Clinic
CDC
AHIP

VSD Data Files + Chart Review
Immunizations Records
Hospital discharge
diagnosis codesEnrollment and demographics
Birth and death certificate
information
Linked by Study IDs
Outpatient and Clinic visits
+

VSD 2009 H1N1 Vaccine Safety Monitoring Specific Aims
Conduct rapid surveillance of 2009 H1N1 vaccine safety using – self controlled case series (SCCS) using binomial
maximized sequential probability ratio tests (maxSPRT) – comparisons with historical seasonal influenza vaccines
using Poisson maxSPRT
Conduct comprehensive analyses after immunization program is completed of associations between H1N1 vaccine and adverse events using a variety of statistical methods – Confirmatory Logistic Regression, SCCS, others (as
needed)
SCCS Example
Vaccination
-------------------------------------------------------------------------------------------
Days -56 -15 0 42 84
Unexposed (pre) Exposed Unexposed (post)

VSD 2009 H1N1 Vaccine Adverse Events under surveillance
GBS – first ever and first in a year diagnosis, complemented by chart review Demyelinating disease Disorders of the peripheral nervous system and neuropathies Seizures (epilepsy, convulsions) Encephalitis, myelitis, encephalomyelitis Bell’s Palsy Other cranial nerve disorders (Facial nerve disorders, Trigeminal nerve disorders) Ataxia (other cerebellar ataxia, ataxia) Anaphylaxis Angioneurotic edema, Allergic Reaction, Urticaria Myocarditis and pericarditis (LAIV only) Hemorrhagic stroke (subarachnoid hemorrhage, intracerebral hemorrhage, other and
unspecified intracranial hemorrhage) Ischemic stroke (excludes transient ischemic attack) Wheezing (LAIV only)
Asthma, wheezing, respiratory distress/insufficiency, other diseases of trachea/bronchi Multiple definitions with and without bronchiolitis
Pregnancy Outcomes – Spontaneous Abortions, Stillborn & Pre-eclampsia, eclampsia
Adjuvanted Outcomes – Autoimmune hepatitis and Thrombocytopenia
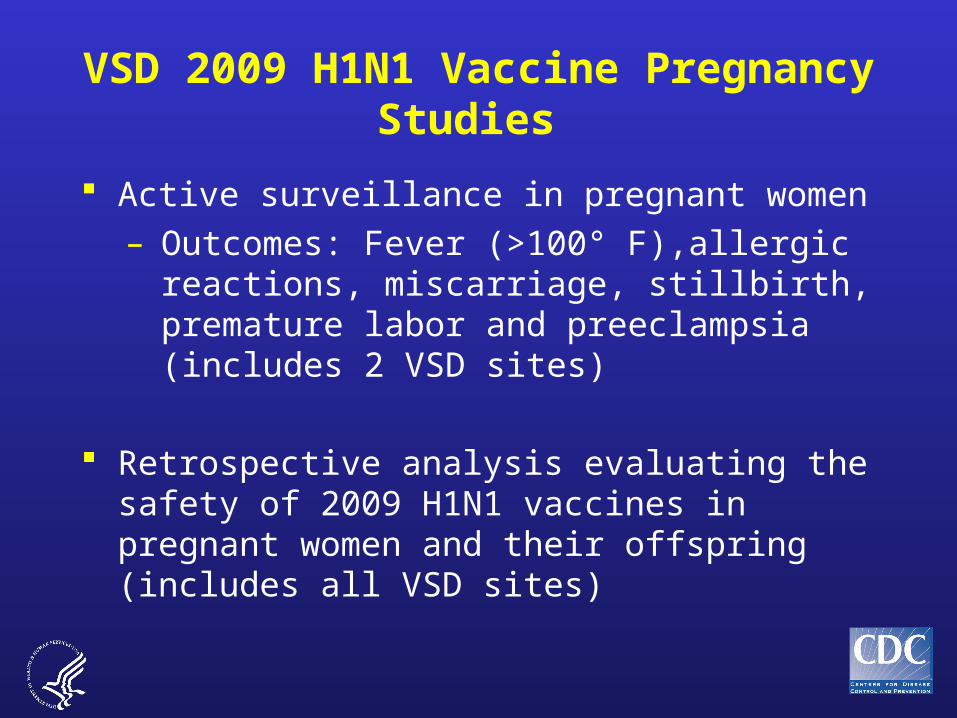
VSD 2009 H1N1 Vaccine Pregnancy Studies
Active surveillance in pregnant women– Outcomes: Fever (>100° F),allergic
reactions, miscarriage, stillbirth, premature labor and preeclampsia (includes 2 VSD sites)
Retrospective analysis evaluating the safety of 2009 H1N1 vaccines in pregnant women and their offspring (includes all VSD sites)
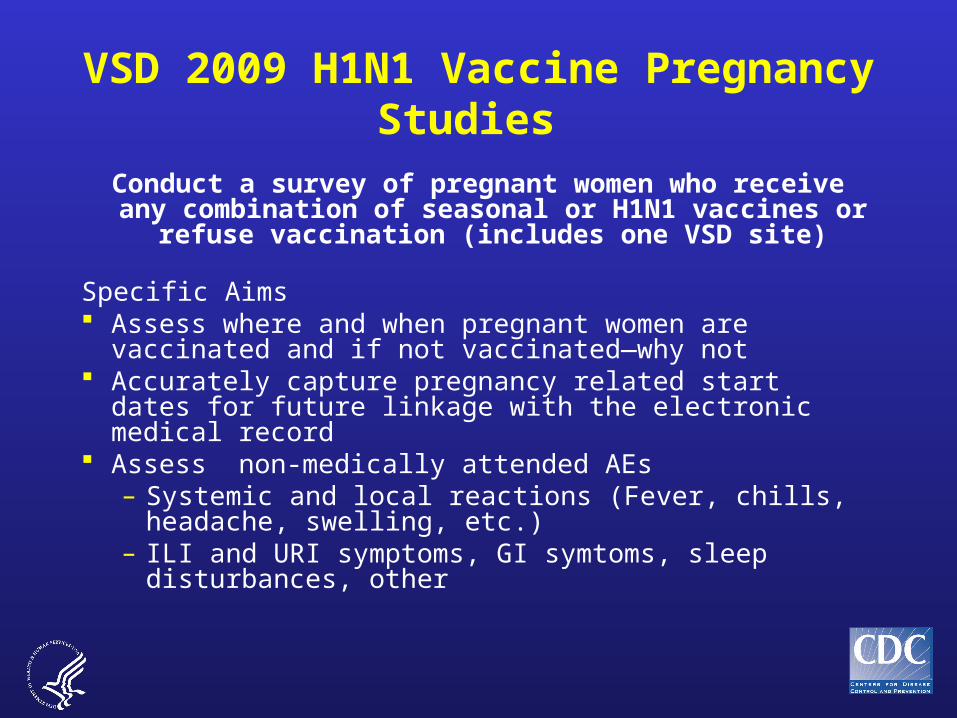
VSD 2009 H1N1 Vaccine Pregnancy Studies
Conduct a survey of pregnant women who receive any combination of seasonal or H1N1 vaccines or refuse
vaccination (includes one VSD site)
Specific Aims Assess where and when pregnant women are vaccinated
and if not vaccinated—why not Accurately capture pregnancy related start dates for future
linkage with the electronic medical record Assess non-medically attended AEs
– Systemic and local reactions (Fever, chills, headache, swelling, etc.)
– ILI and URI symptoms, GI symtoms, sleep disturbances, other

VSD 2009 H1N1 Vaccine Doses Administered as of Nov 13, 2009
Age Group
Novel H1N1-09,
nasal (LAMV)
Novel H1N1-09, preservative-free
Novel H1N1-09, unknown formulatio
ns
Novel H1N1-09, inactivated
, no adjuvant Total
< 25 104,741 2,275 4,948 92,019 203,983
25-49 15,619 1,429 5,898 54,315 77,261
50-64 446 740 4,840 34,915 40,941
65+ 137 67 491 4,213 4,908
Total 120,943 4,511 16,177 185,462 327,093
206,150 Inactivated Doses

VSD 2009-10 Seasonal Vaccine Doses Administered as of Nov
13, 2009
Age Group LAIV TIV Total
<25 81,838 524,549 606,387
25-49 17,749 455,141 472,890
50-64 498 507,813 508,311
65+ 281 557,624 557,905
Total 100,366 2,045,127 2,145,493

VSD 2009-10 Seasonal Influenza Vaccine Safety
Preliminary Findings

2009-10 Seasonal Trivalent Inactivated Influenza Vaccine
(TIV): SCCS –preliminary results
Outcome Window
(days) ObservedComparison
Window RR Signal
Demyelinating Disease 1-42 87 245 0.71 No
Disorders of Peripheral Nervous System 1-42 1108 2689 0.82 No
Seizures 0-7 61 48 1.27 No
Encephalitis/myelitis/encephalomyelitis 1-21 1 6 0.33 No
Bell's Palsy, 1-42 1-42 125 148 0.84 No
Bell's Palsy, 1-60 1-60 128 153 0.84 No
Other Cranial Nerve Disorders 1-42 140 439 0.64 No
Ataxia 1-42 9 19 0.95 No
Anaphylaxis 0-2 1 2 0.50 No
Allergic reactions 1-2 234 175 1.34 No
Total Doses Administered– 2,045,127

2009-10 Seasonal TIV Historical Comparison-
preliminary results
OutcomeWindow (Days)
Age Group Observed Expected RR Signal
GBS 1-42 >=6m 7 7.5 0.9 No Demyelinating diseas 1-42 6m-24y 4 3.8 1.0 NoDisorders of Peripheral Nervous System 1-42 6m-24y 18 22.1 0.8 No Encephalitis 1-21 >=6m 1 3.6 0.3 No Bell's palsy 1-42 1-42 6m-24y 4 13.2 0.3 No Bell's palsy 1-60 1-40 6m-24y 4 11.7 0.3 No Other Cranial Nerve Disorders 1-42 6m-24y 4 5.8 0.7 No Ataxia 1-42 >=6m 9 13.8 0.7 No Anaphylaxis 0-2 >=6m 1 2.1 0.5 No
Total Doses Administered: 2,045,127

VSD 2009 H1N1 Safety Preliminary Findings

2009 H1N1 MIV: Historical Comparison- Preliminary Results
OutcomeWindow (Days)
Age Group Observed Expected RR Signal
GBS 1-42 >=6m 0 0.1 0.0 No Demyelinating Disease 1-42 6m-24y 0 0.1 0.0 NoDisorders of Peripheral Nervous System 1-42 6m-24y 2 0.4 4.8 No Encephalitis 1-21 >=6m 0 0.1 0.0 No Bell's palsy 1-42 1-42 6m-24y 0 0.2 0.0 No Bell's palsy 1-60 1-60 6m-24y 0 0.2 0.0 No Other Cranial Nerve Disorders 1-42 6m-24y 1 0.1 11.8 No Ataxia 1-42 >=6m 0 0.1 0.0 No Anaphylaxis 0-2 >=6m 1 0.1 15.6 No
Total Doses Administered – 206,150

Summary
No potential associations or signals have been identified following the monitoring of 2009-10 Seasonal TIV (2,045,127) and LAIV (100,366) doses
2009 H1N1 influenza vaccines have only recently
begun to be administered in the VSD MCOs and data are insufficient to assess the safety of the vaccines
The VSD will continue to monitor both seasonal and H1N1 influenza vaccines on a weekly basis

EIP Guillain-Barré Syndrome (GBS) Surveillance Project:
Association of Influenza A (H1N1) 2009 Vaccine and GBS

EIP GBS Surveillance Sites, 2009-2010
Connecticut
Colorado
Oregon
California
Tennessee
Georgia
Maryland
New YorkMinnesota
Population: ~ 44.9 million
New Mexico

EIP Guillain-Barré Surveillance (GBS) Surveillance Project
CDC's Emerging Infections Program (EIP)– partnership of state and local health departments, academic
centers, and CDC – performs surveillance and public health research on emerging
infections October 1, 2009 time limited surveillance for GBS Objectives:
– Rapidly detect cases of GBS and report (with vaccination status)– Assess and measure if there is an association between 2009
(H1N1) vaccine and GBS Methods:
– Population ~45 million persons (statewide in CT, MD, MN, NM, TN and selected regions of CA, CO, GA, NY, and OR)
– Active network of neurologists and acute care facilities contacted weekly
– Report all GBS cases, standardized case finding, medical record abstraction, patient interviews
– Calculation of measures of association
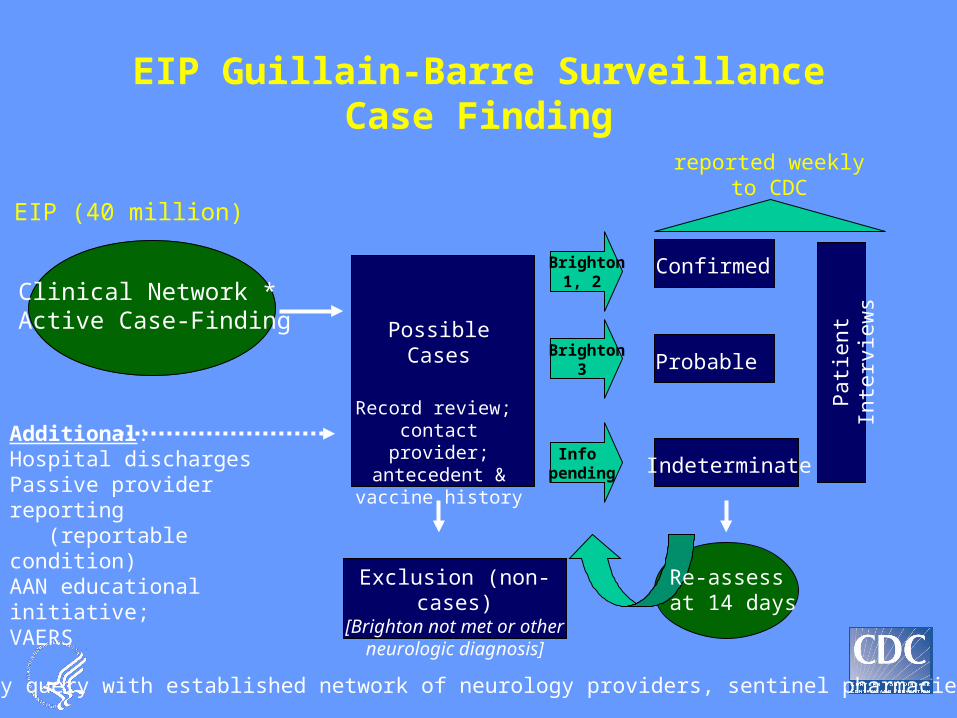
EIP Guillain-Barre Surveillance Case Finding
* Weekly query with established network of neurology providers, sentinel pharmacies
Additional: Hospital dischargesPassive provider reporting (reportable condition)AAN educational initiative;VAERS
10 EIP (40 million)
Exclusion (non-cases)[Brighton not met or other
neurologic diagnosis]
reported weeklyto CDC
Clinical Network * Active Case-Finding Possible
Cases
Confirmed
Probable
Indeterminate
Record review; contact provider;
antecedent & vaccine history
Brighton1, 2
Brighton3
Info pending
Re-assess at 14 days
Pat
ient
Inte
rvie
ws
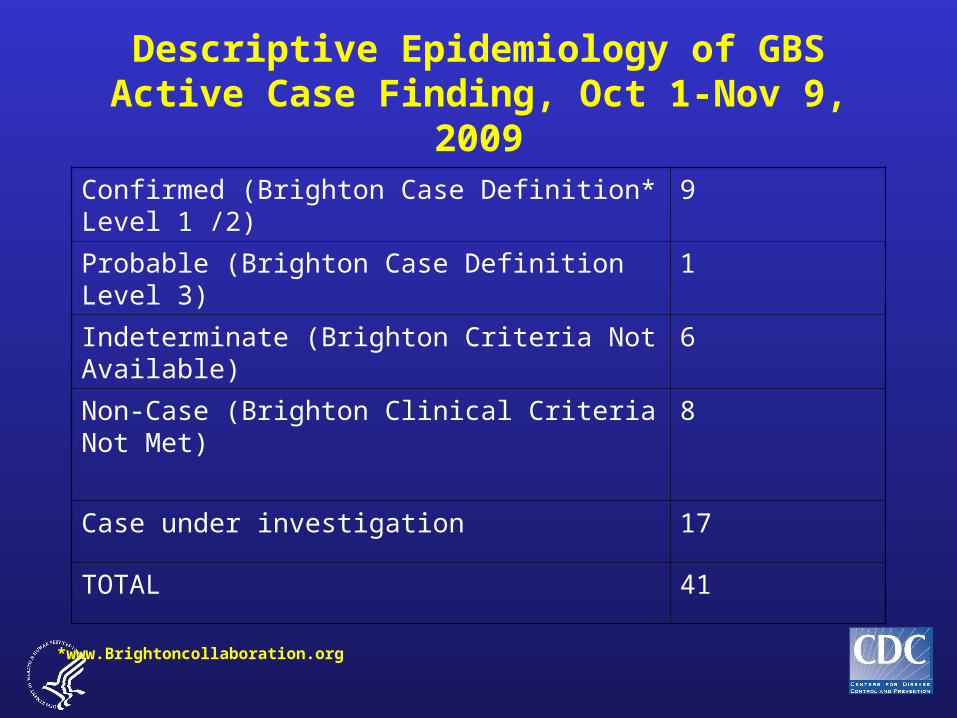
Descriptive Epidemiology of GBS Active Case Finding, Oct 1-Nov 9,
2009Confirmed (Brighton Case Definition* Level 1 /2) 9
Probable (Brighton Case Definition Level 3) 1
Indeterminate (Brighton Criteria Not Available) 6
Non-Case (Brighton Clinical Criteria Not Met) 8
Case under investigation 17
TOTAL 41
*www.Brightoncollaboration.org

Descriptive Epidemiology of GBS Active Case Finding, Nov 9, 2009
Characteristic + H1N1 vaccine
- H1N1 vaccine
Vaccine unknown/ missing/
Total
n (%) n (%) n(%) n (%)
Case Status
Confirmed (Brighton Level 1 and 2)
0 (0.0) 5 (83.3) 4(100.0) 9 (90.0)
Probable (Brighton Level 3)
0 (0.0) 1 (16.7) 0 (0.0) 1 (10.0)
TOTAL 0 (0.0) 6(100.0) 4(100.0) 10(100.0)
Age (years)
0-24 0 (0.0) 2 (33.3) 1 (25.0) 3 (30.0)
25-49 0 (0.0) 2 (33.3) 1 (25.0) 3 (30.0)
50-64 0 (0.0) 2 (33.3) 2 (50.0) 4 (40.0)
65+ 0 (0.0) 0 (0.0) 0 (0.0) 0 (0.0)

Select Methods Using Vaccine Coverage Data
Observed vs. historical GBS rates– Compares observed no. GBS cases occurring within 42 days of H1N1
vaccination to expected no. among vaccinees– Earliest incidence metric– Limitations:
historical rate comparison (may not be valid comparison, different case finding)
Initially only crude, or age-specific with assumptions on vaccine administration
With BFRSS data, fewer assumptions needed for age-specific comparisons
GBS rates in vaccinated vs. unvaccinated persons– Use BFRSS vaccine coverage data, calculate person-time exposed and
unexposed to vaccine, calculate rates– Strength: rates in vaccinated and unvaccinated persons will both be
calculated from active surveillance data– Limitations
BRFSS data not available until mid-November and may only be available at the state level (not EIP catchment area specific)
GBS rates in H1N1 vaccinated vs. seasonal vaccine recipients– Use BFRSS vaccine coverage data– Age-adjust

Real Time Immunization Monitoring System (RTIMS)
Contributors: Johns Hopkins Bloomberg School of Public Health
(JHU) CDC ISO (AHIP) WorldAPP (WA) State and local health departments (HD) Hospitals, schools, clinics, pharmacies

RTIMS Automated web-based surveillance system Captures self reported data from vaccine recipients Predecessor: Telewatch
– Used for monitoring patients with chronic diseases– Modified for monitoring yellow fever vaccine1
– Piloted for influenza vaccine November 2008 Capacity:
– On line and database: 1-10 million vaccine recipients– Follow-up personnel: expandable

Objectives
1. To monitor influenza vaccine recipients for adverse events (early signal detection)
2. To identify host factors associated with adverse events
3. To compare rates of adverse events associated with different influenza vaccine products
4. To expedite reporting of AEs to VAERS
Study Population
Seasonal & 2009 H1N1 Influenza vaccine recipients Target population – Pregnant women, health care workers, school
aged children
State & local health departments, hospitals, schools and OB clinics

Timeline for Surveys
2nd Follow-up
1st Follow up
Day 2 Day 7 Day 42
Baseline survey
PregnancyFollow-up?

Study Information CardProvided at Time of
Vaccination Front Back

RTIMS Information Flow
Electronic(Registries)
RTIMS Survey
Permission to Contact at Time of Vaccination
JHUData entryFormatting
VaccineRecipient
WorldAPP
WeblinksCDC, JHU, HDs
Paper
or
linkwww.myflushot.org
or
www.myflushot.orgwebsite sign-up
3-4 min initial<1 min follow-up
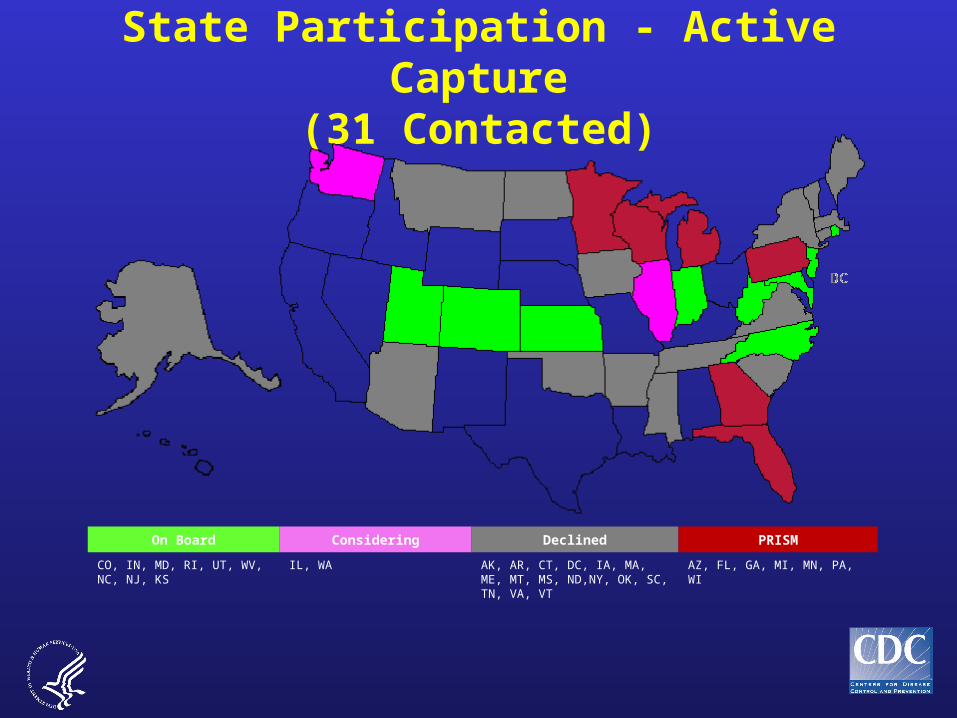
State Participation - Active Capture
(31 Contacted)
On Board Considering Declined PRISM
CO, IN, MD, RI, UT, WV, NC, NJ, KS
IL, WA AK, AR, CT, DC, IA, MA, ME, MT, MS, ND,NY, OK, SC, TN, VA, VT
AZ, FL, GA, MI, MN, PA, WI

4,730 Baseline Surveysby Risk Group and Gender
as of Nov 9, 2009

Type of Vaccine Received by Risk Group
as of Nov 9, 2009

Diagnoses after Flu Vaccineby Vaccine
as of Nov 9, 2009
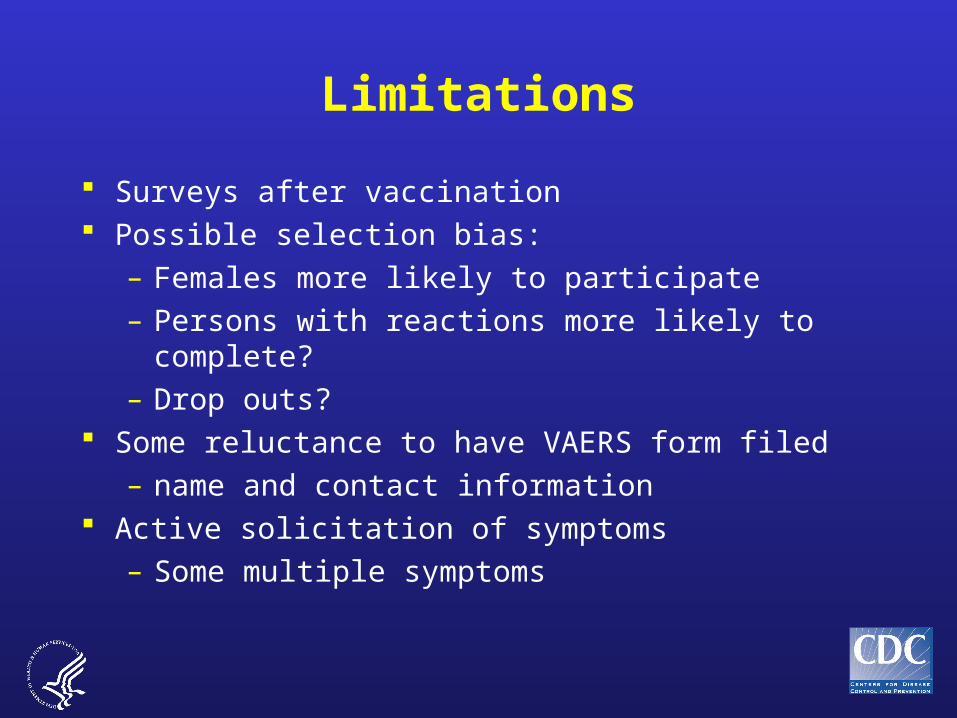
Limitations
Surveys after vaccination Possible selection bias:
– Females more likely to participate– Persons with reactions more likely to complete?– Drop outs?
Some reluctance to have VAERS form filed– name and contact information
Active solicitation of symptoms– Some multiple symptoms

Acknowledgements VSD
– Eric Weintraub– James Baggs– Frank DeStefano
CDC/EIP– Melissa Viray– Paige Lewis– Oliver Morgan– Scott Fridkin
RTIMS– Neal Halsey– Rosanna Setse

Extra slides

The VSD Distributed Data Model
CDC
Hub
“Direct”
“Indirect”
SAS Programs,
Logs, Output, & Analytical Datasets

VSD 2009 H1N1 Vaccine Study Design and Analytic Plan
Challenges for studying the safety of influenza vaccines – Confounding by indication – Vaccine recommendations have expanded and changed – Influenza vaccines are often given over a very short period
of time.– Individuals may have received vaccine outside their MCO
(count as unvaccinated) – Seasonality of adverse events may confound interpretation
To address the challenges to monitor 2009 H1N1 safety more than one approach will be included in both:– Rapid Cycle Analyses (RCA) weekly surveillance (near real
time and critical to rapid safety assessment)– End of season analysis
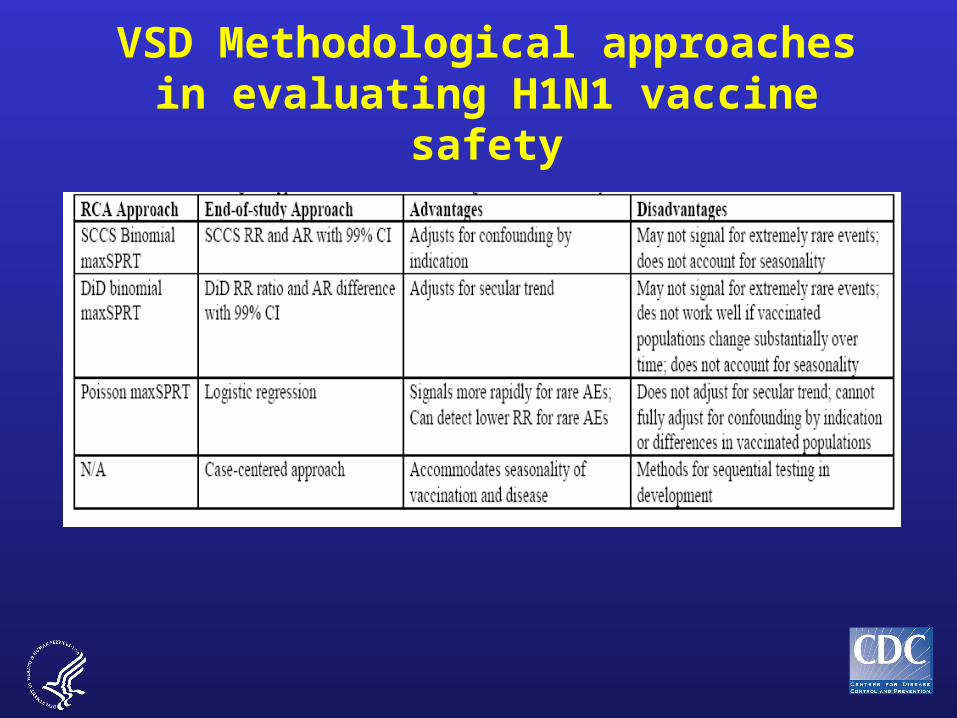
VSD Methodological approaches in evaluating H1N1 vaccine
safety

VSD 2009 H1N1 Vaccine Adverse Event Definitions
Risk periods (windows)– AE-specific as described in published studies or
biologic plausibility – Length of windows – vary from 2 to 60 days– Day of vaccination included in the risk period if it is
biologically plausible for AE to occur same day of vaccination (e.g., anaphylaxis).
To improve the specificity– Limit to AEs occuring in inpatient or ED settings– First event to occur in a year
For AEs that may have more than one “new” onset in a year a shorter period of time will be included in analysis (ex;wheezing, seizures)
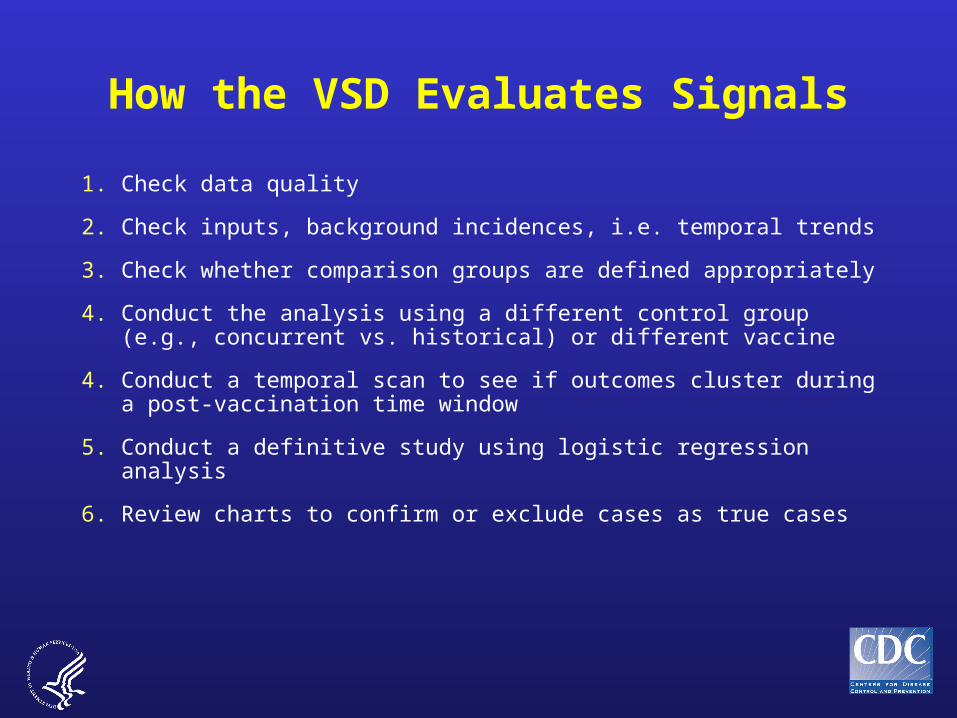
How the VSD Evaluates Signals
1. Check data quality
2. Check inputs, background incidences, i.e. temporal trends
3. Check whether comparison groups are defined appropriately
4. Conduct the analysis using a different control group (e.g., concurrent vs. historical) or different vaccine
4. Conduct a temporal scan to see if outcomes cluster during a post-vaccination time window
5. Conduct a definitive study using logistic regression analysis
6. Review charts to confirm or exclude cases as true cases
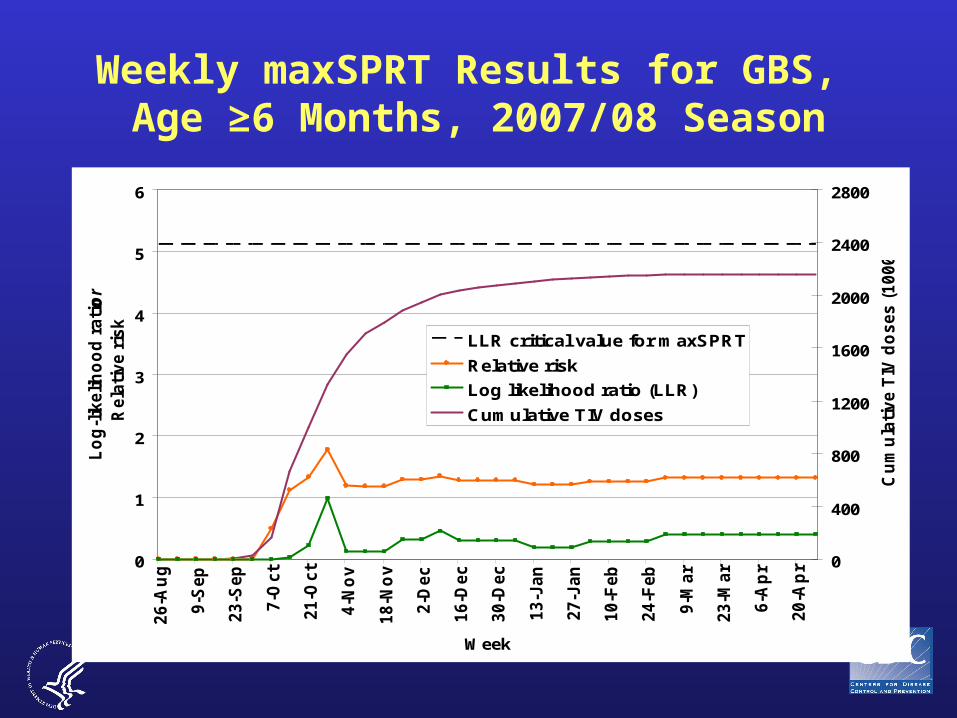
Weekly maxSPRT Results for GBS, Age ≥6 Months, 2007/08 Season
0
1
2
3
4
5
6
26-A
ug
9-S
ep
23-S
ep
7-O
ct
21-O
ct
4-N
ov
18-N
ov
2-D
ec
16-D
ec
30-D
ec
13-J
an
27-J
an
10-F
eb
24-F
eb
9-M
ar
23-M
ar
6-A
pr
20-A
pr
Week
Lo
g-l
ikelih
oo
d r
ati
o
or
Rela
tive r
isk
0
400
800
1200
1600
2000
2400
2800
Cu
mu
lati
ve T
IV d
oses (
1000s)
LLR critical value for maxSPRT
Relative risk
Log likelihood ratio (LLR)
Cumulative TIV doses

VSD Investigators and Collaborators - Partial List
Centers For Disease Control, VSD team James Baggs, PhD Julianne Gee, MPH Natalie McCarthy, MPH Eric Weintraub, MPH
Kaiser Permanente of No. California (NCK), Oakland CA Roger Baxter, MD Nicky Klein, MD, PhD Ned Lewis
Northwest Kaiser Permanente (NWK), Portland OR Allison Naleway, PhD John Mullooly, PhD Karen Riedlinger Lois Drew
Harvard Pilgrim /Harv. Vanguard (HAR)Boston, MA Tracy Lieu, MD, MPH Richard Platt, MD, MSc Katherine Yih, PhD, MPH Richard Fox Grace Lee, MD, MPH Sharon Greene, MD, MPH
Group Health Cooperative (GHC), Seattle WA Lisa Jackson, MD, MPH Jennifer Nelson, PhD Lora Bounds
Marshfield Clinic Rsch. Foundation (MFC)Marshfield WI Edward Belongia, MD James Donahue, MD Nick Berger
Health Partners Rsch Foundation (HPM)Minneapolis MN Jim Nordin, MD Amy Butani
Kaiser Permanente of Colorado (KPC)Denver, CO Simon Hambidge, MD, PhD Jason Glanz, MS, PhD David McClure, PhD Matt Daley, MD David Ryerson
So. California Kaiser Permanente (SCK), CALos Angeles, CA Steven Jacobson, MD, PhD Wansu Chen, MS Sungching Glenn, MS
Sites include > 125 staff working on VSD

EIP Guillain-Barre Surveillance Timeline
Vaccine Delivered
OCT NOV DEC JAN MARFEB MAYAPR
Case Only Methods:
Descriptive Epidemiology
Observed vs. Background Rates of GBS:
Crude and Age-Specific Comparisons
Estimated GBS Rates in Vaccinated vs. Unvaccinated Persons:
Crude and Age-Specific Comparisons
Case-Cohort analysisBRFSS Vaccine
Coverage Data Available
Potential Analytic Studies:
Self Control Case Series (SCCS)

4,790 Completed Baseline Surveysby Risk Group and Age Group
as of Nov 9, 2009


Diagnoses after Flu Vaccineby Gender
as of Nov 9, 2009
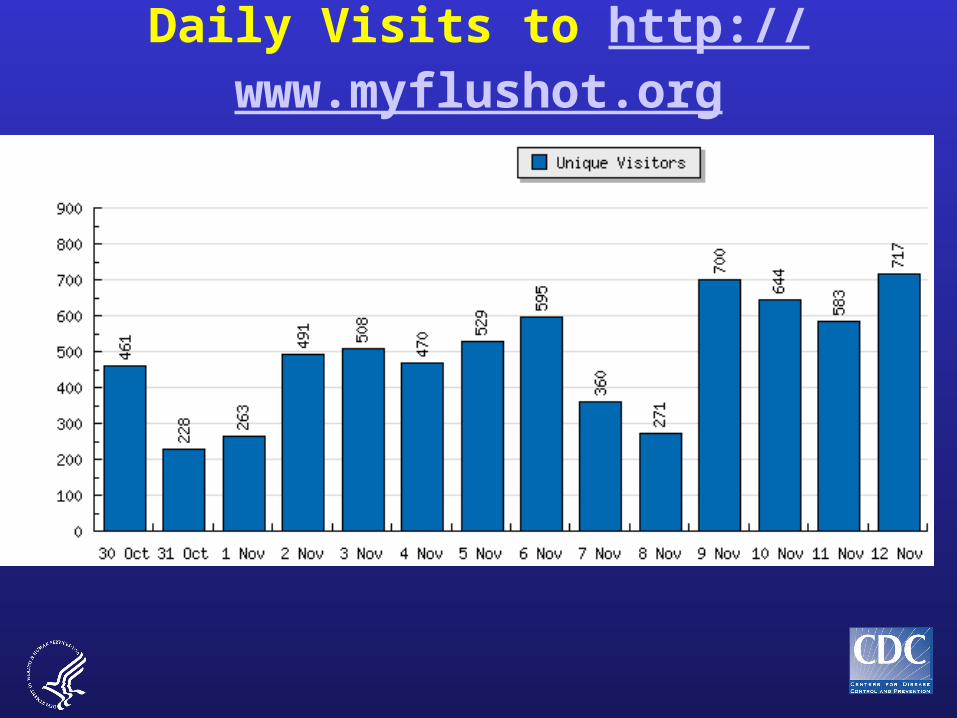
Daily Visits to http://www.myflushot.org

Links clicked on to arrive at http://www.myflushot.org
HITS Entry Link________________________________________________________
3615 http://www.cdc.gov/h1n1flu/vaccination/public/vaccination_qa_pub.htm3486 Unknown1240 http:// www.cdc.gov/h1n1flu/vaccination/vaccine_safety_qa.htm1123 Entered URL directly917 http:// www.cdc.gov/h1n1flu/vaccination/589 http:// www.cdc.gov/h1n1flu/vaccination/vaccine_keyfacts.htm564 http:// www.cdc.gov/H1N1flu/vaccination/pregnant_qa.htm358 http:// www.cdc.gov/h1n1flu/vaccination/gbs_qa.htm327 http:// www.cdc.gov/h1n1flu/vaccination/vaccine_safety.htm303 http:// www.in.gov/flu/178 http:// www.cdc.gov/h1n1flu/vaccination/general.htm105 http:// cdc.gov/h1n1flu/vaccination/public/vaccination_qa_pub.htm103 http:// www.in.gov/flu/2443.htm94 http:// www.vaccinesafety.edu/
>60% of traffic comes from the CDC

2009-10 Seasonal TIV Historical Comparison-
preliminary results
Window
(days)
Age Observed Expected RR signal
GBS 1-42 >6 mos 7 7.5 0.9 NO
Encephalitis 1-21 >6 mos 1 3.6 0.3 NO
Ataxia 1-42 >6 mos 9 13.8 0.7 NO
Anaphylaxis 0-2 >6 mos 1 2.1 0.5 NO
Total Doses Administered: 2,045,127