Embed Size (px)
Citation preview

National Advisory Body on Scheduled Wastes
Monitoring of PCBs in Australia
September 1998
Introduction
In November 1995, the Commonwealth, State and Territory governments endorsed a PCB management plan. This plan provides a framework for the safe management of polychlorinated biphenyls (PCBs) by all spheres of government, PCB waste treaters and PCB holders. The plan requires that scheduled PCBs be removed from use within 13 years.
The management plan also requires that a nationally coordinated and statistically valid PCB sampling and monitoring program be carried out to determine whether concentrations of PCBs in the environment are decreasing with time. The range of receiving environments specified in the plan to be examined include:
?? "breast milk and foodstuffs;
?? sewage treatment plants and outfalls;
?? landfill sites suspected of having received scheduled PCB waste (including adjacent groundwater or leachate) which have been assessed by the agency as posing a potential risk to the environment; and
?? appropriate biological indicators, including wildlife."
A significant amount of information is already available through government and non-government programs. Given this, the emphasis of this environmental monitoring report has been on collating data from existing programs of sampling and analysis. It collates existing published data, or unpublished data that have been obtained directly from regulatory authorities. The report attempts to identify any significant gaps in current monitoring data collection and makes recommendations for future monitoring reports.
This monitoring report has been prepared by the National Advisory Body (NAB) on Scheduled Waste (made up of representatives of industry, environment groups, local government, farmers and trade unions). The NAB had considerable assistance from the Scheduled Wastes Management Group (made up of officers from Commonwealth, State and Territory environment departments. Both these

2
bodies report to the Australian and New Zealand Environment and Conservation Council (ANZECC), comprising the Environment Ministers of the Commonwealth, States and Territories, and New Zealand.
Background
PCBs comprise a group of 209 individual compounds in ten homologous groups which were produced commercially in large quantities up until the late 1970s (Müller 1997). They were used in products as diverse as electrical equipment, lubricants, paints, plasticisers, carbonless copy paper and slide mounting for microscope slides. Different compounds have different toxic effects, as indicated by their allocated toxic equivalency factors (TEFs) and PCBs are among a broader group of organochlorine chemicals which persist in the environment due to their ability to resist chemical and physical breakdown. They also bioaccumulate up the food chain (particularly in non-marine organisms), with those organisms higher up the food chain typically demonstrating higher levels where contamination has occurred. PCBs are stored in body fat and persist in this fat for many years after exposure has ceased.
Methods for detecting and reporting PCB concentrations vary with some researchers combining all data into a total PCB concentration, while others combine homologues. A difficulty which should be noted when examining the data in this report is that methods of analysis of PCBs have changed over recent decades. This means that it is difficult to compare levels reported say, in 1979, with those of the mid-1980s and also, those of the mid-1980s with those of the late 1990s. A further complication is that for some of the reported data, detection levels were not provided and are not known.
Health effects of PCBs have been observed on both humans and other animals, and include carcinogenic, immunotoxic, reproductive and developmental effects.
Results
PCBs and breast milk
Fishbein (1979) reported that Australian studies found PCB levels in human milk to be very low or non-detectable.
Quinsey et al (1994) undertook a study to establish the extent of organochlorine contamination in the breast milk of mothers resident in a Victorian country district. PCBs were detected in the breast milk of 47 of the 60 mothers tested with the mean daily intake of total PCBs for babies being 0.8 µg/kg bodyweight/day. The United States recommended Acceptable Daily Intake (ADI) of total PCBs for newborns is 1 µg/kg bodyweight/day. The study noted that 25% of samples in which PCBs were detected revealed total PCB levels sufficient to breach the US ADI. The World Health Organisation (WHO) has not

3
established a comparable ADI as PCB isomers have a range of toxicity characteristics.
No further data are known to be available.
PCBs and foodstuffs1
Australian Market Basket Survey
The Australian Market Basket Survey (AMBS) undertaken by the Australian and New Zealand Food Authority is the principal means by which an estimate of the total dietary intake of selected pesticides and contaminants can be made. The survey uses the analysis of particular foodstuffs chosen from the National Dietary Survey to estimate intake of, amongst other contaminants, organochlorine compounds including pesticides and PCBs. The summaries of levels of PCBs found in foodstuffs are available for 1985, 1986, 1987, 1990, 1992 and 1994. Surveys are now conducted every two years.
The Australian Food Standards Codes set a limit for PCBs in Standard A12 clause (6) of 0.2 mg/kg in fat of meat; poultry fat; milk; milk products and eggs; and 0.5 mg/kg in fish.
In the 1985-87 surveys, PCB contamination was found only in canned sardines and canned tuna food samples. The non-Australian country of origin was not recorded. The percentage of PCB-positive canned sardine and tuna samples for the three years was 85%, 90% and 66%, respectively with the median level of PCBs in food being 0.02, 0.045 and 0.04 mg/kg, respectively. These levels are well below the maximum permitted concentration of PCBs in fish (0.5 mg/kg).
PCBs were amongst a group of chemicals including heavy metals and OCPs that were examined in all foodstuffs analysed in the 1992 AMBS. Although no PCBs were found in any food samples in the 1990 AMBS, the 1992 survey found PCBs in two of 24 samples of prawns analysed with levels of 0.15 and 0.10 mg/kg. Again neither exceeds the maximum permitted concentration of PCBs in fish (0.5 mg/kg). The estimated human intake of PCBs (0.0007 µg/kg bodyweight per day) estimated from this survey are far below the no effect level (40 µg/kg bodyweight per day) set by the World Health Organisation.
No PCBs were found in any foods in the 1994 and 1996 surveys. The survey tests 76 foods in all main food categories including cereals, dairy products and eggs,
1 The Australian Quarantine and Inspection Service (AQIS) conducts a residue testing program that serves as quality assurance programs for export products. It differs from the National Residue Survey in that it is generally biased towards detecting contaminated products. There is no AQIS residue testing program which includes PCBs.

4
fats and oils, fish and seafood products, fruits, meats, nuts and seeds and vegetables.
National Residue Survey
Unlike AMBS which examines and estimates dietary intakes of specific chemicals, the National Residue Survey (NRS) investigates chemical residues in raw food commodities, focusing particularly on export beef, sheep and pig meat. Grains, eggs, honey, dairy produce, fruit and vegetables are also tested. The NRS, in addition to testing for pesticide residues, undertakes analysis of these commodities for environmental contaminants such as heavy metals and PCBs, and de-registered pesticides like DDT and dieldrin.
The NRS Annual Reports record that samples of cattle, pigs, game pigs, poultry, sheep, goats, game goats, game kangaroos, butter, milk and cheese are all analysed for the presence of PCBs in an organochlorine compound screen.
The 1992 Survey reported two PCB detections for each meat grouping, beef, sheep and pig, from 15,045, 17,784, and 22,298 animal samples, respectively. Although the PCB levels were not recorded in the NRS report, the data indicate a very low incidence (0.01%) of PCB residues in livestock, at a detection level of 0.03 mg/kg.
No PCBs were detected in any of the samples taken in the 1996 or 1997 Surveys. Two meat fat samples in the (now)1997/98 survey contained PCBs. One sample was above the maximum residue limit (MRL) of 0.2mg/kg and one was below the MRL.
Other foodstuff analyses
The levels of organochlorine residues, including PCBs, were investigated in a range of foodstuffs from Australia, Papua New Guinea and the Solomon Islands (Kannan et al 1994). PCBs were detected in most foodstuffs of animal origin, particularly fish and more noticeably in samples collected associated with urban areas. Sampling in the Australian sites of Sydney, Perth, Hobart, Brisbane, Atherton and Townsville was undertaken in late 1990 and included cereal products, pulses, oils, vegetables, dairy products and meat products. The PCB concentrations from these Australian sites are given in Table 1.
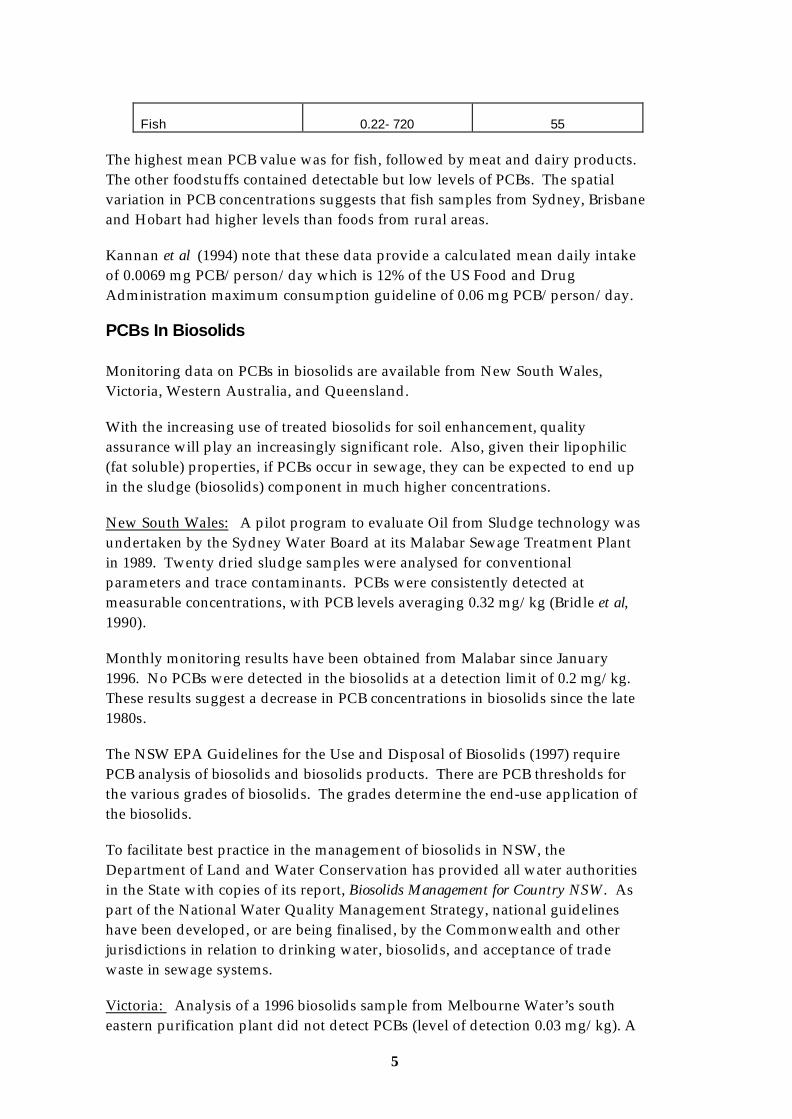
Table 1: PCB Concentrations in Foodstuffs
Commodity PCB concentration range (µg/kg)
mean value (µg/kg)
Crop products <0.01 to 11 not available
Dairy products 1.2-8.2 4.1
Cattle meat <0.01-37 11
5
Fish 0.22- 720 55
The highest mean PCB value was for fish, followed by meat and dairy products. The other foodstuffs contained detectable but low levels of PCBs. The spatial variation in PCB concentrations suggests that fish samples from Sydney, Brisbane and Hobart had higher levels than foods from rural areas.
Kannan et al (1994) note that these data provide a calculated mean daily intake of 0.0069 mg PCB/person/day which is 12% of the US Food and Drug Administration maximum consumption guideline of 0.06 mg PCB/person/day.
PCBs In Biosolids
Monitoring data on PCBs in biosolids are available from New South Wales, Victoria, Western Australia, and Queensland.
With the increasing use of treated biosolids for soil enhancement, quality assurance will play an increasingly significant role. Also, given their lipophilic (fat soluble) properties, if PCBs occur in sewage, they can be expected to end up in the sludge (biosolids) component in much higher concentrations.
New South Wales: A pilot program to evaluate Oil from Sludge technology was undertaken by the Sydney Water Board at its Malabar Sewage Treatment Plant in 1989. Twenty dried sludge samples were analysed for conventional parameters and trace contaminants. PCBs were consistently detected at measurable concentrations, with PCB levels averaging 0.32 mg/kg (Bridle et al, 1990).
Monthly monitoring results have been obtained from Malabar since January 1996. No PCBs were detected in the biosolids at a detection limit of 0.2 mg/kg. These results suggest a decrease in PCB concentrations in biosolids since the late 1980s.
The NSW EPA Guidelines for the Use and Disposal of Biosolids (1997) require PCB analysis of biosolids and biosolids products. There are PCB thresholds for the various grades of biosolids. The grades determine the end-use application of the biosolids.
To facilitate best practice in the management of biosolids in NSW, the Department of Land and Water Conservation has provided all water authorities in the State with copies of its report, Biosolids Management for Country NSW. As part of the National Water Quality Management Strategy, national guidelines have been developed, or are being finalised, by the Commonwealth and other jurisdictions in relation to drinking water, biosolids, and acceptance of trade waste in sewage systems.
Victoria: Analysis of a 1996 biosolids sample from Melbourne Water’s south eastern purification plant did not detect PCBs (level of detection 0.03 mg/kg). A

6
1993 study at Melbourne Water Werribee Treatment Complex revealed PCB levels from undetectable to 1.3 mg/kg for sludge and undetectable to 0.5 mg/kg for soil and dust. Mono-, di-, tri- ....deca-chlorobiphenyls were analysed for separately with a detection level of 0.001 mg/kg for each level of chlorination (RMIT, 1993).
Western Australia: PCBs were detected in biosolids in 1992 (1.9 mg/kg). However, analysis of sewage sludge from three treatment plants (Beenyup, Subiaco and Woodman) in 1997 did not find PCBs above the comparatively high detection limit of 0.5 mg/kg. The detection limit for further testing has been lowered recently to 0.2 mg/kg.
Queensland: PCB testing data was provided by Redlands Shire Council for biosolids from the Council's four waste water treatment plants for the period from August 1995 to January 1996. PCBs were not detected above 1.3 mg/kg; approximately 90% of samples were below 1 mg/kg and 20% below 0.05 mg/kg. The five other councils responding to the Local Government Association of Queensland survey undertaken for the Queensland EPA (Brisbane, Gladstone, Mareeba, Pine River and Toowoomba), did not analyse for PCBs either in the biosolids or effluent.
Australian Capital Territory: The ACT incinerates dried biosolids from waste water treatment at the Lower Molonglo Water Quality Control Centre. Analytical testing was conducted in 1997 on the biosolids for a period of several months on a weekly basis. PCBs were not detected above the limit of detection of 1µg/kg.
Other Jurisdictions: No data was available from South Australia. Tasmania is reviewing its testing requirements for biosolids. The Northern Territory does not, at present, systematically collect testing data from sewage treatment plants.
PCBs in Sewage Effluent
New South Wales: Sydney Water (1996a, 1996b, 1997) conducted a number of ecological and human health risk assessments on the discharges from its sewage treatment plants(STPs) between 1995-96. These assessments included monitoring for PCBs.
Sampling for PCBs was carried out at 10 coastal sewage treatment plants (STPs). Table 2 shows that, with the exception of Bombo the frequency of detection of PCBs was less than 10% at a detection level of 0.1 mg/L. Where no PCBs were detected 0.05 mg/L (ie, half the detection limit) was assigned as the observed maximum.
Table 2: Results of Sampling Effluent from NSW Coastal STPs for PCBs
STP Number of Number Detection Observed

7
Observations Above Detection
Limit
Frequency (%)
Maximum (µg/L)
Median (µg/L)
Warriewood 6 0 0 0.05* 0.05
North Head 47 3 6 2 0.066
Bondi 45 2 4 8 0.072
Malabar 48 3 6 0.7 0.067
Cronulla 58 5 9 3.7 0.074
Bellambi 39 2 5 0.3 0.061
Wollongong 22 1 5 0.7 0.069
Port Kembla 41 3 7 0.9 0.075
Shellharbour 22 2 9 0.9 0.074
Bombo 22 4 18 0.8 0.106
* imputed maximum
Between 14 and 34 samples were taken for each of 17 Hawkesbury-Nepean STPs and analysed for PCBs with a detection limit of 0.1 µg/L. No PCBs were detected.
There are two STPs (Liverpool and Glenfield) on the Georges River. During dry weather, the treated effluent is pumped and transported to Malabar. During heavy wet weather, flow rates to the system can exceed the design capacity of the sewers and under these conditions treated effluent is discharged into the Georges River. PCBs were not detected in more than 5% of samples, that is, where 20 samples were taken, PCBs were either not detected or only detected in one sample.
Mortimer and Connell (1997) undertook a study on trace organic contaminants , including PCBs, associated with the new sewage outfalls at North Head, Malabar and Bondi which discharge sewage approximately 3 km offshore. Calculations based on predictions from the model used in the study, indicated that chlorohydrocarbon contaminants in fish near these outfalls should be an order of magnitude less than those associated with the former cliff-face outfalls.
Western Australia: Testing is carried out every five years and has always been below detection levels of 0.5 µg/L. The detection level has recently been lowered to 0.2 µg/L.

8
South Australia: Data is available for effluent from four treatment plants: Bolivar, Christies Beach, Glenelg and Port Adelaide. None of these plants detected PCBs in effluent.
Australian Capital Territory: PCBs have been monitored annually for at least the last 5 years. No PCBs have been detected in effluent at a limit of detection of 0.1 µg/L.
Other Jurisdictions: Tasmania is reviewing testing requirements for effluent. Queensland and the Northern Territory do not, at present, systematically collect testing data on PCBs in effluent, nor have any data been identified for Victoria.
The general lack of comprehensive data on biosolids and effluent reflects variations in testing practices between the different jurisdictions. Any subsequent monitoring report should seek additional analytical data on PCBs in sewage sludge and/or effluent, either from State government agencies or local governments. This would significantly enhance further PCB monitoring reports.
PCBs and landfills
As part of the process of developing a national management plan for PCBs, it was recognised that landfilling of even low level solid PCB waste would need to be done with care. As part of the negotiation process, those involved agreed to examine the potential for off-site migration of PCBs (and other organochlorine wastes) from landfill sites specifically designed to receive hazardous wastes and those designed to receive general municipal wastes.
Monitoring data on the leaching of persistent organochlorine pollutants (eg polychlorinated biphenyls and organochlorine pesticides) from a range of landfill sites in Australia was examined to determine whether further monitoring data should be obtained.
South Australia: An 'Integrated Waste Management Strategy' has been developed which will be the basis for a Waste Management Environment Protection Policy under the Environment Protection Act 1993. The Act establishes control over South Australian landfills sites through works approval, licensing, notices and penalties. South Australia has reported they have no landfill sites suitable for the disposal of non-scheduled PCB waste that would meet the landfill guidance note in the plan.
South Australia’s laboratory and field measured parameters for groundwater samples do not include PCBs.
Western Australia: There are three Codes of Practice controlling landfill management (two in draft form) and two policies which relate to licensing and post-closure management of landfills. The WA Government has approved a Department of Environmental Protection proposal for the licensing of all landfills under the Environmental Protection Act. This has ensured that controls are in

9
place to minimise illegal dumping of hazardous waste , including PCBs and organochlorine pesticides (OCPs) in landfills. There are four landfills which meet the necessary requirements for non-scheduled wastes.
WA provided reports on landfill leachate monitoring for 1991 and 1995. The 1991 study comprised leachate monitoring at 20 Perth landfills (some of which are closed) for organochlorines including PCBs. PCBs were detected once at 1.2 µg/L in a sample of leachate taken from the Kelvin Road landfill site. Some of the bore holes are centred directly on the landfill thus, in those cases, providing a worst case scenario. However, most of the bore holes are located in positions which provide off-site migration data. The 1995 landfill monitoring study of fourteen metropolitan landfill sites (some of which are no longer operable) included data on PCBs, HCBs and a range of OCPs. PCB levels in this study did not exceed the detection limit of 0.1 µg/L. This detection limit is the same as the ANZECC National Water Quality guideline for drinking water.
New South Wales: The provisions of the Waste Minimisation and Management Act 1995 cover all NSW landfills. The Environmental Guidelines: Solid Waste Landfills were released in May 1996, and form the basis of the landfill licensing system. The Waste Minimisation and Management Regulation 1996 defines four waste types, namely inert, solid, industrial, and hazardous, and refers to the Environmental Guidelines: Assessment, Classification, and Management of Non-Liquid Wastes (Waste Guidelines, June 1997) for the classification of waste into these different types for the purposes of the regulation.
Under the provisions in the Waste Guidelines, solid waste containing PCBs at 2 mg/kg or less may be classified as inert and at less than 50 mg/kg may be classified as solid or industrial, subject to the waste meeting other criteria (as detailed in Section 3.2.3 of the Waste Guidelines) for such classification. Waste containing 50/kg or more of PCBs will be classified as hazardous waste, and such waste must be treated or stored and cannot be disposed of to landfill. Landfills receiving inert, solid, or industrial wastes must be licensed under the Waste Minimisation and Management Act 1995 and, subject to location and waste type as well as quantity thresholds, are covered by a performance based licensing system which ensures appropriate management of the environmental impacts of waste received.
The NSW EPA will require monitoring of PCBs in the leachate, groundwater and surface water from landfills which are known to have received PCB-contaminated waste.
Victoria: Environment protection policies under the Environment Protection Act 1970 provide controls over new and existing landfill sites which include groundwater monitoring protocols. The Victorian EPA has issued guidelines for the management of non-scheduled PCBs. To give effect to Victoria’s commitment to implement the national PCB Management Plan, the EPA has obtained a Governor-in-Council order under the Environment Protection Act 1970, declaring

10
PCBs to be notifiable chemicals and it has advertised its intention to develop an Industrial Waste Management Policy for PCBs. The draft policy is expected to be released for public comment in 1998.
In January 1996, groundwater samples were taken from monitor bores located at the Cleanaway Tullamarine and Clayton landfills and analysed for PCBs. No PCBs were detected in any sample at a limit of detection of 1?g/L. The Tullamarine and Clayton landfills commenced operations 23 and 18 years ago respectively and so would have been in operation through the period that PCB-containing equipment may have been taken out of service and disposed of to landfill sites.
Tasmania: Tasmania is currently reviewing the Tasmanian Hazardous Waste Management Strategy. Through a waste management hierarchy of waste minimisation, recycling, re-use, waste treatment and disposal, this aims to establish an integrated hazardous waste management system in Tasmania. Tasmania is currently implementing a Landfill Code of Practice which addresses solid non-scheduled PCB waste management in landfills through the incorporation of suitably designed and engineered hazardous waste disposal cells. New waste disposal regulations associated with the Environment Management and Pollution Control Act 1994, are being drafted. Environmental management protocols and guidelines for the handling and disposal of hazardous waste will be incorporated into permit conditions of landfills accepting solid and hazardous waste.
No specific groundwater monitoring is undertaken for PCBs or OCPs at any Tasmanian landfill site. However, trace organic screens are undertaken at the majority of landfills receiving more than 1000 tonnes per annum (category 2 and 3 landfills).
Sites nominated for more extensive monitoring (subject to available funds) for PCBs and OCPs in order of preference are Geeveston (at Geeveston), McRobies Gully (accepting primarily medical and domestic waste in the Hobart area), and Glenorchy (accepting primarily low level industrial hazardous and domestic waste in the Hobart area). Geeveston is in a rural area with a higher rainfall than Hobart and would be a useful site to monitor and compare with Hobart's landfill at McRobies Gully. Both are regarded as environmentally sensitive, but having different underlying geologies.
Australian Capital Territory: The Environment Protection Act (1997) and Regulations came into force on 1 June 1998, and provide specific regulatory mechanisms for best practice landfill management. ACT landfills located at Mugga Lane and West Belconnen have comprehensive monitoring protocols.
Bimonthly monitoring of sedimentation and leachate dams, along with a series of bore sites is undertaken at both the Mugga Lane and West Belconnen Landfill sites. Monitoring reports to September 1997 show no detection of PCBs at any of

11
the 15 bore and 2 leachate dam sites. The current limit of detection for PCB screens is 1µg/L. As the monitoring program at both landfill sites is ongoing and comprehensive, additional investigations do not seem necessary.
The ACT suggests a designated area, surrounded by monitored bores, within the West Belconnen Landfill site is suitable for the disposal of non-scheduled solid PCB waste, if the need arises.
Queensland: The Environmental Protection (Waste Management) Policy and associated regulations will provide controls over the management of non-scheduled solid PCB waste when they enter into force. Gladstone City Council has monitored for PCBs in boreholes around its landfill and in a nearby creek but has never detected PCBs. The new Rochedale Landfill site in Brisbane is monitored for a range of environmental pollutants but results have not been received to date.
Northern Territory: The Northern Territory has introduced Environment Protection legislation into the Legislative Assembly which will provide for best practice landfill management. The Northern Territory indicates that it does not have landfill sites suitable for the disposal of hazardous wastes including OCPs and PCBs and does not currently monitor for these chemicals.
PCBs in the Australian environment
The aquatic environment
Thompson et al. (1992) provides some historical background to environmental monitoring of PCBs levels in Australia and some of this information is summarised by State below. Also, Richardson et al (1986) gathered sufficient data to conclude that most PCB contamination in Australia is associated with large urban centres. Kannan et al (1995) analysed PCB levels in fish from Perth, Hobart, Sydney, Brisbane, Townsville and Atherton caught between 1989-1993, finding that concentrations ranged from 0.22 to 720ng/g wet weight. Fish samples from Sydney, Brisbane and Hobart contained relatively higher concentrations than those from areas such as Townsville and Atherton. Fish samples from Sydney, for example, snapper (22-34ng/g wet wt), morwong (99-100ng/g), blue groper (720ng/g) and shovelnose ray (5.6-160ng/g), recorded high concentrations of PCBs.
New South Wales: Walled and Settle (1978) undertook a study of PCB levels in mullet caught in the Port Jackson and Botany Bay area and found PCB concentrations up to 5.2 mg/kg wet weight. Later studies in the same area found PCB levels had decreased to 0.4 mg/kg, with Scriber et al (1987) finding maximum PCB concentrations that approached 0.9 mg/kg in mullet. It is possible that this decline can be attributed to the declining usage of PCBs and greater care in their disposal. The Malabar sewer outfall has been an area of concern with Scriber’s (1987) study finding 7.2 mg/kg in red morwong. Later

12
studies (Lincoln-Smith and Mann, 1989) reported PCB levels in the same species caught at Malabar of 0.3 mg/kg.
A 1992 report 'Coastal Survey of Fish for Organochlorine Compounds' by the Fisheries Research Institute of NSW Fisheries noted that of 896 fish samples taken from NSW coastal rivers, 88 (about 10%) had detectable PCB residues with two (0.2%) having levels exceeding the National Health and Medical Research Council (NHMRC) PCB standard of 0.5 mg/kg bodyweight. The study found that 83 of the 88 PCB detections were from the Parramatta River/Sydney Harbour (35) and Georges River/Botany Bay (48). The two exceedences (1.76 mg/kg wet weight in bream and 1.1 mg/kg in mullet) were found in the Georges River. These results suggest no significant PCB contamination in non-metropolitan river systems but do indicate that further monitoring of the Parramatta River/Sydney Harbour and Georges River/Botany Bay may be warranted.
The NSW 1997 State of the Environment (SoE) Report provides a more up-to date and detailed picture of PCB contamination in estuaries and rivers, especially for the Georges, Cooks, and Parramatta rivers as well as for Botany Bay and Sydney Harbour. Detailed information on the PCB distribution and on the status of these waterways and sediments can be found in sections 3.6 of the SoE. Report which is available from the EPA. It is also available on the Internet at < www.epa.nsw.gov.au>
Some of the work undertaken by the NSW EPA during the period from February to March 1995 has recently been published (Roach and Runcie 1998). This study investigated edible fish sampled from various locations known to be polluted with chlorinated hydrocarbons. Samples were collected from five locations in the Georges/Cooks Rivers and four locations in Sydney Harbour.
The concentration of PCBs in fish from some locations was considerably higher than those described in studies of fish from other places (both locally and internationally). Fish such as Acanthopagrus australis (Yellowfin Bream), Mugil cephalus (Sea Mullet), Myxus petardi (Pink-eye Mullet) and Gerres subfasciatus (Silver Biddy) from Prospect Creek, Chipping Norton, Saltpan Creek, Alexandria Canal, Duck River and Homebush Bay had concentrations of PCBs (Table 3) above the maximum permissible concentration (0.5 mg/kg). Interspecies differences in the concentration of chlorinated hydrocarbon contaminants also appeared great. The data was based upon relatively small sample sizes and the fish collected in the study were taken from known polluted sites. The level of contamination reported may be thus higher than those in the wider fish populations in the Georges/Cooks River and in Sydney Harbour.
From the study two sites were identified as probable point sources of PCB contamination. Notices under the Environmentally Hazardous Chemicas Act 1985 were issued on these sites to control the further release of PCBs into the sediments. Both sites have been remediated. On one site the contaminated soil

13
has been moved to prevent further releases and is now stored in accordance with the Polychlorinated Biphenyl (PCB) Chemical Control Order issued under the Environmentally Hazardous Chemicals Act 1985. On the other site a cap-and-contain strategy was adopted, which involved bitumen sealing and landscaping of the PCB-affected areas.
Table 3: PCB concentration in fish from each location
location fish species mean PCB
concentration (mg/kg)
standard deviation
>MPC *
Georges/Cooks River
Prospect Creek Silver Biddy 5.514 4.045 yes
Sea Mullet 10.140 10.866 yes
Pink-eye Mullet 3.423 1.629 yes
Chipping Norton
Silver Biddy 1.719 0.826 yes
Sea Mullet 1.806 1.052 yes
Saltpan Creek Yellowfin Bream 1.116 0.916 yes
Fan-tail Mullet 0.298 0.278 no
Sea Mullet 1.376 1.978 yes
Cooks River Yellowfin Bream 0.958 0.611 no
Fan-tail Mullet 0.141 0.068 no
Sea Mullet 0.388 0.517 no
Alexandra Canal
Yellowfin Mullet 1.202 0.699 yes
Silver Biddy 1.106 0.815 yes
Luderick 0.165 0.106 no
Fan-tail Mullet 0.355 0.269 no
Sea Mullet 1.074 0.792 yes
Sydney Harbour
Duck River Yellowfin Mullet 1.014 0.817 yes
Fan-tail Mullet 0.475 0.607 no
Sea Mullet 1.881 2.214 yes
Parramatta River
Yellowfin Bream 0.717 0.362 no

14
Homebush Bay Yellowfin Bream 1.847 1.348 yes
Sea Mullet 3.782 1.963 yes
Iron Cove Yellowfin Mullet 0.979 1.157 no
Silver Biddy 0.576 0.307 no
Fan-tail Mullet 0.233 0.124 no
Sea Mullet 0.996 0.887 yes
Sand Whiting 0.065 0.034 no
Long Bay Silver Biddy 0.102 0.089 no
Fan-tail Mullet 0.321 0.204 no
Sand Whiting 0.051 0.021 no
* Indicates whether the mean tissue concentration was significantly greater than maximum permissible concentration of 0.5 mg/kg.
Queensland: Shaw and Connell (1982) found concentrations of PCBs in catfish in the Brisbane River estuary of 2.1mg/kg while Thompson et al (1992) reported that researchers have found PCB levels of 0.5 mg/kg wet weight in mullet caught in the Brisbane River estuary (Richardson 1985b). By contrast barely detectable PCB concentrations were found in fish and coral sampled on the Barrier Reef and the Gulf of Carpentaria (Smillie & Waid, 1984). A more recent study (Westernhagen and Klumpp, 1995) indicates that PCBs were almost non-existent in fish on the Great Barrier Reef. PCB levels in fish collected between October 1992 and March 1993 at 11 different sites between Port Stewart and Mackay found “concentrations in ovaries and livers on a wet weight basis ranged from 0.7 to 5.0 µg/kg in fish from the more contaminated regions; that is, Cairns and the Burdekin River estuary at Ayr. These values are up to two orders of magnitude lower compared with residues from livers of North Sea fish.” (p168)
Haynes et al (1998a) also collected and analysed sediment and seagrass samples from 17 Queensland intertidal (<1m deep) sites from Lockhart River to Moreton Bay between February and May 1997. All sampling locations (with the exception of Cairns and Low Isles) are important dugong habitat. Sampling locations included Lockhart River, Flinders Island, Princess Charlotte Bay, Bathurst Bay, Low Isles, Cairns, Cardwell, Pallarenda, Upstart Bay, Newry Bay, Shoalwater Bay, Gladstone, Harvey Bay and Moreton Bay (3 sites). No PCBs were detected in any sediment or seagrass samples collected (detection limit 50 µg/kg).
A second set of analyses was carried out on the same samples from 5 sites (Flinders Island, Cardwell, Pallarenda, Upstart Bay and Newry Bay). Detection limits were much lower for these analyses. No PCBs were detected in sediments, but PCBs were detected in seagrass samples (detection limit 0.009-0.01 ng/g).

15
Table 4: Analysis of PCBs from five sites in Queensland (ng/g)
Congener Flinders Cardwell Pallarenda Upstart Newry PCB-28 0.030 0.053 0.033 <0.023 0.039 PCB-52 0.014 0.023 0.022 <0.012 0.016 PCB-101 0.01 0.016 0.045 <0.005 0.015 PCB-153 0.014 0.024 0.12 <0.0051 0.023 PCB-138 0.012 0.018 0.090 <0.0034 0.014 PCB-180 0.0022 0.006 0.016 <0.001 <0.0032 PCB-202 <0.0001 <0.0005 0.0014 <0.0001 <0.0001 PCB-77 0.0003 0.0007 0.0006 <0.0002 0.0006 PCB-126 <0.0001 <0.0001 0.0011 <0.0001 <0.0001 PCB-169 <0.0001 <0.0001 0.0004 <0.0001 <0.0001 HCB <0.006 0.008 <0.0001 <0.0066 0.0062
Müller et al (1998) analysed samples of sediments from the Brisbane region at Eastern Bay, Coffee Pots/Midbay, Luggage Point and City/Breakfast Creek for 10 individual PCBs and found levels ranging from <0.0001 to 3.9 ng/g dw. The highest levels (for PCB-153 and PCB-138) were found in the City/Breakfast Creek site.
Table 5: Concentrations of individual polychlorinated biphenyls and hexachlorobenzene in samples from Eastern Bay, Coffee Pots/Midbay, Luggage Point and City/Breakfast Creek (in ng/g dw).
Congener Blank Eastern Bay
Coffee Pots/ Midbay
Luggage Pt
City/ Breakfast Ck
PCB-28 0.015 <0.01 0.48 0.32 0.67
PCB-52 0.0085 <0.008 0.27 0.28 0.98
PCB-101 0.0076 <0.007 0.29 0.38 1.8
PCB-153 0.011 <0.01 0.87 1.0 3.9
PCB-138 0.007 <0.006 0.4 0.45 2.2
PCB-180 0.0028 <0.005 0.37 0.43 1.7
PCB-202 0.0001 <0.0002 0.016 0.018 0.059
PCB-77 0.00017 <0.0003 0.016 0.0091 0.029
PCB-126 0.00002 <0.0001 0.0009 0.0008 0.0029
PCB-169 0.00002 <0.0001 <0.0001 0.0001 0.0001
HCB 0.0077 <0.007 0.034 0.039 0.31
16
Victoria: In 1996, CSIRO released the ‘Port Phillip Bay Environmental Study Final Report'. Part of this study deals with PCB monitoring. Total PCBs in Bay waters were reported at <4ng/L. There may be some persistence of PCBs in the Bay because they were detected in fish at all 10 sites sampled by Nicholson et al (1991). At all sites, however, PCB levels in fillets were below the Maximum Residue Limit for PCBs of 0.5 mg/kg, while only fish livers exceeded the MRL in samples taken from Corio Bay (0.71 mg/kg) and the Geelong Arm (0.58 mg/kg).
A comprehensive regional survey of PCB contamination was undertaken in Port Phillip Bay involving the analysis of 27 sediment samples and 87 samples of indigenous mussel (Richardson & Waid 1983). PCB contamination in mussels was found to be most significant in the heavy industrialised Corio Bay (Geelong) and Hobsons Bay (Melbourne) areas with the highest level of 0.93 mg/kg dry weight at a nearshore zone. Sediment samples revealed a similar spatial distribution with PCB levels up to 0.81 mg/kg. Other sampling revealed PCB concentrations nearly an order of magnitude lower, near less urbanised areas and areas further offshore from Corio Bay and Hobsons Bay.
Richardson et al (1986) conducted a 1985 study which showed that PCB concentrations had decreased in the Corio Bay area since the late 1970s study but remained static in the Hobson’s Bay area. In 1987, Murray reported PCB concentrations of up to 0.045 mg/kg dry weight at Corio Bay and 0.088 mg/kg at Hobson’s Bay that further supports findings by Richardson et al (1986).
Western Australia: McMahon (1975) conducted a study of PCB concentrations in fish from Cockburn Sound with no detections. In the mid 1980s the State Energy Commission of WA sampled for PCBs around the South Fremantle Power Station groyne, following the detection of PCB capacitors in the groyne structure. Upon dismantling the groyne it was discovered that all of the capacitors were above the water level; the capacitors were removed and the groyne rebuilt.
A survey of organic pollutants in marine sediments and the common mussel, Mytilus edulis, from the southern metropolitan coastal waters off Perth was conducted in November 1991 (Burt and Ebell, 1994). Analyses were carried out of the top 20 mm of sediments from 175 sites and in mussel tissue from 35 sites over an area of 500 km2 stretching from City Beach to Warnbro Sound and seawards to waters around Rottnest Island. Traces of PCBs (<0.01 mg/kg) were found in sediments at two sites in Cockburn Sound. PCBs were not detected in the tissue of mussels at any sites (limit of detection 0.02 mg/kg).
PCBs and wildlife
As reported by Shaw and Connell (1982 & 1986) organisms in terrestrial ecosystems have only one significant source of PCBs, that is, contaminated food, while both food and water are significant potential sources in aquatic ecosystems.

17
Biomagnification and food chain transfer are the major mechanisms for deposition of PCBs in top land-based carnivores and absorption through the gills for aquatic animals. While PCBs were detected in the aquatic environment in the vicinity of Brisbane, Sydney and Melbourne in the 1970s and 80s, one study by Olafson (1978) did not detect PCBs in the Great Barrier Reef.
Fish and Mussels: Levels of PCBs in fish from many sites are also reported in the sections above on Foodstuffs and The Aquatic Environment.
Birds: Concentrations in the muscle tissue of pelicans of 8.2mg/kg and gulls of 2.6mg/kg located in the Brisbane River estuary were found by Shaw and Connell (1982).
Platypus: Munday et al (1998) found PCB levels of between 0.04-0.57 mg/kg in Tasmanian platypus fat tissue. PCB tends to accumulate in stream sediments where the platypus feeds. The effects of the contamination on platypus are unknown although the levels are much lower than levels known to cause problems in other wildlife.
Atlantic Salmon: A sample of wild-caught Tasmanian Atlantic salmon in 1990 was well within the Australian Food Standards Codes limit for fish of 0.5 mg/kg.
Brushtail Possums: Bolton (1996) measured concentrations of PCBs in the testicular fat of ten Brushtail possums (Trichosurus vulpecula), five trapped in bushland near Healesville (60 km from Melbourne) and five from metropolitan Melbourne. All samples showed concentrations of tri- and tetra-chlorobiphenyls and one animal showed a concentration of hexachlorobiphenyls. Total PCB concentrations varied from 0.12-0.57 mg/kg (mean 0.40 mg/kg) for the Healesville animals and 0.15-0.26 mg/kg (mean 0.18 mg/kg) for the urban animals.
Australian Fur Seals: Smillie and Waid (1987) measured the concentrations of a number of organochlorine compounds in the blubber of Australian fur seals. The mean PCB concentration of 0.69 mg/kg was observed to be low in comparison with northern hemisphere samples, whereas the mean total DDT concentration of 4.03 mg/kg was at least as high as those reported elsewhere. This may reflect the fact that PCBs were used in a much narrower range of applications in Australia than in many other industrialised countries (particularly the US). DDT, however, remained in widespread use in Australia until the late 1980s.
Dugong, Shark, Soft Coral and Coral Trout: Smillie and Waid (1984) found very low levels of PCBs in dugong, shark, soft coral and coral trout in remote areas of the Great Barrier Reef and the Gulf of Carpentaria.
Dugong: Haynes et al (1998b) analysed tissue samples which were collected from 3 dugong carcasses washed onto Queensland beaches between Mackay and Townsville in 1996. All carcasses were in good condition at the time of sampling and all animal deaths were confirmed or suspected net drownings. Samples of

18
muscle, fat and liver tissue were collected from the three carcasses using standard procedures. No polychlorinated biphenyls (including the two most toxic non-ortho PCB congeners, PCB126 and PCB169) were detected in dugong liver samples, (detection limit approximately 2 ng/kg), and only two congeners, PCB28 and PCB170 were detectable in fat tissue at levels of 1.2 µg/kg wet weight and0.04-0.1 µg/kg wet weight respectively.
Whales and Dolphins: Kemp et al (1994) provided a summary of studies of chemical contamination of cetaceans in Australian waters. While 660 samples had been analysed for heavy metals, only about 40 had been analysed for any organochlorine compounds and, of these, only about ten had been analysed for PCBs. From this very limited sample the highest concentration of PCBs measured was 2.41 mg/kg in a NSW bottlenose dolphin (T. truncatus). A short-finned pilot whale (Globicephala macrorhyncus) stranded on the NSW north coast had PCB contamination of 2.0 mg/kg in ventral blubber, while dorsal and lateral blubber ranged from 1.7-1.9 mg/kg.
The preliminary and opportunistic sampling of Australian cetaceans to date has not revealed the extremely high levels of PCBs found in many northern hemisphere whales, but insufficient data exist for meaningful comparisons. As a cautionary note, PCB concentrations in Minke whales in Antarctic waters are reported to have shown a steady and consistent rise from 1984-91.
PCBs in the Atmosphere and Plants
A study and comparison of summed values of PCBs in the atmosphere was undertaken by Müller (1997) with results showing levels of selected PCBs in the atmosphere are lower than those reported from four cities in England and Hamburg, Germany, but are comparable with results from Green Bay, USA and Brazzaville, Congo. They were higher however, than levels reported in Svalbard, Norway, and those of Bayreuth, Germany. Levels are generally higher in summer than in winter and it is suggested that high summer concentrations may result from volatilisation of PCBs from the surface of the earth.
Müller’s (1997) study of mean concentrations of 6 individual PCBs in Melaleuca leaf samples indicated levels of <0.25 to 0.78 ng/g dry weight.
PCBs and Soils
PCBs in soils are not addressed by the PCB Management Plan, so are not considered in depth in this report. It is considered that most PCB contaminated sites tend to be at power generation, electrical distribution or incinerator facilities.
PCBs are not absorbed from soils into plants except into the skin of root vegetables such as carrots, and there is evidence that potentially toxic organic compounds become more strongly adsorbed to soil over time, greatly reducing transfer to carrot roots, forage crops or the general environment (Naidu et al 1996).
19
One example of a PCB-contaminated site cleanup which is now complete is at the Stevenson and Ward incinerator site in Western Australia. The classes and quantities of material dealt with and the methods of treatment or disposal were-
?? Water - 50.2kL of groundwater dewatered and treated
?? Soil - non-scheduled - 935.7 m3 or about 1800 tonnes which was all disposed of to appropriately classed landfills in the Perth Metropolitan area
- Class I - <1mg/kg PCB - 499.5 m3
- Class II - >1,<2mg/kg PCB - 121.5 m3
- Class III - >2,<50mg/kg PCB - 314.7 m3
?? Soil - scheduled (>50mg/kg PCB) 91.5 m3 (170 tonnes) was transferred to the Class V intractable waste repository at Mt Walton East.
Another site, which had detailed research undertaken on it in 1995 by Annette Davison of the Macquarie University for her PhD thesis, was the Chemplex site, Rozelle. This site is adjacent to the Balmain Power Station on one side, and Balmain High School on the other. The analysis of soil and sediment samples included PCB determinations. Samples from the fence line between Chemplex and the school found PCB levels up to 1.51 mg/kg. The levels of PCBs were highest in the beach sediments with a range of 51-1,749 mg/kg.
As part of the approved remediation of the site, the scheduled chemical waste generated during the remediation of the site was placed in containers and removed to a store licensed by the NSW Environment Protection Agency to keep such waste.
The remedial strategy for the beach sediments is to contain the scheduled chemical wastes constituents in situ with the minimum disturbance on the beach. The containment will comprise a new sea wall located at about the low tide mark. The beach behind the sea wall will be covered with clean fill to a depth of about 2 metres. The sediments beyond the new sea wall (which is below the low tide mark) will be covered by a concrete "blanket" which will extend as far as possible without disturbing sea grass beds.
Most States have a number of PCB-contaminated sites. However the number of sites contaminated with PCBs is considered to be much less than those contaminated with other chemicals, such as organochlorine pesticides. Some States have registers of contaminated sites.
CONCLUSIONS
This report collates a range of existing PCB monitoring data for the following media: breast milk and foodstuffs; sewage treatment plants and outfalls; landfill
20
sites suspected of having received scheduled PCB waste; and wildlife (biological indicators). These data have been examined in this report to determine whether the levels of PCBs found in the environment are of sufficient concern to warrant further sampling and analysis. By assessing existing monitoring programs, it can be determined whether PCB monitoring requirements outlined in the PCB Management Plan are being addressed.
Overall, while the data are not comprehensive and for some media they are very patchy, what is available does not indicate a need for further extensive monitoring other than that which is undertaken on a routine basis. However, some additional monitoring, as indicated below, would assist in determining whether the implementation of the PCB management plan is meeting the desired result of reducing levels of PCBs in the environment.
(a) Breast milk and foodstuffs
There appears to be extensive long term monitoring of Australian primary produce and processed foodstuffs that indicates only very slight PCB contamination in all but fish samples. The Australian Market Basket Survey and the National Residue Survey both show PCB levels well below national and international food standards. The limited data for breast milk in this report and the proportion of samples above or near acceptable daily intake (ADI) levels suggest that this is an area worthy of further study.
(b) Sewage treatment plants and outfalls
The data are not comprehensive, but at this stage do not suggest that PCBs are found at levels of concern. Subsequent monitoring reports should seek additional analytical data on PCBs in biosolids and sewage effluent either from State government agencies, water authorities or local governments to test the robustness of this conclusion. This would significantly enhance further PCB monitoring reports.
(c) Landfill
While landfill controls and monitoring programs differ markedly throughout Australia, most jurisdictions have, or will shortly have, controls to prevent and/or regulate the entry of hazardous wastes such as PCBs into landfill sites.
For a selection of landfill sites around Australia, which could reasonably be suspected of harbouring PCBs resulting from past disposal of PCB-containing equipment, monitoring data indicate that PCBs are unlikely to leach into the surrounding environment. The majority of landfills for which data are available are located in capital cities. While PCB waste is very likely to be present in at least some of these sites, little or no off-site migration appears to have occurred.

21
Nevertheless, there remain some questions about a few landfills that are perceived to have questionable controls for hazardous waste entering and/or leaching out of landfill sites.
(d) The wider environment
The data examined in the report indicate that sediment samples and fish taken from watercourses and marine environments in Sydney, Melbourne, Brisbane and Hobart (and possibly other urban environments) warrant continued monitoring. There is also a relative lack of data regarding PCB levels in Australian wildlife. This is particularly so for marine mammals that have frequently been a focus of concern in the northern hemisphere because of high levels of organochlorines, including PCBs.
RECOMMENDATIONS
Except for PCBs in breast milk, biosolids and wildlife, monitoring currently being undertaken should be sufficient to measure the effectiveness of the PCB management plan in protecting the environment and human health.
This report recommends that:
1) a second review of PCB monitoring studies be undertaken within the designated five year time frame (ie by December 2001) to assist the implementation of the PCB management plan. This second review should have a particular focus on:
?? PCBs in sediments of major urban area watercourses and marine environments, and aquatic species therein; and
?? PCBs in sewage sludge;
2) future studies of PCBs in breast milk be encouraged and reviewed to determine whether trace levels of PCBs found in current studies are remnants of a previous problem or an area of ongoing concern;
3) ongoing reviews of the Australian Market Basket Survey (AMBS) and National Residue Survey (NRS) be undertaken for incidences of PCB detection in primary produce and processed foodstuffs (the AMBS and NRS should continue to monitor for PCBs);
4) landfills, previously not monitored and with questions about past practices of hazardous waste disposal, be monitored for environmentally persistent

22
hazardous chemicals, including PCBs in groundwater and landfill leachate; and
5) greater attention be given to the monitoring of PCBs in wildlife where there is a current paucity of data. Emphasis should be given to the testing of marine mammal tissue, particularly from cetaceans (because they appear to be among the species which PCBs affect most deleteriously).

23
REFERENCES
Bolton, R. (1996), Ph. D. Thesis, Key Centre for Applied and Nutritional Toxicology, RMIT, Melbourne.
Bridle, T., Hammerton, I. and Hertle, C. (1990), Control of Heavy Metals and Organochlorines Using The Oil from Sludge Process, Water Science Technology, Vol 22 (12), pp 249-258.
Burt, J.S. and Ebell, G.F (1994), Organic Pollutants in mussels and sediments of Perth's southern metropolitan coastal waters: A contribution to the Southern Metropolitan Coastal Waters Study (1991-1994), Department of Environmental Protection, Perth, Technical Series 58, December.
Fishbein, L. (1979), Potential industrial carcinogens and mutagens, Studies in Environmental Science, 4, Elsevier Scientific Publishing Co., Netherlands.
Haynes, D., Müller, J., McLachlan, M. and Carter, S. (1998a). Organochlorine pollutant concentrations in sediments and seagrasses of the Great Barrier Reef and Moreton Bay (Australia). Manuscript in preparation.
Haynes, D., Müller, J., McLachlan, M. and Carter, S., (1998b). Pollutant concentrations in Great Barrier Reef (Australia) Dugong (Dugong dugong) Marine Pollution Bulletin (Submitted).
Kannan, K., Tanabe, S., Williams, J. and Tatsukawa, R. (1994). Persistent organochlorine residues in foodstuffs from Australia, Papua New Guinea and the Solomon Islands: contaminated levels and human dietary exposure, The Science of the Total Environment, Vol 153:29-49.
Kannan, K., Tanabe, S. and Tatsukawa, R., (1995). Geographical Distribution and Accumulation Features of Organochlorine Residues in Fish in Tropical Asia and Oceania, Environmental Science and Technology, Vol 29:2673-83.
Kemp, C., Gibbs, P., Obendorf, D., Marvineck, S. and Lenhaus, C. (1994), A Review of Heavy Metal and Organochlorine Levels in Marine Mammals in Australia, The Science of the Total Environment, Vol 154, pp 129-139.
Lincoln Smith, M.P. and Mann, R.A. (1989), Bioaccumulation in Near-Shore Marine Organisms I: Organochlorine Compounds and Trace Metals in Rocky Reef Animals Near the Malabar Ocean Outfall, State Pollution Control Commission, Sydney.
Mortimer, M. and Connell, D. (1996), Environmental Distribution of Chlorohydrcarbon Contaminants Associated with Sydney Sewage Discharges, Marine Pollution Bulletin, Vol 33 (7-12), pp 160-167.
24
McMahon, R.G.P. (1975), Environmental Behaviour of PCBs, Amdel Report No. 1089, The Australian Mineral Development Laboratories, Adelaide, South Australia.
Müller, J.F., (1997). Occurrence and Distribution Processes of Semivolatile Organic Chemicals in the Atmosphere and Leaves. PhD Thesis, Griffith University.
Müller, J.F., Connell, D.W., Shaw, G.R., Sadler, R., Mortimer, M., (1998) Unpublished data of Joint Project of National Research Centre for Environmental Toxicology, University of Queensland, Faculty of Environmental Sciences, Griffith University and Queensland Health and Scientific Services.
Munday, B.L., Stewart, N.J., and Sodergren, A. (1998) Occurrence of Polychlorinated Biphenyls and Organochlorine Pesticides in Australian Platypus (Ornithorhynchus anatinus) in Tasmania, in Australian Veterinary Journal, Vol 76, pp 129-130.
Murray, A. (1987), M.Sc. Thesis, Hydrocarbons and Chlorinated Hydrocarbons in the Sediments of Port Phillip Bay (Australia), Deakin University, Australia.
Naidu, R., Kookuna, R.S., Oliver, D.P., Rogers, S., Mclaughlin, M.J., eds, 1996, Contaminants and the Soil Environment in the Australasia-Pacific Region, Kluwer Academic Publishers, Dordrecth/Boston/London.
Nicholson, G.J., Thederoropoulos, T. and Fabris, G.J. (1991), Petroleum and chlorinated hydrocarbons in the axial muscle tissue and liver of sand flathead from Port Phillip Bay, Internal Report No. 197, Marine Science Laboratories, Department of Conservation and Environment, Victoria.
Olafson, R.W., 1978. Effect of Agricultural Activity on Levels of organochlorine pesticides in hard corals, fish and molluscs from the Great Barrier Reef. Marine Environment Resources, Vol 1, 87-107.
Quinsey, P., Donohue, D., and Ahokas, J. (1995), Persistence of organochlorines in breast milk of women in Victoria, Australia, Food and Cosmetics Toxicology. Vol 33(1), pp 49-56.
Roach, A. C, and Runcie, J., (1998), Levels of Selected Chlorinated Hydrocarbons in Edible Fish Tissues from Polluted Areas in the Georges/Cooks Rivers and Sydney Harbour, New South Wales, Australia, in Marine Pollution Bulletin, Vol 36, No. 5:323-344.
Richardson, B.J. (1985a), Disposal of polychlorinated biphenyl (PCB) waste in Australia, in Pollution in the Urban Environment: Polmet 85, Elsevier Applied Science Publishers, London, pp 500-506.
25
Richardson, B. J. (1985b), Polychlorinated biphenyls (PCBs) in Australian waters, in Pollution in the Urban Environment: Polmet 85, Elsevier Applied Science Publishers, London, pp 652-658.
Richardson, B.J. and Waid J.S. (1983), Polychlorinated biphenyls (PCBs) in shellfish from Australian coastal waters, Ecological Bulletin (Stockholm), Vol 35, pp 511-517.
Richardson, B.J., Smillie, R. and Waid, J.S. (1986), Case history: the Australian Ecosystem, in PCBs and the Environment, (Waid, J.S. (ed)), CRC Press, Boca Raton, Florida, pp 242-263.
RMIT Department of Applied Chemistry (1993), A Study of Toxicants at the Werribee Treatment Complex, June.
Scribner, E.A., Frederickson, S., Kastl, A., McDougal, K.W., Moodie, L.G. and Williams, R.J. (1987), Organochlorine pesticide and polychlorinated biphenyl (PCB) residues in fish and other aquatic organisms in New South Wales, Part II, Marine and estuarine waters, Department of Agriculture, NSW.
Shaw, G.R. and Connell, D. W., 1982, Factors Influencing Concentrations of Polychlorinated Bipheyls in Organisms from an Estuarine Ecosystem, in Australian Journal of Marine and Freshwater Resources, Vol. 33:1057-70.
Shaw, G. R., and Connell, D.W., 1986. Factors Controlling PCBs in Food Chains, in Waid, J.S., Ed., PCBs and the Environment, Vol 1, pp122-141. CRC Press, Inc, Florida.
Smillie, R.H. and Waid, J.S. (1984), Polychlorinated biphenyls and organochlorine compounds in Great Barrier Reef biota, in Workshop on Contaminants in Waters of the Great Barrier Reef: Report of Proceedings, Great Barrier Reef Marine Park Authority, Townsville, Queensland, July.
Smillie, R.H. and Waid, J.S. (1987), Polychlorinated biphenyls and organochlorine pesticides in the Australian fur seal, Arctocephalus pusillus doriferous, Bulletin of Environmental Contamination and Toxicology, Vol 39, pp 358-364.
Sydney Water (1996a), Ecological and human health risk assessment of chemicals in sewage discharges to ocean waters, January.
Sydney Water (1996b), Ecological and human health risk assessment in sewage treatment plant discharges to the Hawkesbury and Nepean River System, July.
Sydney Water (1997), Ecological and human health risk assessment of chemicals in sewage treatment plant discharges to the Georges River, June.
Thompson, G., Chapman, J. and Richardson, B. (1992), Disposal of Hazardous Wastes in Australia: Implications for Marine Pollution, Marine Pollution Bulletin, Vol 25 (5-8), pp 155-162.

26
Von Westernhagen, H., and Klumpp, D. W., 1995. Xenobiotics in Fish from Australian Tropical Coastal Waters, Including the Great Barrier Reef, in Marine Pollution Bulletin, Vol. 30 No. 2., February 166-9.
Williams, R. and Krogh, M. (1992), Coastal Survey of Fish for Organochlorine Compounds., Phase 1 Situation Report for Fisheries Research Institute, NSW Fisheries.
Woollard, P. and Settle, H. (1978), PCB residues in mullet, Mugil cephalus, fed to captive Eastern Australian water rats, Hydromys chrysogaster, Bulletin of Environmental Contamination and Toxicology, Vol 20, pp 606-612.