Embed Size (px)
Citation preview
Monitoring of Martensitic Transformation in Cold-Rolled 304L Austenitic
Stainless Steel by Eddy Current Method
*Roohallah SURKIALIABAD 1, Ali HEDAYATI 2, Ali SAHEB ALAM1
1 Materials Group, Engineering Faculty, Ferdowsi University of Mashhad, Mashhad, Khorasan Razavi, Iran; Phone:
+98-938-671-9753, fax: +98-511-876-3310; e-mail: [email protected],
[email protected] 2 Department of Materials Engineering, Isfahan University of Technology, Isfahan, Isfahan, Iran; e-mail:
Abstract
With measuring the volume fraction of martensite, the destruction of the samples would be considered. In this work
a 304L AISI austenitic stainless steel was rolled from 10 to 80 % reduction then the formation of martensite phase
was monitored by X-ray diffraction, image analysis of optical, SEM microscopy and eddy current investigation.
Also eddy current was carried out in the wide range of frequencies from 50 to 10000 Hz to figure out the effect of it
on structural changes then the outputs were calibrated by XRD. By comparing the data of these methods relationship
between them was found to be a function of exponential regression. In spite, some researchers have previously
reported a linear relationship.
Keywords; Quantitative XRD, magnetic investigation, strain induced martensite, plastic deformation, austenitic
stainless steel.
1. Introduction Metastable austenitic stainless steels (ASS) are interesting engineering materials mainly used for
structural purpose. A fully annealed ASS can be formed to complex shapes easily, but the
regions under severe deformation [1] or high stresses during service [2], will transform to
martensite. So the internal structure, mechanical and magnetic properties of the material are
changed [3]. To predict the properties during and after service it is vital to detect the amount of
martensite in certain conditions.
1.1 Martensitic Transformation
Different martensite morphology can be formed on cooling (thermally) or cold working
(mechanically) [4], hydrogen charging [5] and ion irradiation [6] in ASS. Deformation induced
martensite can form even though the temperature is above Ms and branched in two types: Stress-
Assisted (SAM) and Strain-Induced (SIM) [7]. SIM formed by a direct consequence of the
plastic deformation of the austenite where dislocation formation works as easier nucleation sites
for the martensite and can be morphologically different from SAM and thermally produced
martensite [7, 8]. SAM transformation occur at lower temperatures (above the Ms) and the strain
induced transformations occur at higher temperatures e.g. Room temperature [9].
During plastic deformation, dislocation density (or crystalline defects) and in consequence the
stacking fault density, within the host material, increases with the degree of deformation. The
dislocations and twins are considered to be the major sources for martensitic phase
transformation [2, 10, 11].
Researchers believe stacking faults are in hexagonal symmetry arrangement in FCC lattices, like
ɛ-martensite, n stacking faults can form a hexagonal ɛ-martensite crystal [12]. The kinetic
transformation from austenite to ά-martensite was believed to be γ →SF →n SF→ ɛ→ ά [13,
14], also γ → ɛ, γ →ά and γ → ɛ→ ά [15]. With enough driving force (decrease in Gibbs free
energy) ά-martensite nucleus will rapidly grow as plates [14] and the growth of ά-martensite
occurs by the repeated nucleation of new embryos and coalescence.
Magnetization processes are closely related to the microstructure of the materials. This fact also
makes magnetic measurements an evident candidate for non-destructive testing [16]. At room
temperature, All ASSs are paramagnetic in the fully annealed condition [4]. The hcp ɛ-martensite
is paramagnetic in contrast to the bcc ά-martensite which is strongly ferromagnetic (hard-
magnet) and the only magnetic phase in the low carbon austenitic stainless steels. When the
deformation increases the relative magnetic permeability (µ) will increase [17]. This change in
permeability is a cause of the ferromagnetic ά-martensite phase presence [18]. But when
dislocations density increase magnetic permeability will decrease [19], also every obstacle like
grain boundary, twinning boundary and austenite/martensite interface act as domain walls, In
other words the movements of the domains walls will reduce due to increase of dislocation
density, also The fine ά-martensite grains which appear inside the austenite grains mainly at the
intersection of shear bands, make the movement of dislocations more difficult and magnetic loss
happened [17, 20]
1.2 Quantitative Phase Analysis Firstly for the refinement of crystal structure parameters, The Rietveld Method was introduced
(refine neutron diffraction data by Hugo. M. Rietveld in 1969 [21], it has been expanded over the
decade for quantitative phase-analysis application. Later the method was adapted to x-ray
diffraction data [22, 23]. Some researchers use this final method to calculated amount of phases
in ASS such as David K. Matlock and et al [24] and Allison Beese and et al [25].
The principal of the method is that the intensities calculated from a model of crystalline structure
are fitted to the observed X-ray powder pattern by a least squares refinement. This is done by
varying the parameters of crystal structures and peak profiles to minimize the difference between
observed and calculated powder patterns. Since the whole powder pattern is taken into
consideration, problems of peak overlap are minimized and accurate quantitative analyses can be
obtained. To assess the success of the refinement, the so-called R-value quantifies the fit between
measured and observed patterns in percent [26, 27].
1.3 Eddy current method This method is based on the change of magnetic properties in the materials and is very sensitive
to chemical composition, microstructure, mechanical properties and residual stress of materials
[28, 29]. Its principles can be summarized as follow. induction of Eddy currents in the test
specimen in a vortex-like flux pattern by a coil [30], The formed Eddy currents generate a
secondary magnetic field which reacts with the primary field that the coil is generating. Any
changes in the magnetic field of coil will alter the impedance of it [31]. From Eq. 1. It can be
concluded that an increase in µ results in an increase in self-induction coefficient (L).
A/lN2µL = (1)
Where:
µ is magnetic permeability; N: number of turns round the coil; A: cross section area and l: the
coil length.
Several authors have carried out eddy current measurements on austenitic stainless steels. Such
as O’Sullivan et al. [2] used the techniques including the usage of magnetic Barkausen noise,
ferromagnetic phase measurement and coercively measurements, L. Zhang et al. [32]

investigated Magnetic properties of SUS304 austenitic stainless steel after tensile deformation at
elevated temperatures by using a SQUID1 and VSM
2, Also S. H. Khan et al. [33] detected
magnetic changes in stainless steel after cold reductions by Eddy current. Also Talonen [34] and
Beese [25] combined these two methods and found a non-destructive Approach for calculating
the amount of martensite.
In this study the relation between XRD, image analysis and changes of magnetic properties of
AISI 304L ASS under different working frequencies was subjected to properly detect the
different type of strain induced martensite (SAM and SIM).
2. Materials The chemical composition of 304L AISI austenitic stainless steel used in this investigation is: C:
0.027, Si: 0.427, Mn: 1.58, Cr: 18.2, Ni: 8.22, Cu: 0.58, Mo: 0.348. The steel was received in
sheet form with 10 mm thickness in the annealed condition and the ASTM grain size was 6.5.
The multi-pass unidirectional cold rolling was carried out in a two-high rolling mill. Different
thickness reductions from 10 to 80% with the strain rate of 2.1×10⁻³
s−1
were carried out at 0°C.
Before any characterization procedure, all specimens were electro polished at 24V for 60s by
usage of electrolyte (110 ml perchloric acid, 180 ml ethanol and 710 ml methanol) to remove the
surface material. Then 10 Kg Vicker hardness was used to measure change in hardness.
XRD measurements (Philips X’Pert diffractometer with Cu-Kα radiation) and PANalytical
X’Pert High Score software were performed on the cold-rolled specimens for phase
identification and calculation the amount of martensite from XRD patterns.
Microstructural investigations of the cold-rolled specimens were carried out with using an optical
and SEM microscopy. Also Cold-rolled specimens were etched [35] and image analysis was
used by MIP software to measure surface fraction of martensite.
Figure 1. Schematic of Driver and Pick up coils assemble and Setup of the probe.
The eddy current measurement was conducted by the equipment developed in the author’s
laboratory; also it was performed at room temperature with zero lift-off distance (the distance
between coil and specimen). A sinusoidal current with a frequency in the range of 50 to 10000
1 super conducting quantum interference device
2 vibrating sample magnetometer
Hz was applied to the coil for all samples. Output signals were transmitted to computer by AD
card and were analyzed. A schematic illustration of the equipment is shown in Figure 1. In this
test a probe was made from two coils on the same core, outer one for making magnetic field
(deriver coil) and another for picking it up (pickup coil).
3. Results and discussion
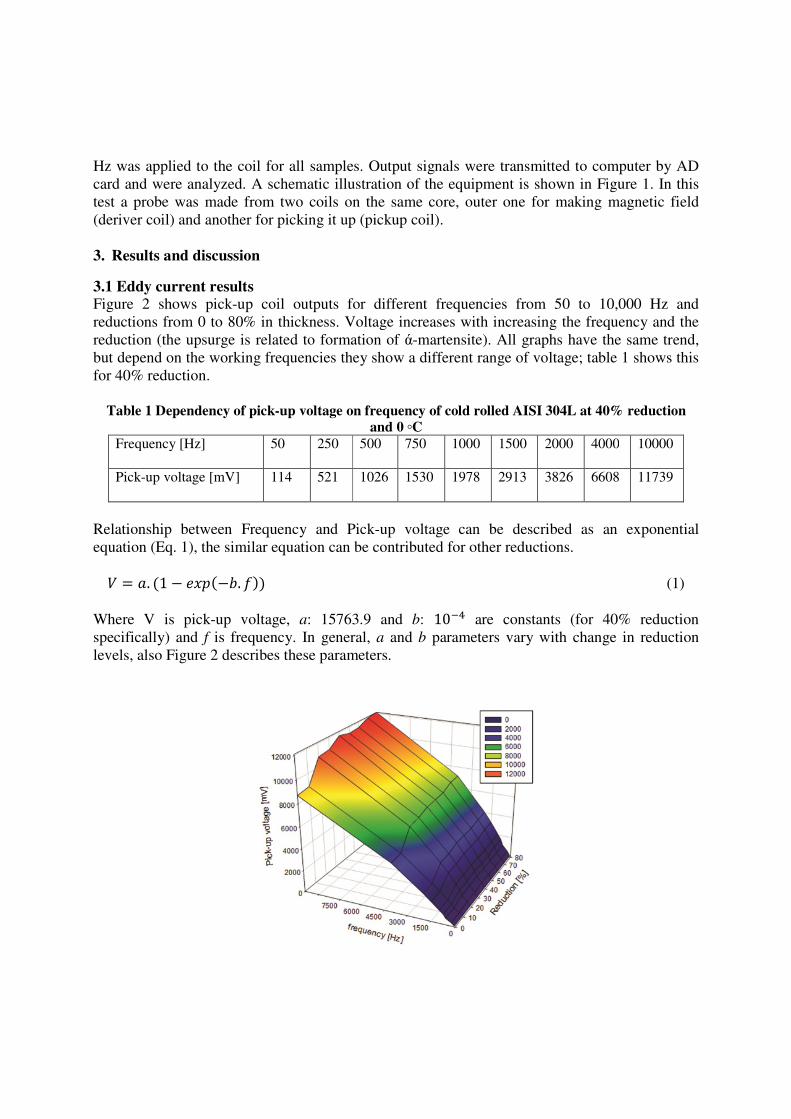
3.1 Eddy current results Figure 2 shows pick-up coil outputs for different frequencies from 50 to 10,000 Hz and
reductions from 0 to 80% in thickness. Voltage increases with increasing the frequency and the
reduction (the upsurge is related to formation of ά-martensite). All graphs have the same trend,
but depend on the working frequencies they show a different range of voltage; table 1 shows this
for 40% reduction.
Table 1 Dependency of pick-up voltage on frequency of cold rolled AISI 304L at 40% reduction
and 0 ◦C
Frequency [Hz] 50 250 500 750 1000 1500 2000 4000 10000
Pick-up voltage [mV] 114 521 1026 1530 1978 2913 3826 6608 11739
Relationship between Frequency and Pick-up voltage can be described as an exponential
equation (Eq. 1), the similar equation can be contributed for other reductions.
� = �. (1 − �(−�. � (1)
Where V is pick-up voltage, a: 15763.9 and b: 10�� are constants (for 40% reduction
specifically) and f is frequency. In general, a and b parameters vary with change in reduction
levels, also Figure 2 describes these parameters.

Figure 2 Pick-up coil outputs demonstrate for different frequencies and reductions in thickness of cold rolled AISI
304L samples at 0 ◦C.
Figure 3 shows a downward peak in a-parameter and a sudden change in the trend of b-
parameter from an exponential rising to a constant level after 12.5% reduction. This change
might be related to transitive formation of ɛ-martensite. Guntner and Reed (1962) reported when
reduction increase, volume fraction of ɛ-martensite will firstly increase then with applying more
reduction formation of ɛ-martensite will decrease to completely disappear, although volume
fraction of ά-martensite increases continuously [36].
Figure 3 Change in “a” and “b” parameters as a different range of reductions.
Figure 4 shows XRD patterns, ɛ-martensite formation starts at low reduction levels, in 10%
reduction also this is existed and in 20% no peak of it is distinguishable. It can be concluded
most ɛ-martensite formed near the 10% reduction. as we can see, it’s very near to 12.5%
reduction that previously mentioned.
Kurc (2009) [17] reported the permeability for austenite: 1.05 (at anneal state) and ά-martensite:
19.7 (at 70% reduction) in X5CrNi 18-10 steel that had very near chemical composition with the
steel is used in this work at similar strain condition. According to the above, it can be assume the
permeability of ɛ-martensite is lower than austenite. Until this phase is existed in the steel
magnetization occurs a little but at 20% where ɛ-martensite disappear a sudden raise take place
(see Figure 5).
Figure 4 XRD pattern for as received, 10% and 20% reduction, AISI 304L austenitic stainless steel rolled at 0ᵒC.

Data of Figure 2 are normalized and also the first derivative curve is plotted (Figure 5.). Based
on it, main curve (solid) can be divided into 4 regions. Region 1 where the ɛ-martensite is mainly
formed and little amount of ά-martensite can be produced as a result of not enough driving force
energy [14]. In region 2, a sudden increase in permeability is appeared, also the same result was
reported after compressing to ɛt>25% (magnetization increased sharply in the lower field region)
[11]. This indicate ά-martensite formation rate and defect density formation rate (dislocations,
stacking faults, twinning, etc.) are not balanced and probably ά-martensite formation rate is
dominant, so region 3 will appear. After 40% reduction, not only no significant change in
martensite formation happened but also defects density might be increased more than any other
regions, so a balanced might take place between them. Hence, approximately no more Eddy
current is produced; also this is in agreement with finding from Figure 3 where a-parameter
again ascends to 9*10-5
, after 50% reduction.
Figure 5 Normalized (solid) and its first derivative (dashed) eddy current output at different range of frequencies.
As can be seen the normalizing voltages are very close together at different reductions; the depth
and frequency are inversely related to each other, so it can be concluded that dispersion of ά-
martensite in the samples at different depths is uniform, also this is in full compliance with the
images of optical microscopy (Figure 6).
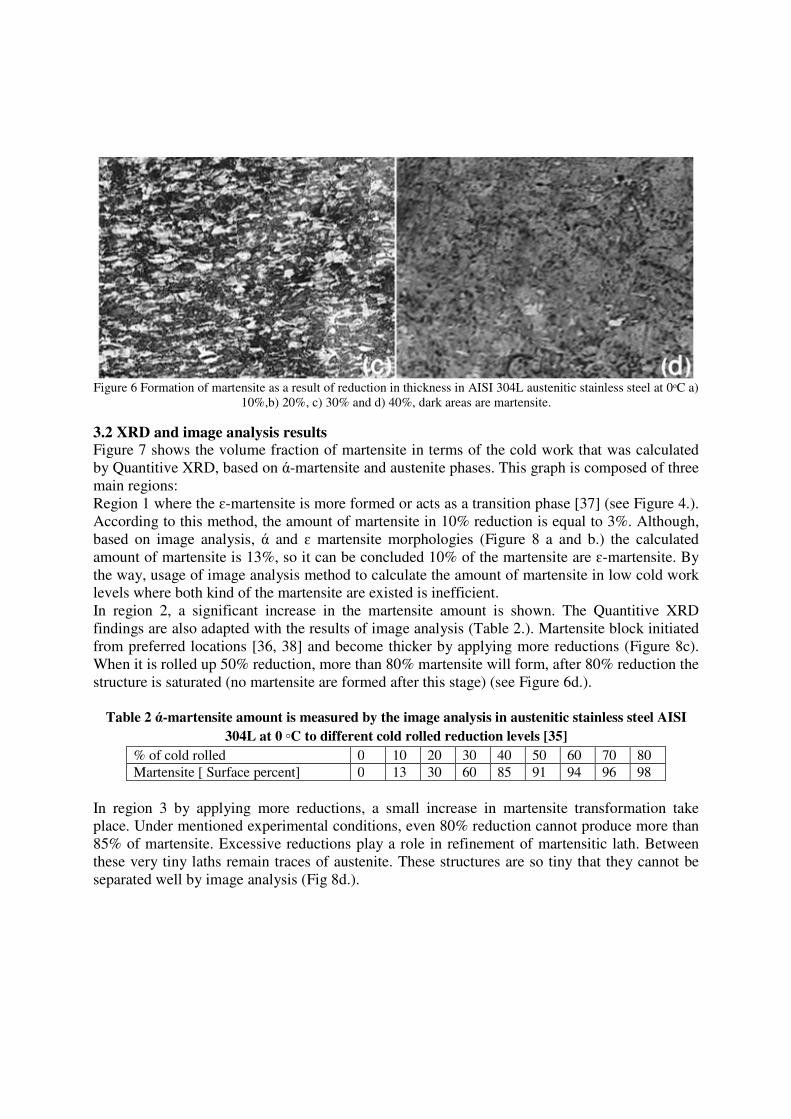
Figure 6 Formation of martensite as a result of reduction in thickness in AISI 304L austenitic stainless steel at 0ᵒC a)
10%,b) 20%, c) 30% and d) 40%, dark areas are martensite.
3.2 XRD and image analysis results Figure 7 shows the volume fraction of martensite in terms of the cold work that was calculated
by Quantitive XRD, based on ά-martensite and austenite phases. This graph is composed of three
main regions:
Region 1 where the ɛ-martensite is more formed or acts as a transition phase [37] (see Figure 4.).
According to this method, the amount of martensite in 10% reduction is equal to 3%. Although,
based on image analysis, ά and ɛ martensite morphologies (Figure 8 a and b.) the calculated
amount of martensite is 13%, so it can be concluded 10% of the martensite are ɛ-martensite. By
the way, usage of image analysis method to calculate the amount of martensite in low cold work
levels where both kind of the martensite are existed is inefficient.
In region 2, a significant increase in the martensite amount is shown. The Quantitive XRD
findings are also adapted with the results of image analysis (Table 2.). Martensite block initiated
from preferred locations [36, 38] and become thicker by applying more reductions (Figure 8c).
When it is rolled up 50% reduction, more than 80% martensite will form, after 80% reduction the
structure is saturated (no martensite are formed after this stage) (see Figure 6d.).
Table 2 ά-martensite amount is measured by the image analysis in austenitic stainless steel AISI
304L at 0 ◦C to different cold rolled reduction levels [35]
% of cold rolled 0 10 20 30 40 50 60 70 80
Martensite [ Surface percent] 0 13 30 60 85 91 94 96 98
In region 3 by applying more reductions, a small increase in martensite transformation take
place. Under mentioned experimental conditions, even 80% reduction cannot produce more than
85% of martensite. Excessive reductions play a role in refinement of martensitic lath. Between
these very tiny laths remain traces of austenite. These structures are so tiny that they cannot be
separated well by image analysis (Fig 8d.).

Figure 7 Volume fraction of ά-martensite as a function of cold rolling reduction in austenitic stainless steel AISI
304L at 0°C.
Figure 8. Optical micrographs showing ɛ and ά-martensite phase, etched dark in austenitic stainless steel AISI 304L
at 0 ◦C to cold rolled reduction of (a) 3% CR slip band formation, (b) 10% CR and mostly formation of ɛ- martensite
formed as parallel noodles, (c) 20% CR growth of ά-martensite block, (d) 80% CR remains of austenite between tiny
noodles of ά-martensite.
3.3 Relation of XRD and Eddy current results According to the above arguments magnetic behavior of cold worked austenitic stainless steels
cannot be only dependent on ά-martensite formation phase but also it should be considered
increase in the number of magnetic domains. Accordingly, this behavior can be described as an
exponential function (Eq. 4) based on extrapolated curve from Figure 9.
%M=-2.5321+0.0187 exp(0.0021×V) (4)
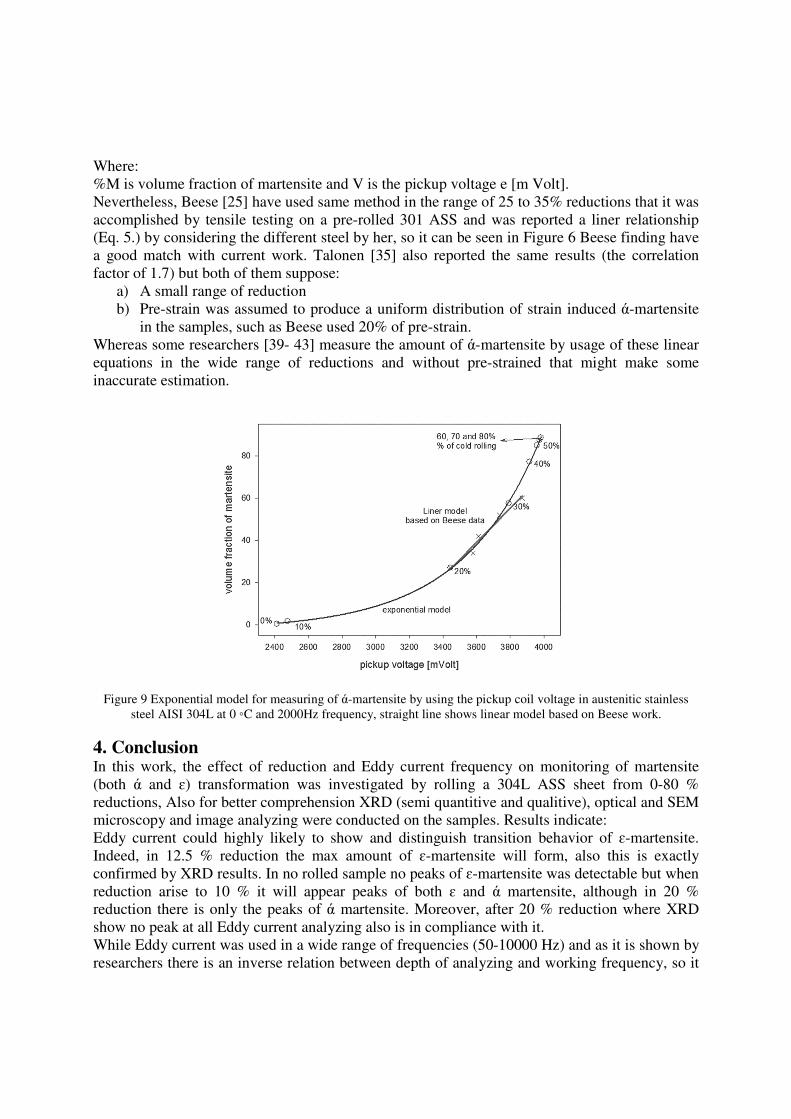
Where:
%M is volume fraction of martensite and V is the pickup voltage e [m Volt].
Nevertheless, Beese [25] have used same method in the range of 25 to 35% reductions that it was
accomplished by tensile testing on a pre-rolled 301 ASS and was reported a liner relationship
(Eq. 5.) by considering the different steel by her, so it can be seen in Figure 6 Beese finding have
a good match with current work. Talonen [35] also reported the same results (the correlation
factor of 1.7) but both of them suppose:
a) A small range of reduction
b) Pre-strain was assumed to produce a uniform distribution of strain induced ά-martensite
in the samples, such as Beese used 20% of pre-strain.
Whereas some researchers [39- 43] measure the amount of ά-martensite by usage of these linear
equations in the wide range of reductions and without pre-strained that might make some
inaccurate estimation.
Figure 9 Exponential model for measuring of ά-martensite by using the pickup coil voltage in austenitic stainless
steel AISI 304L at 0 ◦C and 2000Hz frequency, straight line shows linear model based on Beese work.
4. Conclusion In this work, the effect of reduction and Eddy current frequency on monitoring of martensite
(both ά and ɛ) transformation was investigated by rolling a 304L ASS sheet from 0-80 %
reductions, Also for better comprehension XRD (semi quantitive and qualitive), optical and SEM
microscopy and image analyzing were conducted on the samples. Results indicate:
Eddy current could highly likely to show and distinguish transition behavior of ɛ-martensite.
Indeed, in 12.5 % reduction the max amount of ɛ-martensite will form, also this is exactly
confirmed by XRD results. In no rolled sample no peaks of ɛ-martensite was detectable but when
reduction arise to 10 % it will appear peaks of both ɛ and ά martensite, although in 20 %
reduction there is only the peaks of ά martensite. Moreover, after 20 % reduction where XRD
show no peak at all Eddy current analyzing also is in compliance with it.
While Eddy current was used in a wide range of frequencies (50-10000 Hz) and as it is shown by
researchers there is an inverse relation between depth of analyzing and working frequency, so it

can be inferred the dispersion of both ɛ and ά in any reduction is homogeneous in the volume of
samples, also this finding is in compatibility with optical microscopy.
Optical microscopy in both small and large amount of deformation is not suitable method for
estimation of martensite fraction due to the lack of high resolution view where less than 20%
reduction it couldn’t able to distinguish ɛ and ά martensite separately and after 50% reduction
because of remaining about 15% of austenite between tiny layer of martensite.
The main conclusion of this study is related to finding new relationship between Eddy current
output and volume fraction of martensite within the wide range of reductions. It could be defined
as an exponential equation, in spite of other researchers whom reported a linear relation and
worked in a limited reduction range or on pre-deformed ASS.
Acknowledgements The authors gratefully acknowledge R. Poordelan for providing language help and proof reading
of this article, also M. Kashefi for discussion and NDE Laboratory help.
References [1] P Hedström, Deformation induced martensitic transformation of metastable stainless steel
AISI 301, Doctoral dissertation, Lulea University of technology, 2005.
[2] K. Mumtaz, S. Takahashi, J. Echigoya, Y. Kumara, ‘L. Zhang, H. Kikuchi, K. Ara, M. Sato,
Magnetic measurements of the reverse martensite to austenite transformation in a rolled
austenitic stainless steel’, J. mater. Sci. Vol 39, pp 1997–2010, 2004.
[3] V. Zagrebelny, A. Dubov, A. Mozgovoj, A. Rudakov, Diagnostics and forecasting of the
residual life of steel structures after long-term service, 15th world conference on non-destructive
testing, Roma, Italy, pp 15–21, 2000.
[4] I. M´Esz´Arosa, J. Proh´Aszkab, Magnetic investigation of the effect of ά-martensite on the
properties of austenitic stainless steel, J. mater. Process. Tech. Vol 161, pp 162–168, 2005.
[5] P. Rozenack, D. Eliezer, Phase changes related to hydrogen-induced cracking in austenitic
stainless steel, Acta Metall. Vol 35, pp 2329-2340, 1987.
[6] E. Manor-Minkovitz, D. Eliezer, Phase transitions in rapidly solidified stainless steels
cathodically hydrogen charged, Metall. Trans. A, Vol 21, pp 1251-59, 1990.
[7] T. Narutani, Effect of deformation-induced martensite transformation on the plastic behavior
of metastable austenitic stainless steel, Mater. Trans. Vol 30, pp 33-45, 1989.
[8] S. Varma, J. Kalyanam, L. Murr, V. Srinivas, Effect of grain size on deformation-induced
martensite formation in 304 and 316 stainless steels during room temperature tensile testing, J.
Mater. Sci. Lett., Vol 13, pp 107-111, 1994.
[9] G. Olson, M. Cohen, A mechanism for the strain-induced nucleation of martensitic
transformations, J. Less-Com. Met., Vol 28 pp 107-118, 1972.
[10] D.O Sullivan, M. Cotterell, I. Meszaros, The characterization of work-hardened austenitic
steel by NDT micro-magnetic techniques, NDT & E Int., Vol 37, pp 265-269, 2004.
[11] J. Manjanna, S. Kobayashi, Y. Kamada, S. Takahashi, H. Kikuchi, Martensitic
transformation in SUS 316LN austenitic stainless steel at RT, J. Mater. Sci., Vol 43, pp 2659–
2665, 2008.
[12] R. E. Schramm and R. P. Reed, Stacking fault energies of seven commercial austenitic
stainless steels, Metall. Mater. Trans. A., Vol 6, pp 1345-1351, 1975.
[13] J. Sort, A. Concustell, E. Menéndez, S. Suriñach, M. D. Baró, J. Farran, and J. Nogués,
Selective generation of local ferromagnetism in austenitic stainless steel using Nano indentation,
Appl. Phys. Lett., Vol 89, pp 032509- 032509-3, 2006.
[14] P Hedström, U Lienert, J Almer, M Odén, Elastic strain evolution and ε-martensite
formation in individual austenite grains during in situ loading of a metastable stainless steel,
Mater Letter. Vol 62, pp 338-340, 2008.
[15] D. L. Mcdowell, D. R. Stahl, S. R. Stock, And S. D. Antolovich, biaxal path dependence of
deformation substructure of type 304 stainless steel, Metall. Trans. A., Vol 9, pp 1277-1293,
1988.
[16] L. E. Murr, K. P. Staudhammer and S. S. Hecker, Effects of Strain State and Strain Rate on
Deformation-Induced Transformation in 304 Stainless Steel: Part II. Microstructural Study,
Metall. Mater. Trans. A., Vol 13, pp 627-635, 1982.
[17] A. Kurc, Z. Stoklosa, The effect of (γ→ α’) phase transformation on microstructure and
properties of austenitic Cr-Ni steels, Arch. Mater. Sci. Eng., 41, 2010, p 85-94, in English.
[18] G. Vertesy, I. Tomas, I. Meszaros, Non-destructive indication of plastic deformation of
cold-rolled stainless steel by magnetic adaptive testing, J. Magn. Magn. Mater., Vol 310, pp 76–
82, 2007.
[19] C. Zhang, N. Bowler, C. Lo, Magnetic characterization of surface-hardened steel, J. Magn.
Magn. Mater., Vol 321, pp 3878–3887, 2009.
[20] B. Cullity, C. Graham, Introduction to magnetic materials, 2nd
ed., Wiley, New Jersi, 2009.
[21] H. Rietveld, A profile refinement method for nuclear and magnetic structures, J. Appl.
Cryst. Vol 2, pp 65-71, 1969.
[22] G. Malmros, J. Thomas, Least-squares structure refinement based on profile analysis of
powder film intensity data measured on an automatic microdensitometer, J. Appl. Cryst.; Vol 10,
pp 7-11, 1977.
[23] R. Young, The Rietveld method, Oxford University Press, 1995.
[24] A. De, D. Murdock, M. Mataya, J. Speer, D. Matlock, Quantitative measurement of
deformation-induced martensite in 304 stainless steel by X-ray diffraction, Scripta Mater.; Vol
50, pp 1445–1449, 2004.
[25] Beese A, Mohr D. Identification of the direction-dependency of the martensitic
transformation in stainless steel using insitu magnetic permeability measurements. Exp Mech.,
Vol 51, pp 667–676, 2011.
[26] C. Manias, D. Retallack, I. Madsen, XRD for on-line analysis and control, World Cement
Research, 2000.
[27] R. Young, D. Mackie, R. Von Dreele, Application of the pattern fitting structure refinement
method to x-ray powder diffractometer pattern, J. Appl. Cryst. Vol 10, pp 262-269, 1977.
[28] D. Hagemair, J. Donald, Fundamentals of Eddy Current Testing, ASNT, 1990.
[29] D. Bray, R. Stanley, Nondestructive evaluation: a tool design, manufacturing and service,
CRC Press, 1997.
[30] P. Shull. Nondestructive evaluation: theory, techniques, and applications, M. Dekker, 2002.
[31] Hellier, Handbook of nondestructive evaluation, McGraw-Hill, 2001.
[32] L. Zhang, S. Takahashi, Y. Kamada, H. Kikuchi and K. Ara, et al, Magnetic properties of
SUS 304 austenitic stainless steel after tensile deformation at elevated temperatures, J. Mater.
Sci., Vol 40, pp 2709-2711, 2005.
[33] www.ndt.net/article/v12n06/khan.pdf, Apr. 2012, SH Khan.
[34] J. Talonen, P. Aspegren, H. Hänninen, Comparison of different methods for measuring
strain induced´α - martensite content in austenitic steels, Mater. Sci. Tech. Vol 20, pp 1506–
1512, 2004.
[35] A. Hedayati, A. Najafizadeh, A. Kermanpur, F. Forouzan, The effect of cold rolling regime
on microstructure and mechanical properties of AISI 304L stainless steel, J. Mater. Process.
Tech. Vol 210, pp 1017–1022, 2010.
[36] R. Lagneborgj, The martensite transformation in 18% Cr-8% Ni steels, Acta Metal., Vol 12,
pp 823-843, 1964.
[37] R. Reed, The spontaneous martensitic transformations in 18% Cr, 8% Ni steels, Acta Met.
Vol 10, pp 865, 1962.
[38] K. Datta, R. Delhez, P. Bronsveld, J. Beyer, H. Geijselaers, J. Post, A low-temperature
study to examine the role of ε-martensite during strain-induced transformations in metastable
austenitic stainless steels, Acta Mater. Vol 57, pp 3321–3326, 2009.
[39] M. Eskandari, A. Kermanpur, A. Najafizadeh, Formation of Nano-grained structure in a 301
stainless steel using a repetitive thermo-mechanical treatment, Mater. Letter. Vol 63, pp 1442–
1444, 2009.
[40] D. Schino, I. Salvatori, J. Kenny, Effects of martensite formation and austenite reversion on
grain refining of AISI 304 stainless steel, J. Mater. Sci. Vol 37, pp 4561–4565, 2002.
[41] F. Forouzan, A. Najafizadeh, A. Kermanpur, A. Hedayati, R. Surkialiabad, Production of
Nano/submicron grained AISI 304L stainless steel through the martensite reversion process,
Mater. Sci. Eng. A, Vol 527, pp 7334–7339, 2010.
[42] L. Martins, R. Plaut, A. Padilha, Effect of carbon on the cold-worked state and annealing of
two 18cr/8ni austenitic stainless steels behavior, ISIJ Int. Vol 38, pp 572-579, 1998.
[43] D. Schino, M. Barteri, J. Kenny, Development of ultra-fine grain structure by martensitic
reversion in stainless steel, J. Mater. Sci. Letter. Vol 21, pp 751– 753, 2002.


![Premium Catalogue...PREMIUM CONNECTIONS CATALOGUE INTRODUCTION TenarisHydril SMYS [ksi] MARTENSITIC MODIFIED MARTENSITIC SUPER MARTENSITIC TN 80Cr13 TN 85Cr13 Martensitic Stainless](https://img.dokumen.tips/doc/110x75/6017b8e739d10b0116239e29/premium-catalogue-premium-connections-catalogue-introduction-tenarishydril-smys.jpg)