Embed Size (px)
Citation preview

Umweltwiss Schadst Forsch (2010) 22:229–251
123
IMPLICATIONS OF GMO-CULTIVATION ANd MONITOrING • SErIES
DOI
Received: 15 December 2009 / Accepted: 29 March 2010 / Published online: 24 April 2010
Monitoring of Bt-Maize pollen exposure in the vicinity of the nature reserve Ruhlsdorfer Bruch in northeast Germany 2007 to 2008
Frieder Hofmann · Rita Epp · Andreas Kalchschmid · Werner Kratz · Lothar Kruse · Ulrike Kuhn · Bettina Maisch · Elke Müller · Steffi Ober · Jens Radtke · Ulrich Schlechtriemen · Gunther Schmidt · Winfried Schröder · Werner von der Ohe · Rudolf Vögel · Norbert Wedl · Werner Wosniok
© Springer-Verlag 2010
Preamble This series „Implications of GMO-Cultivation and Monitoring“ unifies the two former series „GVO-Monitoring“ (published in Umweltwiss Schadst Forsch) and „Implications of GM-Crop Cultivation“ (published in Environ Sci Pollut Res). The aim of this harmonisation was to meet the challeng-es caused by changes in (1) risk assessment on the one hand and (2) regulation of GMO cultivation in the EU on the other hand. The process of developing appropriate scientific meth-ods for risk assessment and monitoring stepped over from the national to the European level. The current challenge is to harmonise scientific methods and means for risk assessment, monitoring and regulation within the EU. This implies the in-tegration of scientific and regulatory aspects.
The series opens with an article on new results of pol-len monitoring on Bt-maize cultivation, nature conserva-tion and regulation. Pollen monitoring belongs to the first scientific methods that could successfully be standardised on a national level in Germany as VDI Guideline 4330 p. 4 (2007). It was applied in the State Brandenburg in 2007, and the results led to regulative measures. A report on this first year of investigation was published in Umweltwiss Schadst Forsch 2008 in the series „GVO-Monitoring“ (Hofmann et al. 2008). The results of this first case study attracted wide attention beyond Germany. So, the method was chosen by CEN (European Committee for Standardisation) to be stand-ardised on a European level. In 2008, the State Brandenburg
10.1007/s12302-010-0133-6
Responsible editors: Gunther Schmidt · Winfried Schröder · Frieder Hofmann
F. Hofmann ()Ökologiebüro, TIEM Integrierte Umweltüberwachung Gbr,rennstieg 25, 28205 Bremen, Germanye-mail: [email protected]
r. Epp · L. KruseImpetus GmbH & Co. Bioscience KG,Fischkai 1, 27572 Bremerhaven, Germany
A. Kalchschmied · B. Maisch · E. MüllerGenetic Id (Europe) AG,Am Mittleren Moos 48, 86167 Augsburg, Germany
U. KuhnBüro Kuhn,Albert-Bischof Str.76, 28357 Bremen, Germany
W. KratzFreie Universität Berlin, FB Biologie,Privat: Himbeersteig 18, 14129 Berlin, Germany
S. OberNaturschutzbund deutschland e. V. (NABU),Bundesgeschäftsstelle Berlin,Charitéstraße 3, 10117 Berlin, Germany
J. RadtkeLänderinstitut für Bienenkunde Hohen Neuendorf e. V.,Friedrich-Engels-Straße 32, 16540 Hohen Neuendorf, Germany
U. SchlechtriemenSachverständigenbüro, TIEM Integrierte Umweltüberwachung Gbr,Im Sacke 2, 37176 Nörten-Hardenberg, Germany
G. Schmidt · W. SchröderLehrstuhl für Landschaftsökologie, Hochschule Vechta,PO-BOX 1553, 49364 Vechta, Germany
W. v. d. OheNds. Landesamt für Verbraucherschutz und Lebensmittelsicherheit, Institut für Bienenkunde Celle,Herzogin-Eleonore-Allee 5, 29221 Celle, Germany
R. VögelLandesumweltamt Brandenburg,Tramper Chaussee 2, 16225 Eberswalde, Germany
N. WedlGutachterbüro Wedl (FFH-Gebietsbetreuer),Bergstr. 43, 15374 Müncheberg, Germany
W. WosniokInstitut für Statistik, Universität Bremen,Am Fallturm 1, 28355 Bremen, Germany

230
123
Umweltwiss Schadst Forsch (2010) 22:229–251
accomplished a second year of investigation. This article covers new results of both years of investigation and dis-cusses the outcome of the study for regulatory purposes. Further articles to this series are planned. The Editors
Abstract Background, aim, and scope Basically, techno-logical innovations are associated with benefits and risks. This is also true for the introduction of genetically modi-fied organisms (GMO) into agriculture. In Germany, pre-cautionary regulations currently demand isolation distances (i. e. buffer zones) for the cultivation of genetically modified maize (Bt-maize) in the vicinity of conventional (150 m) and organic maize fields (300 m). The Bt-toxin may harm non-target organisms (NTO) such as Lepidoptera. Despite this, corresponding regulations for the protection of nature reserves are lacking to date. Conventional and Bt-maize have been grown in the vicinity of the Flora-Fauna-Habitat (FFH) ruhlsdorfer Bruch in Brandenburg, Germany. The aim of this study was to investigate whether exposure of maize pollen from surrounding Bt-maize fields to NTOs in the nature protection area could be excluded or not. Two types of exposure were investigated: Firstly, whether maize pollen was dispersed by wind into the nature reserve area exposing resident NTOs. Secondly, foraging NTOs from the nature reserve are exposed by roaming the surrounding fields and collecting maize pollen. In order to fulfil the pre-cautionary principle defined by law, the study should help to determine appropriate isolation distances for the cultivation of Bt-maize with regard to sustainable protection of NTOs in the FFH ruhlsdorfer Bruch. In 2007, the local authorities issued an isolation distance between Bt-maize fields and na-ture reserves of 100 m and in 2008, this became 250 m in the northern and 500 m in the westerly direction, respectively.
Materials and methods Standardised methods for biolog-ical and technical pollen sampling issued by the Association of German Engineers (VdI 4330 Part 3, 2007 and VdI 4330 Part 4, 2006) were applied providing a quality controlled and methodologically harmonised database which does not only serve the needs to be fulfilled by the present case-spe-cific monitoring study but can also be used as a reference database for further investigations. Maize pollen exposure was measured within the FFH Ruhlsdorfer Bruch and its immediate vicinity in July and August 2007 and 2008. In 2007, the sampling was performed at three sites using 12 technical samplers (Sigma-2/PMF) placed at five measur-ing points at distances from 5 m to 120 m from the maize field edges. Additionally, for biological pollen sampling six bee colonies were situated at these three sites (two colo-nies at each site). The technical sampler Sigma-2/PMF ena-bles point sampling which is primarily influenced by wind and topography providing information on effective maize pollen input (flow and deposition) at the measuring sites. Honey-bees roaming in the surrounding area with typical
foraging distances of several kilometres may act as planar collectors. They may serve as indicators for the exposure to pollen-collecting NTOs. Furthermore, biological sampling is more selective due to the organism’s preferences, whereas the technical sampling is neutral. Hence, both the technical and the biological sampling complement each other in their scope of application. The pollen samples of both matrices were analysed microscopically and the maize pollen loads were quantified. Pollen-dNA was analysed by means of the quantitative PCr-method (qPCr) identifying conventional and Bt-maize pollen by two independent laboratories. In 2008, the monitoring was repeated with additional sites. Eighteen technical samplers were exposed at five sites with eight measuring points at distances from 5 m to 250 m from the maize field edges. Two honey-bee colonies for biologi-cal sampling were placed at one site for control purposes. PCR-analyses were performed to measure the amounts of Bt-maize pollen in the samples.
Results The results of pollen monitoring at the Ruhlsdor-fer Bruch revealed maize pollen exposure for all monitor-ing sites in both surveys. In 2007, up to 1.75 million maize pollen/m² were deposited at sites closest to the maize field. At 120 m from field edge in the middle of the FFH-reserve, 99,000 maize pollen/m² were detected. In 2008, similar re-sults were found, at distances up to 250 m from the field edges deposition of 164,000 maize pollen/m² was detected. Data on maize pollen deposition show a clear distance rela-tionship and are in accordance with results of further com-prehensive surveys based on the same methodology (Hof-mann 2007).
The results of the microscopic analysis of the pollen pel-lets demonstrated that bees collected maize pollen at all sites, in 2007 and 2008. Although maize pollen is not the main food source (2007:0.1–0.3 %; 2008:2–3 %) the collec-tion efficiency of the bee colonies resulted in high amounts of sampled maize pollen with 4 to 11 million per site in 2007 and up to 467 million in 2008. Molecular-biological analysis of maize pollen dNA by qPCr demonstrated that transgenic Bt-MON810 DNA was present in all technical and biologi-cal samples, corroborated by two independent laboratories. In 2007, the GMO-content in the samples ranged up to 44 % in the bioaerosols and 49 % in the pollen pellets. In 2008, GMO-proportions of up to 18 % were detected.
Discussion The results of this study provide evidence that NTOs in the ruhlsdorfer Bruch were exposed to Bt-maize pollen under the cultivation conditions in 2007 with a buffer zone of 100 m. The GMO-content reached up to 48 %. The results of the monitoring in 2008 confirmed these findings. Even though the exposure could be reduced by increasing the isolation distances to 250 m and 500 m respectively, the results still show percentages of up to 18 % Bt-MON810 in the pollen samples. The results on maize pollen deposition at the Ruhlsdorfer Bruch in 2007 and 2008 correspond to

231Umweltwiss Schadst Forsch (2010) 22:229–251
123
the results of an investigation which was conducted over several years applying the same standardised method, but covering a wider range of distances. The correlation be-tween maize pollen deposition (n/m²) and distance to the source field (m) fitted best to a power function of the type y = 1.2086 · 106 · x–0.548. despite the same trend, the pollen deposition in the Ruhlsdorfer Bruch revealed above-average findings. Also the analysis of the pollen pellets collected by the bees showed an exposure in 2007 with values for the GMO-content of up to 49 %. For both methods, the expo-sure decreased in 2008 due to the greater buffer zones up to 500 m. Whereas the GMO-content for the biological sam-pling were reduced to values below 10 %, the values for the technical sampling were still higher indicating that greater buffer zones would be necessary for safety reasons under the precautionary principle.
Conclusions The results of this investigation proved that maize pollen were dispersed by wind to distances farther than 250 m from field edge leading to maize pollen exposure in the centre of the nature reserve. The results also demon-strated that foraging NTOs living in the nature reserve were exposed to maize pollen from surrounding fields. Consider-ing the cultivation of Bt-maize MON810, the assumption of the Environmental risk Assessment (ErA) that there will be no relevant exposure beyond the Bt-maize fields, can-not be confirmed. Considering the results of this and related studies and with respect to the precautionary principle, one can state that buffer zones between Bt-maize fields and pro-tected areas are an effective measure to minimise the expo-sure of Bt-maize pollen to NTOs and, thus, to prevent from adverse effects.
Recommendations and perspectives Because of still in-sufficient ecotoxicological data for the risk assessment of Bt-maize MON810 considering butterflies and other pro-tected NTOs, protection standards assuring the precaution-ary principle have to be implemented to avoid Bt-maize pol-len exposure to NTOs. This applies for the case ruhlsdorfer Bruch and for nature reserve areas in general. In order to ex-clude risks to protected NTOs occurring in nature reserves, sufficient buffer zones for Bt-maize cultivation should be considered. The statistical analysis revealed that distances of more than 500 m are necessary to decisively reduce ex-posure to foraging insects. In fact, distances of more than 1,000 m are necessary to prevent maize pollen deposition from values above 100,000 pollen/m² with a certainty of 90 %. An adequate risk assessment can only be attained if based on field measurements accounting for the high vari-ation of pollen deposition due to local environmental site conditions and field management. The monitoring should be based on standardised methods. It should include locations with the highest expected deposition rates, the boundaries of the protected areas and sites of interest within those bounda-ries, e. g., specific habitats of sensitive species.
Keywords Biomonitoring · Bt-maize · Buffer zone · deposition · Exposure · Flora-Fauna-Habitate (FFH) · Genetically modified organisms (GMO) · Honey-bee Apis mellifera · Isolation distance · Maize · Mon810 · Monitoring · Nature reserve · Non-target-organisms (NTO) · Pollen · Pollen mass filter (PMF) · Pollen monitoring · Protected area · Quantitative PCr (qPCr) · Safety distance · regulation · TaqMan
1 Background, aim, and scope
It is well known that technological innovations are asso-ciated with both benefits and risks. Thus, the introduction of genetically modified organisms (GMO) into agriculture also gives rise to safety concerns (Cannon 2001; Singh et al. 2006). Considering the cultivation of GMO, any identi-fied benefits and risks for environmental and human health should, therefore, be compared with benefits and risks as-sociated with the use of non-GMO. Sparrow (2010) argues that insect-resistant GM crops may have some impact on non-target insects, but compared with the application of pesticides on the non-GM crops the impact on non-target organisms for this kind of crop management may be far more severe. Ricroch et al. (2010) discussed whether the German suspension of MON810 maize cultivation is sci-entifically justified (cf. devos et al. 2005; Gurian-Sherman 2008). Craig et al. (2008) concluded from an extensive lit-erature research on risk assessments of GM crops that small plots and laboratory studies should be complemented by large-scale monitoring and modelling. Thereby, post-market monitoring is needed to verify pre-market risk assessments and, thus, should be conducted with a scientifically valid testable hypothesis as a basis, or to verify pre-market risk assessments. Clark (2006) reviewed the world-wide litera-ture regarding environmental issues of GMO and the dis-cussion, alongside other topics, asked against what standard GMO should be assessed and considered temporal and spa-tial scale issues. Correspondingly, it can be concluded that much of the controversy regarding the potential effects of GMO at the landscape level is due to the lack of harmonisa-tion of methods and test designs for GMO monitoring. More basically, most of the reviewed studies do not consider es-sential requirements in terms of philosophy of science and statistics (Schröder and Hofmann 2008): Transparency, i. e. traceability of results regarding basic issues of quality as-surance and control such as objectivity (proof that results do not depend on the investigating scientist), reliability (repeat-ability and precision of measurements), validity (evidence of selected measurement variables), and representative-ness of the sample (both structural with regard to space and time, and functional regarding the ecological significance of the measured objects/variables). These basic requirements
232
123
Umweltwiss Schadst Forsch (2010) 22:229–251
are insufficiently documented in most studies on GMO impacts.
The investigation at hand yields quality controlled and methodologically harmonised data which do not only serve the needs to be fulfilled by the present case-specific moni-toring study but can also be used as a reference database for further investigations regarding Bt-maize pollen exposure of non-GMO fields or nature protection areas.
The toxin of the soil bacterium Bacillus thuringiensis (Bt) has been used in biological pest control for a long time. Feeding damage is caused by caterpillars of the European Corn Borer (Ostrinia nubilalis) that chews tunnels into the stalks of maize which causes the plants to fall over. The Bt-toxin interrupts the development of the caterpillar after in-gestion. The genetically modified (GM) Bt-maize Mon810 expresses the Bt-toxin in every part of the plant. In contrast to chemical application, the toxin is abundant over the whole life time of the plant including its degradation. Depending on the respective Bt-trait, the GM maize varieties differ in the overall concentration of the Bt-toxin as well as in its distribution in the parts of the plant (Lorch and Then 2007; Mertens and Schimpf 2006; Nguyen and Jehle 2007). The trait Mon810 expresses the modified toxin Cry1Ab that is toxic to the target organism Ostrinia nubilalis. But other, so-called non-target organisms (NTOs)1, especially other but-terfly species (Lepidoptera), are known to be affected, too (Marquard and durka 2005). Bt-maize pollen dispersed by wind and deposited on the foliage of plants or the soil is in-gested by larvae and might harm them, unintentionally (di-vely et al. 2004; Felke and Langenbruch 2005; Losey et al. 1999; VDI 4330 Part 13 2010). New results show that other arthropods and genera, like daphnia, caddisflies, lady birds and mussels, show adverse effects as well (Bohn et al. 2008; Douville et al. 2007; Pilcher et al. 2005; Rosi-Marshall et al. 2007). Beyond single species, effects at the ecosystem level have to be considered, too (Obrycki et al. 2001). Potential toxic effects are determined by the amount of exposure to the Bt-toxin and therefore to the amount of Bt-maize pollen, respectively. Dispersion and deposition of maize pollen de-pend on the intensity of pollen being shed during flowering as well as on the meteorological and environmental condi-tions, the topography, soil conditions, the texture of leaves, and the feeding behaviour of NTOs like caterpillars (Lang et al. 2004; VdI 4330 Part 13, 2010). Thus, wind-drifted Bt-maize pollen could affect NTOs living in nature reserves. A similar exposure and potential harm applies for foraging NTOs like bees, bumble bees, flies etc. collecting pollen from adjacent maize fields. On the other hand, there are studies denying harmful environmental effects of GMOs, specifically of Bt-maize (as reviewed by Clark 2006; Craig
1 The term NTO comprises all non-floristic organisms apart from them being targeted by the pest control (Marquardt and durka 2005).
et al. 2008; Kulikov 2005; Singh et al. 2006; Gathmann et al. 2006, Sparrow 2010). A model exercise by Perry et al. (2010) suggested that adverse effects of Bt-maize pollen drift may be negligible on three lepidopteran species. How-ever, the model assumptions with regard to pollen exposure and dispersal distance were underestimated (Hofmann et al. 2008, 2009), while the conclusions of the model appear to suffer from high uncertainty caused by the limited original dataset on toxicity of MON810 pollen to European Lepi-doptera (cf. Lang and Otto 2010).
According to European and German law it has to be en-sured that the cultivation of GMO may not lead to any sub-stantial adverse effect on man and nature: The precautionary principle, evolved out of the German socio-legal tradition in the 1930s, states that if an action or policy has suspected risk of causing harm to the public or to the environment, in the absence of a scientific consensus that harm would not ensue, the burden of proof falls on those who would ad-vocate taking the action. Effectively, this principle allows policy-makers to make discretionary decisions in situations where there is evidence of potential harm in the absence of complete scientific proof. The principle implies that there is a responsibility to intervene and protect the public where scientific investigation discovers a plausible risk after screening for other suspected causes. Protection measures for mitigating suspected risks can only be relaxed if further scientific findings emerge that more robustly support an al-ternative explanation. In some legal systems, as in the law of the European Union, the application of the precautionary principle has been made a statutory requirement (Klöpffer 2001; Mayer and Stirling 2002; Recuerda 2006; Steinhäuser 2001; Sunstein 2005). This implies that protected species, habitats and protected areas must not be impaired. For nature reserves, it is explicitly regulated that the protection applies not only for the species population in total but also for the individual in compliance with the preservation of the gene pool itself. Precautionary regulations for GMO in Germany provide isolation distances for the cultivation of Bt-maize to neighbouring conventional maize fields of 150 m as well as to organic maize fields (300 m) to prevent cross-breeding effects in accordance with the legal limit of 0.9 % GMO-share. Despite potential adverse effects of the Bt-maize on NTOs, a distance regulation regarding neighbouring nature reserve areas was missing before this investigation.
The study area „Ruhlsdorfer Bruch“ located in the fed-eral state of Brandenburg (Northeast Germany) is protected both as a FFH (Fauna-Flora-Habitat, code dE 3450-302) and as a nature reserve area according to the German Nature Protection Act (Fig. 1). This designation is due to the oc-currence of protected habitats such as extensively cultivated moist meadows in its centre and of calcareous and sandy dry grasslands on its hillsides. The area is of high value for nature conservation and houses rare and protected species

233Umweltwiss Schadst Forsch (2010) 22:229–251
123
like the butterfly Lycaena dispar („Large Copper“;. It’s one of the most robust populations in Brandenburg appear-ing from early June to mid-July and early August to early September. The larvae feed on Rumex hydrolapatum (sor-rel) preferring exposed and solitary plants. The caterpillars occur from the end of June to the end of July which coin-cides with the maize flowering period. Pollen of Bt-maize might be deposited on sorrel plants in the larvae’s habitats located next to the maize fields. Thus, adverse effects of the
Bt-toxin on the population of Lycaena dispar cannot be pre-cluded. The same applies to the butterfly Euphydryas au-rinia (Marsh Fritillary) which occurs in a small population in the Ruhlsdorfer Bruch. The monophagous larvae feed on Succisa pratense („Devil’s-bit Scabious“).
The calcareous and sandy dry grasslands on the hillsides of the Ruhlsdorfer Bruch (habitats No. 6210 and 6120 accord-ing to Annex I, FFH-directive) house a lot of endangered in-sect species, especially nine species of Zygaenidae („Burnet
Fig. 1 Map of maize cultiva-tion and sampling sites for pollen monitoring by PMF and bee colonies in the vicinity of the nature reserve area FFH Ruhlsdorfer Bruch for the years 2007 and 2008

234
123
Umweltwiss Schadst Forsch (2010) 22:229–251
moth“), a family of the order Lepidoptera which is unique for Northern Germany. Except for Z. trifolii, the whole de-velopmental cycle of all identified Zygaenidae is established on dry grassland. The first larvae stadium, in particular, of some of the species begins in July/August and therefore coin-cides with maize flowering on the neighbouring fields. Most of the moth’s habitats are found close to the field margins (5 to 50 m), too. Hence, exposure to Bt-maize pollen might occur and, consequently, impacts on these species and other endangered insects living in the xerotherm grassland.
Since 2005 Bt-maize Mon810 has been cultivated in the study area. In 2007, the percentage of cultivated Bt-maize compared to conventional maize varied between 20 and 50 % in the surrounding region. Whereas the conventional maize fields were cultivated outside as well as inside the nature reserve, the Bt-maize fields had to be restricted to maintain an isolation distance of 100 m from the border of the nature reserve according to an order of the local admin-istration in spring 2007 (see Fig. 1). Hence, Bt-maize fields located inside the FFH area had to be removed just before flowering of maize in July.
The aim of the study at hand was to examine a basic as-sumption of the Environmental risk Assessment (ErA). Accordingly, maize pollen drift should be restricted to the field margins and only few pollen may be dispersed farther. For distances greater than a few meters, no exposure has been assumed and therefore any risks for NTOs were ne-glected in the Environmental Impact Assessment and Moni-toring Plan (BVL 2008). This statement was questioned by the authorities based on scientific results on maize pollen dispersal (Ayler et al. 2003; Brunet et al. 2008 and 2009; Emberlin 1999; Hofmann 2007; Kawashima et al. 2005). The task of the pollen monitoring in 2007 (Ober et al. 2008) and 2008 (Hofmann et al. 2009a) was to measure the expo-sure of maize pollen in the nature reserve Ruhlsdorfer Bruch caused by the surrounding maize fields by technical and bio-logical pollen sampling. Pollen flow and deposition were detected using the standardised technical sampling method issued by the Association of German Engineers (VdI 4330 Part 3 2007) to evaluate how far and to what extent maize pollen was drifted by wind. Besides wind-drifted pollen, another type of exposure to NTOs had to be regarded: Sev-eral NTOs living in the nature reserve are foraging insects, for example wild bees, bumble-bees, wasps, syrphids etc., roaming in surrounding Bt-maize fields for nutritional pur-poses. They might be exposed to maize pollen, too. Hence, pollen pellets collected from local honey-bee colonies have been analysed by applying the corresponding standardised method (VDI 4330 Part 4 2006). This study should help in defining scientifically sound buffer zones for the cultivation of Bt-maize Mon810 in the vicinity of the FFH Ruhlsdorfer Bruch in particular as well as for nature reserve areas in general.
2 Materials and methods
2.1 Sampling locations
In 2007, two main areas (sampling sites I + II) within the nature reserve Ruhlsdorfer Bruch were selected for pol-len monitoring by technical and biological sampling (see Fig. 1). Twelve technical samplers were installed at eight measuring points at distances of 5 m to 120 m from the maize field margins to detect maize pollen gradients from field edge towards the central parts of the nature reserve area. For biological sampling, two bee colonies were deployed at each site. For reference purposes, a third site (sampling site III) outside the nature reserve was chosen for biologi-cal sampling. A broad-based monitoring study covering 122 sampling sites in Germany and Switzerland between 2001 and 2006 served as a reference for the technical sampling (Hofmann 2007).
In 2008 the technical sampling was repeated at the sam-pling sites I and II and extended by three further sites to gain more detailed information on the distribution of maize pol-len deposition within the FFH-area (see Fig. 1). The addi-tional site V was located within the nature reserve at greater distances with two measuring points up to 250 m apart from the next maize field margin. Site IV was located at the bor-der of the nature reserve at a distance of 500 m from the next Bt-maize field. Site III was located outside of the nature re-serve at 20 m distance to a Bt-maize field. For the biological sampling in 2008, site I was chosen again.
2.2 Technical pollen sampling
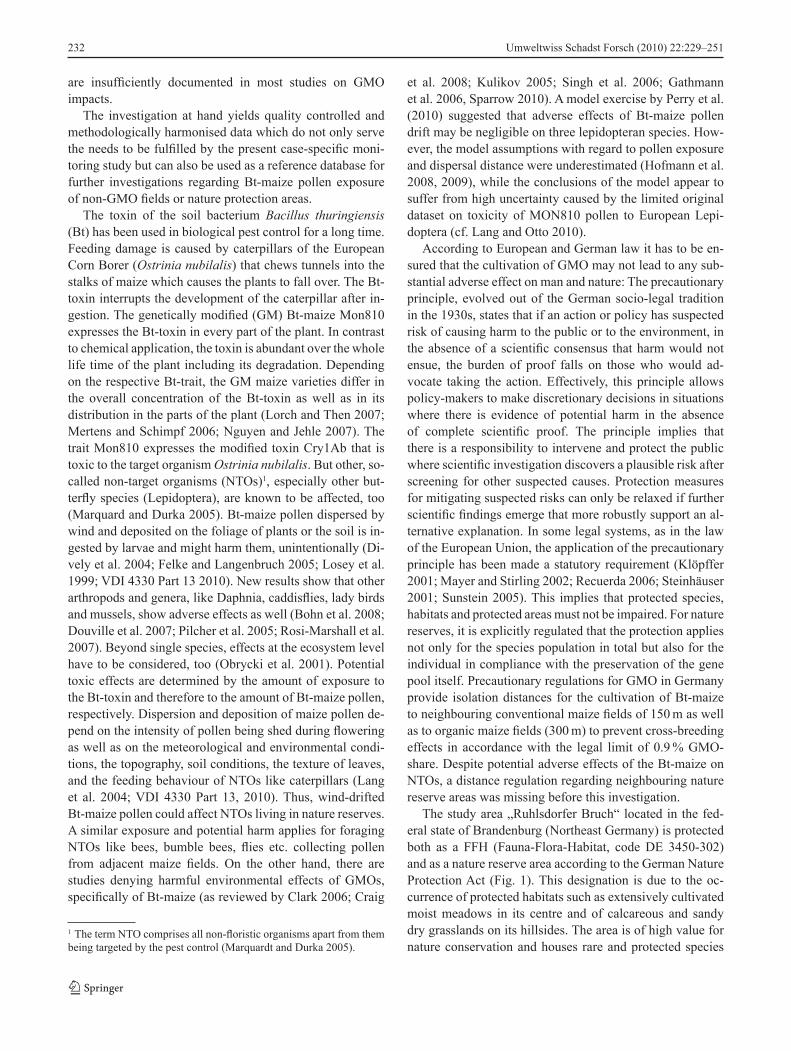
Technical pollen sampling was performed in both years, 2007 and 2008, with the same standardised methods accord-ing to VDI 4330 Part 3 (2007) using the combined pollen mass filter PMF/Sigma-2 passive aerosol sampling system (Fig. 2). Maize pollen flow as well as pollen deposition were recorded using the PMF device as described by Hof-mann (2007). The PMF serving as a passive sampler was invented in 2001 especially for GMO monitoring purposes (Beismann and Kuhlmann 2006; Hofmann et al. 2005). The method was validated and finally standardised in the German VDI-guideline 4330 (3) (2007). The method was chosen by CEN (Comité Européen de Normalisation) for European standardisation (CEN TC264 WG29) which is in process (Beismann et al. 2007).
The technical pollen sampler is classified as a point sam-pler representing the wind-drifted aerosol particle loads at the sampling site which depends on the position of the sam-pler in relation to the pollen sources and prevailing wind directions during the flowering period.
The PMF sampler consists of special depth-filters (fleece filters) made of coated, thermally bound and progressively

235Umweltwiss Schadst Forsch (2010) 22:229–251
123
layered polypropylene fibres. This design provides low aero-dynamic resistance and easy flow of ambient air through the filter. Further on, the characteristics of the filter material en-sure that particles larger than 10 µm (most pollen ranges from 10 to 120 µm in diameter) adhere to the surface of the fibres and are retained. If it rains, parts of the pollen are washed off the surface of the fibres into the collection flask. The samples for downstream analyses are extracted from the filter material and from the liquid collected in the flask using a special sam-ple preparation procedure described below. For the horizon-tal wind component the effective flow cross-section (height × width) of the filter body is 100 mm × 80 mm = 0.008 m² for all wind directions. This omnidirectional sampling enables us to collect maize pollen in a representative way and even close to strong sources like the maize field or even in the midst of it, which cannot be done reliably using the standard pollen traps of Hirst-type (Hofmann et al. 2005). Furthermore, the PMF collects more pollen leading to improved detection limits (VDI 4330 Part 3 2007). The measuring points met standard conditions with unobstructed air flow. Because of the high temporal variation of maize pollen shedding in the northern hemisphere (Hofmann et al. 2009b; Hout et al. 2008; Jaroz et al. 2005; Kawashima et al. 2005), the exposure time has to be standardised covering the main maize flowering period as a requirement for comparable results. This was met by the exposure times from July 11th until August 4th in 2007 and from July 11th until August 8th in 2008.
In 2007, 12 technical samplers were distributed over the two sites at distances from 5 m to 120 m to field edge to test a gradient (see Fig. 1). At sampling site I, four samplers were lined up at the closest distance in the range of 5 m to 6 m along the field margin to test the variation of pollen dep-osition (site I, measuring point 1). Two samplers were lo-cated at a distance of 26 m (site I, measuring point 2) and at 120 m (site I, measuring point 3), respectively. At sampling site II, four technical samplers were installed along the field
edge at distances of 18 m to 25 m (site II, measuring point 9) and two far from the maize fields (61–63 m) (site II, measur-ing point 4). The four technical samplers located at measur-ing point 9 were removed by the farmer before the end of maize bloom. The exact positions of the measuring points as well as of the respective field boundaries were located by GPS. The distances to the field margin were calculated and checked by tape measurements.
In 2008, the technical pollen sampling followed the design of 2007 but further sampling sites were added. The sample size k (number of samplers per measuring point) was chosen according to the results of the previous year (see Fig 1). At sampling site I six technical samplers were installed again at three measuring points at distances of 5 m (measuring point 1, k = 1), 25 m (measuring point 2, k = 2) and 120 m (meas-uring point 3, k = 3). At site II, this time one measuring point was established at a distance of 80 m from the maize field margin (measuring point 4, k = 3). In 2008, three more sites were monitored by technical sampling: site IV was located in the north-eastern centre of the nature reserve. Two meas-uring points were located at distances of 170 m (measuring point 5, k = 3) and 250 m (measuring point 6, k = 2) to the next (conventional) maize field. Site III was chosen next to a Bt-maize field located 500 m to the west of the border of the nature reserve. The measuring point was placed at a dis-tance of 20 m to the field margin (measuring point 7, k = 2). Site V was located right at the border of the nature reserve area. The distance of the measuring point (measuring point 8, k = 2) to the next Bt-maize field was 500 m in a westerly direction and 10 m to the next conventional maize field in an easterly direction.
2.2.1 PMF sample preparation
The preparation of PMF pollen samples from the filter pads and the liquid collected in the flasks was carried out ac-
Fig. 2 Technical pollen sampler PMF/Sigma-2. Left: Site I, measuring points #1a at 5 m distance and #2 at 26 m distance to maize field edge (4 August 2007) (Picture: Hofmann)

236
123
Umweltwiss Schadst Forsch (2010) 22:229–251
cording to VDI-guideline 4330 Part 3 (2007) using ultra-sonic and vacuum filtration to sediment the sample as filter cake on acetyl-ethylene membrane filters (12-µm pore size, 50 mm diameter, sterile and free of dNA). Sample qual-ity was checked by examining the filter cakes with pollen samples on the membrane filters under the binocular micro-scope and documented by digital microphotography. The bioaerosol samples (from filter cake) were transferred into a 15 ml tube free of dNA. After centrifugation (2,000 rota-tions/min [rpm](~500 g), 5 min) the volume was reduced to 2 ml, and 2 ml of glycerol was added leading to 4 ml of 50 % glycerol pollen suspension (density 1.1 g/cm³). The pollen suspension was then mixed with a shaker and subsamples for the various analyses were taken and stored until subse-quent analysis at –20 C.
2.2.2 Microscopic pollen analysis
The microscopic pollen analysis was done in cooperation with the Institute for Apiology of Lower Saxony in Celle. Subsamples of 10 to 100 µl were used performing qualita-tive analysis of the pollen spectrum and quantitative deter-mination of maize pollen and total pollen counts according to VdI 4330 Part 3 (2007) under 400-times magnification. For qualitative analysis of the surveyed pollen spectrum, all microscopically differentiated plant pollen were identified and documented (naming species, genus and family). The Melissopalynological Collection of Celle (von der Ohe and von der Ohe 2000) was used as a reference for identifica-tion. The taxonomic naming of plant species was carried out according to Zander (2002).
The maize pollen and total pollen counts were determined by application of the dynamic counting method encompass-ing a minimum of 1,000 pollen grains. The absolute detec-tion limit for the maize pollen counting is determined by the discrete number of one detected pollen grain. The relative detection limit of maize pollen depends on the total pollen count. The dynamic counting method ensures comparable results of maize pollen counts keeping the detection limit in the range of 0.1 % and lower.
Using a micropipette, a volume of 10 µl was taken from the subsample of the glycerol pollen suspension for micros-copy. After preparation the total pollen count was estimated. If necessary, the glycerol pollen suspension was adjusted after this, i. e. by adding glycerol, so that a volume of 10–50 µl taken from it gave approx. 1,000 pollen grains in the counted sample. Several subsamples with corresponding volumes of 10–50 µl were subsequently taken and quanti-fied. The cumulated pollen counts of the subvolumes were then extrapolated to the total sample, in which the respec-tive pollen concentration per µl and the total pollen count relating to the PMF sample were specified for maize pollen and total pollen.
2.2.3 Determination of pollen flow and deposition
On the basis of the maize pollen and total pollen counts in the samples (Ni), the horizontal pollen flow (Fi) and deposition (Di) of maize pollen and total pollen were es-timated according to VDI 4330 (3) (2007) and Hofmann (2007).
Horizontal pollen flow is given as the number of pol-len being transported by wind for a given cross-sectional area of one square metre during exposure time, here the maize bloom. Vertical pollen deposition summarises the number of pollen being deposited on an inert surface of one square metre during this time as a standard deposi-tion value.
The horizontal pollen flow for maize and total pollen was calculated according to the following formula regarding the sampling efficiency of the PMF:
⋅⋅⋅⋅=
23
6
10810
mk
pollenn
E
NF ii
with Fi pollen flow of species i per m² in measuring period T
Ni number of pollen counts of species i in sample E sampling efficiency (0.35) compared to volumetric
standard pollen trap k number of cases (samplers) per plot Standard reference area: 1 m² = 106 mm² Projected collection cross-sectional area of PMF sam-
pler = 8·10³ mm²The deposition of larger particles like pollen in air depends mainly on the sedimentation function of particle size, den-sity and shape and on the interaction with the final acceptor surface. The latter has to be regarded in a standardised way for comparable data, assuming an inert surface, so that the deposition velocity equals the sedimentation velocity here. According to the variation of the maize pollen sizes between 60 and 125 µm, typical values for the sedimentation veloc-ity varies between 0.14 and 0.4 m/s, and a mean value of 0.2 m/s was taken here (Aylor 2002). According to Aylor (2002) identical properties of Bt- and conventional maize pollen can be assumed. For estimating the vertical deposi-tion of maize pollen onto a horizontal standard reference area of 1 m² accumulated over the measuring period cover-ing the maize bloom, the following formula was used:
⋅
=2
,
m
pollenn
u
vFD
mean
maizedmaizemaize
with Dmaize maize pollen deposition Fmaize maize pollen flow per m² vd,maize mean deposition velocity for maize pollen
(0.2 m/s) umean mean wind velocity (2 m/s) Standard reference area: 1 m²

237Umweltwiss Schadst Forsch (2010) 22:229–251
123
2.2.4 Reference data and statistical analysis
For reference purposes, results of a representative study on maize pollen deposition covering 122 sites in Germany and Switzerland were used (Hofmann 2007). The data were gained by the same standardised sampling method using the PMF sampler during the years 2001 to 2006. The data were analysed statistically on the relation of maize pollen deposi-tion and distance from next maize field edge. The data in-cluded close distances from inside the field and below 1 m from field margin up to 3,200 m from field edge. The sites represented commercial maize cultivation, for example various field sizes from below 1 ha to over 10 ha as well as single field situations and complex field arrangements and various directions between field and sampling point, so that the variation over the main wind direction is included, too. The aim of the study was to analyse the effects of distance regulation to exposure under regular cultivation conditions (Hofmann 2007). The regression analysis revealed a statis-tically significant (p < 0.001) relationship between maize pollen deposition and distance to the next maize field in the form of a power function supporting the findings of Aylor et al. (2003).
⋅⋅= −
25471.06 in102086.1
m
pollennxDmaize
with Dmaize maize pollen deposition x distance from next maize field edge in m Data transformation (log-log) and linear regression analy-sis resulted in the following mean regression function, error of regression and confidence intervals for single measurements.
+⋅−=
2in0822.65485.0
m
pollennxy
p = <0.001 r2 = 0.58
with y log (10) of maize pollen deposition per square metre x log (10) of distance from next maize field edge in m (for measuring points inside maize fields: 0.3 m dis-
tance to next maize plants) The regression is statistically significant on a level of at least 99 %. The r² of 0.58 indicates, that 58 % of the data variation is explained by only one factor, the distance to the next maize field. The rest of the 42 % variation of deposition data is due to other varying conditions, for example influence from wind direction: A sampling site downwind of the source is expected to get more pollen than a sampling site beside or opposite to the main wind direction at the same distance. Variation is expected from different field sizes, field arrange-ments, regional conditions and year to year changes, too. The confidence limits give us the overall variation due to the variety of influencing factors under commercial cultivation conditions as relevant for distance regulations. Because of the standardisation of the method, the results of the statisti-cal analysis of that data pool could serve as a valid reference for this study enabling an efficient study design.
2.3 Biological pollen sampling
Biological pollen sampling was performed by using colonies of honey-bees (Apis mellifera L.) according to the VDI 4330 Part 4 (2006) (Fig. 3). For the sampling of maize pollen, the pollen pellets of honey-bees were examined. The pol-len pellets were collected by pollen traps (type Holtermann, Fig. 3). In 2007, the sampling was done in cooperation with the Institute for Apiology in Hohen Neuendorf (Branden-burg) and with the assistance of local bee keepers, and in 2008 solely by a local bee keeper (Mr. Succow).
The bee colonies were exposed during maize pollen bloom (beginning of July to mid-August in 2007 and 2008). The pollen traps were activated according to the diurnal pat-tern in the early morning every Monday, Wednesday and
Fig. 3 Biological pollen sam-pling by honey-bee colonies. Left: Bee hives of the two colonies at site I (2007); Upper right: Pollen traps type Holter-mann; Down right: Pollen pellet sample (Picture: Radtke)

238
123
Umweltwiss Schadst Forsch (2010) 22:229–251
Friday. This interval sampling was necessary because the bees need the pollen for feeding their larvae.
In 2007, two bee colonies were placed at each of the two sites I and II, respectively. For reference, two more bee colo-nies were placed at sampling site III which was located out-side the conservation area and surrounded by maize fields. In 2007, the sampling of pollen pellets began on July 20th and ended on August 13th. The daily samples of the two bee colonies per site were mixed leading to 11 samples per site and 33 for all three sites during the sampling period.
In 2008, two bee colonies were placed at site I for control purposes. The samples were taken from July 18th until Au-gust 8th. The samples of the two bee colonies were treated this time separately to test the variation in the samples per colony resulting in 20 samples in total.
Microscopic pollen analysis
The pollen pellet samples were analysed microscopically with the assistance of the Institute of Apiology in Celle (Lower Saxony). For the temporal variation in the collec-tion of maize pollen during the sampling period, the daily samples of the pollen pellets were analysed separately by binocular microscope to estimate the maize pollen content (volumetric percentages of maize pollen).
For quantitative analysis in 2007, the daily samples of both colonies per site were unified, homogenised, sieved (mesh width 2 mm and 0.5 mm) and finally dispersed in a 50 %-glycerol-suspension of 1,000 ml volume. In 2008, the samples of the two colonies at site I were treated separately. The daily samples per colony were pooled, homogenised and solved in a 50 %-glycerol-suspension.
A representative random sample was taken and analysed microscopically according to the VDI-guideline 4330 part 4 (2006) using 400-times magnification in a similar way as described in Section 2.2.2. We quantified total pollen counts, the maize pollen counts and the percentage of maize pollen (count/count) in the bee pollen pellet samples. Since maize pollen are greater in diameter (80–120 µm) than most of the other pollen species in the summer season the values for per-centage by counts are smaller than for percentage by volume.
The interval sampling (three days per week) had to be taken into account estimating the total amount of maize pollen col-lected by the bee colonies over the whole maize bloom season per site (2007), respectively per colony and site (2008). There-fore, the values for maize pollen counts of the interval sam-pling were extrapolated to the complete exposure time during maize bloom standardised to a comparable period of 28 days.
2.4 Molecular-biological analysis of pollen DNA using PCR
The DNA of the pollen samples obtained by biological and technical sampling was analysed by polymerase chain reac-
tion (PCr). The quantitative PCr analysis (qPCr, TaqMan) was conducted by two certified and experienced laborato-ries, independently (Impetus GmbH & Co. Bioscience KG and Genetic Id (Europe) AG).
For PCr-analysis, the bioaerosol samples obtained by technical pollen sampling in 2007 were pooled according to site and distance of the sample points to the field mar-gin. This led to five analyte samples of the distance classes 5 m, 20 m, 25 m, 60 m and 120 m (see Table 3). In 2008, the bioaerosol samples from the eight measuring points were pooled according to the sites resulting in five analyte samples.
For PCr analysis in 2007, the combined total pollen pellet samples per site were analysed. In 2008, the total pellet sample of the two colonies of site I were analysed separately. All pollen samples had to be purified and con-centrated as described below before dNA extraction and PCR.
2.4.1 Purification and concentration of the bioaerosol samples for PCR
Purification and concentration of wind drifted maize pol-len was performed using separation methods differenti-ating by size and density. This was necessary since the bioaerosol samples contained besides the targeted maize pollen many other aerosol particles which were found to inhibit PCR reaction. The bioaerosol samples from the first preparation step in 2.2.1 were treated using a wet sieving cascade system (Fritsch Analysette Pro, metal meshes and micro wet sieving, sieves of 10 cm diameter, stepwise sieving with mesh widths of 500 µm, 180 µm, 125 µm, 60 µm) to purify the samples and concentrate the maize pollen in the sample fraction 60–125 µm. This fraction was then reduced to a volume of 2 ml and puri-fied further by density centrifugation. In a 15-ml centrifu-gation tube the pollen sample was carefully transferred on top of 2 ml of CsCl-solution (1.5 g/cm³) overlaid with 2 ml of glycerol (80 %). Subsequent centrifugation was performed stepwise beginning with 500 up to 2,000 rpm, each for 5 min. The maize pollen concentrated in the tran-sition zone of glycerol and CsCl. After removing the up-per glycerol and water layers and the bottom sediments, the volume was filled up with water to 15 ml and cen-trifugation was performed at 2,000 rpm. Then the volume was reduced to 2 ml containing the respective fraction of maize pollen. Finally, 2 ml of glycerol were added to obtain 4 ml of glycerol pollen suspension. After shaking 20 µl of the suspension were used for microscopic analy-sis to control quality and quantity of the maize and total pollen contents. Then the samples were split up into two subsamples and stored at –18 °C until subsequent dNA extraction and PCr analysis.

239Umweltwiss Schadst Forsch (2010) 22:229–251
123
2.4.2 Purification and concentration of honey-bee pollen pellet samples for PCR-analysis
The maize pollen content in pollen pellet samples may vary strongly. Because of the limitations of PCR analysis con-sidering the amount of DNA that can be analysed and the resulting relative and absolute detection limits, it is neces-sary to separate and concentrate the maize pollen in the ana-lyte sample to concentrations greater than 15 % to guarantee comparable results of PCR-analysis on the percentage of BT-MON810 detection on a 0.1 %-level.
The homogenised pollen pellet samples (2.3.1) were treated by separation methods differentiating in size using a wet sieving cascade system (Fritsch Analysette Pro, metal meshes and micro wet sieving, sieves of 10 cm diameter). Stepwise wet sieving was applied with mesh widths of 180 µm, 125 µm, and 60 µm to concentrate the maize pollen in the sample fraction 60–125 µm. This sample fraction was sieved until the suspension was transparent, transferred to a 500-ml Erlenmeyer flacon, mixed and distributed equally to 50-ml centrifugation tubes (e. g. Greiner). After centrifuga-tion (2,000 rpm, 5 min) the water volume in the tubes was reduced nearly to the sediment containing the maize pollen fraction, filled up by 50 % glycerol and mixed. 500 µl of the suspension were used for microscopic analysis to control the quality and quantity of the maize pollen and total pollen contents. The majority of the maize pollen was intact in all samples. Representative subsamples of 2 ml were stored at –18 °C until subsequent PCr analysis.
2.4.3 Extraction of DNA for PCR
After purification and concentration of pollen collected by PMF/honey bees two different laboratories were put in charge of dNA analyses including extraction (this section) and PCr analyses (2.4.4): I) Genetic Id (Europe) AG, II) Impetus GmbH & Co. Bioscience KG.
Laboratory IAccording to Sections 2.4.1 and 2.4.2, the 15 ml tube con-taining the glycerol pollen suspension was centrifuged at 1,600 g for one minute and the supernatant was discarded. Approximately 100 µl remaining suspension was mixed with 1 ml of 1XTE buffer and transferred to 1.5-ml screw cap tubes. To clean the suspension of glycerol three consec-utive washing steps were performed, each with 1-ml 1XTE buffer (centrifugation at 11,000 g for 1 min).
For physical pulping a steal ball (DIN 5401) was added and the tube was applied to a pebble mill (Mini-Beadbeater, Biospec Products) for 3 min at 2,500 rpm.
After adding 1 ml of Genomic Lyse (Fast ID Genomic dNA Extraction Kit; Genetic Id NA, Inc., Fairfield, IA, USA) the mixture was transferred to a 2 ml tube and 10 µl
of proteinase K (20 mg/ml) were added. The solution was mixed and incubated at 65 °C overnight. After cooling down 2 µl of RNAse A solution (1 mg/ml) were added and the mixture was incubated at 37 °C for 15 min. After addition of 48 µl of NaCl solution (5 mol/L) the mixture was vortexed and incubated at –20 °C for 5 min. Following centrifugation (11,000 g, 5 min) the aqueous supernatant was transferred to a 1.5 ml tube and 2.5 µl glycogen solution (20 mg/ml) and 0.8 volumes of isopropanol (–20 °C) were added. After incu-bation at –80 °C for 20 min the precipitate was centrifuged to the bottom of the tube (11,000 g, 20 min). The pellet was washed using 500 µl of 70 % ethanol (–20 °C) (centrifuga-tion at 11,000 g for 10 min) and then dried at 65 °C for 10 min and finally dissolved in 100 µl of 1XTE buffer.
For additional purification of the dNA the solution was mixed with 100 µl of Genomic Bind (Fast Id dNA Extrac-tion Kit; Genetic Id NA, Inc., Fairfield, IA, USA) and ap-plied to a Fast ID DNA Binding Column (Fast ID DNA Extraction Kit; Genetic Id NA, Inc., Fairfield, IA, USA). Using a vacuum manifold the columns were washed three times with 1 ml of Genomic Bind and three times with 1 ml of ethanol (75 %).
Finally the dNA was eluted in 100 µl of 1XTE.
Laboratory IIThe pollen/glycerol suspension was transferred to a suitable centrifugation tube and diluted with sterile water followed by thorough vortexing. After centrifugation (30 min, 3,250 g, room temperature) the supernatant was discarded. To the pel-let 10-ml CTAB buffer (2 % CTAB, 0.1M Tris/HCL, pH 8.0, 20 mM EdTA pH 8.0, 1.4 M NaCl) and 0.6 mg Proteinase K was added and incubated overnight at 60 °C. After the addi-tion of 0.25 mg RNase A and incubation for 30 min at 37 °C the sample was centrifuged (15 min, 3,250 g, room tempera-ture). The supernatant was extracted once with 1 volume of phenol-chloroform (1:1) and once with 1 volume of chloro-form. Afterwards, the aqueous phase was transferred into a fresh tube and the DNA was precipitated with 0.7 vol of iso-propanol at room temp. After centrifugation (20 min, 3,250 g, room temperature) the (nonvisible) pellet was washed with 1-ml 70 % ethanol, dried for 10 min at 60 °C and then re-sus-pended in 50–100 µl of TE buffer. Further purification of the extracted dNA was necessary to remove potential inhibitory substances co-extracted with dNA. We used column chro-matography (Microspin S-300 Hr columns, GE Healthcare UK Ltd. Little Chalfont, Buckinghamshire, UK).
2.4.4 Quantitative analysis of DNA by qPCR
Laboratory IReal-time PCR was performed using a primer/probe set for the quantification of the corn-specific gene Adh1 (Genetic Id NA, Inc., Fairfield, IA, USA), a CrL validated specific

240
123
Umweltwiss Schadst Forsch (2010) 22:229–251
primer/probe set for the quantification of MON810 dNA (CrL 2009), and an ABI 7500 Fast real-time PCr system. 12.5 µl of TaqMan® Universal PCr Master Mix (ABI) were mixed with 2.5 µl of primer mix and 10 µl of template dNA. All PCR reactions were pipetted in duplicates.
For generating calibration curves certified 100 % MON810 reference material (Genetic Id NA, Inc., Fair-field, IA, USA) was diluted to 1, 0.1, 0.01 and 0.001 ng/µl and applied to PCR. To control for potential inhibition of the PCr reactions, sample dNA was applied to the PCr in three concentrations, undiluted, 1:2 and 1:4 respectively with 1XTE buffer. Cycling conditions were 2 min at 50 °C, 10 min at 95 °C, and 45 cycles of 15 seconds at 95 °C and 60 seconds at 60 °C.
The data were analysed using the ABI 7500 Fast Sequence Detection Software (Version 1.4). The threshold cycle number values were plotted against the corresponding cali-bration curve to obtain the quantity of dNA. By dividing the MON810 DNA value with the maize DNA value the relative content of MON810 (percentage GMO) could be calculated.
Laboratory IIThe event-specific real-time quantitative detection of gene-tically modified maize MON810 was conducted in an ABI 7900 sequence detection system. All specific chemicals (primers, probes, TaqMan Universal Master Mix, AmpliTaq Gold polymerase) were purchased at Applied Biosystems Germany.
The validated method we used for the determination of the relative content of MON810 is based on a method pub-lished by Monsanto (2004). MON810 is specifically detect-ed by amplifying a fragment that spans the 3`insert-to-plant junction. We used the HMG-gene as the maize-specific ref-erence system. All reactions were run in duplicates, also the control reactions (positive controls, negative controls, spik-ing/inhibition controls). Cycling conditions were as follows: 10 min 95 °C (1×), 15 sec at 95 °C, 30 sec at 60 °C (45×).
For calibration we used certified reference material (Fluka, Switzerland) including dNA for maize (HMG) and MON 810. The HMG and MON810 ct values were meas-ured and set into relation to the standard curve data to deter-mine the contents of MON810 dNA, the total maize dNA and the relative content of MON810 (percentage GMO) by dividing the MON810 value with the total maize value.
3 Results
3.1 Horizontal flow and deposition of maize pollen
The results of the technical pollen sampling on the at-mospheric maize pollen deposition at the nature reserve ruhlsdorfer Bruch are shown in Table 1 indicating the ex-
posure of the respective NTOs feeding on maize pollen de-posited on the surfaces of leaves or the soil.
In 2007, the total number of pollen grains collected by PMF devices varied from 129,000 to 550,000 (Table 1a). On average, a total of 492,560 pollen grains were found in the four samplers at a distance of 5–6 m (measuring point 1) to the field edge. The counts varied from 432,080 to 550,720 showing good reproducibility of the bioaerosol sampling method. The number of maize pollen ranged from 49,040 (11.3 %) at a distance of 5 m to 2,760 (1.6 %) at a distance of 120 m to the field margin. This resulted in a horizontal pollen flow of 17.5 million maize pollen/m² at a distance of 5 m and 986,000 maize pollen/m² at a distance of 120 m dur-ing the maize bloom. Accordingly, the deposition of maize pollen – describing the number of pollen being deposited on a plain surface within an area of 1 m² – ranged from 1.75 million to 8,600 maize pollen/m².
In 2008, the total number of pollen grains per measur-ing point varied from 147,000 to 622,000 (Table 1b). The number of maize pollen ranged from 18,400 (11.8 %) at a distance of 5 m to the maize field margin to 5,600 (3.8 %) at a distance of 120 m, and 8,200 (1.5 %) at the farthest distance of 250 m. The resulting horizontal pollen flow amounted to 6.57 million maize pollen/m² at a distance of 5 m, 667,000 maize pollen/m² at a distance at 120 m, and 1,464 million at 250 m during the maize bloom. Accordingly, the deposi-tion of maize pollen ranged from 657,100 (5 m) to 66,700 maize pollen/m² (120 m), and 146,400 maize pollen/m² at a distance of 250 m.
3.2 Maize pollen in honey-bee pellets
The sampling of pollen by honey-bees serves as an indicator of exposure of foraging NTOs. Quite a few NTOs living in the nature reserve, for example insects like wild bees, bum-ble bees, wasps, beetles etc., collect and consume maize pollen from surrounding maize fields.
In 2007, the pollen pellets of honey-bees were collected periodically at all three sampling sites on 11 of 25 days re-sulting in a total of 33 samples. Table 2a summarises the daily pollen yields (g) for each sampling site as well as the number and the percentage of the microscopically analysed maize pollen borne in the pollen pellets. For estimation of the total amount of maize pollen collected by the bees dur-ing the whole period of 25 days the values were projected.
The analyses revealed that at all three sampling sites (I–III) maize pollen was collected by honey-bees. Site I and II were located within the nature reserve. Sampling site III was surrounded by maize fields and, thus, reflects a maxi-mum input of maize pollen. Although there was a rich sup-ply of competitive flowering plants, especially in the nature reserve, the bees chose maize blossoms and collected pollen. The amount of collected pollen varied by day and by bee

241Umweltwiss Schadst Forsch (2010) 22:229–251
123
colony. There were pollen pellets containing 100 % maize pollen as well as pollen pellets without any maize pollen, and samples that ranged between these extremes. The daily course of pollen sampling indicates that maize pollen was collected by honey-bees especially during bad weather con-ditions when no other pollen was available. In 2007, the max-imum percentage of maize pollen in a daily sample (20 %) was found at sampling location III on July 26th at the end of a cold, damp weather period. In some of the pollen pellets no maize pollen was found, especially during the middle of August when a lot of plants other than maize were flowering intensely and the maize bloom decreased. Accordingly, in these days the amount of maize pollen was very low. The rel-ative portion of maize pollen to total pollen varied between
<0.1 % up to 20 % in the daily samples and between 0.1 % and 0.3 % in the overall samples. At site I, the overall sample of pellets contained 1.77 million maize pollen resulting in an amount of 4.0 million maize pollen for the seasonal collec-tion in 2007. At site II, 3.76 million maize pollen were found in the overall sample resulting in an amount of 8.5 million maize pollen for the season. At site III the overall sample contained 4.8 million maize pollen resulting in an amount of 11.0 million maize pollen for the season.
In 2008, site I was monitored again, but this time both bee colonies were analysed separately considering variation be-tween the two colonies. The daily samples of 2008 showed a similar pattern (Table 2b). Most of the maize pollen was col-lected from the mid to the end of July. The percentages of
Table 1 results of the technical pollen sampling by PMF on maize pollen flow and deposition in 2007 and 2008
a) 2007
Distance next maize field
Site Measuring point
Number of cases
Total pollen counts per
sample
Maize pollen counts per sample
Maize pollen
Flow Deposition
m k Nges n % n/m²T n/m²T n/cm²T n/haT
5 m I 1a 1 432,080 49,040 11.3 % 17,514,000 1,751,400 175 1.8·1010
5 m I 1b 1 518,800 33,040 6.4 % 11,800,000 1,180,000 118 1.2·1010
6 m I 1c 1 468,640 31,840 6.8 % 11,371,000 1,137,100 114 1.1·1010
6 m I 1 d 1 550,720 34,240 6.2 % 12,229,000 1,222,900 122 1.2·1010
Mean 5 m I 1 4 492,560 37,040 7.5 % 13,228,000 1,322,800 132 1.3·1010
26 m I 2 1 407,360 13,600 3.3 % 4,857,000 485,700 49 4.9·109
61 m II 4 1 190,080 14,400 7.6 % 5,143,000 514,300 51 5.1·109
63 m II 4 1 128,800 15,520 12.0 % 5,543,000 554,300 55 5.5·109
Mean 60 m II 4 2 159,440 14,960 9.4 % 5,343,000 534,300 53 5.3·109
120 m I 3 1 171,680 2,760 1.6 % 986,000 98,600 10 9.9·108
18–25 m II 9 4* +++** +++** >10 % – – – –
distance to next maize filed margin in m. Exposure time T includes main maize bloom 11 July to 4 August 2007.* removed before time; **extensive, due to the interference only semi-quantitative data.k = number of cases (samplers) per measuring point.
b) 2008
Distance next maize field
Site Measuring point
Number of cases
Total pollen counts per
sample
Maize pollen per sample
Maize pollen
Flow Deposition
m k Nges n % n/m²T n/m²T n/cm²T n/haT
5 m I 1 1 156,000 18,400 11.8 % 6,571,000 657,100 66 6.6·10910 m V 8 2 494,000 >12,000 2.4 % >2,143,000 >214,300 >21 >2.1·10920 m III 7 2 512,000 18,200 3.6 % 3,250,000 325,000 33 3.3·10925 m I 2 2 243,000 14,400 5.9 % 2,571,000 257,100 26 2.6·10980 m II 4 3 230,000 13,400 5.8 % 1,595,000 159,500 16 1.6·109120 m I 3 3 147,000 5,600 3.8 % 667,000 66,700 7 6.7·108170 m IV 5 3 622,000 10,600 1.7 % 1,262,000 126,200 13 1.3·109250 m IV 6 2 549,000 8,200 1.5 % 1,464,000 146,400 15 1.5·109
Exposure time T includes main maize bloom 11 July to 9 August 08 (exception No. 8 T = 18 July to 9 August 08).distance to next maize filed margin in m.k = number of cases (samplers) per measuring point.

242
123
Umweltwiss Schadst Forsch (2010) 22:229–251
maize pollen in the pellets varied between <0.1 % up to a max-imum of 40 % (colony B) and 24 % (colony A) on July 23rd. The percentage of maize pollen of the overall sample was quite similar in both (2 % and 3 %). In 2008, the percentages (2.7 %) and the total number (167 million) of maize pollen were considerably higher than in 2007 (0.3 %, 1.77 million).
3.3 detection of Bt-maize MON810 by qPCr
The results of the qPCr analysis used for detection of dNA of the transgenic Bt-maize MON810 content in the pollen samples collected by technical and biological samplers are presented in Table 3. DNA of conventional maize as well as
Table 2 Results of the biologi-cal pollen sampling by honey-bee colonies on maize pollen in the pellets 2007 and 2008
a) 2007 Site I (Two bee colonies)
Site II (Two bee colonies)
Site III (Two bee colonies)
Sample Maize Sample Maize Sample Maize
Daily samples of pollen pellets
g % Vol. g % Vol. g % Vol.
20. 7. 2007 1.0 <0.1 % 1.7 1.0 % 6.4 0.5 %23. 7. 2007 8.3 2.5 % 53.1 2.0 % 40.9 0.5 %26. 7. 2007 15.4 1.0 % 31.8 2.8 % 16.2 20.0 %27. 7. 2007 42.0 3.5 % 52.5 1.1 % 16.9 15.0 %30. 7. 2007 1.3 2.0 % 14.8 3.0 % 1.5 5.0 %1. 8. 2007 16.8 1.0 % 67.5 1.0 % 45.7 4.0 %3. 8. 2007 9.1 4.0 % 95.1 <0.1 % 18.9 1.5 %6. 8. 2007 14.1 0.5 % 125.2 0.5 % 23.6 1.0 %8. 8. 2007 26.9 0.5 % 68.8 0.1 % 24.7 0.3 %10. 8. 2007 28.3 <0.1 % 66.7 <0.1 % 30.7 0.3 %13. 8. 2007 13.2 <0.1 % 62.2 0.5 % 34.6 1.0 %
Overall sample 176 g 639 g 260 g Percentage maize pollen (counts)
0.3 % 0.1 % 0.3 %
Total number ofmaize pollen
1,770,000 3,760,000 4,800,000
Estimated amount of maize pollen collected by bees in the season 2007
4,000,000 8,500,000 11,000,000
b) 2008 Bee colony A Bee colony B Total Site I
Sample Maize Sample Maize Sample Maize
Daily samples of pollen pellets
g % Vol. g % Vol. g % Vol.
18. 7. 2008 29 11.0 % 33 25.0 % 62 18.5 %21. 7. 2008 11 4.0 % 9 12.0 % 20 7.6 %23. 7. 2008 39 24.0 % 39 40.0 % 78 32.0 %25. 7. 2008 42 2.0 % 41 0.5 % 83 1.3 %28. 7. 2008 41 0.1 % 40 0.5 % 81 0.3 %30. 7. 2008 16 <0.1 % 8 <0.1 % 24 <0.1 %1. 8. 2008 12 <0.1 % 14 <0.1 % 26 <0.1 %4. 8. 2008 0.4 <0.1 % 1 <0.1 % 1.4 <0.1 %6. 8. 2008 6 <0.1 % 3 <0.1 % 9 <0.1 %8. 8. 2008 10 <0.1 % 10 <0.1 % 20 <0.1 %
Overall sample 206 g 198 g 404 g Percentage maize pollen (counts)
2.0 % 3.0 % 2.7 %
Total number ofmaize pollen
56,000,000 111,000,000 167,000,000
Estimated amount of maize pollen collected by bees in the season 2008
156,000,000 311,000,000 467,000,000

243Umweltwiss Schadst Forsch (2010) 22:229–251
123
of transgenic Bt-maize MON810 was found in all samples of 2007 and 2008. The results were similar between both laboratories.
The results of 2007 show that on average 49 % of the maize pollen collected by honey-bees at sampling site I originated from Bt-maize fields. This corresponds quite well with the percentage (31 %) of transgenic maize pol-len found in atmospheric samples collected by the PMF de-vices at this location. The highest concentrations were not found at the samplers close to the field margin (5 m: 9 %), but at samplers farther away (26 m: 40 %; 120 m: 44 %). This was because the sampling location was adjacent to a conventional maize field but the next Bt-maize fields were located further away and in another direction (see Fig. 1). At site II, 11 % of the maize pollen in honey-bee pellets and 12 % of the maize pollen in the PMF samples originated
from Bt-maize MON810. At this site, maize pollen samples collected near the field margin (20 m) showed a percentage of 7 % Bt-maize, with a value of 16 % at a distance of 60 m. The highest amount of maize pollen in the pellet samples was found at sampling site III. By contrast, the percentage of Bt-maize pollen was quite low (3 %) reflecting that the bees here collected more maize pollen in the surrounding conventional fields. The results of qPCr-analysis of the two subsamples (a, b) of the pollen pellets showed quite similar proportions for all three sites.
The results of the qPCr-analyses of the monitoring in 2008 for site I showed a decrease in the percentages of transgenic pollen for both biological and technical sam-pling. The percentage of Bt-maize MON810 pollen in the pellet samples declined from 49 % in 2007 to 1.9 % in 2008. The values for both samples at site I were pretty
Table 3 results of the qPCr analysis on the percentage of Bt-maize MON810 in the samples of the technical and biological pollen monitoring 2007 and 2008
Quantitative PCR TaqMan %GMO (Bt-MON810) Genetic ID (Europe) AG
Impetus Bioscience
Mean% GMO (Bt-MON810)
Pollen monitoring 2007 Distance to next
maize field
Distance to next
Bt-maize field
Site I Technical samplingPMF Bioaerosol sample
5 m26 m120 m
250 m260 m300 m
12 %41 %42 %
32 % 5 %40 %46 %
30 % 9 %40 %44 %
31 %
Biological samplingHoney-bee colonies Pollen pellets
15 m 260 m 46 %41 %
44 % 59 %49 %
54 % 52 %45 %
49 %
Site II Technical samplingPMF Bioaerosol sample
20 m60 m
700 m750 m
10 %6 %
8 % 5 %26 %
15 % 7 %16 %
12 %
Biological samplingHoney-bee colonies Pollen pellets
30 m 700 m 18 %8 %
13 % 6 %13 %
10 % 12 %11 %
11 %
Site III Biological samplingHoney-bee colonies Pollen pellets
50 m 70 m 4 %2 %
3 % 4 %3 %
3 % 4 %3 %
3 %
Pollen monitoring 2008
Site I Biological samplingHoney-bee colonies Pollen pellets
20 m >800 m 0.8 %3.0 %
1.9 % 1.6 %2.1 %
1.9 % 1.2 %2.5 %
1.9 %
Technical samplingPMF Bioaerosol sample
5–25 m >800 m 10 % 6 % 8 %
Site II Technical samplingPMF Bioaerosol sample
80 m 600 m 17 % 8 % 12 %
Site III Technical samplingPMF Bioaerosol sample
20 m 40 m 49 % 18 % 34 %
Site IV Technical samplingPMF Bioaerosol sample
170–250 m 450 m 23 % 13 % 18 %
Site V Technical samplingPMF Bioaerosol sample
10 m 700 m 14 % 9 % 11 %

244
123
Umweltwiss Schadst Forsch (2010) 22:229–251
close (1.2 %, 2.5 %). A similar result was observed in the bioaerosol samples. The percentage of Bt-maize pollen de-creased from 31 % in 2007 to 8 % in 2008. Comparing both surveys, these findings reflect the greater distance of the samplers to the next Bt-maize field due to the increased buffer zones (100 m in 2007, >250 m in 2008). In 2008, 12 % Bt-maize pollen was found by technical sampling at site II at a distance of 80 m to the next maize field mar-gin, whereas in 2007 the percentage was 16 % at a distance of 60 m. At site IV the percentage of Bt-maize pollen was 18 %. Both sites (site II + IV) were situated closer to the next Bt-maize field and in a different direction to site I,
possibly leading to the higher fraction of GMO pollen. The pollen sample (PMF sampler) at site III contained 34 % Bt-maize MON810 and was located in the proximity of a Bt-maize field. At site V which bordered the nature reserve and was 500 m from a Bt-maize field, 11 % of the maize pollen was transgenic.
4 Discussion
The results of both surveys 2007 and 2008 imply that loads of Bt-maize pollen correlate with distance to Bt-maize fields.
Fig. 4 Maize pollen deposition in relation to distance to next maize field. results of regression analysis including confidence intervals based on field measurement data 2001–2006. The right ordinate illustrates the deposition of maize pollen in the standard unit n/m², the left ordinate in n/cm² (commonly used in feeding stud-ies). The dots symbolize the measurements gained by the field studies from 2001 to 2006 (Hofmann 2007) (Number of observations N = 122), whereas the triangles (2007) and rectangles (2008) reflect the results of the surveys conducted in the nature reserve ruhlsdorfer Bruch. The solid line in the centre of the diagram illustrates the regression line for the relation of deposition to distance to the next maize field based on the reference data 2001–2006 (dots) (log maize pollen deposition in n/m², log distance in m, linear regression function: Y’ = –0.548 X’ + 6.082; r² = 0.58; p < 0.001). The next dotted lines indicate the 95 %-confidence interval for the mean regression line. The 95 % confidence intervals (both sides) for single cases and the upper 80 % confidence interval are expressed by consecutive lines. The upper boundary of the 80 % CI denotes the 90 % probability for excluding higher values. The correlation between distance to the source field and deposition rate is strong (r = 0.58) and highly significant (p < 0.001)

245Umweltwiss Schadst Forsch (2010) 22:229–251
123
Thus, a distinct reduction of exposure can be achieved by increasing distances from the source field. We found that the larger the distance between pollen samplers and source fields (250 m, 500 m in 2008 compared to 100 m in 2007) the lower was the percentage of Bt-maize pollen. But even with a buffer of 500 m, we found samples collected in the nature reserve area with percentages of up to 18 % Bt-maize pollen. Hence, greater distances than 500 m are necessary to assure sufficiently low Bt-maize concentrations in order to prevent relevant exposure of NTOs to Bt-maize pollen.
The deposition rates of maize pollen detected in this study can be compared to other field studies summarised by Hofmann (2007). The studies were conducted from 2001 till 2006 applying the same standardised sampling methods ac-cording to the VDI-guideline 4330 part 3 (2007) on a wide variety of sites all over Germany and parts of Switzerland. For the first time, this led to comparative datasets collected under regular cultivation conditions that take account of varying source field sizes, wind conditions, agricultural pat-terns, and cultivation periods. Figure 4 illustrates the results of the statistical analysis (see Sect. 2.2.5) and depicts the deposition of maize pollen (logarithmic y-axis) that can
be expected when varying the distance to the source field (logarithmic x-axis). The relation between maize pollen deposition and distance to the next maize field fitted best to a power function leading to a linear regression function in the log-log graph. The measurements cover distances from 0.3 m (distance to the next maize plant in the source field) to 3,300 m (distance to the next maize field margin). The ex-pected values for the deposition of maize pollen calculated by the regression equation in dependence on the respective distance are listed in Table 4.
Our results demonstrate that maize pollen deposition rates measured at the Ruhlsdorfer Bruch in 2007 and 2008 show the same trend as the regression derived from previous studies (see Fig. 4). Though, the deposition values of maize pollen in the Ruhlsdorfer Bruch were above average. This might be due to the size (>10 ha) and amount of maize fields in the vicinity of the conservation area, its relative location (predominantly lee-sided), local topographic and weather conditions (warm and sunny, thermal updrafts), and the in-tensity of the maize bloom in 2007 and 2008.
The risk assessment of Monsanto considering the delib-erate release of Bt-maize was based on the presumption that
Table 4 Statistical results of the linear regression analysis of maize pollen deposition versus distance to next maize field. database: 122 sites from various regions in the years 2001–2007 subject to normal growing conditions (Hofmann 2007) (CI: confidence interval for single values; values rounded to 2 significant digits; a) unit: maize pollen/m², b) unit: maize pollen/cm²)
a)
Distance to next maize field [m]
Expected maize pollen deposition [maize pollen/m2]
Mean CI 99 % CI 95 % CI 90 % CI 80 %
Inside field 2,300,000 130,000–40,900,000 270,000–20,400,000 380,000–14,300,000 570,000–9,600,0001 m 1,200,000 70,000–20,700,000 140,000–10,400,000 200,000–7,300,000 300,000–4,900,00010 m 350,000 21,000–5,800,000 41,000–2,900,000 58,000–2,100,000 87,000–1,400,000100 m 97,000 5,800–1,600,000 12,000–820,000 16,000–580,000 24,000–390,000200 m 67,000 4,000–1,100,000 7,900–560,000 11,000–400,000 17,000–270,000300 m 53,000 3,200–900,000 6,300–450,000 8,900–320,000 13,000–210,000500 m 40,000 2,400–680,000 4,700–340,000 6,700–240,000 10,000–160,0001,000 m 28,000 1,600–470,000 3,200–240,000 4,600–170,000 6,800–110,0002,000 m 19,000 1,100–330,000 2,200–160,000 3,100–110,000 4,600–77,000
b)
Distance to next maize field [m]
b) Expected maize pollen deposition (maize pollen/cm2)
Mean CI 99 % CI 95 % CI 90 % CI 80 %
Inside field 230 13–4,090 27–2,040 38–1,430 57–9601 m 120 7.0–2,070 14–1,040 20–730 30–49010 m 35 2.1–580 4.1–290 5.8–210 8.7–140100 m 9.7 0.58–160 1.2–82 1.6–58 2.4–39200 m 6.7 0.40–110 0.79–56 1.1–40 1.7–27300 m 5.3 0.32–90 0.63–45 0.89–32 1.3–21500 m 4.0 0.24–68 0.47–34 0.67–24 1.0–161,000 m 2.8 0.16–47 0.32–24 0.46–17 0.68–112,000 m 1.9 0.11–33 0.22–16 0.31–11 0.46–7.7

246
123
Umweltwiss Schadst Forsch (2010) 22:229–251
only few pollen grains of maize settle in distances of greater than a few meters from the source field. Hence, no relevant exposure would be expected causing any adverse effects in the environment. In contrast to this, our results demonstrat-ed that this assumption is not tenable. A lot of maize pollen is transported farther than 100 m and exposure of NTOs has to be expected. Several authors give evidence that the false estimate regarding long-distance transport is actually based on insufficient measurements and wrong assumptions for dispersal modelling (Aylor et al. 2003; Boehm et al. 2006; Hofmann et al. 2005; Jarosz et al. 2003, 2004; Kawashima et al. 2005; Loos et al. 2003; Yamamura 2004). In particular, factors like the effect of atmospheric turbulence induced by high temperatures in summer, interactions of meteorologi-cal conditions and sedimentation velocity of maize pollen and of complex field arrangements were underestimated and recent studies have revised these assumptions (Boehm et al. 2006; Hofmann et al. 2009b; Palacios et al. 2007). The important role of atmospheric conditions like thermal con-vection corresponds with similar findings on long-distance transport of other pollen species (Franzen et al. 1994; Hel-big et al. 2004; Rousseau et al. 2006).
regarding the precautionary principle, ecological risks have to be excluded by a given certainty (Klöpffer 2001; Mayer and Stirling 2002; Recuerda 2006; Steinhäuser 2001; Sunstein 2005). Hence, when defining isolation distances between Bt-maize cultivation and nature reserve areas, the occurring variation has to be taken into account. The protec-tion has to be assured for nature reserves receiving higher pollen loads than the average, too (for example, if they are located downwind of a Bt-maize field). Therefore, the up-per confidence boundary for single cases (see Fig. 4 and Table 4) is relevant. As a suggestion, the 80 %-confidence interval may be used giving a security level for 90 % of all cases (80 % of the cases are expected to be between the up-per and lower boundary, 10 % of the remaining 20 % are higher than the upper boundary).
Honey bees are also useful indicators for the exposure of pollen-collecting NTOs heading for food in the neigh-bouring maize fields outside the protected area. The results confirm that bees serve as active collectors of maize pollen and are therefore an appropriate indicator for monitoring of GMO. In contrast to technical devices showing an intrinsic relationship between distance to the source field and deposi-tion rate in dependence on wind conditions, the relationship has been found to be sigmoid (S-shaped) to distance con-sidering honey-bees serving as biological pollen samplers. Hofmann et al. (2005) showed that the probability of finding transgenic oil seed rape pollen in honey samples was above 90 % for a bee colony separated by up to 500 m from the GMO field, 80 % for 2 km, and still 50 % for a distance of 2.7 km. This corresponds with the foraging ranges of bees defined by Seeley (1985) who determines the primary col-
lection range up to 500 m, the secondary or economic range at 2 to 4 km, and the tertiary with a representation less than 5 % at 6 to 8 km. The results of this study give clear evidence that honey-bees being NTOs as well collect maize pollen and Bt-maize pollen, too. At sampling site I, located at least 260 m east of the next Bt-maize field in 2007, almost half of the collected maize pollen originated from Bt-maize plants. At sampling site II, located east of site I, the percentage of Bt-maize pollen was 11 %. In 2008, when the distance of the measuring point at site I to the next Bt-maize field was in-creased to approximately 800 m, the percentage of Bt-maize pollen decreased to 1.9 %. These findings at the ruhlsdorfer Bruch give evidence for the necessity to consider exposure of foraging NTOs (e. g., bees, wild bees, bumble bees, flies, wasps etc.) when defining buffer zones for GMO cultiva-tion. The sigmoid shape of the distance relation states clearly that any distances below 500 m are ineffective and distances greater than 1,000 m should be recommended.
The impairment of particularly protected species and habitats is of special importance when thinking of either international or European regulations (NATUrA 2000). So far, in Germany the legal implications of GMO cultivation are considered rather insufficiently by only applying § 34a of the Federal Nature Protection Law. In general, the BVL (The Federal Office of Consumer Protection and Food Safe-ty) stipulates an environmental impact assessment (EIA) to be conducted for approval of release experiments within a distance of less than 1,000 m to a FFH area.
In addition to this, the GenTPflEV (Verordnung über die gute fachliche Praxis bei der Erzeugung gentechnisch veränderter Pflanzen-regulation regarding the best technical standard during the production of GMO plants) was passed in 2008, taking into account some of the uncertainty when prescribing isolation distances for Bt-maize cultivation. It aimed at the regulation of co-existence between farmers in terms of liability issues, for example, in case of damage due to outcrossing from Bt-maize fields. In contrast, damage to the natural environment may not be reversible and cannot be compensated simply by means of money, therefore higher safety measures are needed for protecting nature reserves which implies improved distance regulations. This should be considered when defining adequate criteria to assess ad-verse effects on NTOs due to GMO cultivation (Schröder and Hofmann 2008).
Some recent studies as well as new technical devices and standards may help to obtain a better understanding of exposure and effects of Bt-maize from an ecological point of view (Aylor et al. 2003; Hofmann et al. 2005; Kawashi-ma et al. 2005; Marquard and durka 2005; Obrycki et al. 2001). From the scientific view point, effects are princi-pally related to the amount of exposure and pollen. despite this fact, exposure of NTOs was not regarded adequately in the EIA (Marquard and durka 2005). Furthermore, the

247Umweltwiss Schadst Forsch (2010) 22:229–251
123
risk assessment so far has been focussed only on the effect level on those NTOs living within the target maize fields. The presumption that tests should concentrate on the tar-get fields as areas of highest doses, is not plausible from an ecotoxicological point of view, since it cannot be expected that these are primary habitats for more sensitive species. Consequently, risk assessment should be complemented by investigations of exposure and ecotoxicological effects on NTOs that occur beyond GMO fields as well as of sensi-tive environmental systems nearby. The assessment has to consider differences in toxicological sensitivity depending on species and individual variety (Cannon 2001). So far, feeding tests in the laboratory have shown that caterpillars of some butterfly species are harmed when feeding on Bt-maize (Bt-176, Bt-11, Mon810) pollen (dively et al. 2004; Felke and Langenbruch 2005; Vogel 2005). Although leg-islation stipulates a GMO-specific risk assessment, there is still a lack of reliable data on MON810 considering trans-gene expression and toxin concentration in pollen. Addition-ally, scientific-based dose–effect relationships and threshold limit values based on NOEL (no observed effect level) are missing. Lang and Otto (2010) reviewed the literature on Bt-maize effects on Lepidoptera and concluded even the basic level of hazard characterisation is as yet incomplete. For example, feeding experiments that lacked direct meas-urements on concentrations of Bt-toxin in pollen and relied on literature values only, even though the traits are known to have a great variation (Nguyen and Jehle 2007). Further-more, only the deposited pollen per cm² are documented but not the amount of pollen being ingested by larvae. These are systematic deficiencies which, in consequence, do not allow the definition of an effective dose implying that the experi-ments are scientifically inadequate and misleading. In some literature, findings from other traits like Bt-176 were drawn, even though it is stipulated by law that the EIA of GMO should be trait specific.
Hence, broader buffer zones should be introduced to protect NTOs like butterflies. According to Felke and Lan-genbruch (2005), a dose even fewer than five maize pollen of Bt-176 killed caterpillars and even single pollen caused behavioural disorders, the NOEL was less than one pollen. In general, the Bt-toxin content of MON810 is described to be lower, although a high variation was found and has to be considered, especially for pollen (Nguyen and Jehle 2007). recently, in the case of Bt-MON810 ecotoxicologically rel-evant adverse effects of the Bt-toxin to NTOs were shown for various organisms besides Lepidoptera: Rosi-Marshall et al. (2007) demonstrated that by-products containing Bt-toxins were dispersed beyond the source fields and depos-ited into aquatic ecosystems. The toxins drifted within water streams for long distances causing exposure to NTOs. They showed, too, negative toxic effects on two non-target stream insects (caddisflies). douville et al. (2007) found that the
Cry1Ab gene has been drained into freshwater ecosystems, persisting and being transported for longer distances as well. An accumulation of the transgene DNA in freshwater mussels and DNA-replication was also demonstrated. They discussed the role of bacterial uptake of the transgene DNA and expression by them, so the question of horizontal gene transfer was raised. Bohn et al. (2008) showed toxic effects of the Bt-toxin to daphnia, which corresponds to a classic ecotoxicological routine test. These results when combined are important and they caused concern within the scientific community. On the other hand, the aquatic ecosystem was dropped as an issue by Monsanto when carrying out the EIA in Germany. Their actual monitoring plan offered to the German authorities also neglects this matter. The same goes for the scientific opinion as announced by EFSA (2009).
For precautionary reasons, Felke and Langenbruch (2005) recommended an isolation distance of 1,000 m for Bt-maize cultivation in consideration of nature reserves where Lepidopterans are found that were not assessed by respective toxicity tests. This is the case for the ruhlsdor-fer Bruch. Considering a buffer zone of 1,000 m the maize pollen deposition will not exceed 100,000 maize pollen/m² (10/cm²) with a probability of 90 % according to the results of the statistical analysis (see Fig. 4 and Table 4). There is no certainty that this exposure would not cause any definite adverse effects. However, this isolation distance reflects a feasible regulation measure that could be monitored under field conditions by technical means and be adjusted in case of new scientific findings. As described by Schmidt and Schröder (2009) an isolation distance of 1,000 m would still allow GMO cultivation at 88 % of the total cropland in Ger-many. Considering land use management tools and the dis-tribution of target organisms the restrictions for GMO culti-vation would be negligible. Accordingly, the recommended buffer zones reflect a compromise between legal necessities and economically feasible regulations considering the pro-motion of GMO cultivation and nature conservation.
5 Conclusions
The results of this investigation demonstrated an entry of Bt-maize pollen into the FFH Ruhlsdorfer Bruch under the cultivation and weather conditions for both years 2007 and 2008. At each of the sampling sites transgenic Bt-maize pollen MON810 was detected by technical aerosol sam-pling and DNA-analysis. The collection of pollen pellets by honey-bees confirmed that the foraging ranges of the bees are extensive and not restricted to the FFH-area. Pollen from technical as well as from biological samplers showed comparable high proportions of transgenic pollen in 2007. Hence, an isolation distance of 100 m between Bt-maize fields and conservation areas was obviously too small to

248
123
Umweltwiss Schadst Forsch (2010) 22:229–251
prevent butterflies and other NTOs from exposure and relat-ed adverse effects of Bt-maize cultivation in the Ruhlsdor-fer Bruch. In 2008, when the buffer zone was increased to 250 m in the north-eastern and to 500 m in the north-western part, the percentage of Bt-maize pollen in the bee pellets and in the bioaerosol samples was reduced.
The study demonstrates that Bt-maize pollen is dispersed much farther than presumed in the EIA that defined the min-imum distances for the cultivation of Bt-maize MON810 according to German Law. The field experiments demon-strated deposition of maize pollen far beyond the field mar-gins with a long-extending tail leading to much higher ex-posure values than previously assumed.
Furthermore, this study provides data on defining ade-quate buffer zones for conservation areas. While co-exist-ence in terms of farming is regulated by isolation distances of 150 m between Bt-maize and conventional fields and 300 m between Bt-maize and organic fields, no appropri-ate measures have been established for the protection of the natural environment up to now. Extensive cultivation of GMOs would affect numerous conservation areas and protected species living there. This is of special importance considering a particularly hazardous exposure during the summer season when protected NTOs are at a sensitive de-velopmental stage. In Germany, the regional environmen-tal authorities (Untere Naturschutzbehörden) of the differ-ent states are responsible for protection of nature reserves. Hence respective cases were treated separately leading to an unequal handling and discontinuity. Furthermore, this un-dermines the legal goals of sustainable nature conservation (Klöpffer 2001; Marabelli 2005; Steinhäuser 2001). Thus, due to missing general regulation, the cases do regularly end up in front of the court. Hence, in compliance with agri-culture, comparable regulations are needed for conservation areas, as well. This implies a better coordination of the Ger-man Genetic Engineering Act with the Nature Protection Law (Winter 2007a, 2007b).
6 Recommendations and perspectives
Considering cultivation of Bt-maize, the results of the pollen monitoring in the FHH Ruhlsdorfer Bruch in 2007 gave reason to introduce isolation distances of 800 m around nature reserves housing protected butterfly species in the federal state of Brandenburg. In 2008, exceptions to these regulations were granted due to the late release of that order. For the FFH ruhlsdorfer Bruch, the minimum distance between Bt-maize fields and the FFH area in 2008 was 250 m compared to 100 m in 2007. The results of the pollen monitoring in 2008 corroborated that even isolation distances of 500 m were not sufficient to reduce deposition rates to an acceptable level. According to the results of
the maize pollen monitoring study, a minimum isolation distance of 1,000 m was recommended to prevent NTOs from unwanted effects caused by Bt-maize pollen expo-sure. New scientific studies give reason that the Bt-maize toxin affects not only Lepidopterae but other species, too, for example aquatic organisms, questioning the specificity of the toxin as claimed by the producer (Bohn et al. 2008; Douville et al. 2007; Pilcher et al. 2005; Rosi-Marshall et al. 2007; Schmidt et al. 2009). Additionally, there is an-other NTO species (Nymphula nymphaeata) living in lakes and small rivers of Germany, which is a close relative of the corn borer and this species was not taken into account when Monsanto drew up the EIA.
In consequence, a further Environmental Impact Assess-ment is needed, conducted according to Winter (2007b). From the results at hand and related studies, it becomes clear that adequate isolation distances between Bt-maize fields and protected areas have to be introduced. In order to comply with the effect terms defined in the German Federal Immission Protection Law (BImSchG) and the precautio-nary principle, buffer zones for Bt-maize cultivation have to be considered at high safety levels, and distances in the range of 1,000 m are recommended. Such a buffer distance would ensure that pollen deposition of more than 100,000 maize pollen/m² might be prevented with a certainty of at least 90 % for any point in a nature reserve. This value may serve as a threshold limit for maize pollen deposition that should not be exceeded at any selected measurement point within the reserve. The pollen deposition should be monitored regularly using the same standardised method (PMF sampler) at representative locations including sites of expected maximal depositions, particularly at exposed sites and at the boundaries of protected areas to adjacent Bt-maize fields. The advantage of setting limits to control risks of exposure level is useful because these can be monitored contemporarily and in a standardised and reproducible way. This would allow for safety distances to be adjusted which is not possible using only methods based on the effect le-vel. Therefore, other fields of environmental control have successfully based their strategy on measures to reduce and control exposure (Federal Immission Protection Law).
For an efficient regulation of GMO cultivation and na-ture conservation, the precautionary principle that has been laid down by law is obligatory. This implies the necessity of predictive safety measures for the regulation of GMO cul-tivation before sowing as well as ecological monitoring of the induced exposure and effects afterwards. Hence, a com-bination of modelling and measurements is required (Hof-mann et al. 2005; Schmidt and Schröder 2008; Schröder and Hofmann 2008). Tracking the location and acreage of con-ventional and transgenic maize fields is essential (Marvier et al. 2008). Thus, precise data should be published in the German GMO location register. The relevant details on cul-

249Umweltwiss Schadst Forsch (2010) 22:229–251
123
tivation and sowing time in a buffer of at least 2 km around nature conservation areas should be documented, obligato-rily. Maize pollen release, dispersal and exposure should be modelled and monitored on a routine level and the course of the pollen emission should be measured at some regional reference sites, too, because of the high variation of pol-len dispersal (Hofmann et al. 2009b). Apart from one loca-tion in Lower Saxony, no other pollen monitoring sites have been installed in rural environments in Germany, yet.2
Furthermore, it is advisable to investigate some species-specific parameters in order to gain a (bio-)ecological impact assessment for NTOs. There is a great lack of data on the variation in maize pollen deposition rates at specific forage plants; the evaluation of the exposure to aquatic systems, and the long-term effects on NTOs have not been investi-gated, so far. Although the latter aspects on effect monitor-ing may not be appropriate as an early-warning system, they may be useful tools for post-control issues. Monitoring for regulatory purposes should combine maize pollen dispersal models with threshold limits and control measurements of deposition. For many air pollutants this is common practise and was shown to be an effective tool (e. g. AUSTAL 2000, Janicke and Janicke 2007). In order to achieve this, the dis-persal model and its parameters have to be adapted to the specific requirements of maize pollen dispersal (Aylor et al. 2003; Boehm et al. 2006; Hofmann 2007; Hofmann et al. 2009b; Jarosz et al. 2004; Kawashima et al. 2005).
An ecotoxicological assessment of Bt-maize MON810 is still lacking in fundamental data on dose–response relation-ships with receiving NTOs, especially relevant in respect to NOEL for setting safety limits. This includes not only lethal or direct toxic effects, but also other adverse effects like behav-ioural disorders (e. g., movement patterns, feeding behaviour). Furthermore, the whole aquatic ecosystem has been neglected in the EIA, whereas new results showed impacts here and gave reason for serious concern (Bohn et al. 2008; Douville et al. 2007; Rosi-Marshall et al. 2007). Such investigations are far beyond case-specific monitoring and should be conducted prior to approval of a deliberate release of the respective GMO according to a step-by-step risk assessment. This is not the case yet, and generally – considering the approval for Bt-maize – risk-benefit analyses are missing (Winter 2007a, p. 578).
This investigation gave reason to extend the buffer zones for sensitive nature reserve areas from 100 m (2007) to 800 m in 2009 for the whole federal state of Brandenburg. This regulation was a compromise between the governmen-tal authorities and the farmers. The current isolation distanc-es are less than recommended. Nevertheless, at the national level the application of this compromise would permit long-term planning for all stakeholders.
2 Stiftung deutscher Polleninformationsdienst PId, http://www.pol-lenstiftung.de/images/h0_pollenmessstellen.gif.
Acknowledgement The studies were performed by order of the Min-istry of Agriculture, Environment and Consumers Production and the Environmental Agency (LUA) of the state Brandenburg. The au-thors grateful acknowledge the support of dr. H. Kretschmer, dr. P. rudolph, dipl. Agr.-Ing. J. Peil, dipl.-Biol. J. Trakat, Mrs. dybeck and Mr. Lorenzen, Prof. dr. M. Finck, dr. M. Kruse-Plass, Mrs. S. O`Brien, dr. E. rosi-Marshall, the local bee-keeper Mr. J. Succow and the families Ewald and dahlke from ruhlsdorf.
References
Aylor dE (2002) Settling speed of corn (Zea mays) pollen. J Aerosol Sci 33:1599–1605
Aylor dE, Schultes NP, Shields EJ (2003) An aerobiological frame-work for assessing cross-pollination in maize. Agricult Forest Meteorol 119:111–129
Beismann H, Finck M, Seitz H (2007) Standardisation of methods for GMO Monitoring on a European level. J Verbr Lebensm 2(1):76–78
Beismann H, Kuhlmann M (2006) raumrepräsentativität technischer Pollensammler für ein Langzeitmonitoring von gentechnisch veränderten Pflanzen (GVP). BfN-Skripten 169, Bonn. http://www.bfn.de/fileadmin/MdB/documents/skript169.pdf. Accessed 21. 4. 2010
Boehm MT, Aylor dE, Shields EJ (2006) Maize pollen dispersal under convective conditions. J Appl Meteorol Climatol 45(7):1003
Bøhn T, Primicerio r, Hessen dO, Traavik T (2008) reduced fitness of Daphnia magna fed a Bt-transgenic maize variety. Archives of Environmental toxicology and chemistry 55(4):584–592
Brunet Y, dupont S (2009) Mesoscale dispersal of maize pollen and implications for gene flow. Co-Extra report 1419
Brunet Y, dupont S, delage S, Tulet P, Pinty JP, Lac C, Escobar J (2008) Atmospheric modelling of maize pollen dispersal at re-gional scale. Presentation at GMLS 2008, Bremen. http://www.gmls.eu. Accessed 21. 4. 2010
BVL 2008: Erläuterungen zu den dateien des Monsanto MON810 Monitoring und Implementierungsplan. http://www.bvl.bund.de/dE/08__PresseInfothek/00__doks__downloads/Monitoringplan,templateId=raw,property=publicationFile.pdf/Monitoringplan.pdf. Accessed 21. 4. 2010
Cannon rJC (2000) Bt transgenic crops: risks and benefits. Integr Pest Manag 5:151–173
Clark EA (2006) Environmental risks of genetic engineering. Euphyti-ca 148:47–60
Craig W, Tepfer M, degrasi G, ripandelli (2008) An overview of gen-eral features of risk assessments of genetically modified crops. Euphytica 164:853–880
CRL (Community Reference Laboratory) (2009) Status of dossiers. Validated method (MON 810). http://gmo-crl.jrc.ec.europa.eu/statusofdoss.htm. Accessed 14 Mar 2006
devos Y, reheul d, de Schrijver A (2005) The co-existence between transgenic and non-transgenic maize in the European Union: a focus on pollen flow and cross-fertilization. Environ Biosafety Res 4:71–87
dively GP, rose r, Sears MK, Hellmich rL, Stanley-Horn dE, Calvin dd, russo JM, Anderson PL (2004) Effects on monarch butter-fly larvae (Lepitoptera: Danaidae) after continuous exposure to Cry1Ab expressing corn during anthesis. Environ Entomol 33:116–1125
douville M, Gagné F, Blaise C, André C (2007) Occurrence and per-sistence of Bacillus thuringiensis (Bt) and transgenic Bt corn cry1Ab gene from an aquatic environment. Ecotoxicol Environ Safety 66:195–203
Emberlin J (1999) A report on the dispersal of Maize pollen. research paper. National Pollen research Unit, University College Worces-

250
123
Umweltwiss Schadst Forsch (2010) 22:229–251
ter. http://www.mindfully.org/GE/dispersal-Maize-Pollen-UK.htm. Accessed 21. 4. 2010
EFSA (2009) Scientific opinion – Applications (EFSA-GMO-rX-MON810) for renewal of authorisation for the continued mar-keting of (1) existing food and food ingredients produced from genetically modified insect resistant maize MON810; (2) feed consisting of and/or containing maize MON810, including the use of seed for cultivation; and of (3) food and feed additives, and feed materials produced from maize MON810, all under regula-tion (EC) No 1829/2003 from Monsanto. EFSA J 1149:1–85
Felke M, Langenbruch GA (2005) Auswirkungen des Pollens von transgenem Bt-Mais auf ausgewählte Schmetterlingslarven. BfN-Skripten 157, Bonn, 143pp. http://www.bfn.de/fileadmin/MDB/documents/skript157.pdf. Accessed 21. 4. 2010
Franzen LG, Hjelmroos M, Kallberg P, Brorstromlunden E, Juntto S, Savolainen AL (1994) The yellow-snow episode of Northern Fen-noscandia, March 1991. A case-study of long-distance transport of soil, pollen and stable organic-compounds. Atmos Environ 28:3587–3604
Gathmann A, Wirooks L, Hothorn LA, Bartsch d, Schuphan I (2006) Impact of Bt maize pollen (MON810) on lepidopteran larvae liv-ing on accompanying weeds. Mol Ecol 15:2677–2685
GenTPflEV (2008) Verordnung über die gute fachliche Praxis bei der Erzeugung gentechnisch veränderter Pflanzen (Gentechnik-Pflanzenerzeugungsverordnung, BGBl. I, 655 pp
Gurian-Sherman D (2006) Contaminating the Wild? Gene Flow from Experimental Field Trials of Genetically Engineered Crops to Related Wild Plants. Center for Food Safety. http://www.center-forfoodsafety.org/pubs/Contaminating_the_Wild_Report.pdf. Accessed 21. 4. 2010
Helbig N, Vogel B, Vogel H, Fiedler F (2004) Numerical modelling of pollen dispersion on the regional scale. Aerobiologia 3:3–19
Hofmann F (2007) Kurzgutachten zur Abschätzung der Maispollend-eposition in relation zur Entfernung von Maispollenquellen mittels technischem Pollensammler PMF. BfN, Bonn. http://www.bfn.de//fileadmin/MDB/documents/themen/agrogentechnik/07-05-31_Gutachten_Pollendeposition_end.pdf. Accessed 21. 4. 2010
Hofmann F, Epp r, Kalchschmid A, Kruse L, Kuhn U, Maisch B, Müller E, Ober S, radtke J, Schlechtriemen U, Schmidt G, Schröder W, von der Ohe W, Vögel r, Wedl N, Wosniok W (2008) GVO-Pollenmonitoring zum Bt-Maisanbau im Bereich des NSG/FFH-Schutzgebietes Ruhlsdorfer Bruch. Umweltwiss Schadst Forsch 20(4):275–289
Hofmann F, Schlechtriemen U, Kuhn U, von der Ohe W, von der Ohe K, Kruse L, Epp r, Müller E, Kalchschmid A, Wachter r, Vögel r (2009a) durchführung eines Pollenmonitorings an Kulturmais in FFH-Lebensräume – Projektbericht 2008 – Fachbeiträge des Landesumweltamtes Brandenburg, Heft 110, Potsdam. http://www.mluv.brandenburg.de/cms/media.php/2320/fb_110.pdf. Accessed 21. 4. 2010
Hofmann F, Janicke U, Janicke L, Wachter r (2009b) Modellrechnungen zur Ausbreitung von Maispollen in Bezug auf den Einfluss einzel-ner Maisfelder im Hinblick auf Sicherheitsabstände bei Freiset-zungsversuchen unter worst-case-Annahmen mit Vergleich zu Frei-landmessdaten des PMF. Gutachten im Auftrag des Bundesamtes für Naturschutz (BfN), Bonn. http://www.bfn.de/fileadmin/MDB/documents/service/Hofmann_et_al_2009_Maispollen_WorstCase_Modell.pdf. Accessed 21. 4. 2010
Hofmann F, Schlechtriemen U, Wosniok W, Foth M (2005) GVO-Pollenmonitoring. Technische und biologische Pollenakkumula-toren und PCR-Screening für ein Monitoring von gentechnisch veränderten Organismen. BfN-Skripten 139, Bonn, 275 pp. http://www.bfn.de/fileadmin/MDB/documents/skript139.pdf. Accessed 21. 4. 2010
Hout r van, Chamecki M, Brush G, Katz J, Parlange MB (2008) The influence of local meteorological conditions on the circadian
rhythm of corn (Zea mays L.) pollen emission. Agric For Mete-orol 148:1078–1092
Janicke U, Janicke L (2007) Lagrangian particle modeling for regula-tory purposes: A survey of recent developments in Germany. Pro-ceedings of the 11th International Conference on Harmonization within Atmospheric Dispersion Modeling for Regulatory Pur-poses, 2–5 July 2007, Cambridge, England. http://www. harmo. org/ Conferences/ Proceedings/ _Cambridge/ published Sections/ Op109-113.pdf. Accessed 21. 4. 2010
Jarosz N, Loubet B, durand B, McCartney HA, Foueillassar X, Huber L (2003) Field measurements of airborne concentration and depo-sition rate of maize pollen. Agric For Meteorol 119:37–51
Jarosz N, Loubet B, Huber L (2004) Modelling airborne concentration and deposition rate of maize pollen. Atmos Environ 38:5555–5566
Jarosz N, Loubet B, durand B, Foueillassar X, Huber L (2005) Vari-ations in maize pollen emission and deposition in relation to mi-croclimate. Environ Sci Technol 39:4377–4384
Kawashima S, Matsuo K, du M, Takahashi Y, Inoue S, Yonemura S (2005) An algorithm for estimating potential deposition of corn pollen for environmental assessment. Environ Biosaf res 3:197–207
Klöpffer W (2001) Kriterien für eine ökologisch nachhaltige Stoff- und Gentechnikpolitik. Umweltwiss Schadstoff Forsch 13:159–164
Kulikov AM (2005) Genetically modified organisms and risks of their introduction. Russ J Plant Phyiol 52:99–111
Lang A, Ludy C, Vojtech E (2004) dispersion and deposition of Bt maize pollen in field margins. J Plant disease Prot 111(5):417–428
Lang A, Otto M (2010): A synthesis of laboratory and field studies on the effects of transgenic Bacillus thuringiensis (Bt) maize on non-target Lepidoptera. Entomol Exp Appl 1–14 (in press)
Loos C, Seppelt r, Meier-Bethke S, Schiemann J, richter O (2003) Spatially explicit modelling of transgenic maize pollen dispersal and cross pollination. J Theor Biol 225 (2):241–255
Lorch A, Then C (2007) How much Bt toxin do genetically engineered MON810 maize plants actually produce? Bt concentration in field plants from Germany and Spain. Greenpeace report 5/2007. http://www.ifrik.org/files-ifrik/Greenpeace_Btcontent_2007.pdf. Accessed 21. 4. 2010
Losey JE, rayor LS, Carter ME (1999) Transgenic pollen harms mon-arch larvae. Nature 399:214
Marabelli r (2005) Aspects connected with enforcement of the EU provisions on genetically modified organisms. Vet res Commun 29(2):19–26
Marvier M, Carriere Y, Ellstrand N, Gepts P, Kareiva P, rosi-Marshall EJ, Tabashnik B, Wolfenbarger LL (2008) Harvesting data from USA’s grand experiment with genetically engineered crops. Sci-ence 320:452–453
Mayer S, Strirling A (2002) Finding a precautionary approach to tech-nological developments – lessons for the evaluation of GM crops. J Agric Environ Ethics 15:57–71
Marquard E, durka W (2005) Auswirkungen des Anbaus gentechnisch veränderter Pfanzen auf Umwelt und Gesundheit: Potentielle Schäden und Monitoring. Umweltforschungszentrum Leipzig-Halle GmbH, im Auftrag des Sächsischen Staatsministeriums für Umwelt und Landwirtschaft. http://www.keine-gentechnik.de/bibliothek/naturschutz/studien/ufz_leipzig_schaeden_monitor-ing_051201.pdf. Accessed 21. 4. 2010
Mertens M, Schimpf M (2006) Fachgutachten zur Koexistenzproble-matik – gentechnisch veränderte Maislinie MON 810. Bundestags-fraktion Bündnis 90/Die Grünen. http://www.ulrike-hoefken.de/cms/default/dokbin/159/159916.gutachten_koexistenzprobleme_von_mon810.pdf. Accessed 21. 4. 2010
Monsanto (2004) A recommended procedure for real-time quantitative TaqMan PCr for YieldGard corn borer corn, MON 810. Mon-santo Company
251Umweltwiss Schadst Forsch (2010) 22:229–251
123
251Umweltwiss Schadst Forsch (2010) 22:229–251
123
Nguyen HT, Jehle JA (2007) Quantitative Analyse der saisonalen und gewebespezifischen Expression von Cry1Ab in transgenen Mon810- Mais. J Plant Dis Prot 114(2):82–87
Ober S, Hofmann F, Epp r, Kalchschmid A, Kruse L, Kuhn U, Müller E, radtke J, Schlechtriemen U, von der Ohe K, von der Ohe W, Vögel r, Wedl N (2008) durchführung eines Pollenmonitorings von Mais im Naturschutzgebiet Ruhlsdorfer Bruch. Fachbeiträge des Landesumweltamtes Brandenburg, Heft 109. http://www.mluv.brandenburg.de/cms/media.php/2320/fb_109.pdf. Accessed 21. 4. 2010
Obrycki JJ, Losey JE, Taylor Or, Jesse LCH (2001) Transgenic insec-ticidal corn: beyond insecticidal toxicity to ecological complex-ity. BioScience 51:353–361
Oke Tr (1987) Boundary layer climates. University Press, CambridgePalacios IS, Molina rT, rodriguez AFM (2007) The importance of
interactions between meteorological conditions when interpret-ing their effect on the dispersal of pollen from homogeneously distributed sources. Aerobiologia 23:17–26
Perry JN, devos Y, Arpaia S, Bartsch d, Gathmann A, Hails rS, Kiss J, Lheureux K, Manachini B, Mestdagh S, Neemann G, Ortego F, Schiemann J, Sweet JB (2010) A mathematical model of exposure of nontarget Lepidoptera to Bt-maize pollen expressing Cry1Ab within Europe. Proc r Soc B 1–9
Pilcher Cd, rice ME, Obrycki JJ (2005) Impact of Transgenic Bacil-lus thuringiensis Corn and Crop Phenology on Five Nontarget Arthropods. Environ Entomol 34:1302–1316
recuerda Girela MA (2006) risk and reason in the European Union Law. European Food and Feed Law review 5
reuter H, Breckling B, Wurbs A, Höltl K (2008a) Modelling maize cross-pollination probabilities on the regional level – exemplary simulations for the county Elbe Elster in Brandenburg, Germany. In: Breckling B, reuter H, Verhoeven r: Implications of GM-Crop Cultivation at Large Spatial Scales. Proceedings of the GMLS conference 2008 in Bremen, vol 14, Theorie in der Ökolo-gie. Peter Lang, Frankfurt, pp 54–58
reuter H, Böckmann S, Breckling B (2008b) Analysing cross-pol-lination studies in maize In: Breckling B, reuter H, Verhoeven R: Implications of GM-Crop Cultivation at Large Spatial Scales. Proceedings of the GMLS conference 2008 in Bremen, vol 14, Theorie in der Ökologie. Peter Lang, Frankfurt, pp 47–53
ricroch A, Bergé JB, Kuntz M (2010) Is the German suspension of MON810 maize cultivation scientifically justified? Transgenic Res 19:1–12
rosi-Marshall EJ, Tank JL, royer TV, Whiles Mr, Evans-White M, Chambers C, Griffiths NA, Pokelsek J, Stephen ML (2007) Tox-ins in transgenic crop byproducts may affect headwater stream ecosystems. Proc Natl Acad Sci USA 104 (41):16204–16208
rousseau dd, Schevin P, duzer d, Cambon G, Ferrier J, Jolly d, Poulsen U (2006) New evidence of long distance pollen trans-port to southern Greenland in late Spring. Rev Palaeobot Palynol 141:277–286
Schmidt G, Schröder W (2008) Auswahl repräsentativer Standorte zur Modellierung der Ausbreitung von gentechnisch veränderten Pflanzen in Nord-deutschland. Umweltwiss Schadst Forsch 20:9–23
Schmidt G, Schröder W (2009) GIS-gestützte Analysen zur möglichen Gefährdung von Naturschutzgebieten durch den Anbau gentech-
nisch veränderter Kulturpflanzen. Auswirkung von Sicherheitsab-ständen. Umweltwiss Schadst Forsch 21(1):76–93
Schmidt JEU, Braun CU, Whitehouse LP, Hilbeck A (2009) Effects of activated Bt transgene products (Cry1Ab, Cry3Bb) on immature stages of the ladybird Adalia bipunctata in laboratory ecotoxicity testing. Arch Environ Contam Toxicol 56:221–228
Schröder W, Hofmann F (2008) Wissenschaftstheoretische Grundla-gen der Beobachtung von GVO-Umweltrisiken. Umweltwiss Schadst Forsch 20(1):2–8
Seeley Td (1985) Honeybee ecology. Princeton University Press, Princeton
Singh OV, Ghai S, Paul d, Jain rK (2006) Genetically modified crops: success, safety assessment and public concern. Appl Microbiol Biotechnol 71:598–607
Sparrow PAC (2010) GM risk assessment. Mol Biotechnol 44:267–275Steinhäuser KG (2001) Environmental risks of chemicals and geneti-
cally modified organisms: A comparison. Part II: Sustainability and precaution in risk assessment and risk management. Environ Sci Pollut Res 8:222–226
Sunstein CR (2005) Laws of Fear. Beyond the precautionary principle. Cambridge University Press, New York
VDI 4330 Part 1 (2006) Monitoring the ecological effects of geneti-cally modified organisms (GMO). Basic principles and strate-gies. VdI-Handbuch Biotechnologie, VdI/dIN-Handbuch rein-haltung der Luft, vol 1a. Beuth, Berlin
VdI 4330 Part 3 (2007) Monitoring the effects of genetically modified organisms (GMO). Pollen monitoring: Technical pollen sampling using pollen mass filter (PMF) and Sigma-2-sampler. VdI-Hand-buch Biotechnologie, VdI/dIN-Handbuch reinhaltung der Luft, vol 1a. Beuth, Berlin
VdI 4330 Part 4 (2006) Monitoring the effects of genetically modified organisms (GMO). Pollen monitoring: Biological pollen sam-pling using bee colonies. VdI-Handbuch Biotechnologie, VdI/dIN-Handbuch reinhaltung der Luft, vol 1a. Beuth, Berlin
VDI 4330 Part 13 (2010) Monitoring the effects of genetically modi-fied organisms (GMO). Standardised monitoring of butterflies and moths (Lepidoptera) – Transect method, light trap and larval survey. VdI-Handbuch Biotechnologie, VdI/dIN-Handbuch re-inhaltung der Luft, vol 1a. Beuth, Berlin
Vogel B (2005) Auswirkungen des Anbaus von gentechnisch veränderten Pflanzen auf die biologische Vielfalt. Agro-Gen-technik & Naturschutz, NABU Berlin. http://www.nabu.de/imperia/md/content/nabude/gentechnik/studien/1.pdf. Accessed 21. 4. 2010
von der Ohe K, von der Ohe W (2000) Celler Melissopalynologische Sammlung. LAVES Niedersächsisches Landesinstitut für Bi-enenkunde, Celle. http://www.laves.niedersachsen.de/master/C3932570_N3218279_L20_D0_I826.html. Accessed 21. 4. 2010
Winter G (2007a) Naturschutz bei der Ausbringung von gentechnisch veränderten Organismen,.part 1. Nur 29:571–587
Winter G (2007b) Naturschutz bei der Ausbringung von gentechnisch veränderten Organismen, part 2. Nur 29:635–641
Yamamura K (2004) dispersal distance of corn pollen under fluctuat-ing diffusion coefficient. Popul Ecol 46:87–101
Zander (2002) Handwörterbuch der Pflanzennamen. dictionary of plant names. dictionnaire des noms des plantes, 17th edn. Ulmer, Stuttgart