Embed Size (px)
Citation preview

K. S. FRIEDMAN AND X. LI
O
Monitoring Hurricanes Over the Oceanwith Wide Swath SAR
Karen S. Friedman and Xiaofeng Li
ne of the most unexpected new applications for wide swath synthetic apertureradar (SAR) is the monitoring of atmospheric expressions of storms over the ocean.SAR has an advantage over many sensors because it can pass through clouds and takeimages at any time of day. However, since SAR’s detection capability is based on themodulation of the sea surface wind field, it can only observe storms over water.Hurricanes and other mesoscale storms are easily detected with existing observations,but SAR can contribute fine-resolution low-level information that cannot be seenbelow the cloud deck with other sensors. Using Radarsat-1, we have imaged threehurricanes during the 1998 season. Two SAR images of Hurricane Bonnie separated by1 day are presented, and observations from the SAR data are discussed. (Keywords:Atmospheric expressions, Hurricanes, Storms, Synthetic aperture radar.)
INTRODUCTIONSynthetic aperture radar (SAR) data have been used
operationally for purposes such as ice and flood mon-itoring for many years. Recently, new uses for SAR datahave been realized. One of the most unexpected is usingSAR to image atmospheric storms on the ocean sur-face.1 Using Radarsat-1, we have been able to imagemany types of storms, including polar lows and hurri-canes.2 Although other existing sensors such as theAdvanced Very High Resolution Radiometer(AVHRR) and the Geostationary Orbiting Environ-mental Satellite (GOES) imager can easily detect hur-ricanes and other mesoscale storms, SAR can contrib-ute fine-resolution ocean surface information thatcannot otherwise be obtained below the cloud deck.
80 JO
At the National Oceanic and Atmospheric Ad-ministration (NOAA) National Environmental Sat-ellite Data Information Service (NESDIS) we activelymonitor the Atlantic Ocean off the southeast coast ofthe United States during hurricane season. Since dataacquisitions by Radarsat-1 must be scheduled days inadvance, we randomly schedule wide-area coverage ofa region rather than wait until a storm appears. Thisapproach has worked well and has resulted in thecapture of three hurricane images during the 1998hurricane season, two of Hurricane Bonnie and oneof Danielle, including the latter’s entire eye. Effortsby Chris Elvidge of NOAA and Radarsat Internation-al resulted in the acquisition of images from two
HNS HOPKINS APL TECHNICAL DIGEST, VOLUME 21, NUMBER 1 (2000)

MONITORING HURRICANES OVER THE OCEAN
subsequent hurricanes, Georges and Mitch, also dur-ing this period (see Katsaros et al., this issue).
To gain an understanding of storm progression, atime series of SAR images is essential, but it is difficultto obtain more than one image of any particular storm.We did, however, manage to image Hurricane Bonnietwice over the course of 2 days. Although the entirestorm does not fit in one ScanSAR wide mode image,it is still possible to sense the evolution of parts of thisstorm. This article presents SAR imagery of HurricaneBonnie on 25 and 27 August 1998 and the effectivenessof imaging the hurricanes with Radarsat-1 SAR Scan-SAR wide mode data.
DATA SETS AND BACKGROUNDThe Canadian Radarsat-1 was launched in Novem-
ber 1995 into a Sun-synchronous polar orbit with anascending equator crossing time (local time) of 6:00p.m. It has a 5.6-cm C-band SAR with horizontal–horizontal (HH) polarization and is right-looking. Thesensor mode used in this study is ScanSAR wide B,which has a swath width of 500 km. The resolution ofthe data is 100 m, with a pixel spacing of 50 m.
SAR has an advantage over many sensors becauseits active radar signal passes through clouds and canimage at any time of day. However, since the SARdetects variations in sea surface roughness caused bywind variations, SAR instruments can observe stormsonly over the water. This is accomplished by detectingthe modulation of the sea surface Bragg waves causedby the variation in the wind field due to the storm.Higher wind speeds increase the backscatter, and thewind direction can be inferred by wind rows that havea sea surface roughness signature.3,4 Atmospheric atten-uation by rain may also result in observed regions of lowbackscatter.5
We used infrared data from channel 4 (11 �m) ofGOES-10 to compare atmospheric signatures in theRadarsat-1 SAR data. GOES-10 data were chosen be-cause they are available every 30 min as opposed to datafrom polar orbiting instruments such as AVHRR.GOES-10, which is operated by NOAA, is a multichan-nel instrument that senses emitted radiant infraredenergy and reflected solar energy from the Earth’s surfaceand atmosphere. The spatial resolution of channel 4 isnominally 4 km at the equator; however, the resolutionof a geostationary satellite like GOES-10 decreases sig-nificantly above 50°N latitude. A polar orbiter such asRadarsat-1 does not have a latitude-dependent resolu-tion and so has an advantage over geostationary satel-lites in regions like the Bering Sea.
NEXRAD reflectivity images from the NationalClimatic Data Center were used to sense the precipi-tation from Hurricane Bonnie and to confirm thatvariability in the SAR was correlated with precipitation
JOHNS HOPKINS APL TECHNICAL DIGEST, VOLUME 21, NUMBER 1 (2
variability. It appears possible to image rain-producingcells with SAR. Rain may dampen the capillary waveson the ocean surface, which results in a smoother sur-face and a region of low backscatter (dark) on the SARimage. This is true for L-band SAR, but not so pro-nounced for C-band SAR.5 A side-view schematic ofa thunderstorm cell from a squall line is presented inFig. 1a, showing the gust front spreading radially aheadof the rain shaft. This structure was seen by Atlas6 ina SAR image from the European Remote SensingSatellite 1 (ERS-1). Atlas believes that the echo-freehole in a SAR image of a storm cell results from adamping of the capillary waves due to the impact ofprecipitation on the sea surface. Figure 1b is the topview of Fig. 1a, showing the mechanics involved informing the round-shaped storm cells observed inSAR imagery. The rain dampens the capillary wavesand decreases the backscatter intensity. However, low
Figure 1. Dynamics of the same squall line viewed from the side(a) and from above (b).
To anvil To anvil
Clo
ud b
ound
ary
Clo
ud b
ound
ary
Rain shaft
Air flow
Air flow
Gust front
zx
y
Rain shaftAir f
low
Gust front
x
z
(a)
(b)
000) 81

K. S. FRIEDMAN AND X. LI
backscatter intensity is not always associated with theseround features in a SAR image.
Rain occurs for only 15 to 30 min of the approximate1-h lifetime of a thunderstorm cell. Rogers and Yau7
explain the three stages of a thunderstorm: a cumulousstage, where the updraft through most of the cell lastsfor 10 to 15 min; a mature stage, where downdrafts andupdrafts accompany rain and last for 15 to 30 min; anda dissipating stage, where there are weak downdraftsthrough most of the cell. Therefore, storm cells viewedby SAR in the last stage would include imprints fromthe downdrafts only. Figure 2 shows a storm cell fromRadarsat-1 taken in the Bering Sea. The edge of thedowndraft can be seen as the rounded formation in thecenter. The cell is darker on the near-range side of theimage, possibly due to differences in wind directionacross the cell. As the wind originates from the centerand spreads outward, the easterly component cancels outwith the ambient wind and causes a region of low wind,and therefore lower backscatter in the SAR image.
HURRICANE BONNIEOn 26 August 1998, at 00 Greenwich Mean Time
(GMT), the National Weather Service in Miami, Flor-ida, issued an advisory on Hurricane Bonnie statingthat it was moving N–NW at 7.2 m/s (16 mph), withmaximum sustained winds of 51.4 m/s (115 mph) and
N
Satellite path
Figure 2. Radarsat-1 ScanSAR wide B image of a round stormcell (© Canadian Space Agency [CSA], 1998).
82 JO
minimum central pressure of 95.8 kPa, or 958 millibar(mb). Only 42 min earlier, Radarsat-1 collected datacovering the area to the left of the hurricane’s eye.Winds in the region covered by the SAR image rangedfrom 13 m/s near the coast to 18 m/s farther east (takenfrom an Atlantic Oceanographic and MeteorologicalLaboratory wind analysis at 0130 GMT on 26 August1998). Figure 3a superposes the SAR image over aGOES channel 4 water vapor image taken 3 min ear-lier. This SAR image clearly shows the Gulf Stream
(a)
(b)
Figure 3. Radarsat-1 ScanSAR wide B image (a) of HurricaneBonnie on 25 August 1998 at 2318 GMT. SAR image is overlaid ona GOES channel 4 image taken at 2315 GMT. Expanded view (b)is a magnification of box A. The boundary of a downdraft cell isshown in red, the Gulf Stream boundary is shown in blue, and theoceanic long waves are highlighted in green (© CSA, 1986).
HNS HOPKINS APL TECHNICAL DIGEST, VOLUME 21, NUMBER 1 (2000)
MONITORING HURRICANES OVER THE OCEAN
coming up from the tip of Florida and crossing thestorm cells. These cells, which are visible in the SARbands, match exactly with the inner side of the largearm spiraling from the hurricane’s eye in the GOESimage. From the GOES imagery alone, there is noindication of which clouds have associated downdraftsallowing the possible formation of precipitation. Butwith SAR, downdraft cells are clearly visible. To cor-roborate our claim that these are indeed bands of con-vective storms capable of forming rain, we looked atthe NEXRAD imagery (Fig. 4a) at 23 GMT, whichshows rain in the same region as the storm cells inthe SAR.
The Gulf Stream is known to be visible by radar.8,9
Its warm water can produce an unstable marine atmo-spheric boundary layer that leads to increased surfacedrag and increased Bragg spectral energy density, there-fore increasing the radar backscatter.9 Figure 3b, an
Radarreflectivity
(dB)
(a)
(b)
Figure 4. A NEXRAD reflectivity image for (a) 25 August 1998at about 23 GMT and (b) 27 August 1998 at about 11 GMT. Redboxes indicate approximate locations of SAR image in Figs. 3 and5, respectively.
JOHNS HOPKINS APL TECHNICAL DIGEST, VOLUME 21, NUMBER 1 (
expanded view of the box marked “A” in Fig. 3a, showsthe intersection of the Gulf Stream boundary (in blue)with the downdraft cell boundary (in red). The GulfStream region has a higher backscatter (lighter incolor), as would be expected. Its location would nor-mally be extremely difficult to detect using other typesof satellite data when the region is covered so com-pletely by clouds as it is during a hurricane. SAR isimportant as a Gulf Stream locator tool when othersensors are unable to view the ocean surface beneaththe hurricane clouds. This difference in backscatterintensity between the Gulf Stream region and theregion above it does lessen after crossing the stormfront, but it is still clearly visible. Oceanic long wavescaused by the hurricane-produced ocean swell are seenacross this entire subset image. A few of these wavesare highlighted in green in Fig. 3b. The wavelength asmeasured from the SAR image is approximately 350 m.The waves are aligned parallel to the hurricane bandand change direction slightly when crossing the GulfStream front or the storm front.
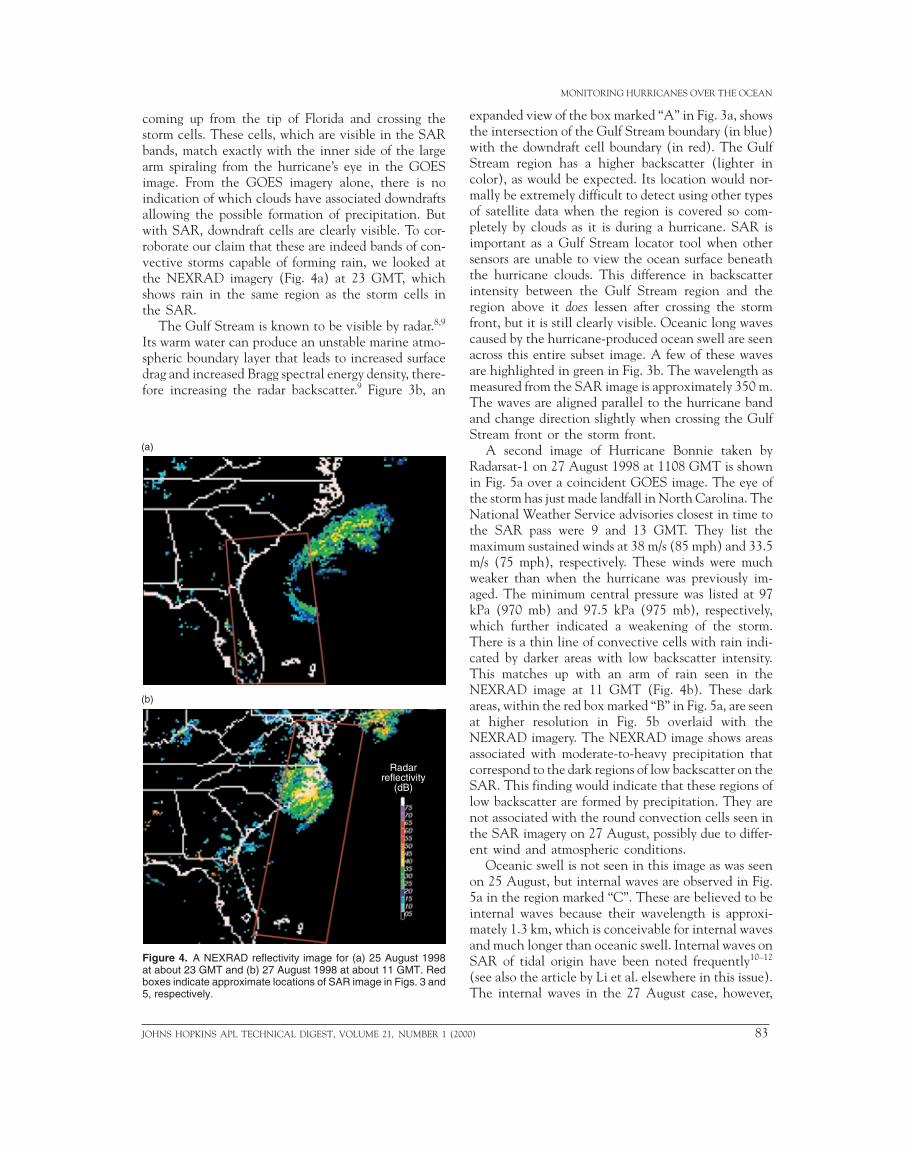
A second image of Hurricane Bonnie taken byRadarsat-1 on 27 August 1998 at 1108 GMT is shownin Fig. 5a over a coincident GOES image. The eye ofthe storm has just made landfall in North Carolina. TheNational Weather Service advisories closest in time tothe SAR pass were 9 and 13 GMT. They list themaximum sustained winds at 38 m/s (85 mph) and 33.5m/s (75 mph), respectively. These winds were muchweaker than when the hurricane was previously im-aged. The minimum central pressure was listed at 97kPa (970 mb) and 97.5 kPa (975 mb), respectively,which further indicated a weakening of the storm.There is a thin line of convective cells with rain indi-cated by darker areas with low backscatter intensity.This matches up with an arm of rain seen in theNEXRAD image at 11 GMT (Fig. 4b). These darkareas, within the red box marked “B” in Fig. 5a, are seenat higher resolution in Fig. 5b overlaid with theNEXRAD imagery. The NEXRAD image shows areasassociated with moderate-to-heavy precipitation thatcorrespond to the dark regions of low backscatter on theSAR. This finding would indicate that these regions oflow backscatter are formed by precipitation. They arenot associated with the round convection cells seen inthe SAR imagery on 27 August, possibly due to differ-ent wind and atmospheric conditions.
Oceanic swell is not seen in this image as was seenon 25 August, but internal waves are observed in Fig.5a in the region marked “C”. These are believed to beinternal waves because their wavelength is approxi-mately 1.3 km, which is conceivable for internal wavesand much longer than oceanic swell. Internal waves onSAR of tidal origin have been noted frequently10–12
(see also the article by Li et al. elsewhere in this issue).The internal waves in the 27 August case, however,
2000) 83

K. S. FRIEDMAN AND X. LI
Figure 5. Radarsat-1 ScanSAR wide B image (a) of HurricaneBonnie (27 Aug 1998) at 1108 GMT. SAR image is overlaid on theGOES channel 4 image taken at 1115 GMT. Boxes B and C areshown at higher resolution in (b) and (c), respectively. A NEXRADreflectivity image at the same time is placed over the SAR image inFig. 4b (© CSA, 1998).
Radarreflectivity
(dB)
(a)
(b)
(c)
84 JOH
may be caused by wind forcing of the thermocline,although we cannot say that there is not anothersource. By looking more closely at region “C” in Fig.5c, we can see that these waves are traveling mainly ina southwesterly direction along the wind rows emanat-ing along the same arm of the hurricane that producedthe rain in region “B” (Fig. 5b). The wind rows can beseen in Fig. 5c as alternate lighter and darker stripes ofvarying thickness.
SUMMARYWith a continuous SAR data acquisition campaign,
it is possible to catch a slow-moving storm with a longlifetime more than once. In this article we have pre-sented Radarsat-1 imagery of Hurricane Bonnie off theAtlantic Coast in 1998 on two separate occasions. Thescale of this storm is larger than the 500-km swathwidth of Radarsat-1 ScanSAR wide mode, thus makingit impossible to image the entire storm at once. Thebest-case scenario would have been to have a SARimage on each day, with the hurricane centered withineach pass, and to have both of these passes occur whenthe hurricane was completely over water.
This pair of Hurricane Bonnie SAR images includessignatures of convective storms, although the signa-tures differ on each day. The large, round storm cellsseen on 25 August are not the same as those seen on27 August, where regions of low backscatter with nocircular downdraft boundaries are seen. The image on25 August shows the Gulf Stream boundary, even as itcrossed convection cells. Oceanic long waves coveredlarge portions of this image and also crossed the down-draft cells and Gulf Stream without interruption. TheSAR image on 27 August did not contain oceanicswell, but did have internal waves with wavelengthsover 1 km. It is also seen that SAR may have the abilityto see small-scale wind and rain events. Our data col-lection effort for the 1999–2000 seasons will build onour progress to date.
REFERENCES1Johannessen, J. A., Shuchman, R. A., Johannessen, O. M., Davidson, K. L.,and Lyzenga, D. R., “Synthetic Aperture Radar Imaging of Upper OceanCirculation Features and Wind Fronts,” J. Geophys. Res. 96, 10,411–10,422(1991).
2Friedman, K., Pichel, W. G., and Li, X., “Mesoscale Oceanic and Atmo-spheric Feature Detection Through Fusion of RADARSAT SAR with GOES/Imager Data,” in Proc. IEEE Int. Geoscience and Remote Sensing Symp., pp.907–909 (1998).
3Monaldo, F. M., and Beal, R. C., “Toward Real-Time Processing, Blending,and Dissemination of Operational Wind Products from the RADARSATSAR,” in Proc. IEEE Int. Geoscience and Remote Sensing Symp., pp. 959–961(1998).
4Beal, R. C., and Pichel, W. G., “Stormwatch 97–98 and Beyond: Applicationof SAR as a High Resolution Scatterometer in Coastal Regions,” in Proc.IEEE Int. Geoscience and Remote Sensing Symp., pp. 1379–1381 (1998).
5Alpers, W., Gade, M., Melsheimer, C., Bao, M., Masuko, L., and Kobayashi,T., “The Imaging of Different Oceanic and Atmospheric Phenomena by SIR-C/X-SAR,” in Proc. IEEE Int. Geoscience and Remote Sensing Symp. (1995).
NS HOPKINS APL TECHNICAL DIGEST, VOLUME 21, NUMBER 1 (2000)

6Altas, D., “Origin of Storm Footprints on the Sea Seen by Synthetic ApertureRadar,” Science 266, 1364–1366 (25 Nov 1994).
7Rogers, R. R., and Yau, M. K., “A Short Course in Cloud Physics,” inInternational Series in Natural Philosophy, D. Ter Haar (ed.), Pergamon Press,New York (1976).
8Weissman, D. E., Thompson, T. W., and Legeckis, R., “Modulation of SeaSurface Radar Cross Section by Surface Stress: Wind Speed and TemperatureEffects Across the Gulf Stream,” J. Geophys. Res. 85(C9), 5032–5042 (20 Sep1980).
9Beal, R. C., Kundryavtsev, V. N., Thompson, D. R., Grodsky, S. A., Tilley,D. G., et al., “The Influence of the Marine Atmospheric Boundary Layer onERS 1 Synthetic Aperture Radar Imagery of the Gulf Stream,” J. Geophys.Res. 102(C3), 5799–5814 (15 Mar 1997).
10Fu, L.-L., and Holt, B., “Seasat Views Oceans and Sea Ice with Synthetic-Aperture Radar,” JPL Publ. 81–120, Pasadena, CA (1982).
11Apel, J. R., and Gonzalez, F. I., “Nonlinear Features of Internal Waves offBaja California as Observed from the SEASAT Imaging Radar,” J. Geophys.Res. 88(C7), 4459–4466 (20 May 1983).
12Porter, D. J., and Thompson, D. R., “Continental Shelf Parameters Inferredfrom SAR Internal Wave Observations,” J. Atmos. Oceanic Technol. 16, 475–487 (1999).
JOHNS HOPKINS APL TECHNICAL DIGEST, VOLUME 21, NUMBER 1 (20
MONITORING HURRICANES OVER THE OCEAN
ACKNOWLEDGMENTS: Thanks to William G. Pichel and Pablo Clemente-Colón for their contributions to this article. This research was funded by the NOAA/NESDIS Ocean Remote Sensing Program as part of the NESDIS Monitoring andDetection (NEMoDe) project. RADARSAT data were obtained under NASARADARSAT ADRO Project #396 and processed at the Alaska SAR Facility.
THE AUTHORS
KAREN S. FRIEDMAN is with NOAA/NESDIS in CampSprings, MD. Her e-mail address is [email protected].
XIAOFENG LI is with NOAA/NESDIS in Camp Springs,MD. His e-mail address is [email protected].
00) 85