Embed Size (px)
Citation preview
744 USDA Forest Service Proceedings RMRS-P-42CD. 2006.
IntroductionCrop Explorer is an Internet web site that provides
free, easy-to-read crop condition information for major agricultural regions in the world. This information is heavily used by farmers, agribusiness, traders, research-ers, foreign organizations and U.S. federal, state and local agencies. At the Production Estimates and Crop Assessment Division (PECAD) of the U.S. Department of Agriculture (USDA), Foreign Agricultural Service (FAS) this information is used for global crop condition assessments and estimates of area, yield, and production. PECAD produces objective and accurate assessments of the global agricultural production outlook and the conditions affecting food security. Regional analysts use a Geographic Information System (GIS) to collect mar-ket intelligence, and forecast reliable global production numbers for grains, oil seeds and cotton.
The GIS utilizes several different satellite data sources, input databases, climate data, crop models, and data extraction routines for yield and area estimates to de-termine production (production=yield x area) (Tetrault, 2004). The FAS has a global network of attachés that provide on-the-ground reports of observed crop and contextual information. Also, the FAS regional analysts travel extensively in the countries they cover to more fully develop the context and constraints within which their assessments are made. The development of the interface and underlying structure of this application was built upon years of experience from PECAD crop analysts. Their knowledge of in-country conditions was essential to the creation of the areas of interest known as agro-meteorological zones. These zones are unique to Crop Explorer and are the basis for spatially repre-senting the global crop condition information. Ancillary data from official governmental reports, trade and news
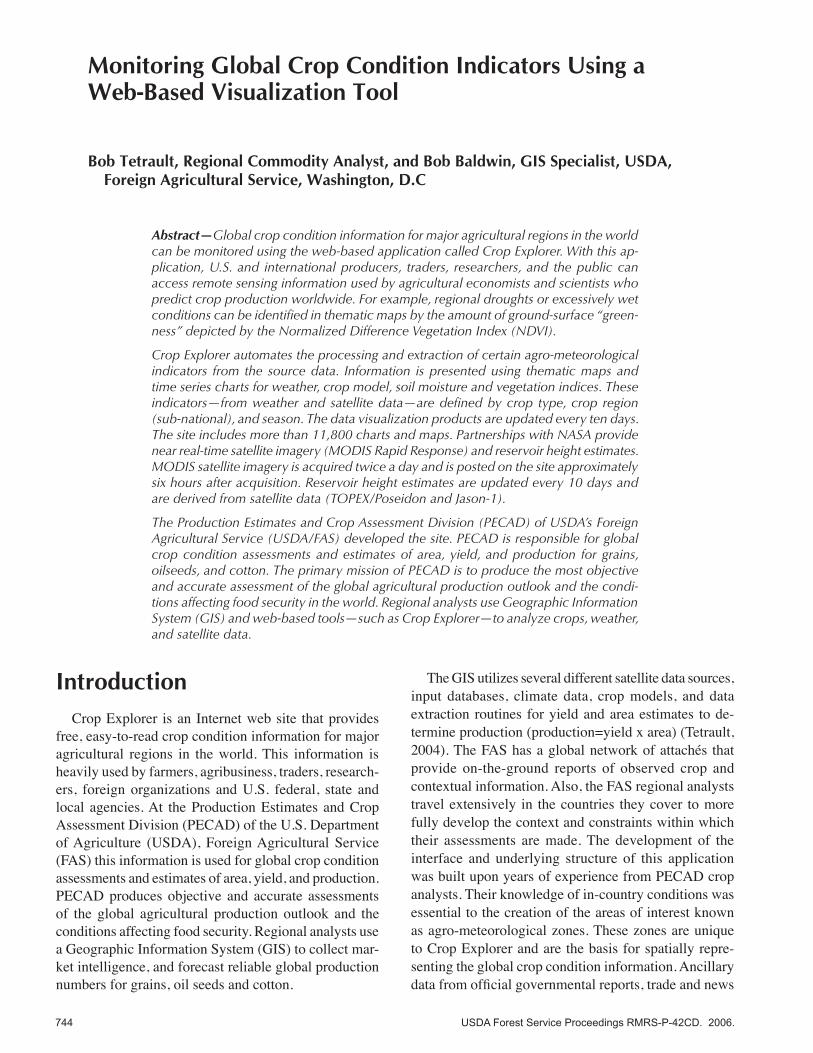
Monitoring Global Crop Condition Indicators Using a Web-Based Visualization Tool
Bob Tetrault, Regional Commodity Analyst, and Bob Baldwin, GIS Specialist, USDA, Foreign Agricultural Service, Washington, D.C
Abstract—Global crop condition information for major agricultural regions in the world can be monitored using the web-based application called Crop Explorer. With this ap-plication, U.S. and international producers, traders, researchers, and the public can access remote sensing information used by agricultural economists and scientists who predict crop production worldwide. For example, regional droughts or excessively wet conditions can be identified in thematic maps by the amount of ground-surface “green-ness” depicted by the Normalized Difference Vegetation Index (NDVI).
Crop Explorer automates the processing and extraction of certain agro-meteorological indicators from the source data. Information is presented using thematic maps and time series charts for weather, crop model, soil moisture and vegetation indices. These indicators—from weather and satellite data—are defined by crop type, crop region (sub-national), and season. The data visualization products are updated every ten days. The site includes more than 11,800 charts and maps. Partnerships with NASA provide near real-time satellite imagery (MODIS Rapid Response) and reservoir height estimates. MODIS satellite imagery is acquired twice a day and is posted on the site approximately six hours after acquisition. Reservoir height estimates are updated every 10 days and are derived from satellite data (TOPEX/Poseidon and Jason-1).
The Production Estimates and Crop Assessment Division (PECAD) of USDA’s Foreign Agricultural Service (USDA/FAS) developed the site. PECAD is responsible for global crop condition assessments and estimates of area, yield, and production for grains, oilseeds, and cotton. The primary mission of PECAD is to produce the most objective and accurate assessment of the global agricultural production outlook and the condi-tions affecting food security in the world. Regional analysts use Geographic Information System (GIS) and web-based tools—such as Crop Explorer—to analyze crops, weather, and satellite data.

USDA Forest Service Proceedings RMRS-P-42CD. 2006. 74�
sources play a significant role in interpreting the data. Final production estimates are approved by the USDA World Agricultural Outlook Board and published on the 10th day of each month. The methodology relies on an all source convergence of evidence. The final production estimates are used in a variety of ways:
Official USDA statisticsPrinciple Federal Economic IndicatorsCrop conditions and early warning alertsAgricultural monitoring and food securityForeign aid assessments for food import needsDisaster monitoring and relief efforts related to food aidCommercial market trends and analysisTrade policy and exporter assistanceThe web site automates the processing and extraction
of specific crop condition indicators from an immense amount of agriculture data stored on PECAD’s database servers. Baseline data sets include atmospheric data and satellite imagery. The near real-time estimates of meteorological indicators, such as precipitation and soil moisture, are used by agricultural economists and scien-tists to forecast crop production worldwide.
Crop Condition MonitoringPECAD relies on remote sensing data from satellite
sensors (fig. 1) as an important source of data for its GIS. Selected data sets provide daily, weekly, and targeted coverage with resolutions ranging from 1km to less than 1m. The data is stored on a terabyte server accessible to each analyst workstation. The most common data formats used operationally with ArcGIS at PECAD are TIFF and compressed MrSID images.
The Crop Condition Data Retrieval and Evaluation database (CADRE) is the main decision support tool used in the GIS by PECAD analysts. CADRE is a global grid-based, geospatial database that stores daily, monthly, and decadal (10-day) data. The sources for this data are
••••••
•• the Air Force Weather Agency (AFWA) and the World
Meteorological Organization (WMO). PECAD takes this source data and models precipitation, temperature, soil moisture and crop stages. To measure vegetative vigor, PECAD calculates vegetation index numbers (VINs) from satellite derived data. The data is imported into 1/8 degree mesh grid cells (fig. 2) and can be categorized by:
Time-series Data SetsDaily agro-meteorological data derived from station
and satellite data include precipitation; min and max temperatures; snow depth; solar and longwave radia-tion; potential and actual evapo-transpiration. Daily and decadal VINs derived from Local Area Coverage (LAC), approx 1.1-km pixels and Global Area Coverage (GAC), approx 8-km pixels from the NOAA-AVHRR satellite series (Reynolds, 2001).
Normal Baseline Data SetsNormal precipitation, temperature, potential evapora-
tion, and elevation values; soil-water holding capacity based upon the United Nations Food and Agriculture Organization’s (FAO) Digital Soil Map of the World at 1:5M scale; decadal VIN normals or averages for the GAC data set.
Crop Information and ModelsCrop type and average start of season; average
yield and area planted; percent crop production within a country; two-layer soil moisture algorithm; crop calendars based on growing-degree days; crop stress or alarm models for corn and wheat based on soil moisture and temperature thresholds; crop water pro-duction functions to estimate relative yield reductions (yield reduction models); and crop stage models by Ritchie (1991).
Figure 1. False color Landsat TM image in Central France taken on May 29, 2003. Red colors indicate vegetation.
Figure 2. Polygons outlined in red are selected AFWA grid-cells for crop producing region in Brazil. The average grid-cell size is 40 km.
746 USDA Forest Service Proceedings RMRS-P-42CD. 2006.
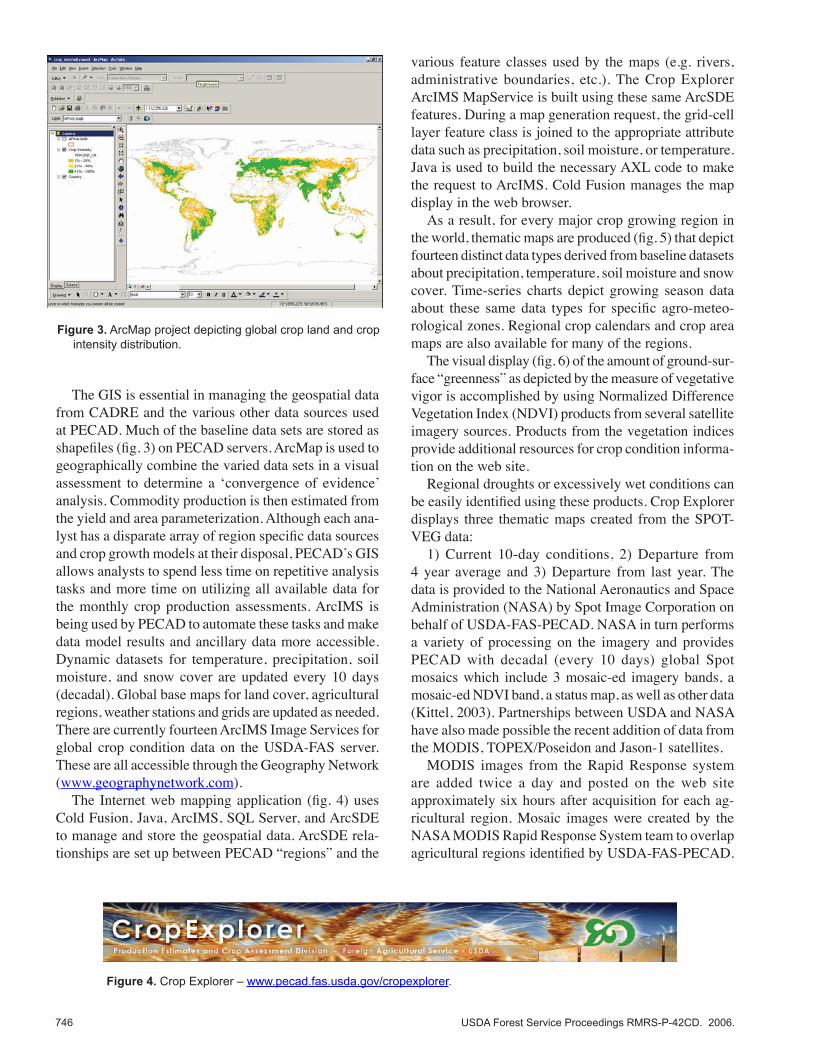
The GIS is essential in managing the geospatial data from CADRE and the various other data sources used at PECAD. Much of the baseline data sets are stored as shapefiles (fig. 3) on PECAD servers. ArcMap is used to geographically combine the varied data sets in a visual assessment to determine a ‘convergence of evidence’ analysis. Commodity production is then estimated from the yield and area parameterization. Although each ana-lyst has a disparate array of region specific data sources and crop growth models at their disposal, PECAD’s GIS allows analysts to spend less time on repetitive analysis tasks and more time on utilizing all available data for the monthly crop production assessments. ArcIMS is being used by PECAD to automate these tasks and make data model results and ancillary data more accessible. Dynamic datasets for temperature, precipitation, soil moisture, and snow cover are updated every 10 days (decadal). Global base maps for land cover, agricultural regions, weather stations and grids are updated as needed. There are currently fourteen ArcIMS Image Services for global crop condition data on the USDA-FAS server. These are all accessible through the Geography Network (www.geographynetwork.com).
The Internet web mapping application (fig. 4) uses Cold Fusion, Java, ArcIMS, SQL Server, and ArcSDE to manage and store the geospatial data. ArcSDE rela-tionships are set up between PECAD “regions” and the
various feature classes used by the maps (e.g. rivers, administrative boundaries, etc.). The Crop Explorer ArcIMS MapService is built using these same ArcSDE features. During a map generation request, the grid-cell layer feature class is joined to the appropriate attribute data such as precipitation, soil moisture, or temperature. Java is used to build the necessary AXL code to make the request to ArcIMS. Cold Fusion manages the map display in the web browser.
As a result, for every major crop growing region in the world, thematic maps are produced (fig. 5) that depict fourteen distinct data types derived from baseline datasets about precipitation, temperature, soil moisture and snow cover. Time-series charts depict growing season data about these same data types for specific agro-meteo-rological zones. Regional crop calendars and crop area maps are also available for many of the regions.
The visual display (fig. 6) of the amount of ground-sur-face “greenness” as depicted by the measure of vegetative vigor is accomplished by using Normalized Difference Vegetation Index (NDVI) products from several satellite imagery sources. Products from the vegetation indices provide additional resources for crop condition informa-tion on the web site.
Regional droughts or excessively wet conditions can be easily identified using these products. Crop Explorer displays three thematic maps created from the SPOT-VEG data:
1) Current 10-day conditions, 2) Departure from 4 year average and 3) Departure from last year. The data is provided to the National Aeronautics and Space Administration (NASA) by Spot Image Corporation on behalf of USDA-FAS-PECAD. NASA in turn performs a variety of processing on the imagery and provides PECAD with decadal (every 10 days) global Spot mosaics which include 3 mosaic-ed imagery bands, a mosaic-ed NDVI band, a status map, as well as other data (Kittel, 2003). Partnerships between USDA and NASA have also made possible the recent addition of data from the MODIS, TOPEX/Poseidon and Jason-1 satellites.
MODIS images from the Rapid Response system are added twice a day and posted on the web site approximately six hours after acquisition for each ag-ricultural region. Mosaic images were created by the NASA MODIS Rapid Response System team to overlap agricultural regions identified by USDA-FAS-PECAD.
Figure 3. ArcMap project depicting global crop land and crop intensity distribution.
Figure 4. Crop Explorer – www.pecad.fas.usda.gov/cropexplorer.

USDA Forest Service Proceedings RMRS-P-42CD. 2006. 747
New MODIS mosaics (fig. 7) are produced daily for each agricultural region in false color, true color and NDVI from the Terra and Aqua satellites at 1km, 500m and 250m resolution. The entire archive can be browsed and images can by selected for downloading.
Since the beginning of 2004, NASA has supplied the USDA with near-real time data on lake and reservoir heights from around the world. Lake and reservoir sur-face elevation maps are produced via a semi-automated process and updated in Crop Explorer’s Global Reservoir Monitoring database every 7-10 days. Time series charts of the lake height variations are expected to be accurate to better than 10cm rms. Analysts who forecast crop production, scientists, in-country water and irrigation managers, those involved in fishing industries, and the general public have all been making use of the web site. NASA and
the French space agency Le Centre National d’Etudes Spatiales (CNES) teamed up to design, build and launch the TOPEX/Poseidon and the Jason-1 satellites.
These satellites were designed to study many aspects of the ocean. The TOPEX/Poseidon satellite, for example, orbits at a height of 1336 kilometers (830 miles) above Earth, and can measure the height of the ocean surface directly underneath the satellite with an accuracy of 4-5 centimeters (better than 2 inches) (Ramanujan, 2004). Jason-1 and TOPEX/Poseidon cover the global oceans every 10 days. With these capabilities, this technology is surprisingly valuable for looking at larger areas of inland water (fig. 8).
PECAD regularly uses computer models that simu-late agricultural production based on inputs that include weather information. But in irrigated areas that are not rain fed, these methods are limited. For irrigated areas, a determination of how much water is actually stored, after seasonal precipitation passes is required. The data from the Global Lake and Reservoir database can be used for this purpose. This type of information is especially important for food aid partners, who must budget ahead for how much and where food aid is distributed.
Figure 8. Lake Michigan data from the Global Lake and Reservoir database on the Crop Explorer web site.
Figure 5. ArcIMS generated map of Percent Soil Moisture from October 1-10, 2003 in Brazil. Each 40km grid cell represents a percent soil moisture value. A relationship class in ArcSDE joins the attribute data (soil moisture) at the grid cell level to the region layer for Brazil.
Figure 6. SPOT-VEG NDVI map of Africa for April 1-10, 200�.
Figure 7. Three examples of the MODIS Terra satellite image of Mozambique on 8/31/2004 : 1)False color image with bands 7,2,1 (Short Wave Infrared, Near-Infrared, Red); 2) True Color; 3) NDVI. All at 1km resolution.

748 USDA Forest Service Proceedings RMRS-P-42CD. 2006.
SummaryThe Crop Explorer web site is a primary data category
for Agriculture and Farming in two government informa-tion portals: 1) the Geospatial One-Stop (http://www.geodata.gov/gos) e-gov initiative and 2) NASA’s Global Change Master Directory (http://gcmd.gsfc.nasa.gov/) for earth science and data services. Both of these portals are nodes of the Federal Geographic Data Committee (FGDC) Clearinghouse for metadata. Live data and maps from the Crop Explorer ArcIMS services are also directly linked through the Geography Network (www.geographynetwork.com).
Crop Explorer provides a specialized service to its cus-tomers with timely, accurate crop condition information on a global scale. Partnerships with other organizations such as NASA have introduced near real-time satellite imagery and derived products specifically for agricul-ture analysis. Region and country-specific linkages to
these external data sources is inherent in its geospatial design. This relationship has resulted in new and inno-vative products that can be shared by NASA and USDA customers.
ReferencesKittel, Drew. 2003. SpotVeg Processing - Overview of the
operational SpotVeg processing performed at FAS/PECAD. RS Information Systems Tech Report. June, 2003.
Ramanujan, Krishna 2004. NASA Satellites Allow USDA to See World’s Lakes Rise and Fall. Top Story, NASA Goddard Space Flight Center, Greenbelt, MD. http://www.gsfc.nasa.gov/topstory/2004/0826reservoirs.html. August 27, 2004.
Reynolds, Curt. 2001. Input Data Sources, Climate Normals, Crop Models, and Data Extraction Routines Utilized by PECAD. Submitted to the Third International Conference on Geospatial Information in Agriculture and Forestry, Denver, Colorado, November 5-7, 2001.
Tetrault, Bob; 2004. Crop Explorer Market Analysis. USDA-FAS-CMP-PECAD, Washington, DC. February, 2004.