Embed Size (px)
Citation preview

7/30/2019 Monitoring Environment Ias1022
http://slidepdf.com/reader/full/monitoring-environment-ias1022 1/23
Monitoring the XBuild Environment for Performance Issues.
Author: Applications Performance GroupLast modification date: April 11, 2006
This document provides a systematic approach for monitoring the Xbuild environment
for performance issues. The Xbuild environment refers to either the master environment
hosted by development services, or your local Xbuild environment used for Release 12
system testing. Release 12 contains a great deal of new functionality and a large amount
of code was changed from 11.5.10. Release 12 cannot regress in terms of performance
from that of the 11.5.10 release. The following steps should be used to monitor your
system test environment with the goal of identifying performance issues and logging bugs
for those issues. These steps include monitoring the middle-tier as well as the database.
If you are using RTs to test your R12 products, please contact the performance group via
email (appsperf_us), and ask about the performance regression framework. The
performance regression framework allows you to collect runtime performance data
during RT execution by automatically capturing performance metrics. The captured data
can then be used to identify performance issues as well as identify performance
regressions.
Environment preparation check-list for performance monitoring
1. Database monitoring
Database ‘apps’ password should be available.
Location and access to udump directory provided to review traces.
Privileges granted to ‘apps’ user to generate AWR reports.To check if apps user has privileges:
i. sqlplus as apps into the database.
ii. Execute the scrtipt @$ORACLE_HOME/rdbms/admin/awrrpt.sql.The awrrpt.sql script, once invoked, will list all the snapshot ids(including their times).
iii. Select any 2 runids to generate report.If the report is successfully generated, apps user has privileges to generateAWR reports.
2. Middle-tier Monitoring
1

7/30/2019 Monitoring Environment Ias1022
http://slidepdf.com/reader/full/monitoring-environment-ias1022 2/23
Appltop dev user access (e.g dev02/welcome ) should be available.
Appltop dev user (e.g dev02) should have access to the log directory( $IAS_ORACLE_HOME/Apache/Jserv/logs) and all config files.
Apps user login/password( e.g sysadmin/sysadmin or operations/welcome)with ‘System Administration’ responsibility to view FND logs from UI,
FND_Diagnostic profile for the user should be set to true. AoljDbcPoolStatus.jsp should be accessible (Path:
http://host:port/OA_HTML/jsp/fnd/AoljDbcPoolStatus.jsp)
Step 1: Monitor the middle-tier environment for JDBC connection leaks.
Connection leaks are one of the largest sources of customer problems with the
Applications Java stack. Connection leaks cause numerous issues including Java
OutofMemory errors, shared pool leaks, database instance instability, latch contention,
shared pool out of memory errors (ORA-4031), etc.. It is very important to ensure your
code does not have any connection leaks. AOLJ provides a JSP (AoljDbcPoolStatus.jsp)
to monitor connection usage, which automatically highlights possible connection leaks
(in red color) in the locked connections section. To access this JSP, first login as a user
with the profile option “FND: Diagnostics” set to “Yes”. Then, access the following
URL:
<base URL of the Applications Login>:<Apache port number>/OA_HTML/jsp/fnd/AoljDbcPoolStatus.jsp
For example, to access this JSP in the fin12x1s1 Environment, use the following URL
after you login as a user with the “FND: Diagnostics” profile set:
http://ap6256rt.us.oracle.com:8013/OA_HTML/jsp/fnd/AoljDbcPoolStatus.jsp
The page will appear as follows:
2
7/30/2019 Monitoring Environment Ias1022
http://slidepdf.com/reader/full/monitoring-environment-ias1022 3/23
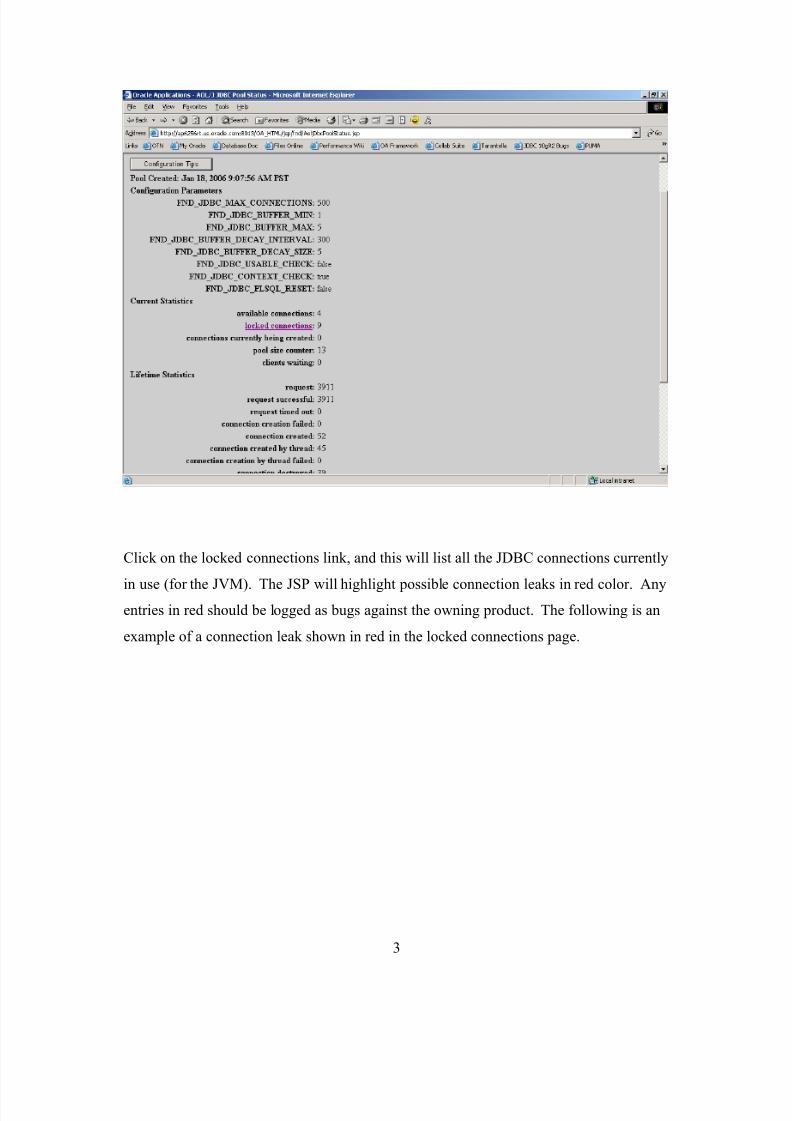
Click on the locked connections link, and this will list all the JDBC connections currently
in use (for the JVM). The JSP will highlight possible connection leaks in red color. Any
entries in red should be logged as bugs against the owning product. The following is an
example of a connection leak shown in red in the locked connections page.
3
7/30/2019 Monitoring Environment Ias1022
http://slidepdf.com/reader/full/monitoring-environment-ias1022 4/23
You should look for the first non-FND Java method (from top-down) in the stack, which
is typically the source of the leak. If none can be found, then the leak is coming from
FND code. In this case, the leak is caused by OA Framework and bug 4772964 has been
logged. If you are not sure who owns the offending code, please log the bug against FND
(bug id 510, Component=>Performance), and the FND team can reassign the bug to the
appropriate team.
Step 2: Monitor the middle-tier Apache, Jserv and FND logs.
Since many exceptions are now logged to the FND log tables and not to the log file, you
should monitor FND log to see what unexpected errors are captured. The log messages
can be views in Oracle Applications Manager (OAM). Login as a user with System
Administration responsibility, select “System Administration” and then “Logs” which is
under the Oracle Applications Manager section. On the “Search System Logs” screen,
4
7/30/2019 Monitoring Environment Ias1022
http://slidepdf.com/reader/full/monitoring-environment-ias1022 5/23
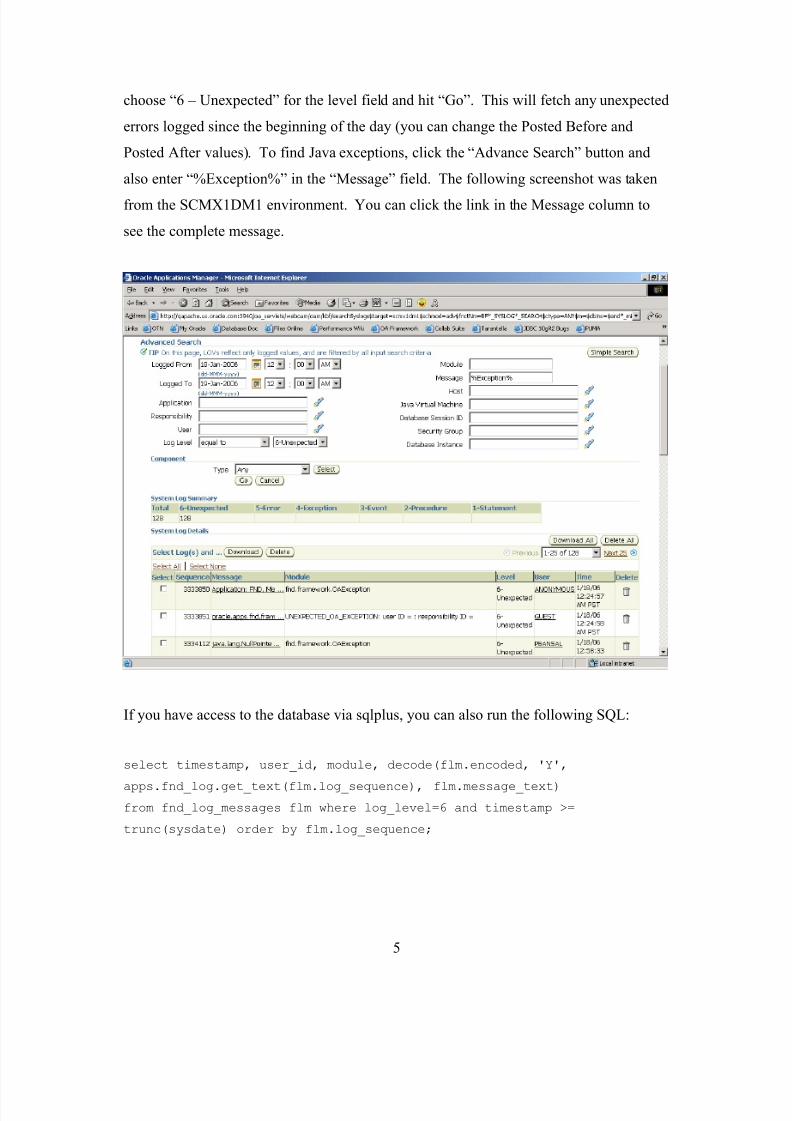
choose “6 – Unexpected” for the level field and hit “Go”. This will fetch any unexpected
errors logged since the beginning of the day (you can change the Posted Before and
Posted After values). To find Java exceptions, click the “Advance Search” button and
also enter “%Exception%” in the “Message” field. The following screenshot was taken
from the SCMX1DM1 environment. You can click the link in the Message column to
see the complete message.
If you have access to the database via sqlplus, you can also run the following SQL:
select timestamp, user_id, module, decode(flm.encoded, 'Y',
apps.fnd_log.get_text(flm.log_sequence), flm.message_text)
from fnd_log_messages flm where log_level=6 and timestamp >=
trunc(sysdate) order by flm.log_sequence;
5

7/30/2019 Monitoring Environment Ias1022
http://slidepdf.com/reader/full/monitoring-environment-ias1022 6/23
In addition, you should monitor the Apache log file (error_log) to determine the source of
any errors which are being raised. Depending on how the environment is setup, the
error_log file may be accessible from the browser, and the URL for the apache logs
should be available on the environment information page for the environment which you
are monitoring. If web access is not available, then you need to login to the machine
hosting the test environment. The error_log file is in the directory
$IAS_ORACLE_HOME/Apache/Apache/logs. The error_log file will typically contains
errors for users trying to access files that are not valid. You could sometimes use this
identify setup issues such as misconfigured profile options storing URLs etc.
You should also monitor the Jserv and JVM log files to determine if errors or exceptions
are being raised. The Jserv and JVM log files may also be accessible from the browser,
and the URL for the log files should be available on the environment information web
page. You can also access them in the $IAS_ORACLE_HOME/Apache/Jserv/logs
directory.
The file mod_jserv.log should be reviewed to determine if exceptions or errors are being
raised. If exceptions or errors exist, you should log bugs against the owning products.
This log file typically contains servlet exceptions.
The JVM log files are available under the jvm sub-directory under
$IAS_ORACLE_HOME/Apache/Jserv/logs. There will be two files per group: one for
stderr and one for stdout. There are typically four groups: Discoverer, OACore, XML,
and Mobile. The total number of log files will be equal to (the number of groups * 2 *
<number of JVMs>).
6

7/30/2019 Monitoring Environment Ias1022
http://slidepdf.com/reader/full/monitoring-environment-ias1022 7/23
You should review all of the stdout and stderr files to determine if exceptions are being
raised or messages are being logged unnecessarily. For example, in 11.5.10, reviewing
the file OACoreGroup.3.stdout showed that the Contracts leasing code (okl) was
unnecessarily logging the following messages:
oracle.apps.okl.util.SQLComposer@737611name ==>Extended Desktop PC Service Programthe view name is ==>OKX_SYSTEM_ITEMS_V OKX_SERVICEthe view name is ==>OKX_VENDORS_V OKX_VENDORthe view name is ==>OKL_STRMTYP_SOURCE_V OKL_STRMTYPthe view name is ==>OKX_VENDORS_V OKX_VENDORVirtualA ==>ITEM_NAME_VA
object1Id1 ==>object1Id2 ==>oracle.apps.okl.util.SQLComposer@4c7788VirtualA ==>PARTY_NAME_VAobject1Id1 ==>object1Id2 ==>
oracle.apps.okl.util.SQLComposer@36836cVirtualA ==>ITEM_NAME_VA
Bug 3705297 has been filed for this issue as an example. Any form of Apps related
messages present in the stdout files means that the code is using System.out() to log the
messages which is a coding violation. In addition, calls to System.out or System.err
severely impact performance. GSCC check [File.Java.17] exists to identify files which
use System.out or System.err.
The stderr files will usually contain errors and exceptions which were raised. Exceptions
are expensive in Java, and it is important to catch cases whereby the code is raising (and
masking) exceptions as part of normal processing or cases whereby the exception is a
genuine exception. In this case, you need to identify the root cause of the exception by
investigating the messages or stack trace. For example, the following exception was
raised and logged to the stderr file:
7

7/30/2019 Monitoring Environment Ias1022
http://slidepdf.com/reader/full/monitoring-environment-ias1022 8/23
java.sql.SQLException: ORA-01475: must reparse cursor to change bindvariable datatypeoracle.jbo.SQLStmtException: JBO-27122: SQL error during statementpreparation. Statement: SELECT per.effective_start_date
,per.effective_end_date,per.object_version_number,per.employee_number,per.last_name,per.full_name,per.applicant_number,per.date_employee_data_verified,per.original_date_of_hire,per.date_of_birth,per.town_of_birth,per.region_of_birth,per.country_of_birth,per.global_person_id,per.email_address
. . . << truncated to save space >> . . .
,per.benefit_group_id
,per.receipt_of_death_cert_date,per.coord_ben_med_pln_no,per.coord_ben_no_cvg_flag,per.uses_tobacco_flag,per.dpdnt_adoption_date,per.dpdnt_vlntry_svce_flag,per.comment_id,hl1.meaning title_meaning,hl2.meaning marital_status_meaning,hc.comment_text,per.person_id,per.business_group_id,sysdate DATE_START,sysdate ADJUSTED_SVC_DATE
,per.start_date,hr_person_type_usage_info.get_user_person_type(trunc(sysdate
+ 1),per.person_id) user_person_type,
per.npw_number,per.current_npw_flag,per.current_employee_flag
FROM per_all_people_f per,hr_lookups hl1,hr_lookups hl2,hr_comments hc
WHERE per.person_id = :1AND per.effective_start_date > trunc(sysdate)
AND hl1.lookup_type (+) = 'TITLE'AND hl1.lookup_code (+) = per.titleAND hl2.lookup_type (+) = 'MAR_STATUS'AND hl2.lookup_code (+) = per.marital_statusAND hc.comment_id (+) = per.comment_id
atoracle.jbo.server.QueryCollection.buildResultSet(QueryCollection.java:711)
atoracle.jbo.server.QueryCollection.executeQuery(QueryCollection.java:522)
8

7/30/2019 Monitoring Environment Ias1022
http://slidepdf.com/reader/full/monitoring-environment-ias1022 9/23
atoracle.jbo.server.ViewObjectImpl.executeQueryForCollection(ViewObjectImpl.java:3265)
atoracle.apps.fnd.framework.server.OAViewObjectImpl.executeQueryForCollection(OAViewObjectImpl.java:4106)
atoracle.jbo.server.ViewRowSetImpl.execute(ViewRowSetImpl.java:567)
atoracle.jbo.server.ViewRowSetImpl.execute(ViewRowSetImpl.java:537)
atoracle.jbo.server.ViewRowSetImpl.executeDetailQuery(ViewRowSetImpl.java:614)
atoracle.jbo.server.ViewObjectImpl.executeDetailQuery(ViewObjectImpl.java:3229)
atoracle.jbo.server.ViewObjectImpl.executeQuery(ViewObjectImpl.java:3216)
atoracle.apps.fnd.framework.server.OAViewObjectImpl.executeQuery(OAViewOb
jectImpl.java:411)at
oracle.apps.fnd.framework.server.OAPlsqlViewObjectImpl.executeQuery(OAPlsqlViewObjectImpl.java:521)
atoracle.apps.per.selfservice.personalinformation.webui.BasicDetailsOverviewCO.processRequest(BasicDetailsOverviewCO.java:152)
atoracle.apps.fnd.framework.webui.OAWebBeanHelper.processRequest(OAWebBeanHelper.java:586)
atoracle.apps.fnd.framework.webui.OAWebBeanContainerHelper.processRequest(OAWebBeanContainerHelper.java:244)
atoracle.apps.fnd.framework.webui.beans.layout.OAHeaderBean.processRequest(OAHeaderBean.java:366)
atoracle.apps.fnd.framework.webui.OAWebBeanHelper.processRequestChildren(OAWebBeanHelper.java:934). . . << truncated to save space >> . . .
atoracle.apps.fnd.framework.webui.OAPageBean.processRequest(OAPageBean.java:2019)
atoracle.apps.fnd.framework.webui.OAPageBean.preparePage(OAPageBean.java:1458)
at
oracle.apps.fnd.framework.webui.OAPageBean.preparePage(OAPageBean.java:444)
atoracle.apps.fnd.framework.webui.OAPageBean.preparePage(OAPageBean.java:365)
at _oa__html._OA._jspService(_OA.java:82)at oracle.jsp.runtime.HttpJsp.service(HttpJsp.java:119)at
oracle.jsp.app.JspApplication.dispatchRequest(JspApplication.java:385)at oracle.jsp.JspServlet.doDispatch(JspServlet.java:259)
9

7/30/2019 Monitoring Environment Ias1022
http://slidepdf.com/reader/full/monitoring-environment-ias1022 10/23
at oracle.jsp.JspServlet.internalService(JspServlet.java:178)at oracle.jsp.JspServlet.service(JspServlet.java:148)at javax.servlet.http.HttpServlet.service(HttpServlet.java:588)at
oracle.jsp.provider.Jsp20RequestDispatcher.forward(Jsp20RequestDispatcher.java:162)
atoracle.jsp.runtime.OraclePageContext.forward(OraclePageContext.java:175)
at _oa__html._OA._jspService(_OA.java:92)at oracle.jsp.runtime.HttpJsp.service(HttpJsp.java:119)at
oracle.jsp.app.JspApplication.dispatchRequest(JspApplication.java:385)at oracle.jsp.JspServlet.doDispatch(JspServlet.java:259)at oracle.jsp.JspServlet.internalService(JspServlet.java:178)at oracle.jsp.JspServlet.service(JspServlet.java:148)at javax.servlet.http.HttpServlet.service(HttpServlet.java:588)at
oracle.jsp.provider.Jsp20RequestDispatcher.forward(Jsp20RequestDispatcher.java:162)
at
oracle.jsp.runtime.OraclePageContext.forward(OraclePageContext.java:175)at _oa__html._RF._jspService(_RF.java:201)at oracle.jsp.runtime.HttpJsp.service(HttpJsp.java:119)at
oracle.jsp.app.JspApplication.dispatchRequest(JspApplication.java:385)at oracle.jsp.JspServlet.doDispatch(JspServlet.java:259)at oracle.jsp.JspServlet.internalService(JspServlet.java:178)at oracle.jsp.JspServlet.service(JspServlet.java:148)at javax.servlet.http.HttpServlet.service(HttpServlet.java:588)at
org.apache.jserv.JServConnection.processRequest(JServConnection.java:456)
atorg.apache.jserv.JServConnection.run(JServConnection.java:294)
at java.lang.Thread.run(Thread.java:479)
j
In this particular case, a SQL statement from Self-Service HR is failing due to a genuine
runtime exception. The code needs to be investigated to determine why the bind types
changed between executions.
Again, try to focus on errors, exceptions, and log messages which appear to be a result of
excessive application logging due to a bug in the product. By default, logging is enabled
at level 6 (Unexpected) in the system test environments, so excessive logging is likely a
genuine product code issue.
Step 3: Monitor the middle-tier JVM log files for OutOfMemory Errors.
10

7/30/2019 Monitoring Environment Ias1022
http://slidepdf.com/reader/full/monitoring-environment-ias1022 11/23
OutOfMemory errors are usually indications of application memory leaks or inefficient
code which may be unnecessarily allocating a lot of memory. Such errors are nearly
impossible to debug at customer sites, hence it is crucial that such errors are investigated
and debugged during the development cycle. You should review the JVM log files (in
the jvm directory) and if any OutOfMemory errors exist, review the log files to determine
the source of the error, and log a bug. If the OutofMemory error is recorded in the log
file without any relevant or surrounding information, you will need to examine the other
log files such as the Apache access_log file to determine which pages were accessed near
the time when the OutOfMemory error was reported. If you have access to the middle-
tier or the file system where the log files exist, you should be able to grep the log files for
the string OutOfMemoryError. For example, if you change directory to
$APACHE_TOP/Jserv/logs/jvm, and then grep ‘OutOfMemoryError’, the files which
contain the OutOfMemory errors will be reported. Example output is as follows:
cd /SLOTS/slot02/appmgr/I10D14M1ora/iAS/Apache/Jserv/logs/jvm
grep OutOfMemoryError *
OACoreGroup.2.stderr:java.lang.OutOfMemoryErrorOACoreGroup.2.stderr:java.lang.OutOfMemoryError
OACoreGroup.2.stderr:java.lang.OutOfMemoryErrorOACoreGroup.2.stderr:java.lang.OutOfMemoryErrorOACoreGroup.2.stdout:[06/14/04 14:29:50.534][Thread-28177][ERROR] java.lang.OutOfMemoryErrorOACoreGroup.3.stderr:java.lang.OutOfMemoryErrorOACoreGroup.3.stderr:java.lang.OutOfMemoryErrorOACoreGroup.3.stderr:java.lang.OutOfMemoryErrorOACoreGroup.3.stderr:java.lang.OutOfMemoryErrorOACoreGroup.3.stderr:java.lang.OutOfMemoryErrorOACoreGroup.3.stderr:java.lang.reflect.InvocationTargetException: java.lang.OutOfMemoryErrorOACoreGroup.3.stderr:java.lang.OutOfMemoryErrorOACoreGroup.3.stderr:java.lang.OutOfMemoryError
OACoreGroup.3.stderr:java.lang.OutOfMemoryErrorOACoreGroup.3.stderr:java.lang.OutOfMemoryErrorOACoreGroup.3.stderr:java.lang.OutOfMemoryErrorOACoreGroup.3.stderr:java.lang.OutOfMemoryError
You can then view the files listed, and try to determine the source of the error.
Debugging OutOfMemory errors may also require you to debug or profile your
11

7/30/2019 Monitoring Environment Ias1022
http://slidepdf.com/reader/full/monitoring-environment-ias1022 12/23
application to check for memory leaks or identify large inefficient allocations. Refer to
the document “Profiling and Tracing OA Based Applications” on our website
(http://www-apps.us.oracle.com:1100/performance) for information on how to use Java
debugging or profiling tools. You can use the profiling tools to generate a complete
memory profile of your application or specific page which you suspect may be causing
the OutOfMemory errors.
Step 4: Monitor the database via the AWR Reports.
AWR is included with 10g database which automatically collects performance data
including database utilization, waits, high load SQL, etc. AWR reports can also be used
to compare different periods such as the performance of the data server between 9:00AM
– 10:00AM versus between 2:00PM – 3:00 PM. By default, an AWR snapshot is
captured every hour.
From SQL*Plus, you can connect to the apps schema, and run the script
$ORACLE_HOME/rdbms/admin/awrrpt.sql. It is important that you use the same
version for your ORACLE_HOME as the database instance version. For example, if the
database is based on 10.2.0.1, then you should use a 10.2.0.1 ORACLE_HOME to run
the awrrpt.sql script. The awrrpt.sql script, once invoked, will list all of the snapshots
(including their times). You should review the AWR reports hourly to ensure that high
load SQLs are being identified and bugs are being logged for those expensive SQLs.
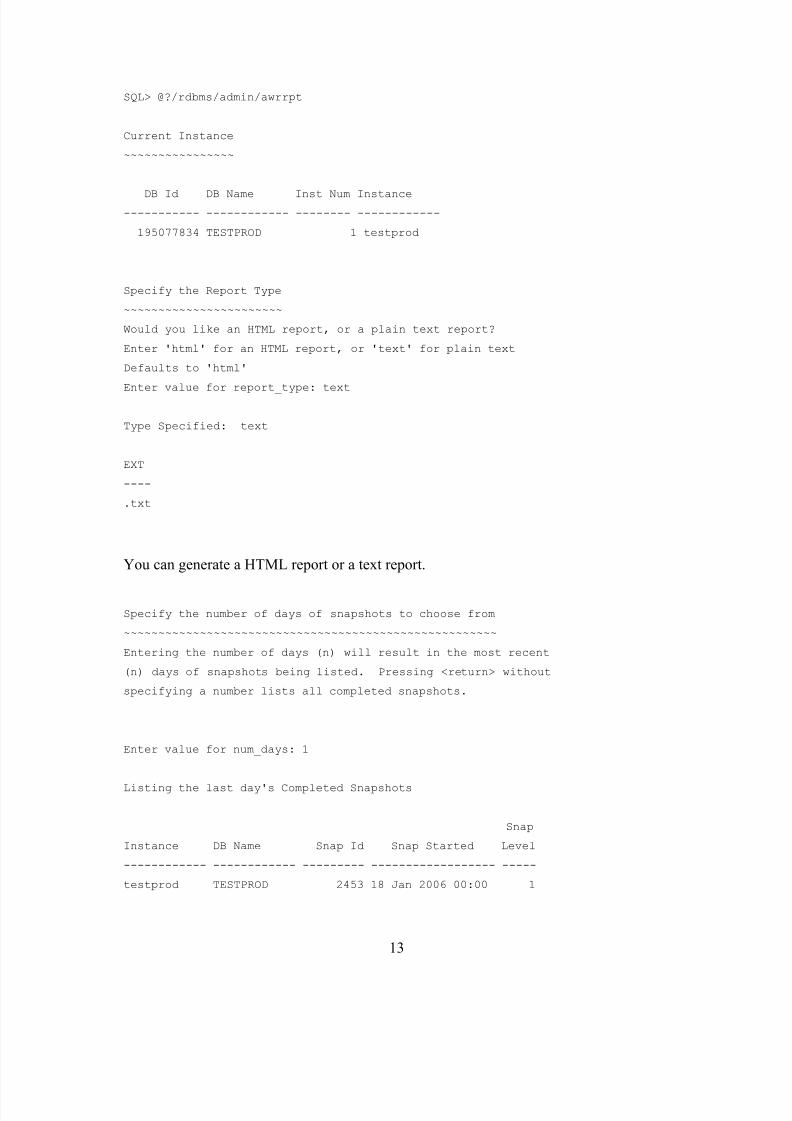
The following is an example run of spreport.sql which then generates a AWR report.
myhost> sqlplus apss/<apps password>@<your TNS_NAME>
SQL> @$ORACLE_HOME/rdbms/admin/awrrpt.sql
The following output will then be listed.
12
7/30/2019 Monitoring Environment Ias1022
http://slidepdf.com/reader/full/monitoring-environment-ias1022 13/23
SQL> @?/rdbms/admin/awrrpt
Current Instance
~~~~~~~~~~~~~~~~
DB Id DB Name Inst Num Instance
----------- ------------ -------- ------------
195077834 TESTPROD 1 testprod
Specify the Report Type
~~~~~~~~~~~~~~~~~~~~~~~
Would you like an HTML report, or a plain text report?
Enter 'html' for an HTML report, or 'text' for plain text
Defaults to 'html'
Enter value for report_type: text
Type Specified: text
EXT
----
.txt
You can generate a HTML report or a text report.
Specify the number of days of snapshots to choose from
~~~~~~~~~~~~~~~~~~~~~~~~~~~~~~~~~~~~~~~~~~~~~~~~~~~~~~
Entering the number of days (n) will result in the most recent
(n) days of snapshots being listed. Pressing <return> without
specifying a number lists all completed snapshots.
Enter value for num_days: 1
Listing the last day's Completed Snapshots
Snap
Instance DB Name Snap Id Snap Started Level
------------ ------------ --------- ------------------ -----
testprod TESTPROD 2453 18 Jan 2006 00:00 1
13
7/30/2019 Monitoring Environment Ias1022
http://slidepdf.com/reader/full/monitoring-environment-ias1022 14/23
2454 18 Jan 2006 01:00 1
2455 18 Jan 2006 02:00 1
2456 18 Jan 2006 03:00 1
2457 18 Jan 2006 04:00 1
2458 18 Jan 2006 05:00 1
2459 18 Jan 2006 06:00 1
2460 18 Jan 2006 07:00 1
2461 18 Jan 2006 08:00 1
2462 18 Jan 2006 09:00 1
2463 18 Jan 2006 10:01 1
2464 18 Jan 2006 11:00 1
2465 18 Jan 2006 12:00 1
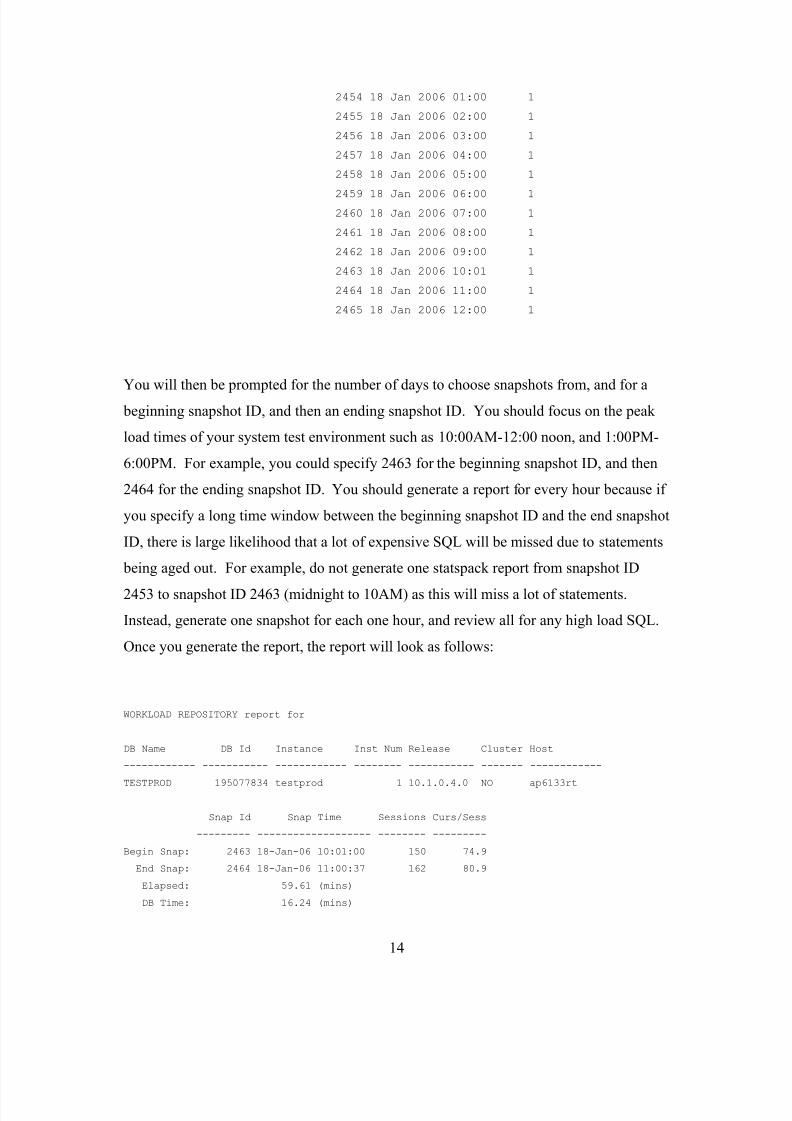
You will then be prompted for the number of days to choose snapshots from, and for a
beginning snapshot ID, and then an ending snapshot ID. You should focus on the peak
load times of your system test environment such as 10:00AM-12:00 noon, and 1:00PM-
6:00PM. For example, you could specify 2463 for the beginning snapshot ID, and then
2464 for the ending snapshot ID. You should generate a report for every hour because if
you specify a long time window between the beginning snapshot ID and the end snapshot
ID, there is large likelihood that a lot of expensive SQL will be missed due to statements
being aged out. For example, do not generate one statspack report from snapshot ID
2453 to snapshot ID 2463 (midnight to 10AM) as this will miss a lot of statements.
Instead, generate one snapshot for each one hour, and review all for any high load SQL.
Once you generate the report, the report will look as follows:
WORKLOAD REPOSITORY report for
DB Name DB Id Instance Inst Num Release Cluster Host
------------ ----------- ------------ -------- ----------- ------- ------------
TESTPROD 195077834 testprod 1 10.1.0.4.0 NO ap6133rt
Snap Id Snap Time Sessions Curs/Sess
--------- ------------------- -------- ---------
Begin Snap: 2463 18-Jan-06 10:01:00 150 74.9
End Snap: 2464 18-Jan-06 11:00:37 162 80.9
Elapsed: 59.61 (mins)
DB Time: 16.24 (mins)
14

7/30/2019 Monitoring Environment Ias1022
http://slidepdf.com/reader/full/monitoring-environment-ias1022 15/23
Cache Sizes (end)
~~~~~~~~~~~~~~~~~
Buffer Cache: 760M Std Block Size: 8K
Shared Pool Size: 244M Log Buffer: 1,024K
Load Profile
~~~~~~~~~~~~ Per Second Per Transaction
--------------- ---------------
Redo size: 58,381.81 7,773.19
Logical reads: 26,040.64 3,467.15
Block changes: 152.23 20.27
Physical reads: 28.85 3.84
Physical writes: 16.61 2.21
User calls: 56.33 7.50
Parses: 37.56 5.00
Hard parses: 0.52 0.07
Sorts: 20.20 2.69
Logons: 0.23 0.03
Executes: 107.83 14.36
Transactions: 7.51
% Blocks changed per Read: 0.58 Recursive Call %: 85.27
Rollback per transaction %: 8.32 Rows per Sort: 281.29
Instance Efficiency Percentages (Target 100%)
~~~~~~~~~~~~~~~~~~~~~~~~~~~~~~~~~~~~~~~~~~~~~
Buffer Nowait %: 100.00 Redo NoWait %: 99.99
Buffer Hit %: 99.96 In-memory Sort %: 100.00Library Hit %: 99.44 Soft Parse %: 98.62
Execute to Parse %: 65.17 Latch Hit %: 99.99
Parse CPU to Parse Elapsd %: 78.20 % Non-Parse CPU: 95.23
Shared Pool Statistics Begin End
------ ------
Memory Usage %: 94.07 90.36
% SQL with executions>1: 68.12 84.58
% Memory for SQL w/exec>1: 48.91 74.87
Top 5 Timed Events
~~~~~~~~~~~~~~~~~~ % Total
Event Waits Time (s) DB Time Wait Class
------------------------------ ------------ ----------- --------- --------------
CPU time 782 80.23
PX Deq Credit: send blkd 75,310 97 9.97 Other
db file sequential read 14,540 64 6.55 User I/O
SQL*Net more data from client 1,504 31 3.19 Network
log file parallel write 28,930 17 1.77 System I/O
15

7/30/2019 Monitoring Environment Ias1022
http://slidepdf.com/reader/full/monitoring-environment-ias1022 16/23
-------------------------------------------------------------
^LWait Events DB/Inst: BISPROD/bisprod Snaps: 2463-2464
-> s - second
-> cs - centisecond - 100th of a second
-> ms - millisecond - 1000th of a second
-> us - microsecond - 1000000th of a second
-> ordered by wait time desc, waits desc (idle events last)
This represents the top portion or summary section of the Statspack report. The report
will also include a high load SQL section including separate sections for high load SQL
by elapsed time, cpu time, buffer gets, physical reads, executions, parse calls, shareable
memory and version count. All sections should be reviewed, and bugs should be filed for
the high load SQL. The AWR report will list the buffer gets, disk reads, number of
executions, and the percentage of load of the SQL. The following is an example of the
high load SQL section (by buffer gets):
Gets CPU ElapsedBuffer Gets Executions per Exec %Total Time (s) Time (s) SQL Id
-------------- ------------ ------------ ------ -------- --------- -------------76,874,621 217 354,260.9 82.5 363.92 369.16 ank8k8ub3hc2s
Module: ASG_USER_CONCSELECT distinct usr.user_name, usr.user_id, grp.responsibility_application_id,grp.responsibility_id FROM fnd_user usr, fnd_user_resp_groups grp WHEREusr.user_name = :1 and usr.user_id = grp.user_id
22,261,186 1 ############ 23.9 322.53 461.98 0gxxxsqf4t0nbModule: BSC_CHANGE_CURRENT_YEARBEGIN bsc_update.run_change_current_year( :errbuf, :rc,:A0,:A1); END;
7,429,246 168 44,221.7 8.0 89.47 102.04 6y44pfmvjbu19Module: JTM_MASTER_CONC_PROGBEGIN JTM_MASTER_CONC_PROG_PUB.DO_REFRESH_MOBILE_DATA( :errbuf, :rc,:A0); END;
In many cases, the SQL may exceed 1,000 characters, and the SQL text shown by AWR
reflects the first 1,000 characters only. In such cases, you should note the hash value of
the SQL, and from SQL*Plus, obtain the full SQL text using the following query:
SQL> select sql_text
16
7/30/2019 Monitoring Environment Ias1022
http://slidepdf.com/reader/full/monitoring-environment-ias1022 17/23
From v$sqltext
Where hash_value=&hash_value
Order by piece;
This will return the full text of the SQL, and you may need to manually format the SQL
to improve readability. Alternatively, html AWR reports include complete sql texts.
Once you have the full SQL either from the above query or the complete text from the
AWR report, you should generate and review the execution plan of the SQL to determine
why the SQL is expensive. You may also need to run the program, which issued this
SQL so that you can generate a complete trace to investigate further. Refer to the SQL
Repository FAQ for information on reviewing the execution plan or tuning the SQL
(http://www-apps.us.oracle.com:1100/atg/performance/sqlrep/SQL_Repository.htm).
Since 9iR2, Statspack/AWR lists the Module name of the originator of the high load SQL
which typically maps to the Form name, concurrent program name, Application Module
name (for OA based applications), or JDBC Thin Client if the SQL originated from a
Java based flow. It is important to note that the module name listed refers to the
originator of the SQL for the first time the SQL was loaded into the shared pool.
Generally, it should be obvious from the SQL statement and the module name as to the
source of the SQL. You might need to grep through the code to find matching SQL
statements in certain cases.
Step 5: Review the high load SQL sections in the Statspack reports.
An AWR report provides (8) high load SQL sections:
• High load SQL by Elapsed Time
• High load SQL by CPU Time
• High load SQL by Buffer Gets
• High load SQL by Disk Reads
• High load SQL by Executions
17

7/30/2019 Monitoring Environment Ias1022
http://slidepdf.com/reader/full/monitoring-environment-ias1022 18/23
• High load SQL by Sharable Memory
• High load SQL by Parses
• High load SQL by Version Count
You should review all the sections and log bugs for all of the expensive SQL listed in all
of the sections. If you are not sure who owns the SQL, log a bug against FND (bug ID
510, component performance), and the performance team will reassign the bug to the
appropriate team. It is better to log a bug (even if the bug is later closed as not a bug)
than ignore the SQL. Refer to the SQL Repository FAQ (http://www-
apps.us.oracle.com:1100/performance/sqlrep/SQL_Repository.htm) for more information
regarding SQL tuning. Again, you should run the concurrent program, Form, or web
page in question so that a complete trace can be generated and reviewed. This will
provide more information and help determine why the SQL is expensive.
Step 6: Check the database for SQLs with literals.
AWR is designed to catch high load SQL statements, but it may not report statements
using literals unless the SQL itself was very expensive. It is important that you
periodically scan your environment for SQLs containing literals, and that you log bugs
for such SQL statements. Applications code must use bind variables, and the use of
literals causes latch contention, out of memory errors, excessive parsing, and impedes
scalability. You should sample your system test environment for literal SQLs frequently
such as every 30 minutes. Literal SQLs are often quickly aged out of the shared pool,
hence only manual sampling is effective in identifying and catching SQL statements
using literals. Use the following SQL to generate a list of statements which potentially
contain literals. You will need to review the list, and log bugs accordingly.
SQL> set pages 1000SQL> spool literals.out
SQL> Select module,hash_value,sql_textfrom v$sqlwhere executions=1order by sql_text;
18
7/30/2019 Monitoring Environment Ias1022
http://slidepdf.com/reader/full/monitoring-environment-ias1022 19/23
SQL> exit;
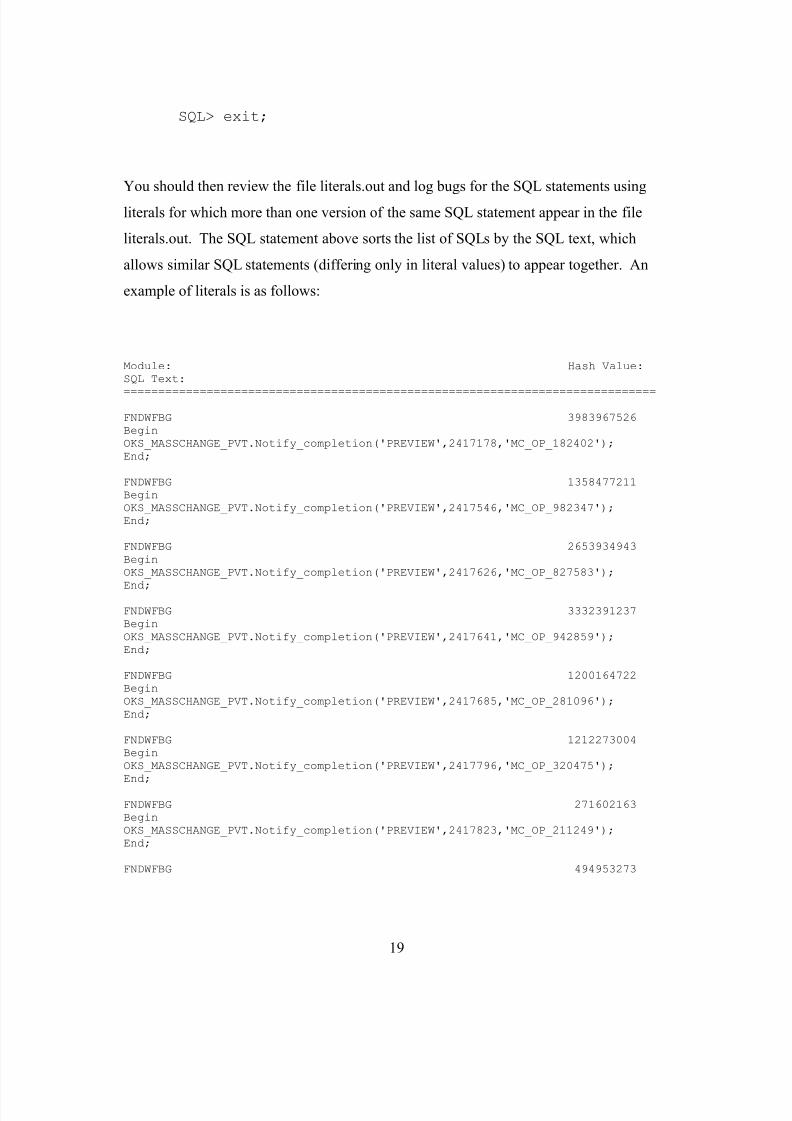
You should then review the file literals.out and log bugs for the SQL statements usingliterals for which more than one version of the same SQL statement appear in the file
literals.out. The SQL statement above sorts the list of SQLs by the SQL text, which
allows similar SQL statements (differing only in literal values) to appear together. An
example of literals is as follows:
Module: Hash Value:SQL Text:=============================================================================
FNDWFBG 3983967526BeginOKS_MASSCHANGE_PVT.Notify_completion('PREVIEW',2417178,'MC_OP_182402');End;
FNDWFBG 1358477211BeginOKS_MASSCHANGE_PVT.Notify_completion('PREVIEW',2417546,'MC_OP_982347');End;
FNDWFBG 2653934943BeginOKS_MASSCHANGE_PVT.Notify_completion('PREVIEW',2417626,'MC_OP_827583');End;
FNDWFBG 3332391237BeginOKS_MASSCHANGE_PVT.Notify_completion('PREVIEW',2417641,'MC_OP_942859');End;
FNDWFBG 1200164722BeginOKS_MASSCHANGE_PVT.Notify_completion('PREVIEW',2417685,'MC_OP_281096');End;
FNDWFBG 1212273004BeginOKS_MASSCHANGE_PVT.Notify_completion('PREVIEW',2417796,'MC_OP_320475');End;
FNDWFBG 271602163BeginOKS_MASSCHANGE_PVT.Notify_completion('PREVIEW',2417823,'MC_OP_211249');End;
FNDWFBG 494953273
19

7/30/2019 Monitoring Environment Ias1022
http://slidepdf.com/reader/full/monitoring-environment-ias1022 20/23
BeginOKS_MASSCHANGE_PVT.Notify_completion('SUBMIT',2417186,'MC_OP_182402');End;
FNDWFBG 316837366BeginOKS_MASSCHANGE_PVT.Notify_completion('SUBMIT',2417557,'MC_OP_982347');
End;
FNDWFBG 2184489007BeginOKS_MASSCHANGE_PVT.Notify_completion('SUBMIT',2417696,'MC_OP_281096');End;
FNDWFBG 3339931539BeginOKS_MASSCHANGE_PVT.Notify_completion('SUBMIT',2417805,'MC_OP_320475');End;
This is an example of contracts code using literals for their workflow activity
Notify_Completion. Although the module name is FNDWFBG (Workflow Background
Engine), the owning code is Oracle Contracts because the Workflow background engine
simply executes the product team code. In this case, a bug should be filed against the
contracts team to use bind variables for this call.
Step 7: Check the database for statement leaks.
SQL statements can also be leaked by forgetting to close the prepared statement or
statement from the Java code. Such leaks can also cause OutofMemory errors, hence it is
important to scan the environment for statement leaks. The following SQL statement can
be used to identify potential leaks. From SQL*Plus (either as the Apps schema or
perfstat schema), run the following query:
column module format A40column program format A30set lines 132set pages 1000
select oc.sid,oc.hash_value,oc.sql_text,count(*)
20

7/30/2019 Monitoring Environment Ias1022
http://slidepdf.com/reader/full/monitoring-environment-ias1022 21/23
from v$open_cursor ocgroup by sid,hash_value,sql_texthaving count(*) > 5order by 4;
The query lists all SQL statements which have more than (5) versions of the same SQL
statement per session. The SQL lists the SID (session ID), hash_value of the SQL
statement, the leading portion of the SQL text, and the version count per session. This
may be an indication that the statement is leaking. Running this query on the drop 14
master environment produced the following output.
SID HASH_VALUE SQL_TEXTCOUNT(*)---------- ---------------------------------------------------------------------- ----------
208 2823804940 SELECTDECODE(PATH_OWNER_DOCID,0,'',JDR_MDS_INTERNAL.GETDOCU 7
252 2823804940 SELECTDECODE(PATH_OWNER_DOCID,0,'',JDR_MDS_INTERNAL.GETDOCU 7
264 2823804940 SELECTDECODE(PATH_OWNER_DOCID,0,'',JDR_MDS_INTERNAL.GETDOCU 7
89 2823804940 SELECT
DECODE(PATH_OWNER_DOCID,0,'',JDR_MDS_INTERNAL.GETDOCU 8259 149134931 SELECT NAME FROM OE_ORDER_SOURCES WHERE
ORDER_SOURCE_ID = 8217 2823804940 SELECT
DECODE(PATH_OWNER_DOCID,0,'',JDR_MDS_INTERNAL.GETDOCU 12
If the SQL text has been truncated, you can use the hash value and query v$sqltext to
obtain the full text as follows:
21

7/30/2019 Monitoring Environment Ias1022
http://slidepdf.com/reader/full/monitoring-environment-ias1022 22/23
select s.sql_textfrom v$sqltext swhere s.hash_value= &hash_valueorder by s.piece;
Bug Logging Format:
All performance issues identified in a R12 System Test environment should be logged as
follows:
• Component Version: 12.0.
• Abstract: APPSPERFR12: <product short name>: <description of
the issue>. For example, APPSPERFR12: OKS: Literals being
used for the Notify_Completion call.
• Fixby field should be set to ???
• Priority should be 2.
• Dev. Priority should be 1.
• Make sure the bug text includes a link to the environment details
page so developers can access the environment to check file
versions etc
If you need help triaging a performance issue, please send an email to appsperf_us.
Before filing a bug, search webiv.oraclecorp.com and see if the bug has already been
filed. For example, for connection leak bugs, you can often find an existing bug with the
same stack trace by using the class name of the first non-FND class and the word “leak”.
For example, a search for “ieu JTFDBSession leak” in webiv will return some existing
bugs with identical stack traces reported.
Bug Logging Help:
22
7/30/2019 Monitoring Environment Ias1022
http://slidepdf.com/reader/full/monitoring-environment-ias1022 23/23
Sometimes developers will ask for database and machine access information. For
database login, ask them to use apps_read_only/apps, which should be setup already as a
read-only account. For machine access, point them to the enviroment details page which
usually lists the details including a read-only account to access the machine. We should
not give out apps password and machine login for appmgrXX users.
Since we are just monitoring the environment, it’s difficult to find out which sequence of
actions caused the error/leak. If a developer sets the bug to status 30 and asks for a
reproducible test case, please just explain the above and set it back to 11. For connection
leak bugs, ask the developer to look at the stack trace and see if he/she can figure out why
the connection is leaked (e.g. exception not handled properly).
For error messages found in log files, make sure you identify which portion of the error
message you are logging the bug on. Avoid pasting in a large section of the log that
contains different error messages (it may take some educated guessing as to which lines
constitute one error message).
For example, in bug 5006528, the following line was found in the stack trace in an error
found in the JVM log file:
at _oa__html._aslUploadEngine._jspService(_aslUploadEngine.java:5286)
This suggests the error is coming from aslUploadEngine.jsp, which is owned by ASL
(Sales Offline). You could login to the machine where the error was found, cd
$COMMON_TOP/_pages/_oa__html and search for * jspname*.java (in this case,
search for *aslUploadEngine*.java) and look at the source code.
For other java files, you can find the file in source control by doing cd
<product>dev/<product>/12.0/java (e.g /fnddev/fnd/12.0/java)
For PL/SQL, you can access find the file in source control by doing cd
<product>dev/<product>/12.0/patch/115/sql (e.g /fnddev/fnd/12.0/patch/115/sql)