Embed Size (px)
Citation preview

GHS MONITORING AND EVALUATION PLAN 2010-2013
1
qwertyuiopasdfghjklzxcvbnmqwerty
uiopaslzxcvbnmqwertyuiopasdfghjkl
zxcvbnmrtyuiopasdfghjklzxcvbnmqw
ertyuiopasdfghjklzxcvbnmqwertyuio
pasdfghjklzxcvbnmqwertyuiopasdfgh
jklzxcvbnmqwertyuiopasdfghjklzxcv
bnmqwertyuiopasdfghjklzxcvbnmqw
ertyuiopasdfghjklzxcvbnmqwertyuio
pasdfghjklzxcvbnmqwertyuiopasdfgh
jklzxcvbnmqwertyuiopasdfghjklzxcv
bnmrtyuiopasdfghjklzxcvbnmqwerty
uiopasdfghjklzxcvbnmqwertyuiopasd
fghjklzxcvbnmqwertyuiopasdfghjklzx
cvbnmqwertyuiopasdfghjklzxcvbnmq
wertyuiopasdfghjklzxcvbnmqwertyui
opasdfghjklzxcvbnmqwertyuiopasdfg
hjklzxcvbnmqwertyuiopasdfghjklzxc
vbnmqwertyuiopasdfghjklzxcvbnmq
Monitoring and Evaluation Plan
GHANA HEALTH SERVICE
GHS MONITORING AND EVALUATION PLAN 2010-2013
2
ACKNOWLEDGEMENT
The Development of this Monitoring and Evaluation Plan has been made possible
with the support of all the divisions within the Ghana Health Service. Key individuals
who contributed to the write up and technical review have been recognized in the
document. The Ghana Health Service is most grateful to all who took time of their
busy schedule to contribute their technical expertise to the development of this
document.
We are also very grateful to the Medical Sciences for Health who provided funding
for the writers workshop, the technical review meetings and the printing of this
document through the TB CARE 1 Project.
We humbly acknowledge the contributions of all other individuals who may have
contributed to the development of this document but have not been mentioned by
name.

GHS MONITORING AND EVALUATION PLAN 2010-2013
3
FOREWORD
The Ghana Health Service has over the years been implementing different
programme of Work and have been reporting on its performance. There is an
elaborate system to ensure that the Ghana Health Service accounts for its
stewardship. The processes involved in doing this are in various documents. This
effort to document these monitoring and evaluation processes in one document is
one of the important steps in the overall attempt to improve the monitoring and
evaluation within the service and ensure accountability within the service.
It is hoped that this document will provide direction for Districts, Regions, Divisions
and Programs to better monitor and evaluate the implementation of their programme
of work.
Thank You
Dr Frank Nyonator
Ag. Director General
Ghana Health Service.

GHS MONITORING AND EVALUATION PLAN 2010-2013
4
LIST OF TABLES
Table 1: Participants at Writers Meeting
Table 2: Participants at Document Finalization Meeting
Table 3: Monitoring and Evaluation Calender
Table 4: Roles and Responsibilities of Divisions
Table 5: Stakeholders in the Health Sector
Table 6: Timeline for Data Submission
Table 7: Financial Reporting Framework
Table 8: M&E Activities
Table 9: Budget for M&E
LIST OF FIGURES
Fig 1: Institutional Monitoring and Evaluation Framework

GHS MONITORING AND EVALUATION PLAN 2010-2013
5
List of Acronyms
ACT Artemesinin Combination Therapy
AFP Acute Flaccid Paralysis
AIDS Acquired Immunodeficiency Syndrome
ANC Ante Natal Care
ART Anti-Retroviral Therapy
ARV Anti-Retroviral
BCG Bacillus Calmette-Guérin Vaccine
BMC Budget Management Centers
CEmONC Comprehensive Emergency Obstetrics and Neonatal Care
CHAG Christian Health Association of Ghana
CHIM Centre for Health Information Management
CHO Community Health Officers
CHPS Community-based Health Planning and Services
CHW Community Health Workers
CSO Civil Society Organization
CYP Couple Years of Protection
DA District Assembly
DDHS Director of District Health Services
D-G Director General
DHIMS District Health Information Systems
DHMT District Health Management Team
DHS Demographic and Household Survey
EmONC Emergency Obstetrics and Neonatal Care
EPC Environmental Protection Council
EPI Expanded Programme on Immunization
FHD Family Health Division
GHS Ghana Health Service
GOG Government of Ghana
HASS Health Administration and Support Services
HIO Health Information Officer
HIRD High Impact Rapid Delivery
HIV Human Immunodeficiency Virus
HO Health Sector Objective
HRD Human Resource Division
HRDD Health Research and Development Division
HSMTDP Health Sector Medium-Term Development Plan
ICD Institutional Care Division
ICT Information and Communications Technology
IGF Internally Generated Funds
IALC Inter-Agency Leadership Committee
IME Information, Monitoring and Evaluation Department
IPT Intermittent Preventive Treatment
IT Information Technology
ITN Insecticide Treated bed-Net

GHS MONITORING AND EVALUATION PLAN 2010-2013
6
LDP Leadership Development Programme
LI Legislative Instrument
MDG Millennium Development Goals
MICS Multi-Indicator Cluster Survey
MLGRD Ministry of Local Government and Rural Development
MOFEP Ministry of Finance and Economic Planning
MOH Ministry of Health
MOWAC Ministry of Women and Children’s Affairs
M&E Monitoring and Evaluation
NACP National AIDS Control Programme
NCD Non-Communicable Disease
NDPC National Development Planning Commission
NGOs Non-Governmental Organization
OPD Out-Patient Department
OPV Oral Polio Vaccine
NMCP National Malaria Control Programme
NTP National Tuberculosis Control Programme
PHD Public Health Division
PNC Post Natal Care
POW Programme of Work
PPME Policy Planning Monitoring and Evaluation Division
PPP Public Private Partnerships
RDHS Regional Director of Health Services
RDT Rapid Diagnostic Test
SBS Sector Budget Support
SD Skilled Delivery
SP Sulfadoxine Pyrimethamine
TB Tuberculosis
TBA Traditional Birth Attendance
USB Universal Serial Bus
WIFA Women in the Fertile Age

GHS MONITORING AND EVALUATION PLAN 2010-2013
7
Table of Contents
LIST OF TABLES ................................................................................................................................. 4
1. INTRODUCTION ............................................................................................................................... 9
1.1. BACKGROUND ......................................................................................................................... 9
1.2. RATIONALE .............................................................................................................................. 9
1.3. PROCESS OF DEVELOPING THE M&E PLAN ........................................................................... 10
2. SITUATIONAL ANALYSIS ................................................................................................................ 12
2.1 SWOT Analysis of the GHS Monitoring and Evaluation System .................................................. 12
2.1.1. Strengths ....................................................................................................................... 12
2.1.2. Weaknesses................................................................................................................... 13
2.1.3. Opportunities ................................................................................................................ 14
2.1.4. Threats .......................................................................................................................... 14
3. PROGRAM DESCRIPTION AND FRAMEWORK ............................................................................... 15
4. INSTITUTIONAL ARRANGEMENT ................................................................................................... 39
4.1. MANDATE OF THE GHANA HEALTH SERVICE ........................................................................ 39
4.2. M&E MANDATE AND FUNCTIONS OF DIVISIONS ................................................................. 43
7. M&E ACTIVITIES ....................................................................................................................... 47
7.1. Roles and Responsibilities within GHS ........................................................................... 47
7.2. SUPPORT FOR M&E PROCESS FOR DIVISIONS AND PROGRAMS .......................................... 52
7.3. STAKEHOLDER ANALYSIS ....................................................................................................... 52
7.4. M&E CONDITIONS AND CAPACITIES ..................................................................................... 53
7.4.1. CAPACITY FOR MONITORING AND EVALUATION ......................................................... 53
7.4.2. TECHNICAL ASSISTANCE ................................................................................................ 54
7.4.3. STORAGE OF INFORMATION ......................................................................................... 54
7.4.4. EQUIPMENT AND LOGISTICS ......................................................................................... 55
8. THE MONITORING AND EVALUATION PROCESS ........................................................................... 56
8.2. REVIEW PROCESS IN THE GHANA HEALTH SERVICE ............................................................. 56

GHS MONITORING AND EVALUATION PLAN 2010-2013
8
8.3. USE OF DATA FOR DECISION-MAKING .................................................................................. 57
8.4. PLAN FOR EVALUTAION ........................................................................................................ 58
9. QUALITY ASSURANCE .................................................................................................................... 59
9.1. Ensuring Data Quality ........................................................................................................... 59
9.2. Improving the quality of data collection ............................................................................... 59
9.3. Standard Operating Procedures ........................................................................................... 60
9.4. Improving Timeliness, Completeness and Accuracy of Transmitted data ............................ 60
9.5. Data Quality Audit ................................................................................................................. 61
9.6. Feedback Processes .............................................................................................................. 61
9.7. Documentation ..................................................................................................................... 62
10. REPORTS .................................................................................................................................... 63
10.1. REPORTING MILESTONES .................................................................................................. 63
10.2. PROGRAMMES/PROJECT MONITORING ........................................................................... 63
10.3. FINANCIAL REPORTS ......................................................................................................... 63
10.4. FINANCIAL AUDIT REPORTS .............................................................................................. 64
10.5. GHANA HEALTH SERVICE REPORT ..................................................................................... 64
11. GOALS AND OBJECTIVES OF THE MONITORING AND EVALUATION SYSTEM
WITHIN THE GHANA HEALTH SERVICE .................................................................................... 65
11.1. STRATEGIES TO ADDRESS MONITORING AND EVALUATION GAPS .................................. 65
12. M&E ACTIVITIES, TIMELINES AND BUDGET ................................................................. 67
TABLE 8: M&E Activities and Timelines ..................................................................................... 67
APPENDIX 1. .......................................................................................................................................... 74
INDICATORS TARGETS AND MILESTONES FOR MONITORING AND EVALUATION ................................ 74

GHS MONITORING AND EVALUATION PLAN 2010-2013
9
1. INTRODUCTION 1.1. BACKGROUND
The Ghana Health Service (GHS) annual program of work (POW) are developed
from the Health Sector Medium-Term Development Plan (HSMTDP) - 2010-2013
and they mirror the government’s development agenda for the medium term and are
aligned with the national objective of attaining middle income status by 2015. The
HSMTDP 2010- 2013 builds on the general principle of providing affordable primary
health care (PHC) that is both cost-effective and ensures equitable access to
healthcare for all people living in Ghana. The HSMTDP has been synchronized with
the third 5-year POW which is truncated to allow for consistency in the development
and provision of health services.
The HSMTDP 2010 - 2013, was developed through an elaborate consultative
process involving key stakeholders including development partners, and non-
governmental actors in Ghana’s health industry. It is based on the broad guidelines
of the National Development Planning Commission (NDPC). The consultation
process was further enhanced by a series of key stakeholder consultations at the
national, regional and district levels involving development partners, health sector
NGOs, health workers and other sector collaborators such as the Ministry of Local
Government and Rural Development (MLGRD), Ministry of Women and Children’s
Affairs (MOWAC) and Environmental Protection Council (EPC).
The GHS which is the largest service agency of the Ministry of Health (MoH) will
contribute significantly to the achievement of the sector indicators. GHS provides
public health and clinical services at both primary and secondary levels. The
Service operates at the national, regional, district, sub-district and community levels.
It serves as the main representative of the MoH at these levels, providing
supervisory, monitoring and evaluation (M&E) support. Through its Centre for Health
Information Management (CHIM) service data is collected using DHIMS at all levels.
The District Health Information Management System (DHIMS) database is the
platform for collecting, collating and analyzing health data. The reports generated
from this database feed into the sector-wide indicators, milestones and programme
indicators used for monitoring and evaluation.
1.2. RATIONALE
The GHS is accountable for its stewardship as defined in the HSMTDP. There is the
need therefore for arrangements and processes that will measure the performance,
track objectives, milestones and set targets to ensure that resources are efficiently
deployed to achieve the greatest impact, and keep the Service on track. The
development and implementation of an M&E plan will provide guidance in the
implementation of GHS POW derived from the HSMTDP to achieve set objectives

GHS MONITORING AND EVALUATION PLAN 2010-2013
10
and targets. It will also make an allowance for identifying challenges to
implementation for timely and appropriate remedial measures to be taken. The GHS
M&E plan will also delineate the roles of Divisions and Programmes in the M&E
process and guide overall stakeholder involvement in measuring health sector
performance.
1.3. PROCESS OF DEVELOPING THE M&E PLAN
The M&E plan is built on existing M&E arrangements and processes in the health
sector. The indicators and milestones for assessing the performance of the Service
are derived from sector wide indicators which were developed through elaborate
consultations with stakeholders facilitated by the Ministry of Health. Indicators and
targets from other strategic documents and some existing M&E plans were also
adopted.
The process of developing the sector wide indicators began with internal
consultations at agency level. Following these, submissions were made to the
Ministry of Health accentuating the need to either modify the tools for assessment or
modify targets, indicators, or milestones. These submissions were consolidated and
circulated widely to stakeholders for consideration and comments. Additional
contributions were received from other stakeholders, particularly the health sector
development partners.
The Divisions within the Service provided the targets for the various indicators as
defined under the Health Sector objectives.
The development of the GHS M&E plan began with a zero draft prepared by the
Policy Planning Monitoring and Evaluation Division (PPMED) of the GHS. Existing
documentation on the M&E processes within the Service were pulled together and a
three-day consensus and writing workshop was held at the Dodowa Forest Hotel
from the 6th- 8th September 2011 with stakeholders from the MoH and GHS to put
together the final M&E plan. Management Sciences for Health (MSH) through TB
CARE I Project provided both technical and financial support to facilitate to the
workshop. The Dodowa team comprised the following:
Table 1: Participants at Writers Meeting
No Names Designation
1 Dr. Anthony Ofosu Ag. Deputy Director, IME/PPME
2 Ms. Ekui Dovlo Principal Human Resource Manager
3 Dr. Boateng Boakye District Director of Health Services – Ashanti Region
4 Dr. Bert Schreuder Consultant, KNCV Tuberculosis Fund
5 Dr. Rhehab Chimzizi TB CARE I Project Country Manager, MSH
6 Ms. Eunice Sackey Program Officer Reproductive and Child Health
7 Dr. Linda Vanotoo Regional Director of Health Services –Western Region
8 Dr. Ofori Yeboah District Director of Health Services – Central Region

GHS MONITORING AND EVALUATION PLAN 2010-2013
11
9 Dr. Paul Ntodi Regional Hospital Medical Director – Western Region
10 Ms. Mabel Segbafah Health Educator - GHS
11 Dr. Beatrice Heymann M & E Specialist - GHS
12 Mr. Isaac Akumah Administrator, PPME
13 Mr. Francis Victor Ekey Ag. Deputy Director, Planning - HRDD
14 Dr. Cynthia Bannerman Ag. Director, Institutional Care Division
15 Dr. Felix Afutu TB Control Program Officer
16 Ms. Hilda Smith MSH TB Project Officer
17 Mr. Prince Asante Health Service Administrator
18 Mrs. Esi Amanful Nutritionist – GHS/HQ
19 Mr. Daniel Darko Head, Centre for Health Information Management
20 Mr. Daniel Osei Ag. Director, Policy Planning Monitoring & Evaluation Division - GHS
21 Dr. Edward Antwi Deputy Director, Public Health – Greater Accra Region
22 Dr. John Eleezar Deputy Director, Public Health – Central Region
23 Dr. Alex Nazzar Public Health Specialist - GHS
24 Dr. Constance Bart-Plange
Program Manager, National Malaria Control Programme (NMCP)
25 Dr. Daniel Asare Regional Hospital Medical Director – Eastern Region
26 Mr. Daniel Degbotse M & E Specialist - MOH
27 Mr. Ransford Akorli Deputy Chief Accountant - GHS
28 Dr. Kyei-Farried Deputy Director, Disease Control
29 Mrs. Ramatu Ude Umanta Ag. Director, Finance Division - GHS
30 Mr. Bernard Asamany Ag. Deputy Director, Procurement and Logistics - GHS
Following this meeting further corrections were made into the documents and
another team was put together to work on finalizing the document. This meeting took
place from 12th- 14th December 2011 at the ERATA Hotel in Accra. Present at this
meeting were:
Table 2: Participants at Document Finalization Meeting
No Names Designation
1 Dr. Anthony Ofosu Ag. Deputy Director, IME/PPME
2 Dr Kyei Faried Deputy Director Disease Control
3 Dr Patrick Aboagye Deputy Director Reproductive and Child Health
4 Mr Isaac Akumah Health Services Administrator- PPMED
5 Ms Eunice Sackey Program Officer Reproductive and Child Health
6 Mr Ekow Biney Institutional Care Division
7 Dr Alex Nazzer Public Health Specialist - PPMED
8 Mr. Daniel Darko Head, Centre for Health Information Management
9 Dr. Rhehab Chimzizi TB CARE I Project Country Manager, MSH

GHS MONITORING AND EVALUATION PLAN 2010-2013
12
2. SITUATIONAL ANALYSIS
Monitoring and Evaluation within the GHS depends largely upon monthly routine
service data generated from all districts and sub-districts. In Ghana, almost all the
yearly health sector reviews and the aide memoires have called for an improvement
in the existing health information system for better decision-making and supporting
the health system to deliver on key interventions and to achieve set objectives within
the PoW and the MDGs.
Apart from these routine data, the health sector also collaborates with stakeholders
such as the Ghana Statistical Service (GSS) and research institutions to undertake
periodic health surveys and sentinel studies including the Demographic and
Household Survey (DHS) and the Multi-indicator Cluster Survey (MICS). Such
surveys provide the health sector with additional information for monitoring and
evaluation that contributes to policy-making and re-strategizing.
The Health Sector, in an attempt to improve access to an integrated service data
developed and successfully deployed the DHIMS software in 2008 within the health
sector. This was to help district, regional and national managers to improve on the
collation and analyses of routine service data.
Service registers are provided at service delivery points in all health facilities to
accumulate client demographic and healthcare information. This information
constitutes the primary data sources for monitoring and evaluation within the service.
Standard forms are used to manually summarize data from these service registers
monthly for transmission to the District level. At the District level, the DHIMS is used
to collate and analyze the data and it also provides the platform for sending this data
to the Regional level.
2.1 SWOT Analysis of the GHS Monitoring and Evaluation System
2.1.1. Strengths
Planning of the M&E process
M&E plans included in majority of service delivery activities and POW
M&E being done for service delivery at all levels
Implementation of M&E plans and activities
Data collation and analysis usually takes place at all levels
Reduced vertical data reporting system and multiple databases
Standardized data entry forms available
Specialized programmes have designated budget for M&E

GHS MONITORING AND EVALUATION PLAN 2010-2013
13
DHIMS is used at all levels in the health sector.
Evaluation of POW and Sector Performance via M&E activities
National Division PPME tasked with coordinating M&E in the health sector
Bi-Annual Health Summit of stakeholders’ that evaluates health sector
performance
An annual Independent Review of sector performance
Outcomes of performance reviews jointly addressed
Joint monitoring visits among MOH and its agencies institutionalized.
Dissemination of Information
Results of M&E activities at all levels collated and published periodically.
Periodic Performance Reviews and data validation meetings organized at all
levels in the health sector
Reports of Independent reviews widely disseminated.
2.1.2. Weaknesses
Workforce gap
Inadequate understanding of M&E procedures and processes
Inadequate M&E skills and capacity to conduct M&E activities.
Resource Management gap
Occasional stock-outs of data collection tools
Data collection tools not regularly updated.
Inadequate linkage between input, output and outcomes within
sector/programme budget
Inadequate guidance and processes for setting targets.
Weak process indicators
Inadequate tracking of resources
No Standard Operating Procedures documented for data management
Inadequate documentation on existing M&E processes
The incomplete use of the DHIMS software by districts to collate and report on
routine service data
Very low coverage of private facilities service data
Leadership and Governance gap
M&E is not given the needed attention at all levels.

GHS MONITORING AND EVALUATION PLAN 2010-2013
14
Inadequate monitoring of M&E plans at all levels
Very little commitment to M&E processes
Weak process monitoring.
M&E not included in planning at all levels
Lack of a platform to link service parameters to governance parameters
Lack of two-way accountability at all levels
No sector goals for M&E system
Weak feedback mechanisms and use of data to revise planning and
implementation activities
2.1.3. Opportunities
Health Training Institutions available to deepen understanding on M & E
Global interest for results tracking and data management.
Increasing availability of ICT solutions.
2.1.4. Threats
Political influence and government’s priorities
Global economic instability
Donor driven parallel M&E systems
To address these gaps strategies will be developed to address issues relating to
Health Workforce, resource management and Leadership and governance.

GHS MONITORING AND EVALUATION PLAN 2010-2013
15
3. PROGRAM DESCRIPTION AND FRAMEWORK HO1: Bridging equity gaps in access to health care and nutrition services, and ensure sustainable
financing arrangements that protect the poor
Strategies Priority action Activity Division Responsible
Output Indicator Outcome Indictor
Impact Indicator
1.1 Strengthen district health system with a particular emphasis on primary health care
1.1.1 Improve coverage of PHC services at sub-district level through community health systems
Review of the CHPS strategy
PPMED-GHS
Number of new functional zones
Percentage of OPD cases seen and treated by CHOs. Outpatients visits per capita Proportion of
Cases of vaccine preventable diseases seen.
New functional CHPS zones operationalised
District Health Management Teams / Regional Health Management Teams
Provide accommodation, transportation and service delivery kits
District Health Management Teams / Regional Health Management Teams
Number of functional CHPS zones with Service delivery kits available.
1.1.2 Leadership capacity development of district and sub-district teams
Train sub-district teams to support approved service providers in the sub-district
HRD-GHS Number of sub-district teams trained under LDP
Maternal Mortality ratio
GHS MONITORING AND EVALUATION PLAN 2010-2013
16
Strengthen DHMTs and develop the District Health Departments to operate in accordance with LI 1961
HRD-GHS Number of DHMTs trained under LDP
funds obtained from non-traditional(GOG) sources
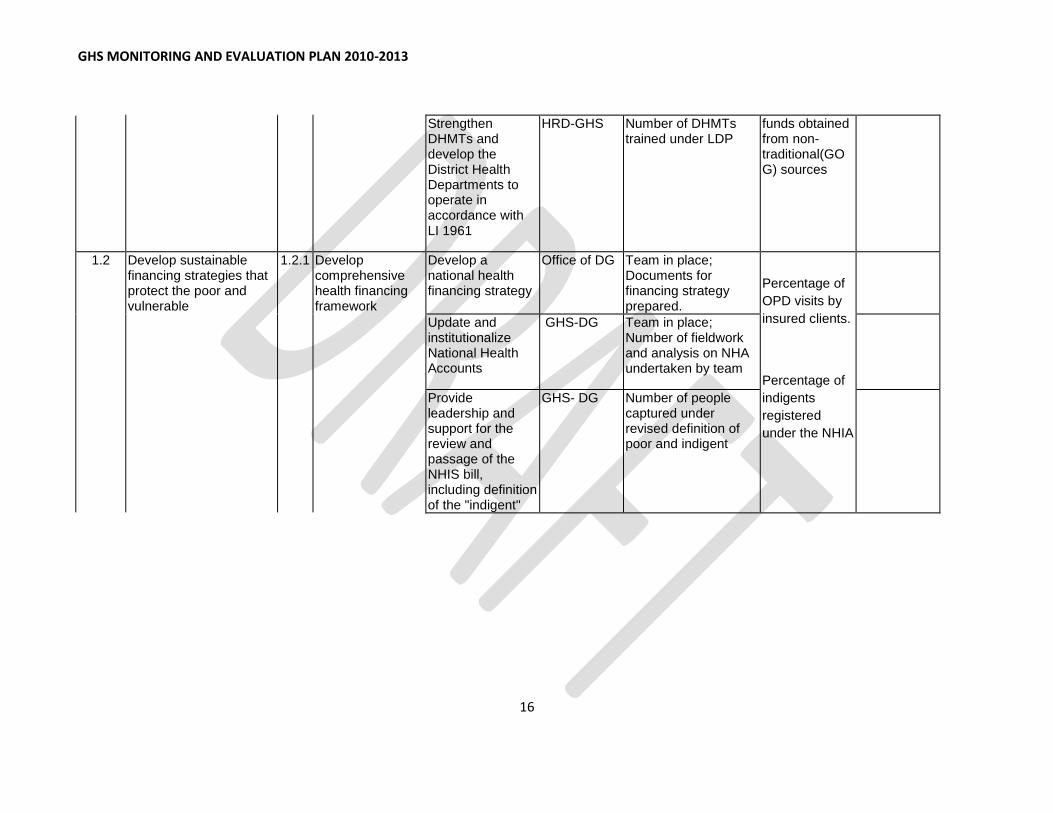
1.2 Develop sustainable financing strategies that protect the poor and vulnerable
1.2.1 Develop comprehensive health financing framework
Develop a national health financing strategy
Office of DG Team in place; Documents for financing strategy prepared.
Percentage of
OPD visits by
insured clients.
Percentage of
indigents
registered
under the NHIA
Update and institutionalize National Health Accounts
GHS-DG Team in place; Number of fieldwork and analysis on NHA undertaken by team
Provide leadership and support for the review and passage of the NHIS bill, including definition of the "indigent"
GHS- DG Number of people captured under revised definition of poor and indigent

GHS MONITORING AND EVALUATION PLAN 2010-2013
17
HO1: Bridging equity gaps in access to health care and nutrition services, and ensure sustainable financing arrangements that protect the poor
Strategies Priority action Activity Division Responsible
Output Indicators
Outcome Indicators
Impact Indicators
1.3 Increase availability and efficiency of human resources
1.3.1 Revise and implement the Human Resource Strategy
Develop a new HR strategy
HRD-GHS New strategy document available
Nurse per capita ratio.
Doctor per capita ratio
Medical Assistant per capita ratio
Midwife per
capita ratio
Review establishments, staffing norms and develop and implement deployment plan
HRD-GHS
Agree and implement incentive package to public health sector workers in under-served areas
HRD-GHS Number of staff in deprived areas benefitting from Incentive package agreed upon.
Number of resident community nurses(CHO)
Proportion of doctors working in deprived areas.
Infant mortality rate Under five mortality rate Maternal mortality ratio
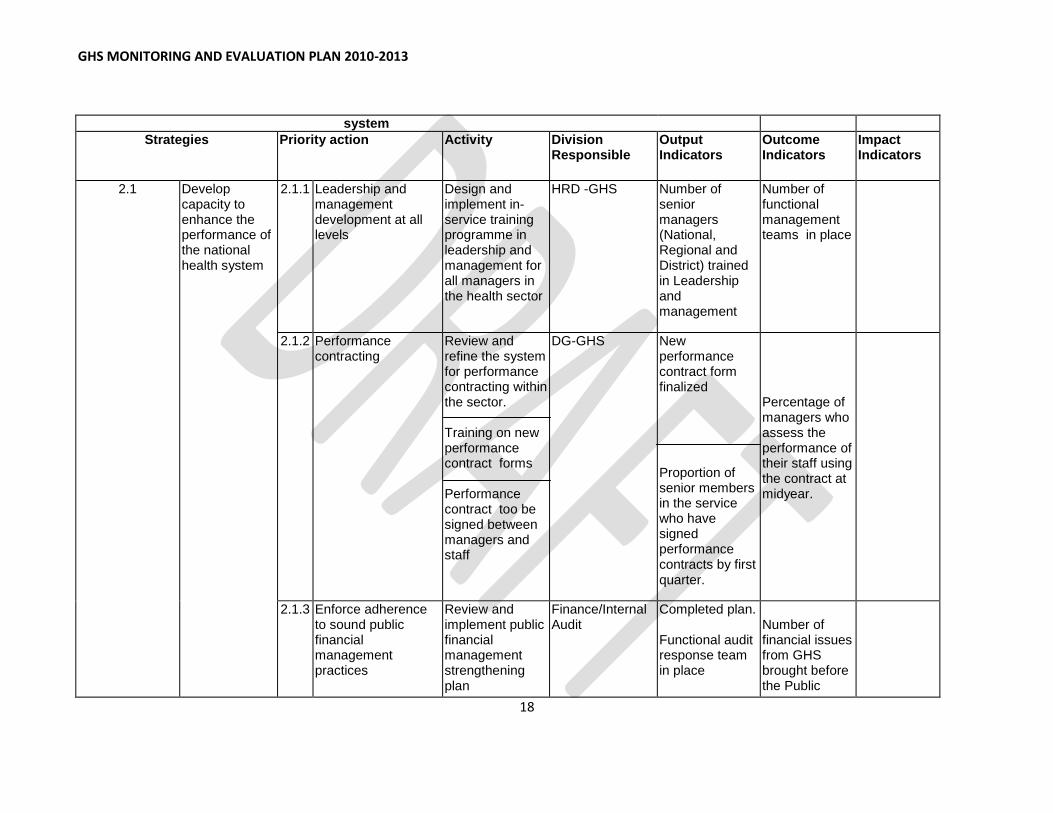
HO2: Strengthen governance and improve the efficiency and effectiveness of the health
GHS MONITORING AND EVALUATION PLAN 2010-2013
18
system
Strategies Priority action Activity Division Responsible
Output Indicators
Outcome Indicators
Impact Indicators
2.1 Develop capacity to enhance the performance of the national health system
2.1.1 Leadership and management development at all levels
Design and implement in-service training programme in leadership and management for all managers in the health sector
HRD -GHS Number of senior managers (National, Regional and District) trained in Leadership and management
Number of functional management teams in place
2.1.2 Performance contracting
Review and refine the system for performance contracting within the sector. Training on new performance contract forms Performance contract too be signed between managers and staff
DG-GHS New performance contract form finalized
Proportion of senior members in the service who have signed performance contracts by first quarter.
Percentage of managers who assess the performance of their staff using the contract at midyear.
2.1.3 Enforce adherence to sound public financial management practices
Review and implement public financial management strengthening plan
Finance/Internal Audit
Completed plan. Functional audit response team in place
Number of financial issues from GHS brought before the Public

GHS MONITORING AND EVALUATION PLAN 2010-2013
19
Build Capacity for resource tracking
Number of staff trained in resource tracking
Accounts Committee Percentage Distribution of funds by levels within the health sector. Percentage of funds used for intended activities,

GHS MONITORING AND EVALUATION PLAN 2010-2013
20
HO2: Strengthen governance and improve the efficiency and effectiveness of the health system
Strategies Priority action Activity Division Responsible
Output Indicators
Outcome Indicators
Impact Indicators
2.3 Strengthen inter-sectoral collaboration and public-private partnerships
2.3.1 Improve partnership for health by engaging the private sector.
Implement the private sector policy
GHS-DG Number of PPP meetings held
Number of private public partnerships (MOUs) established within the service.
Establish advisory committee on PPP
PPMED-GHS Advisory committee in place
Promote inter-sectoral coordination
GHS to be part of the development of District Assemblies composite planning
District Health Management Teams.
Number of meetings held with DA.
Number of social services sub-committee meetings attended by DDHS.
District plans with priority Health component included
Percentage of Priority health projects jointly implemented.
Infant mortality rate Maternal mortality ratio
Strengthen
FHD Number of meetings held with the
Nutritional status indicators(

GHS MONITORING AND EVALUATION PLAN 2010-2013
21
Collaboration on school health education activities at all levels(healthy lifestyles)
SHEP coordinators Number of joint visits undertaken
Wasting, stunting, underweight and obesity)
Collaborate with National Commission for Civic Education to engage in mass public education campaigns to promote healthy lifestyles in the population -Material production -Advocacy for use of materials -Support campaigns
GHS- ICD/FHD Health Promotion unit
Number and types of health education materials produced for NCCE. Number of advocacy and training sessions held between GHS and NCCE. Number of Joint mass campaigns undertaken
Public awareness indicators. Behaviour change indicators
HO2: Strengthen governance and improve the efficiency and effectiveness of the health system
Strategies Priority action Activity Division Responsible
Output Indicators
Outcome Indicators
Impact Indicators
2.4 Strengthen systems that use evidence for policy formulation
2.4.1 Develop a monitoring and evaluation plan
Prepare and implement a national M& E framework for the Ghana Health Service.
PPME-GHS GHS M&E plan developed. Number of ME Reports
Improved performance –using the relevant indicators -quality
Infant mortality rate Under- five mortality rate

GHS MONITORING AND EVALUATION PLAN 2010-2013
22
Number of ME Feedback
-coverage -Case fatality -evidence based decisions
Maternal Mortality ratio
Establish district league table and reward system
Regional Health Management Teams
Number of Regions with District league table and reward system in place
Dropout rates(Immunization drop-out rate Cure rate/case detection rate Workload indicators( Number of children immunized/each community health nurse)
2.4.2 Implement and coordinate a national research agenda
Allocate dedicated recurrent budget to health research
DG Percentage of Item 3 GOG/SBS in ring-fenced budget allocated to research. Proportion of research agenda budget that funds are provided for.
.
Number of research publications.
Proportion of research recommendations carried to policy

GHS MONITORING AND EVALUATION PLAN 2010-2013
23
Number of approved research grants.
Disseminate the national health research agenda
HRU Number of Research agenda dissemination fora.
Proportion of research proposals submitted to the Ethics review board that is aligned with the national research agenda.
Conduct operational research /clinical trials.
HRU Number of reports available
Number of policy decisions taken based on research findings
Strengthen health information management
Implement the DHIMS II
PPME Number of districts/ Headquarters divisions trained in the use of DHIMSII
Percentage of districts using DHIMS II. Percentage of Divisions, Programmes and departments sourcing data from DHIMSII Morbidity and mortality indicators.

GHS MONITORING AND EVALUATION PLAN 2010-2013
24
Percentage of districts with evidence of analysis and giving feedback to reporting level
HO3: Improve access to quality maternal, neonatal, child and adolescent services
Strategies Priority actions Activities Division Responsible
Output Indicators
Outcome Indicators
Impact Indicators
3.1 Reduce the major causes contributing to maternal and neonatal deaths
3.1.1 Implement the MDG Acceleration Framework Country Action Plan for improved maternal and newborn care
Increase access to modern FP services
FHD Number of facilities offering FP services
Modern Contraceptive prevalence rate Couple year protection
Institutional Maternal
mortality ratio
Increase coverage of skilled delivery
FHD Number of midwives per expected deliveries.
Average number of ANC visits per registrants
Total Deliveries.
Total stillbirths Total Live Births
Percentage of ANC Registrants
Percentage of ANC clients making 4+visits
Proportion of registrants receiving IPT1, IPT 2and IPT3
Tetanus toxoid coverage rate

GHS MONITORING AND EVALUATION PLAN 2010-2013
25
Proportion of stillbirths to total deliveries Proportion of deliveries by skilled attendants. Proportion of institutional maternal deaths audited.
Finalize and implement recommendations of the report on EmONC assessment
FHD National and Regional EmONC Reports
Percentage of Health Centres providing BEmONC Percentage of District Hospitals providing CEmONC
Institutional
maternal
mortality ratio
Strengthen implementation of Life Saving Skills at district and sub-district level and build Regional Resource Teams
FHD Percentage of district and sub-district staff trained in LSS; Proportion of Regions with resource teams
Total number of vacuum deliveries performed Total number of manual removals of placenta done.

GHS MONITORING AND EVALUATION PLAN 2010-2013
26
HO 3: Improve access to quality maternal, neonatal, child and
adolescent services
Strategies Priority actions Activities Division Responsible
Output Indicators
Outcome Indicators
Impact Indicators
3.1 (cont) Reduce the major causes contributing to maternal and neonatal deaths
Implement the MDG Acceleration Framework Country Action Plan for improved maternal and newborn care
Evaluate the implementation of the free maternal delivery
FHD Free maternal delivery evaluation report available and disseminated
Raise awareness on socio-cultural barriers to access to maternal and newborn care
GHS Improved awareness
Improve access to safe blood for expectant mothers and newborns
ICD Number of New blood storage facilities provided in health facilities
Proportion of requested blood for pregnant women that are made available Total transfusion volume
Institutional Maternal Mortality Ratio.
3.2 Reduce the major causes contributing to child morbidity and deaths
3.2.1 Implement the Child Health Policy and Strategy
Increase the uptake of EPI services
PHD Number of EPI outreach points
Measles coverage for under one year
Percentage of children immunized by age one for Penta 3.
Institutional Infant mortality rate

GHS MONITORING AND EVALUATION PLAN 2010-2013
27
Percentage of children immunized by age one for Polio 3
Percentage of children immunized by age one for BCG
Infant mortality rate(DHS)
Train health workers in IMNCI the use of ORS and Zinc to manage diarrhoea
FHD Number of Health workers trained in IMNCI.
Proportion of facilities with functional ORT corners. Diarrhoea case fatality rate
Train relevant Community Health Workers (CHWs) on integrated Community Case Management of Diarrhoea/Pneumonia/Malaria
FHD Number of CHW Trained and implementing CCM
Number of districts trained in Community Case Management for major childhood killers
Percentage of districts implementing community case management for childhood killers

GHS MONITORING AND EVALUATION PLAN 2010-2013
28
Scale up school health programmes
FHD Number of Schools inspected
Number of children referred. Nutritional status of children
Child mortality rate
3.3 Improve adolescent health
3.3.1 Implement adolescent health policy and strategy
Implement priority activities under adolescent health strategy
FHD- Adolescent Health
Number of Priority activities implemented
Percentage of pregnant women attending antenatal who are adolescents
3.4 Improve nutritional status of women and children
3.4.1 Develop and implement National Nutrition Policy and Strategy
Develop National Nutritional policy and strategy
FHD- Nutrition Documents finalized and disseminated
Proportion of districts with nutrition priority interventions reflecting in their action plans
Scale-up essential nutrition actions for women and children
FHD-Nutrition Essential nutrition actions scaled up to cover 3 regions
Percentage of under five who are under weight presenting at facility and outreach.
Malnutrition rates(DHS)

GHS MONITORING AND EVALUATION PLAN 2010-2013
29
HO 4: Intensify prevention and control of communicable and non-communicable diseases and promote healthy lifestyles
Strategies Priority Action Activity Division Responsible
Output Indicator
Outcome Indicator
Impact Indicator
4.1 Improve upon prevention, detection and case management of communicable diseases.
4.1.1 Prevention and control of communicable diseases
Perform routine immunization as well as Implement supplementary immunization activities. Provide immunization for selected epidemic prone diseases.
PHD-EPI Number of routine EPI outreach points Number of new vaccines introduced
Non-AFP Polio rate. Immunization coverage Percentage Fully immunized Drop-out rate Left out rate Vaccine wastage rate AEFI
Vaccine preventable morbidities and mortalities
4.1.2 Prevention, detection and management of HIV/AIDS, TB and Malaria
Implement national strategic plans to reduce new HIV infections
PHD-NACP Number of people tested and counseled for HIV. Number/Percentage tested HIV positive Number/Percentage of eligible HIV clients on ARV
.Number /Percentage of cases alive and on ART. Number /Proportion of children born to HIV positive mothers put on ART who are negative after 18months,
Percentage of young women and men aged 15-24 who are HIV infected.
Survival rate of cases put on ART.
ART Resistance level

GHS MONITORING AND EVALUATION PLAN 2010-2013
30
Number of HIV positive pregnant women put on ART.
Implement national strategic plans to increase TB case notification and treatment success rate
PHD -NTP Number of new and relapse cases. Number/Percentage of new and previously treated TB patients confirmed MDR-TB. Number/Percentage of total TB cases who are health workers
-TB case notification rate – TB treatment success rate
Case Fatality rate for Tuberculosis
Incidence and mortality rate(WHO Annual report)
Expand coverage of ITN/Ms
PHD-NMCP Number of ITN hanged
Percentage children under five years who sleep under ITNs. Percentage of pregnant

GHS MONITORING AND EVALUATION PLAN 2010-2013
31
women who sleep under ITNs
Number/Percentage of Households with hanged nets
Implement national strategic plans to reduce malaria case fatality among pregnant women and children
PHD-NMCP Number of prescribers trained in the new malaria treatment protocols
Percentage of patients treated with ACT
Maternal mortality ratio Under five mortality rate
4.1.3 Prevention, detection and management of diseases of epidemic potential and those targeted for eradication
Maintain status and validate eradication of guinea worm and polio
PHD-NMCP Number of cases of guinea worm reported.)
Number of cases of wild polio confirmed.
Non-Polio AFP rate. Percentage of guinea worm cases contained
Increase activities for the control of onchocerciasis, lymphatic filariasis,schistosomiasis, Buruli and elimination of yaws and leprosy
PHD-NTDs Number of reported cases of NTD. Coverage of mass treatment
Prevalence rate of the NTDs

GHS MONITORING AND EVALUATION PLAN 2010-2013
32
for Oncho, shisto, LF and soil helminthes. Fly infectivity rate for
Early detection and rapid response to epidemic prone diseases
PHD-DCD/DS
Number of epidemic prone diseases confirmed.
Case fatality rate of diseases
4.2 Improve prevention, detection and management of non communicable diseases
4.2.1 Implement Regenerative Health and Nutrition Programme
Establish network of stakeholders and train them to implement RHNP Promote healthy lifestyle awareness among the general population
FHD-Health Promotion Unit
Number of stakeholders trained and able to carry out their roles in the national strategy. Number and types of RHNP programmes held
Number of stakeholders with defined workplace arrangements for promoting RHNP. Measure of awareness
Practice of Healthy lifestyle(DHS)
4.2.2 Scale up detection and management of non-communicable diseases
Establish National NCD Steering committee and define its terms of reference.
PHD-NCD Committee established and active Minutes ,reports and guidelines

GHS MONITORING AND EVALUATION PLAN 2010-2013
33
Expand screening programmes for selected non-communicable diseases: hypertension, diabetes, sickle cell and selected cancers.
PHD-NCD ICD
Number of persons screened and treated for selected NCDs
Proportion of Institutional deaths Attributable to NCDs
Increase effective clinical management of NCDs
ICD Number of facilities with Essential equipment Number of hospital teams trained to manage non-communicable diseases. Number of facilities that have institutionalized collecting of data on risk determinant for NCDs from OPD clients(eg BP, BMI)
Percentage of OPD cases that is due to NCDs Case fatality rate For NCDs
Prevalence of NCDs

GHS MONITORING AND EVALUATION PLAN 2010-2013
34
HO5 Improve institutional care, including mental health service delivery
Strategies Priority actions Activities Division Responsible
Output Indicator
Outcome Indicator
Impact Indicator
5.1 Increase access to Mental Health Services
5.1.1 Ensure the passage and operationalization of the Mental Health Act
Advocate for the passage of the Mental Health Bill
ICD-Mental Health
Mental Health Act available and operational
Decentralized mental health services. Number of treatment centers for mental Health. Availability of resource- human financial and medication Number of human rights- abuses( chaining and mechanical restraints ) reported
Develop community mental health strategy
ICD-Mental Health
Community mental health strategy developed
5.1.2 Establish mental health services in all health facilities
Establish community and facility-based mental health services
ICD/Mental Health
Proportion of District Hospitals with mental health units
Registered
cases.
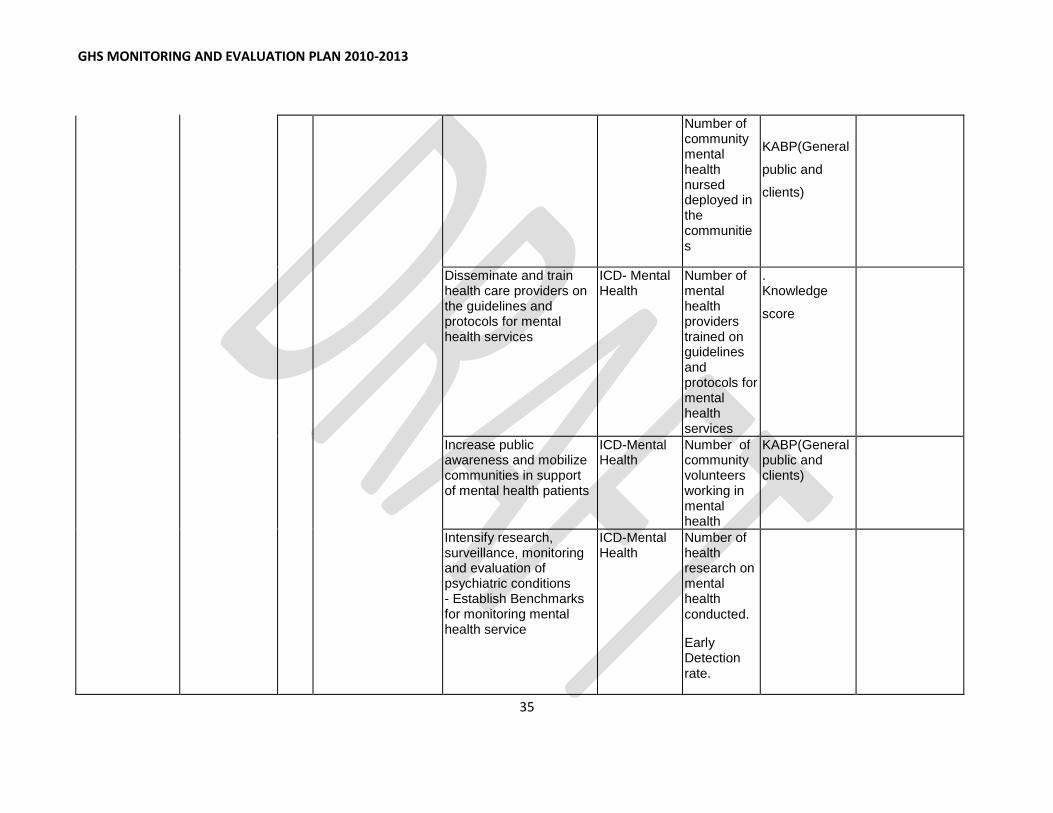
GHS MONITORING AND EVALUATION PLAN 2010-2013
35
Number of community mental health nursed deployed in the communities
KABP(General
public and
clients)
Disseminate and train health care providers on the guidelines and protocols for mental health services
ICD- Mental Health
Number of mental health providers trained on guidelines and protocols for mental health services
. Knowledge
score
Increase public awareness and mobilize communities in support of mental health patients
ICD-Mental Health
Number of community volunteers working in mental health
KABP(General public and clients)
Intensify research, surveillance, monitoring and evaluation of psychiatric conditions - Establish Benchmarks for monitoring mental health service
ICD-Mental Health
Number of health research on mental health conducted.
Early Detection rate.

GHS MONITORING AND EVALUATION PLAN 2010-2013
36
5.2 Enforce standards, guidelines and protocols to improve the quality of institutional care
5.2.1 Ensure availability and use of standards and protocols
Review and develop standard protocols and guidelines for institutional care including referrals
ICD Number of health institutions with Standard protocols and guidelines for institutional care. Proportion of guidelines with checklist and job aids
Client satisfaction Provider satisfaction. Treatment outcome measures e.g. Disability prevention, Case fatality rate.
Ensure the availability of equipment and infrastructure
Develop and implement medical equipment replacement plan
HASS Equipment replacement plan in place and implemented
Availability measure
HO5 Improve institutional care, including mental health service delivery
Strategies Priority actions Activities Division Responsible
Output Indicator
Outcome Indicator
Impact Indicator
GHS MONITORING AND EVALUATION PLAN 2010-2013
37
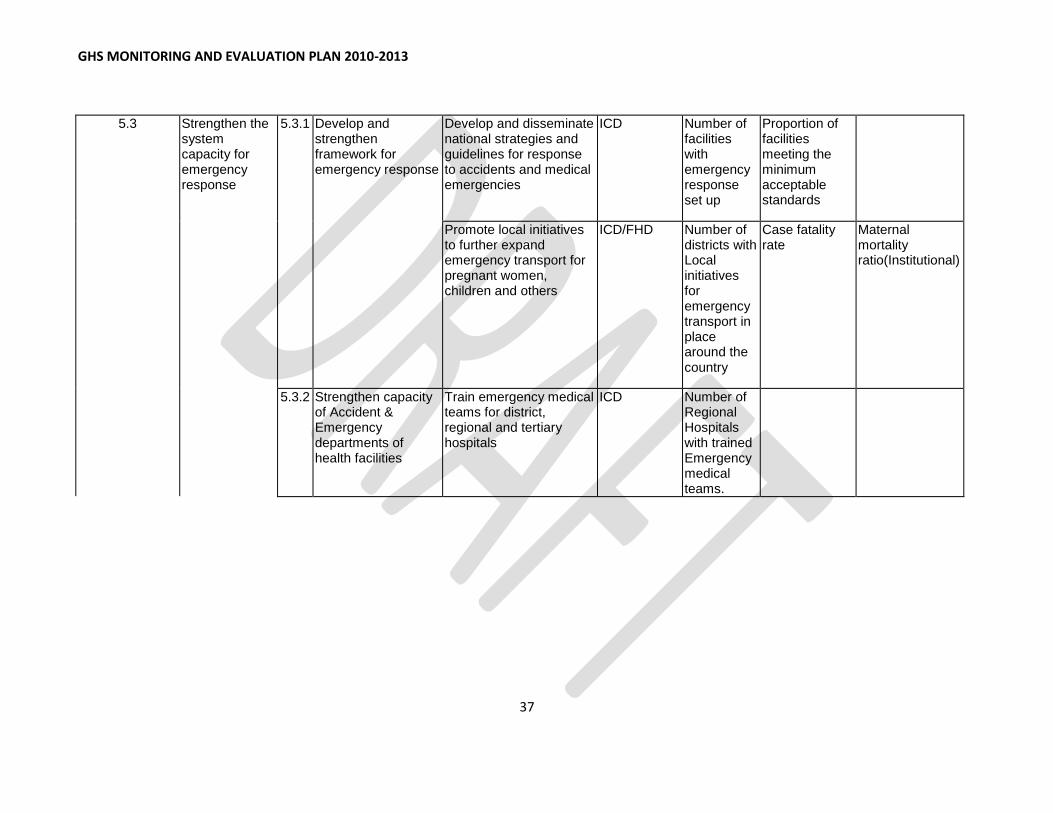
5.3 Strengthen the system capacity for emergency response
5.3.1 Develop and strengthen framework for emergency response
Develop and disseminate national strategies and guidelines for response to accidents and medical emergencies
ICD Number of facilities with emergency response set up
Proportion of facilities meeting the minimum acceptable standards
Promote local initiatives to further expand emergency transport for pregnant women, children and others
ICD/FHD Number of districts with Local initiatives for emergency transport in place around the country
Case fatality rate
Maternal mortality ratio(Institutional)
5.3.2 Strengthen capacity of Accident & Emergency departments of health facilities
Train emergency medical teams for district, regional and tertiary hospitals
ICD Number of Regional Hospitals with trained Emergency medical teams.

GHS MONITORING AND EVALUATION PLAN 2010-2013
38

GHS MONITORING AND EVALUATION PLAN 2010-2013
39
4. INSTITUTIONAL ARRANGEMENT
4.1. MANDATE OF THE GHANA HEALTH SERVICE
The mandate of the GHS is to implement services, monitor and evaluate those services, and
report to the MoH. The PPME division of GHS provides the leadership role through the
coordination of all monitoring and evaluative activities in the Service. The main focus of the
PPMED is to monitor the implementation of key policies and allocate resources to other divisions
within the GHS.
GHS has also been given the mandate to collect health service data from private, mission, and
quasi-government facilities. To facilitate this, an elaborate system for gathering service data and
other information is operational within the Service. GHS also uses the DHIMS as its central
software for collecting data from the districts. There are however, other parallel data collection
systems, largely driven by the Global initiatives.
Data is gathered from the community, sub-district, district, regional, and national levels through
the DHIMS. The DHIMS is a Microsoft Access based software used at the District, Regional and
National levels to collate, transmit and analyze health data. Each health facility and administrative
unit gathers such information as required and transmits the information to the succeeding level of
the health delivery system. The DHIMs collects data and information on both program and
service utilization transmitted through the various levels to the Center for Health Information
Management (CHIM). The data collected from these levels provide the basis for monitoring
performance in the Service. This also feeds into the sector wide performance review process
which is organized annually. Web-based software for data collection, analysis and reporting
DHIMS2 has been developed and deployed.

GHS MONITORING AND EVALUATION PLAN 2010-2013
40
MONITORING AND EVALUATION FRAMEWORK OF GHANA HEALTH SERVICE
LOGICAL FRAMEWORK
Verifiable
indicators
Means of verification Assumptions
HEALTH
SECTOR
GOAL
To improve
access to
quality health
care
Maternal
Mortality ratio
Under-five
mortality rate
Neonatal
mortality rate.
Life expectancy
GDHS
MICS
An assumption is made that
improvement in access to
quality health care will reduce
mortality
PURPOSE1 Bridge equity
gaps in access
to health care
and ensure
sustainable
financing
arrangements
that protect
the poor
Number of CHPS
zones made
functional
Percentage of OPD cases seen and treated by CHOs.
Outpatients visits
per capita
Routine Service
reports
Provision of close to clients
service delivery using CHPS
will address the geographical
accessibility as well bridge
equity gaps in access
PURPOSE2 Strengthen
governance
and improve
Number of senior managers (National, Regional and District) trained in Leadership and
Training reports Annual BMC reports
The training being given to
managers will provide them
with the skills to manage the

GHS MONITORING AND EVALUATION PLAN 2010-2013
41
the efficiency
and
effectiveness
of the health
system
management
Number of functional management teams in place
service better at whatever
level they might be.
PURPOSE 3 Improve
access to
quality
maternal,
neonatal,
child and
adolescent
health and
nutrition
services
Institutional Maternal Mortality Ratio. Skilled delivery coverage Measles vaccination coverage. Institutional Infant mortality rate Infant mortality Rate Percentage of children under five years who are stunted
Routine Service
reports
DHS
PURPOSE 4 Intensify
prevention
and control of
communicable
and non-
communicable
diseases and
promote
healthy
lifestyles
Intensify
prevention
and control of
Percentage of young women and men aged 15-24 who are HIV infected. Malaria under five case fatality rate TB case notification rate Prevalence of NCDs
HIV Sentinel
Surveillance Reports
Routine service
reports
Special Survey

GHS MONITORING AND EVALUATION PLAN 2010-2013
42
communicable
and non-
communicable
diseases and
promote
healthy
lifestyles
PURPOSE 5 Improve
institutional
care, including
mental health
service
delivery
Number of
treatment
centers for
mental Health.
Number of
district Hospitals
with mental
health units
Bed occupancy
rare
Average length
of stay
Bed turn over
rate
BMC reports
BMC reports
Routine service
reports
GHS MONITORING AND EVALUATION PLAN 2010-2013
43
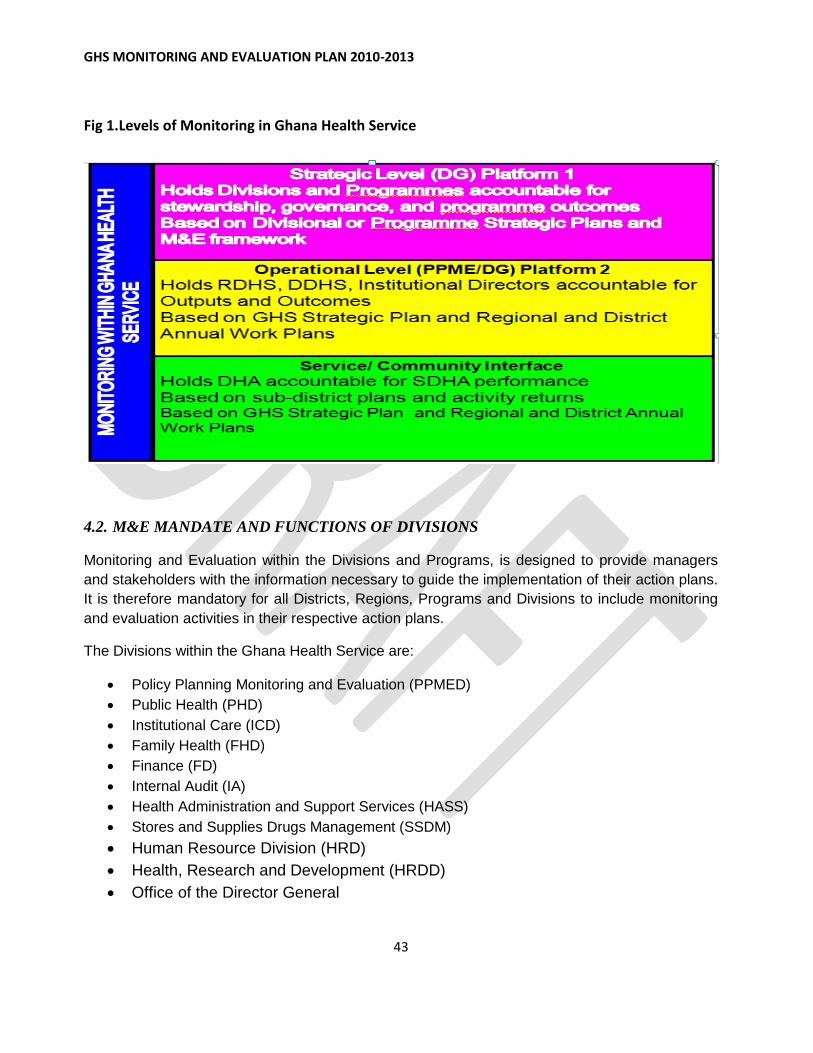
Fig 1.Levels of Monitoring in Ghana Health Service
4.2. M&E MANDATE AND FUNCTIONS OF DIVISIONS
Monitoring and Evaluation within the Divisions and Programs, is designed to provide managers
and stakeholders with the information necessary to guide the implementation of their action plans.
It is therefore mandatory for all Districts, Regions, Programs and Divisions to include monitoring
and evaluation activities in their respective action plans.
The Divisions within the Ghana Health Service are:
Policy Planning Monitoring and Evaluation (PPMED)
Public Health (PHD)
Institutional Care (ICD)
Family Health (FHD)
Finance (FD)
Internal Audit (IA)
Health Administration and Support Services (HASS)
Stores and Supplies Drugs Management (SSDM)
Human Resource Division (HRD)
Health, Research and Development (HRDD)
Office of the Director General

GHS MONITORING AND EVALUATION PLAN 2010-2013
44

GHS MONITORING AND EVALUATION PLAN 2010-2013
45
Table 3: MONITORING AND EVALUATION CALENDAR
Activities Time Frame Actors
1st Quarter 2
nd Quarter 3
rd Quarter 4th Quarter
Jan
Feb
Mar
Apr
Ma
y
Jun
Jul
Au
g
Se
p
Oct
No
v
De
c
Sub-district data validation meetings
Sub-district Teams
District data validation meetings
DHMT
Regional data validation meetings
RHMT
Supervision and Monitoring visits
DHMT,RHMT and IME-PPMED
District performance reviews
Sub-District Teams ,DHMT and RHMT
Regional Annual and Half year performance reviews
DHMT, RHMT ,GHS Headquarters, MOH and DPs
National GHS Head-quarters Annual and Half year Performance reviews
Divisions in GHS
Senior Managers Meetings
GHS Headquarters, RHMTs,

GHS MONITORING AND EVALUATION PLAN 2010-2013
46
Technical Review meetings(TB, HIV, Malaria, RCH)
Specialized programs Programme Managers, RHD, GHS Headquarters
Joint Monitoring Visit
MOH, Agencies of MOH, DPs
Health Summit MOH, Agencies of MOH, DPs
IME working Group Meeting
MOH, Agencies of MOH, DPs
IALC meetings
ICC meetings(EPI, FP)

GHS MONITORING AND EVALUATION PLAN 2010-2013
47
7. M&E ACTIVITIES
7.1. Roles and Responsibilities within GHS
The Divisions within the Ghana Health Service in implementing their mandate contribute
to monitoring and evaluation process
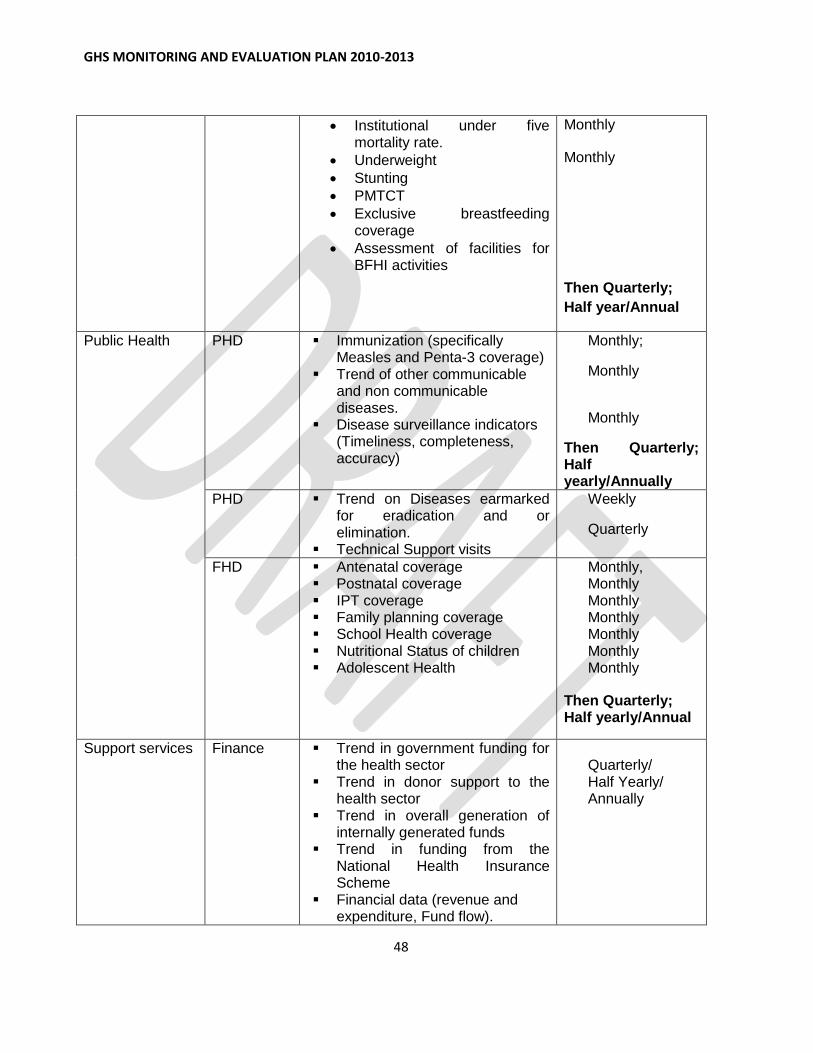
Table 4: Roles and Responsibilities of Divisions
Category of service provision
Division Type of information Frequency
1. Clinical Care
ICD
Outpatient attendance Outpatient morbidity Inpatient admissions Inpatient deaths Death Audits Inpatient morbidity Inpatient mortality Differential use of services by
patient categories
Statement of In-Patient Admissions, Discharges and Deaths
Bed Occupancy Rates Surgical Operation Returns Total number of beds
Bed Turnover Rate Average length of stay Infection rate for caesarian
sections. Laboratory Reports Imaging Reports
Technical Support visits
Monthly Monthly Monthly Monthly Monthly Monthly Monthly Monthly Monthly Monthly Monthly Monthly Monthly Monthly Monthly Monthly Monthly Monthly Then Quarterly; Half year/Annual Quarterly
FHD Supervised delivery rate Caesarian section rate Institutional Maternal mortality
rate Midwifery Returns Stillbirths Proportion of maternal deaths
audited Institutional Infant Mortality rate
Monthly; Monthly
Monthly
Monthly
Monthly
GHS MONITORING AND EVALUATION PLAN 2010-2013
48
Institutional under five mortality rate.
Underweight
Stunting
PMTCT
Exclusive breastfeeding coverage
Assessment of facilities for BFHI activities
Monthly
Monthly
Then Quarterly;
Half year/Annual
Public Health
PHD Immunization (specifically Measles and Penta-3 coverage)
Trend of other communicable and non communicable diseases.
Disease surveillance indicators (Timeliness, completeness, accuracy)
Monthly;
Monthly
Monthly
Then Quarterly; Half yearly/Annually
PHD Trend on Diseases earmarked for eradication and or elimination.
Technical Support visits
Weekly
Quarterly
FHD Antenatal coverage Postnatal coverage IPT coverage Family planning coverage School Health coverage Nutritional Status of children Adolescent Health
Monthly, Monthly Monthly Monthly Monthly Monthly Monthly
Then Quarterly; Half yearly/Annual
Support services
Finance Trend in government funding for the health sector
Trend in donor support to the health sector
Trend in overall generation of internally generated funds
Trend in funding from the National Health Insurance Scheme
Financial data (revenue and expenditure, Fund flow).
Quarterly/ Half Yearly/ Annually

GHS MONITORING AND EVALUATION PLAN 2010-2013
49
Revenue and expenditure data Funds for Monthly Capitations for Primary care (NHIA)
Monthly
HASS
State of public health
facilities
State of Central &
Regional Medical Stores
Equipment and logistics
situation of the public health
facilities
Cost of replacing
equipment
Equipment
Maintenance in the public health
facilities
Planned preventive
maintenance activities
Status of projects under
implementation in the sector
Number of health
facilities by level and location,
including CHPS compounds and
ownership
Estate management
Quarterly/ Half-yearly/ Annually
SSDM Procurement; Procurement Plan Logistic Cycle: 1. Accuracy of Logistics Data for
Inventory Management (LMIS).
2. Percentage of facilities that
received their orders according
to schedule (Distribution).
3. Percentages of facilities that
completed and submitted LMIS
Quarterly Half -Yearly Annually

GHS MONITORING AND EVALUATION PLAN 2010-2013
50
report (LMIS).
4. Percentage of facilities that
maintain acceptable storage
conditions (Warehousing)
5. Percentage availability of
Tracer medicines (Product
Availability)
6. Percentage availability of non-
medicine consumables
(Product Availability)
7. Mean Absolute Percentage
Error (MAPE) between
forecasted consumption and
Actual consumption
(Forecasting)
8. Average percentage difference
between consumption forecasts
and actual consumption
(Forecasting)
9. Percentage of stock wasted
due to expiration or damage
(Warehousing and Inventory
management).
10. Average Delivery Time
(Distribution)
11. Percentage Procurement spend
to total expenditure
(Procurement)
12. Average lead time for
Procurement Methods
(Procurement)
ICT
NCT

GHS MONITORING AND EVALUATION PLAN 2010-2013
51
RFQ
13. Average lead time from Award
of Contract to delivery
(Procurement)
ICT
NCT
RFQ
14. Percentage of procurement
executed through
ICT
NCT
RFQ
15. Percentage of staff trained in
Logistics management (LMIS)
16. Percentage of Procurement
and Supply Officers at post.
17. Percentage of procurement
executed with PPA approval.
18. Percentage of procurement
executed without PPA
approval.
Human Resource Human resource for service delivery by category( Recruitments, Wastage – Retirement; Death, Vacation of Post)
In-Service Trainings
Quarterly; Half-
yearly/ Annually
Monthly, Quarterly;
Half-yearly; Annually

GHS MONITORING AND EVALUATION PLAN 2010-2013
52
7.2. SUPPORT FOR M&E PROCESS FOR DIVISIONS AND PROGRAMS
The Centre for Health Information Management (CHIM) should provide the needed data
set for the divisions and programs on monthly basis to assist the monitoring and
evaluation process of the divisions and programs.
7.3. STAKEHOLDER ANALYSIS
There are several stakeholders collaborating with the GHS providing financial and
technical support to the process of policy formulation, planning, and monitoring and
evaluating performance. There is a second group of stakeholders who consume
healthcare services and/or information for the improvement of personal and/or their
community’s health and then provide valuable feedback to the service.
Table 7.2 highlights key stake holders in the health sector indicating the roles they play.
TABLE 5. STAKE HOLDERS IN THE HEALTH SECTOR
Stakeholders Roles and responsibilities
Local community Demand accountability, assist in community
surveillance, community mobilization and other
infrastructure support, etc.
District Assembly Policy formulation, development planning and
financial, infrastructure and equipment support
Ghana Health Service Council Policy formulation and coordination. Provides
authorization and guidance for the Director
General of the Service
Regional Coordinating Council Policy formulation, coordination of planning
and development, resource mobilization
Ministries, Departments and Agencies in
the health sector
Policy formulation and coordination &
collaboration
Parliament/ Select Committee on Health Supports planning, monitoring and evaluation
of health programs, resource mobilization &
allocation, advocacy
Political Parties Policy formulation and monitoring
Governments performance, advocacy,
lobbying

GHS MONITORING AND EVALUATION PLAN 2010-2013
53
Development Partners Provides technical assistance, financial
support
Civil Societies Advocacy for health, community and resource
mobilization community empowerment through
education, demand accountability
Academia Support research, training, policy formulation
and technical assistance
Faith based organization Support service delivery,
Private providers Support service delivery
7.4. M&E CONDITIONS AND CAPACITIES
7.4.1. CAPACITY FOR MONITORING AND EVALUATION
Traditionally, the GHS utilizes medium term plans (POW) drawn from the HSMTDP.
Annual POW is also developed to guide the activities of the Service for each year. GHS
has personnel at all levels involved in the M&E process. However, the workload
especially at sub-district, district and regional levels overwhelms staff strength and
capacities at these levels. The National level has an M&E unit within the PPMED but no
similar arrangement exists to support M&E activities at the Regional and District levels.
The M&E roles at these levels tend to form part of the shared responsibility of the District
and Regional Health Management Teams.
At the Regional level and within the Headquarters Divisions, staff have varying
competency in M&E. The Global Fund Programmes have a relatively more elaborate set-
up, which is well resourced for M&E.
Training and capacity development in data management and other computer
programmes, M&E and report writing skills for M&E officers is therefore very relevant in
all the Divisions. This would necessitate building capacity for M&E functions within the
Regional Health Management Team. Capacity should also be built within the District
Health Management Teams to carry out M&E activities.

GHS MONITORING AND EVALUATION PLAN 2010-2013
54
Following on these, financial support will be required to resource the PPMED to
undertake regional monitoring and to equip the national, regional and all districts with
much needed ICT infrastructure, internet access and anti-virus software to facilitate the
full adoption of the DHIMS 2 software.
7.4.2. TECHNICAL ASSISTANCE
GHS has completed the process of adopting the DHIMS 2 as the main software for data
collection and analysis; however some technical assistance is still required to address
post implementation challenges. There has been some contact with the University of
Oslo to this effect and as a result a memorandum of understanding has been signed to
facilitate the provision of Technical Assistance to continue the further improvement in
DHIMS2 after it has been rolled out.
GHS will also require some technical assistance to evaluate the HSMTDP implementation
at the end of 2013 to determine the scope of the Service activities and how these have
contributed to the overall reduction in morbidity and mortality in the Ghanaian population.
7.4.3. STORAGE OF INFORMATION
The kind of service data and information generated and stored varies among the different
levels within the Service. The category of M&E information that is stored also depends on
the level of the management centre managing the data as well as the sub-level at which
the specific activity generating the data is being carried out. This in turn is dictated by the
information and data requirements at that particular level.
Although the data collection process is well developed within the GHS, there is a
challenge in using this data to adequately inform management decisions, especially at the
facility and district level. It is therefore imperative that the Service intensify its efforts in
creating the environment and platform to strengthen the use of data to make evidence-
based decisions. Training on the use of data to generate information for evidence based
decision making should be prioritized.
The type and category of Service information stored at the National level is determined by
a set of sector-wide indicators. These sector-wide indicators also enable relevant
information gathered from all budget management centers (BMC) to be transmitted to the
district, regional, and national levels monthly. However, the mode of data transmission
varies with internet accessibility and availability at the various levels. Some of the data
are delivered via the internet and others by courier. This manual collection and

GHS MONITORING AND EVALUATION PLAN 2010-2013
55
transmission of data by courier has adversely affected data completeness, quality, and
timeliness. It is hoped that the current HSMTDP will adequately address these
challenges. The development and deployment of web-based software (DHIMS2) that
would replace the existing data collecting software will enable collection of real-time data
from the districts and improve timeliness.
7.4.4. EQUIPMENT AND LOGISTICS
To gain from the efficiency of real-time data collection requires that computers be placed
within the consulting rooms of hospitals, and mobile devices like phones set-up within the
smaller health facilities and for other public health programmes. These systems will
require internet access for efficient data transmission. Currently there is dire need for
computers and accessories at all levels but more especially at the facilities and District
Health Directorates. For most districts there is a reliance largely on internet access via
USB modems available on various mobile phone networks, raising issues with
connectivity and reliability.
Following these, there is recognition of the need to support facilities and districts with
computers and reliable internet access. There will also be the need to support and
resource the ICT department to maintain the existing computers and accessories in the
Service. Additionally the GHS needs to make investments in infrastructure and personnel
to strengthen the capacity at its Center for Health Information Management (CHIM) to be
able to maintain and run the proposed web-based data collection, analysis and reporting
tool.
The M&E unit of the PPMED should be provided with dedicated funds and vehicles to
facilitate regular field and technical support visits to all management centers that will need
their services.

GHS MONITORING AND EVALUATION PLAN 2010-2013
56
8. THE MONITORING AND EVALUATION PROCESS
8.1 COLLECTION, COLLATION AND ANALYSIS OF DATA
GHS should collect and collate routine data monthly from the districts. Send Reports
from CHPS zones, health centers and hospitals as well as private facilities to the districts
monthly using the prescribed reporting forms. Ghana Health Service has been given the
mandate by the Ministry of Health to collect health service data from all facilities in the
district, including Private and CHAG facilities. This can be sent as a hard copy or
electronic using the DHIMS2. District validation teams should validate the reports before it
is entered into the DHIMS2. The Districts should then enter the data into DHIMS2 to
make it available to the Regional level. Each unit at the district level should be
responsible for entering data from their service area. District Health Information Officers
will enter the data that do not have officers assigned. The Regional reports from their
respective districts will be available to the National Level through the DHIMS2.
To augment the routine data collected, the health sector will work with some of its
stakeholders to undertake joint periodic health surveys such as the Demographic and
Household Survey (DHS) and the Multi-indicator Cluster Survey (MICS). These surveys
will generate additional indicators for monitoring and evaluation.
8.2. REVIEW PROCESS IN THE GHANA HEALTH SERVICE
The annual review process should begin at the level of the Budget and Management
Centres. The process should involve an internal review of the BMC performance based
on their annual plans and specific activities and achievements. These should be reviewed
against the targets set over the review period. Review of performance should include
trend analyses of performance over a minimum period of three years. Five years trend
analysis will be preferred.
The first level of data collation and analysis should be completed at the District level. This
provides a synthesis of all reports from the sub-districts, district hospitals and District
Health Directorates, CHAG facilities, NGOs and private health facilities. These reports
must include the various activities undertaken in collaboration with the District Assemblies
and other decentralized agencies. The District Performance Review should involve all
stakeholders in health working at the district level. This forum affords each stakeholder
including the private health care providers the opportunity to present an account of their

GHS MONITORING AND EVALUATION PLAN 2010-2013
57
performance and to highlight their key challenges for discussion. This review should
culminate in a final district report based on the guidelines provided by the PPMED which
should be submitted to the regional level.
The second level of collation and analysis should take place at the Regional level. This
must be preceded by the regional performance hearing sessions, involving all District
Health Directorates, district and regional hospitals, training institutions, CHAG facilities,
Regional Health Directorates and other stakeholders at the regional level. National teams
attending these reviews should include health information officers, policy-makers, clinical
and public health specialists, health and development partners These reviews should
culminate in a final regional report based on the guidelines provided by the PPMED. The
report should be sent to the National level PPMED
At the National level, the first Senior Managers’ Meeting (SMM 1) should be organized
within the first quarter of the succeeding year and focused to reviewing Regional and
National Performances through a series of regional and divisional presentations. This will
form the basis for preparing the GHS Annual Report. The National level Performance
Sessions should be attended by the GHS Council.
The GHS will make presentations on the performance of the year-under-review at the
MoH- Inter-agency review and at the Health Summit. There will be an annual
independent performance review of the entire Health Sector by an independent team of
consultants. This independent review should also include a review of the performance of
the M&E System of the GHS.
8.3. USE OF DATA FOR DECISION-MAKING
Good data is essential in planning and ensures proper accountability and reporting.
Quality data forms the essence and foundation of decision-making process and it is
imperative for all decision-makers to make use of the relevant data at all levels. However,
data utilization in the Service is often hindered by weak organizational structures and a
myriad of challenges both inherent and external. This includes a lack of data utilization
mores among decision-makers, low motivation, inadequate trained staff, lack of technical
skills and technology, particularly, at the lower levels, and poorly-funded M&E activities.
.The Data Utilization Manual developed by the PPMED-GHS will be used to provide the
necessary skills for decision-makers to enable optimal data use at all levels.

GHS MONITORING AND EVALUATION PLAN 2010-2013
58
8.4. PLAN FOR EVALUTAION
Evaluation is at the heart of the decision-making process and determines the value of an
intervention or programme, to inform its adoption, rejection or revision. Evaluation makes
use of assessment data in addition to many other data sources and measures how well
activities have met expected objectives. The evaluation process provides valuable
information for management and draws lessons for future actions.
At the end of the implementation of the HSMDP, the Ghana Health Service together with
other agencies of the Ministry of Health will be involved at all levels to evaluate the
performance of the sector.
The following steps can be used at all levels in the service to evaluate programme
implementation within the GHS
Identify and engage stakeholders
Involve partners to work on the Logic Model for the evaluation
Define the outcome objectives and impact objectives
Gather credible data/evidence
Organize and interpret results and draw conclusions
Prepare and disseminate reports
The reports received from all beneficiaries and districts should be prepared, analyzed and
a progress report produced and disseminated. The information generated will be used for
re-planning and advocacy and also shared with all beneficiaries, districts and other
partners.

GHS MONITORING AND EVALUATION PLAN 2010-2013
59
9. QUALITY ASSURANCE
9.1. Ensuring Data Quality
Data veracity, put in a nutshell, its completeness, consistency, accuracy, integrity is
pivotal to effective planning, implementation and improvement of health services as well
as programme evaluation. Authentic data informs enhanced patient care, better use of
health insurance, more appropriate and better defined priorities of the service.
Poor data quality is common in the health sector. The trail of upward reporting to each
level is beset with an array of data quality issues that range from inadequate
documentation and storage, poor analysis and improper interpretation, poor presentation
and non dissemination in many cases. The lack of integrity of data generated from the
lower levels may well be in part the direct consequence of its low utilization in decision-
making in the service. These have been identified by a number of health sector
assessments in Ghana1. It becomes tempting to blame the original source of data for any
and all errors that appear downstream. However, any efforts to improve data quality will
only be meaningful when these are part of an overarching quality culture that must
emanate from the apex of an organization.2
Currently, existing GHS data quality audit activities conducted have been collected into a
useful data repository and these have been used to develop tools and training modules to
ensure correct and consistent data at every level in the Service. These activities are
among the nascent scheme the GHS is effecting to build a rigorous data quality
assurance system within the Service.
9.2. Improving the quality of data collection
Enhancing data quality and integrity begins with standardizing the source documents
designed for data collection and then effectively integrating the myriad of disparate data
sources. This also requires the regular review of source documents by schedule and
providing training on how to use the data collection tools.
A regular schedule will be prepared to review and update the standardized data collection
tools. Subsequent training using the data collection tools will also be standardized with
1 Agana et al., 2009; Institutional Care Division (ICD), Rapid Assessment Report on Clinical Information,
2007; and Data Quality Audit for Malaria in Ghana by JSI 2009)

GHS MONITORING AND EVALUATION PLAN 2010-2013
60
compulsory participation of all service providers and supervisors. These activities will be
further augmented by institutions through monthly data validation sessions at all service
delivery points before data reports are signed, stamped and forwarded by the officer
designated for the purpose.
Where data is submitted upwards and to succeeding levels in hard copy, a hard copy of
the original will be kept in the submitting institution’s file. This will be well-labelled (dated,
stamped, named, batched) and stored in an orderly fashion for easy retrieval. Where the
data are transmitted electronically using external storage devices (pen/flash drive, CD-
Rom, external hard drive) the copy of the original should be filed properly in clearly
identifiable folders with regular backup. Where data is transmitted by email, the original
email should not be deleted.
9.3. Standard Operating Procedures
GHS has developed a set of Standard Operating Procedures (SOPs) to guide data
management. These SOPs for improving data quality are a set of written instructions that
document the routine or repetitive activities to be followed by the various levels data
collection and aggregation in the GHS. It will detail regularly recurring work processes
that are to be conducted for data collection, data processing, use and transmission. The
SOP will also facilitate the way activities are performed to enhance compliance and
maintain consistency with technical and quality guidelines for quality data. Training will be
organized at all levels in the service in the use of the SOPs for data management.
9.4. Improving Timeliness, Completeness and Accuracy of Transmitted data
Data must be collected, collated, analyzed and delivered within an agreed period. To
ensure adherence to deadlines, a data collation and validation team should be
responsible for data management and submission at each level.
Timeline for data submission within the service is as shown in the Table below
TABLE 6: TIMELINES FOR DATASUBMISSION BY LEVEL
Reporting Level Receiving
Level Frequency Deadline
Facilities/Sub districts to Districts District monthly
5th of the following month
District to Regions Regions monthly
15th of the following month

GHS MONITORING AND EVALUATION PLAN 2010-2013
61
Regions to GHS Headquarters GHS
Headquarters monthly
25th of the following month
GHS Headquarters to MOH MOH Quarterly
Two month after the quarter
Transmitted data must be complete. The reported data must include inputs from all
reporting units, all required fields must have valid data, and the document must be signed
stamped and dated by the officer responsible.
All data submitted must be consistent with what is on the original file at all times. The
deployment of the internet based DHIMS2 will contribute significantly to improving the
timeliness of reporting...
9.5. Data Quality Audit
GHS has initiated its process of periodic audit of reported data at point of data collection
or aggregation. The audit teams must be made up of personnel from a higher level (e.g.
national to regional; regional to district, district to facilities). These teams should make
scheduled visits to data aggregation levels or facilities and audit their reported data. This
exercise will provide the platform for a more robust and rigorous data management
system that would identify strengths and gaps in data.
This exercise will also include a data verification process to track published data to the
highest level while checking on all the dimensions of data quality (consistency, accuracy,
completeness and timeliness). The data verification process should include the
examination of all source documents to examine the various dimensions of data quality.
In addition the data quality audit process will be a capacity-building activity and will offer
technical assistance to develop action plans that will address the gaps identified in the
data management system. The provision of technical assistance to improve the
generation of quality data at the level of data collection has the added advantage to
enhance use of data in decision-making.
9.6. Feedback Processes
Immediate feedback should consist of a quick eyeballing looking at completeness (all
relevant fields completed, availability of signature, date and stamp), timeliness and

GHS MONITORING AND EVALUATION PLAN 2010-2013
62
accuracy of the report and submit a quick report to the sender. This immediate feedback
to the sender offers the opportunity for quick updates for completeness and correction of
minor errors and it serves as a capacity building activity.
.
Written feedback should be based on more in-depth analysis of data from various
sources. This technique of feedback unearths data inconsistencies, enables analysis and
comparison of trends and performance with peers. The process should look at the
standards, the performance of the various districts and facilities and the gaps that are to
be filled.
A technical data quality team preparing the feedback reports is to pay attention to quality
issues including data completeness and correctness
Regular feedback on all reports submitted will be encouraged at performance review
meetings. These should give opportunity to carry out peer comparison, receive
explanations and opportunities for learning.
9.7. Documentation
Any feedback given, whether in relation to completeness, accuracy, timeliness or
consistency should be filed. In addition, any suggestions made to guide the resolution of
observed gaps in the report should be documented and filed.
Data already submitted should only be changed when there is enough documentation on
the reasons for change and the updates transmitted to all levels at the same time. This
documentation should be appropriately filed.

GHS MONITORING AND EVALUATION PLAN 2010-2013
63
10. REPORTS
10.1. REPORTING MILESTONES
All Districts, regions and divisions are expected to provide quarterly updates on their
routine activities and any new initiatives planned for the year. The half-year and annual
reports will also be expected to be produced by all Divisions, Regions, Districts and
Hospitals.
10.2. PROGRAMMES/PROJECT MONITORING
Regions and Divisions implementing programs and/or projects are to provide quarterly
updates using the project/programs monitoring matrix. The required information includes
budget execution regarding the project or program, and the status of implementation.
10.3. FINANCIAL REPORTS
All BMCs in the GHS are to submit monthly and quarterly updates on their revenue and
expenditure depending on the type of financial data and the reporting level - as indicated
in the table below. Receipts from donors are reported as schedules in the consolidated
financial reports for the period under review.
TABLE: FINANCIAL REPORTING FRAMEWORK - CONSOLIDATED FINANCIAL REPORT
Type of Report Recipients Frequency Deadline
Consolidated GOG Expenditure Budget status Report
Partners, MOFEP, CAGD
quarterly / annually
3 months after period
Consolidate Donor Expenditure Budget status Report “
quarterly / annually
3 months after period
Consolidated IGF Expenditure Budget Status Report "
quarterly / annually
3 months after period
Consolidated IGF Revenue Budget Status Report "
quarterly / annually
3 months after period

GHS MONITORING AND EVALUATION PLAN 2010-2013
64
Consolidated Balance Sheet " quarterly / annually
3 months after period
Consolidated Revenue and Expenditure Statement "
quarterly / annually
3 months after period
Cash Flow Statement " quarterly / annually
3 months after period
Consolidated Programme Financial Reports "
quarterly / annually
3 months after period
10.4. FINANCIAL AUDIT REPORTS 10.5. GHANA HEALTH SERVICE REPORT
An annual progress report indicating the extent to which goals and objective of the POW
are being achieved should be prepared every year by Districts, Regions, Programmes,
Divisions and National. The report will rely on the various reviews carried out in the
service. Half year reports should also be written by the various levels to track the
performance against set targets.
GHS MONITORING AND EVALUATION PLAN 2010-2013
65
11. GOALS AND OBJECTIVES OF THE MONITORING AND EVALUATION SYSTEM WITHIN THE GHANA HEALTH SERVICE
The overall goal of the Ghana Health Service M&E system is to support the Ghana Health Service to achieve the impact and outcomes articulated in the Health Sector Medium Term Development Plan, as well as the programme works developed from it. This will be done by collecting, analyzing and disseminating data to:
1. Enhance understanding the of the trends in the various service outcomes 2. Monitor progress with implementation of planned activities and interventions. 3. Assess the effectiveness of the health interventions at national and sub-national
levels. 4. Monitor funds provided for service activities
1. Inflows 2. Expenditure 3. Budget
5. Identify gaps and emerging needs. 6. Guide the selection and application of solutions to address identified gaps and
emerging needs. 7. Ensure accountability to stakeholders including.
11.1. STRATEGIES TO ADDRESS MONITORING AND EVALUATION GAPS
Work force gap
a. Build and continue to improve human capacity for M&E at all levels
b. Increase human resource for M&E activities
c. Put in place continuous in-service training in M&E for all staff
1. Resource Management Gap
a. Develop and ensure adequate deployment of data collection tools to improve data
management
b. Revise and update data collection tools to improve data quality
c. Revise and align inputs, outputs and outcomes within sector PoW
d. Encourage joint target-setting
e. Collate, harmonize and document existing M&E processes
f. Expedite documentation and circulation of Standard Operating Procedures (SOP)
g. Improve and support ICT infrastructure base at all levels

GHS MONITORING AND EVALUATION PLAN 2010-2013
66
2. Leadership and Governance gap
a. Make M&E a priority in PoW
b. Advocate to increase budget allocation to create a more robust M&E system both
internally and externally
c. Establish two-way feedback mechanisms to identify gaps requiring revision,
greater coordination and alignment of process indicators.

GHS MONITORING AND EVALUATION PLAN 2010-2013
67
12. M&E ACTIVITIES, TIMELINES AND BUDGET
TABLE 8: M&E Activities and Timelines
Description of Major activities
Key Deliverables Timeframe Comments
2010 2011 2012 2013
1.RESOURCE MANAGEMENT GAP
a. Improve Data Management
Development and Deployment of DHIMS2(Web based data collection software)
DHIMS2 Developed and deployed with URL made available to all data managers
X X
District and Regional Data Validation meetings
District Regional Data validation teams meetings held in all districts and regions
X X X Organized Monthly – National teams will visit few regional validation meetings
Print and distribute primary data capture forms/registers to both private and public health facilities in the Districts.
Registers and data capture tools available at all facilities/districts in Ghana both private and public
X X X
Joint Monitoring(Managerial) Visits to Regions and District
Joint monitoring visits held. X X X Will be done twice in a year

GHS MONITORING AND EVALUATION PLAN 2010-2013
68
Technical Monitoring visits to Regions and Districts
Technical Monitoring visits held. X X X Will be done twice in a year
b. Improve ICT infrastructure
Procure office/ICT equipment (desk top, lap tops, printers scanners, accessories, smart phones and internet modems
ICT equipment procured for regions and CHIM (Servers, computers, printers smartphones and USB modems.
X X X
Host and maintain Server for DHIMS2
Server for DHIMS hosted and accessible for data entry, analysis and reporting.
X X X
1. HEALTH WORKFORCE GAP
a. Develop Human Capacity for M&E
Train National ,Regional and District Teams on Monitoring and Evaluation
National, Regional and District Teams trained in Monitoring an evaluation
X X X Will aim to build capacity over the four years of the HSMTDP implementation
Train National, Regional and District Teams on Data Quality Audit
National, Regional and District Teams trained in data quality audit
X X X
Train District and Regional Teams on SOPs on data management and Data Utilization.
Regional and District Teams trained x x x

GHS MONITORING AND EVALUATION PLAN 2010-2013
69
Develop pre-service training modules for health service data management for health training schools
Pre-service modules developed in use in the health training institutions
X X X
2. LEADERSHIP AND GOVERNANCE GAP
1. Improve the use of Data for decision making
Annual Regional performance reviews
District and Regional Annual reviews held
X X X
Senior Managers Meetings
Senior Managers Meetings Held X X X
GHS Headquarters Annual review meeting
GHS Headquarters annual review meeting held
X X X

GHS MONITORING AND EVALUATION PLAN 2010-2013
70
TABLE 9: BUDGET FOR THE MONITORING AND EVALUATION PLAN
2011 2012 2013
Nu
mb
er
Pro
gra
mm
e
De
sc
rip
tio
n
De
sc
rip
tio
n o
f
Item
or
acti
vit
y
De
tail
De
sc
rip
tio
ns
Co
st
$
De
tail
De
sc
rip
tio
ns
Co
st
$
De
tail
De
sc
rip
tio
ns
Co
st
$
To
tal C
ost
$
A Improve Data Management
-
Development and Deployment of DHIMS2 (Web based data collection software)
DHIMS2 Developed and deployed with URL made available to all data managers
Development of DHIMS2 and training
900,000 Training of managers on DHIMS2
460,000 Improvement in DHIMS2 software
80,000 1,440,000 -
District and Regional Data Validation meetings
District Regional Data validation teams meetings held in all districts and regions
Organized Monthly – National teams will visit few regional validation meetings
120,000 Organized Monthly – National teams will visit few regional validation meetings
120,000 Organized Monthly – National teams will visit few regional validation meetings
120,000 360,000 -
Print and distribute primary data capture forms/registers to both private and public health facilities in the Districts.
Registers and data capture tools available at all facilities/districts in Ghana both private and public
Printing of registers and data collection tools(once a year)
200,000 Printing of registers and data collection tools(once a year)
250,000 Printing of registers and data collection tools(once a year)
300,000 750,000 -
Joint Monitoring(Managerial) Visits to Regions and District
Joint monitoring visits held. Will be done twice in a year
100,000 Will be done twice in a year
100,000 Will be done twice in a year 100,000
300,000 -
Technical Monitoring visits to Regions and Districts
Technical Monitoring visits held.
Will be done twice in a year
13,000 Will be done twice in a year
13,000 Will be done twice in a year 13,000
- 39,000
B
Improve ICT infrastructure
-

GHS MONITORING AND EVALUATION PLAN 2010-2013
71
Procure Office equipment (desk top, lap tops, printers scanners, accessories and internet modems
ICT equipment procured for regions and CHIM (Servers, computers, printers and USB modems.
Aim to equip all districts with ICT equipment
350,000 Aim to provide servers for all Regions and strengthen CHIM
1,000,000 New districts equipped
75,000 1,425,000
Host and maintain Server for DHIMS2
Server for DHIMS hosted and accessible for data entry, analysis and reporting.
Payment will be annually
40,000 Payment will be annually
40,000 Payment will be annually
40,000 120,000
Workforce Gap
Develop Human Capacity for M&E
Train National, Regional and District Teams on Monitoring and Evaluation
National, Regional and District Teams trained in Monitoring an evaluation
Will aim to build capacity over the four years of the HSMTDP implementation
350,00 Will aim to build capacity over the four years of the HSMTDP implementation
200,000
Will aim to build capacity over the four years of the HSMTDP implementation
100,00 650,000
Train National, Regional and District Teams on Data Quality Audit
National, Regional and District Teams trained in data quality audit
Training of Regional Teams to train district teams
350,000 Training of Regional Teams to train district teams
350,000 Training of new districts
120,000 670,000
Train District and Regional Teams on SOPs on data management and Data Utilization.
Regional and District Teams trained
SOPs will be developed District/regional teams trained
Develop pre-service training modules for health service data management for health training schools
Pre-service modules developed in use in the health training institutions
Modules will be developed
15,000 Training of tutors of schools
250,000
265,000
Leadership And Governance Gap
-
Improve the use of Data for decision making
-
Annual Regional performance reviews
District and Regional Annual reviews held
Held once a year in all the Regions
800,000 Held once a year in all the Regions
850,000 Held once a year in all the Regions
900,000 2,550,000

GHS MONITORING AND EVALUATION PLAN 2010-2013
72
Senior Managers Meetings
Senior Managers Meetings Held
Held four times in the year
50,000 50,000
60,000 160,000
GHS Headquarters Annual review meeting
GHS Headquarters annual review meeting held
Held once a year
4,000 Held once a year
4,000 Held once a year
5,000 13,000 -
Half Year Review performance review meetings held at the Regional Level
Half year review meetings held
Held by all Regions once a year
500,000 Held by all Regions once a year
500,000 Held by all Regions once a year
600,000 1,600,000
Improving Data Quality
Standard Operation Procedure Manual Development
Develop SOP data collection
Technical meetings to develop SOP, Stakeholder interactions on document
62,000
Train staff in the use of SOP
Regional TOT Training on SOPs
10,000 District trainings on SOPS
120,000
130,000
Review SOP Document annually
Review of SOP
20,000 Review and reprinting 150,000 170,000
Data validation routines Set up data validation team at each level of data management
Meeting with Regional Data validation Teams
13,000 Formation of District Data validation Teams
210,00
223,000
Develop work plan for data validation
Technical meetings to develop data validation work plan
2,000
2,000
Hold data validation meetings
Regional and National Data validation meetings held quarterly
76,000 Regional and National Data validation meetings held quarterly
80,000 Regional and National Data validation meetings held quarterly
85,000 241,000
Data Transmission Procure data transmission equipments e.g., external storage device, back-up
Procure modems for all districts
10,200
10,200

GHS MONITORING AND EVALUATION PLAN 2010-2013
73
system, modems, routers
Establish data transmission mechanism e.g. Internet connectivity for CHIM
Payment of bills once a year
3,000 Payment of bills once a year
3,000 Payment of bills once a year
3,000 9,000
GRAND TOTAL 3,968,0000 4,620,000 2,751,000 11,339,000

GHS MONITORING AND EVALUATION PLAN 2010-2013
74
APPENDIX 1.
INDICATORS TARGETS AND MILESTONES FOR MONITORING AND EVALUATION
INDICATOR 2010
Baseline 2011
Target
2012 Target
2013 Target
Data sources
Measurement
Monitoring Frequency
Responsibility
HO1 Bridge
equity gaps in
access to
health care
and nutrition
services and
ensure
sustainable
financing
arrangements
that protect
the poor
No. of
functional
CHPS zones
840 840 900 Routine
Date-
District/Regi
onal Reports
Number of
CHPS zones
with CHOs
offering home
visits and
other services
(Home visit
entails ANC,
PNC,
Immunization,
Growth
monitoring,
Nutrition
Bi-annual
Annual
DDHS/RDHS

GHS MONITORING AND EVALUATION PLAN 2010-2013
75
INDICATOR 2010
Baseline 2011
Target
2012 Target
2013 Target
Data sources
Measurement
Monitoring Frequency
Responsibility
counseling
and
Reproductive
health service
needs of the
household.)
Proportion of
CHPS zones
made
functional.
30% 50% 60% 70% Routine
Data-
District/Regi
onal Reports
Numerator:
Number of
functional
CHPS zones
Denominator:
Number of
demarcated
CHPS zones
Bi-annual/
Annual
DDHS/RDHS
Proportion of
Total
population
living within
functional
CHPS zones
10.0% 18.0% 25% 50% The
population of
the district
who are
served by
community
health officers
under CHPS
Numerator:
The sum of all
the population
Annual DDHS/RDHS

GHS MONITORING AND EVALUATION PLAN 2010-2013
76
INDICATOR 2010
Baseline 2011
Target
2012 Target
2013 Target
Data sources
Measurement
Monitoring Frequency
Responsibility
in the
catchment
area of all the
functional
CHPS zones.
Denominator:
Total
Population of
the District
Population to
doctor ratio
11,500 10,500 9,700 9,500 Human
Resource
and
Developmen
t Division
Reportsi
The ratio of
the number of
people to one
public sector
doctor
Numerator:
Total
population
Denominator:
Number of
doctors in the
public sector
Annual RDHS/Director
Human Resource
and Development
Division
Population to
medical
assistants/phys 48,641 43,340 38,634
30,709
Human
Resource
and
The ratio of
the number of
people to one
Annual Director Human
RDHS/Resource
and Development

GHS MONITORING AND EVALUATION PLAN 2010-2013
77
INDICATOR 2010
Baseline 2011
Target
2012 Target
2013 Target
Data sources
Measurement
Monitoring Frequency
Responsibility
ician assistant
ratio
Developmen
t Division
Reports
public sector
medical
assistant/physi
cian assistant
Numerator:
Total
population
Denominator:
Number of
medical
assistants
/physician
assistant in
the public
sector
Division
Population to
nurse (all
categories)
ratio
1:1,100 1:1,000 1:900 1:800 Human
Resource
and
Developmen
t Division
Reports
The ratio of
the number of
people to one
public sector
nurse (all
categories)
Numerator:
Total
Population.
Denominator:
Annual RDHS/Director
Human Resource
and Development
Division

GHS MONITORING AND EVALUATION PLAN 2010-2013
78
INDICATOR 2010
Baseline 2011
Target
2012 Target
2013 Target
Data sources
Measurement
Monitoring Frequency
Responsibility
Total number
of nurses in
the Public
Sector
Population to
midwives ratio
8,336 7,431 6,625 5,800 Human
Resource
and
Developmen
t Division
Reports
The ratio of
the number of
people to one
midwife
Numerator:
Total
Population.
Denominator:
Total number
of midwives
Annual RDHS/Director
Human Resource
and Development
Division
Percentage of
Under five
years who are
under weight
presenting at
facility and
Outreach
11.32 9.98 8.64 7.3 District and
Regional
Health
Services
Reports
Percentage of children under 5 who were found to be underweight (weight for age below -2 Z score ) facility and Outreach Numerator: Total number of Children found to be
Annual Regional Directors
of Health
Services/DDHS

GHS MONITORING AND EVALUATION PLAN 2010-2013
79
INDICATOR 2010
Baseline 2011
Target
2012 Target
2013 Target
Data sources
Measurement
Monitoring Frequency
Responsibility
underweight(<-2 Z score)
Denominator: All children under five years who were weighed from facility and Outreach
Percentage of Under five years who are stunted.
22.64% 19.96% 17.28% 14.6% Demographic and Health Survey
ii,
Multi-indicator cluster surveys, Nutritional Surveys
Percentage of children who were found to be stunted (height for age below -2 Z score) from survey.
Numerator: Number of children under five years with height for age below -2 Z score
Denominator : Total number of children under five surveyed (Height and
Annual Regional Directors
of Health
Services/DDHS

GHS MONITORING AND EVALUATION PLAN 2010-2013
80
INDICATOR 2010
Baseline 2011
Target
2012 Target
2013 Target
Data sources
Measurement
Monitoring Frequency
Responsibility
age measured for each of them)
Percentage of OPD visits by insured clients
58% 60% 75%
85%
Routine Service Data - CHIM
Percentage of patients (both new and old) seen at the OPD who are insured under the NHIS.
Numerator : Patients (both new and old) seen at the OPD who are insured
Denominator : Total number of patients(old and new seen at the OPD)
Bi-annual/ Annual
Regional Directors of Health Services/DDHS
Outpatient visits per capita
0.98 0.984 0.988 0.992 Routine Service Data - CHIM
Ratio of the total number of patients seen (both old and new) to the total population.
Numerator:
Bi-annual/
Annual
Regional Directors
of Health
Services/DDHS

GHS MONITORING AND EVALUATION PLAN 2010-2013
81
INDICATOR 2010
Baseline 2011
Target
2012 Target
2013 Target
Data sources
Measurement
Monitoring Frequency
Responsibility
Total number of patients seen at OPD(both new and old)
Denominator : Total
population
Percentage of OPD attendances seen and treated by the CHOs.
4.0% 6.05% 15.0% 20.0% District and Regional Health Services Reports
Percentage of the total OPD attendances that were seen and treated by CHOs.
Numerator: Total number of OPD clients seen by CHOs
Denominator: Total number of clients seen at OPD.
Bi-annual/
Annual
Regional Directors
of Health
Services/DDHS

GHS MONITORING AND EVALUATION PLAN 2010-2013
82
INDICATOR 2010
Baseline 2011
Target
2012 Target
2013 Target
Data sources
Measurement
Monitoring Frequency
Responsibility
HO2: improve governance and strengthen efficiency in health service delivery, including medical emergencies
Proportion of vehicles from 0-5 years
58% 70% 70% 70% HASS Reports
Ratio of vehicles which are between 0-5yrs to the total vehicles in the pool.
Numerator: Number of vehicles between 0-5years
Denominator: Total number of vehicles in fleet
Annual RDHS/Deputy Director Transport HASS
Proportion of motorbikes 0-3 70% 70%
70% 70% HASS Reports
Ratio of motorbikes 0-3 yrs to the
Annual RDHS/Deputy Director Transport

GHS MONITORING AND EVALUATION PLAN 2010-2013
83
INDICATOR 2010
Baseline 2011
Target
2012 Target
2013 Target
Data sources
Measurement
Monitoring Frequency
Responsibility
years old total motorbikes in the pool
Numerator: Number of motorbikes between 0-3years
Denominator: Total number of motorbikes in fleet
HASS
Revenue Mobilization
IGF
Financial Reports
% of IGF received from clients who are insured
Facility Drug summary Cash Book, Inpatient and outpatient billed revenue ledger
Proportion of IGF out of the total IGF that came from insured clients
Numerator: IGF from insured clients
Denominator: Total IGF received
Monthly, Quarterly &Yearly reports
RDHS/Director Finance

GHS MONITORING AND EVALUATION PLAN 2010-2013
84
INDICATOR 2010
Baseline 2011
Target
2012 Target
2013 Target
Data sources
Measurement
Monitoring Frequency
Responsibility
(insured and non- insured)
% of IGF generated from Drugs
Facility summary Cash Book, Inpatient & Outpatient revenue collection books
Proportion of Total IGF that came from the sale of drugs( insured and insured)
Numerator: Total IGF obtained from drugs(insured and non-insured)
Denominator: Total IGF received(insured and non-insured)
Monthly, Quarterly &Yearly reports
RDHS/Director Finance
Proportion of District Assembly Common Fund received to the total district Service receipts( GOG and SBS)
Programme activity ledger
The amount of money received from the District Assembly common fund with relations to the total service vote (GOG and SBS) received
Monthly, Quarterly, half yearly & annual reports
RDHS/Director Finance

GHS MONITORING AND EVALUATION PLAN 2010-2013
85
INDICATOR 2010
Baseline 2011
Target
2012 Target
2013 Target
Data sources
Measurement
Monitoring Frequency
Responsibility
for the period.
Numerator : Total amount of money received from District Assembly Common Fund
Denominator: Total service receipts for the period( GOG and SBS)
Other Sources
E.g.
Sponsorship &
Donations
E.g. Donations. Facility Cash Books if cash and also value material items & capture in the cash book
Total of all the funds obtained from other sources(District Assembly, NGOs etc)
Monthly, Quarterly &Yearly reports
RDHS/Director
Finance
Receipts

GHS MONITORING AND EVALUATION PLAN 2010-2013
86
INDICATOR 2010
Baseline 2011
Target
2012 Target
2013 Target
Data sources
Measurement
Monitoring Frequency
Responsibility
Item 1: Personnel Emolument
CAGD Mechanized Payroll
Total amount received for compensation of staff
Monthly validation of mechanized pay voucher
RDHS/Director Finance
Item 2: Administration- Percentage of item 2 received
CAGD spending Warrant
% of total Item 2 released to total item 2 vote
Numerator: Total Item 2 received.
Denominator: Approved Total Item 2 vote
Monthly, Quarterly & annual report
RDHS/Director Finance
Item 3: Service- Percentage of service funds released
CAGD spending Warrant, MOH allocation sheet
% of service funds released to Service vote.
Numerator : Total service funds received
Denominator : Approved Total service
Monthly, Quarterly & annual report
RDHS/Director Finance
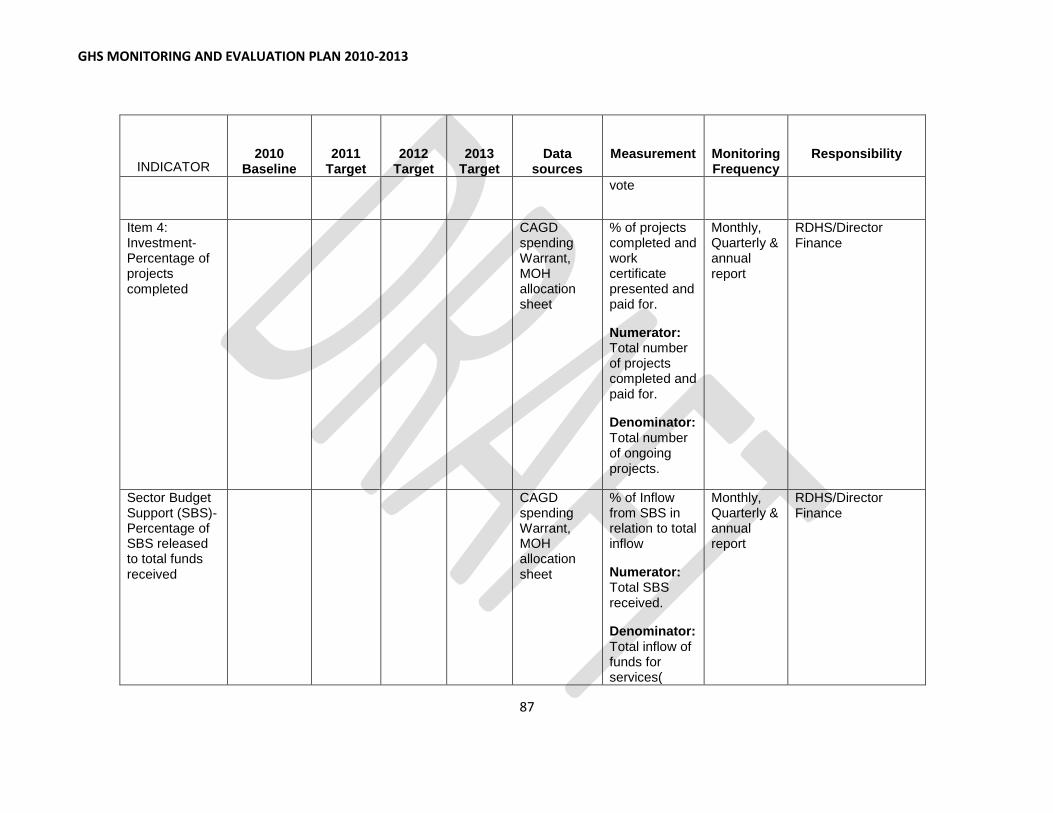
GHS MONITORING AND EVALUATION PLAN 2010-2013
87
INDICATOR 2010
Baseline 2011
Target
2012 Target
2013 Target
Data sources
Measurement
Monitoring Frequency
Responsibility
vote
Item 4: Investment- Percentage of projects completed
CAGD spending Warrant, MOH allocation sheet
% of projects completed and work certificate presented and paid for.
Numerator: Total number of projects completed and paid for.
Denominator: Total number of ongoing projects.
Monthly, Quarterly & annual report
RDHS/Director Finance
Sector Budget Support (SBS)- Percentage of SBS released to total funds received
CAGD spending Warrant, MOH allocation sheet
% of Inflow from SBS in relation to total inflow
Numerator: Total SBS received.
Denominator: Total inflow of funds for services(
Monthly, Quarterly & annual report
RDHS/Director Finance

GHS MONITORING AND EVALUATION PLAN 2010-2013
88
INDICATOR 2010
Baseline 2011
Target
2012 Target
2013 Target
Data sources
Measurement
Monitoring Frequency
Responsibility
GOG Services(Item 3) + SBS)
Global Fund(Malaria/TB/HIV)-
Programme activity ledger
Check the time frame of receiving funds and implementation of the programme & available funds
Monthly, Quarterly & annual report
RDHS/Director Finance
Expenditure
Proportion of Expenditure on drugs
Expenditure Budget Ledger
% of expenditure on drugs in relation to total expenditure
Numerator : Expenditure on drugs
Denominator: Total expenditure service and drugs)
Quarterly/ Half yearly & Annual report/validation
RDHS/Director Finance

GHS MONITORING AND EVALUATION PLAN 2010-2013
89
INDICATOR 2010
Baseline 2011
Target
2012 Target
2013 Target
Data sources
Measurement
Monitoring Frequency
Responsibility
Percentage of Non-Drugs- consumables to total expenditure
Expenditure Budget Ledger
% of expenditure on non-drug consumables to total expenditure
Numerator : Expenditure on non drug consumables
Denominator: Total expenditure
Quarterly /Half yearly & Annual report/validation
RDHS/Director Finance
Item 1: Personal Emoluments
CAGD Pay Vouchers
% of total expenditure for item 1 to total budget on compensation.
Numerator: Total expenditure for item 1
Denominator: Total budget for item 1
Monthly pay vouchers
RDHS/Director Finance

GHS MONITORING AND EVALUATION PLAN 2010-2013
90
INDICATOR 2010
Baseline 2011
Target
2012 Target
2013 Target
Data sources
Measurement
Monitoring Frequency
Responsibility
Item 2: Administration Expenses
Expenditure Budget Ledger, CAGD Treasury Jacket
% of total expenditure for item 2 to total budget for item 2
Numerator: Total expenditure for item 2
Denominator: Total budget for item 2
Quarterly /Half yearly & Annual report/validation
RDHS/Director Finance
Item 3: Service Expenses
Expenditure Budget Ledger
Total expenditure for item 3 compared with total budget for item 3
% of total expenditure for item 3 to total budget on item 3.
Numerator: Total expenditure for item 3
Denominator:
Quarterly/ Half yearly & Annual report/validation
RDHS/Director Finance

GHS MONITORING AND EVALUATION PLAN 2010-2013
91
INDICATOR 2010
Baseline 2011
Target
2012 Target
2013 Target
Data sources
Measurement
Monitoring Frequency
Responsibility
Total budget for item 3
Item 4: Investment Expenses
Approved estimate
Find out % of completion and work certificate
Quarterly/ Half yearly & Annual report/validation
RDHS/Director Finance
Sector Budget Support (SBS)
Expenditure Budget Ledger
Compare total expenditure with budget
For SBS.
Numerator: Total expenditure for SBS
Denominator: Total budget for SBS
Quarterly /Half yearly & Annual report/validation
RDHS/Director Finance
HO3: Improve
access to
quality
maternal,
neonatal, child
and
adolescent
health

GHS MONITORING AND EVALUATION PLAN 2010-2013
92
INDICATOR 2010
Baseline 2011
Target
2012 Target
2013 Target
Data sources
Measurement
Monitoring Frequency
Responsibility
services.
ANC Coverage 90% 91% 95%
98%
Routine Service Data -DHIMS
The number of pregnant women who attended ANC compared to the expected pregnancies for the year
Numerator: Number of antenatal registrants in the year. Denominator: Number of expected pregnancies (estimated as 4% of the population)
Quarterly/ Bi-annual/
Annual
DDHS/RDHS/Director FHD
Percentage of ANC clients making at least 4 visits.
64.9% 74.6(74.5%)
80.1% 85.7% Routine Service Data –DHIMS
Percentage of ANC registrants making at least four ANC visits.
Numerator: Number of registrants
Quarterly/ Bi-annual/ Annual
DDHS/RDHS/Director FHD

GHS MONITORING AND EVALUATION PLAN 2010-2013
93
INDICATOR 2010
Baseline 2011
Target
2012 Target
2013 Target
Data sources
Measurement
Monitoring Frequency
Responsibility
who are making at least 4 ANC visits.
Denominator: Number of antenatal registrants in the year.
Tetanus Toxoid 2coverage rate
77.5% 78.0 80% 85% Routine Service Data -DHIMS
Percentage of pregnant women receiving 2nd Tetanus Toxoid immunization during the year.
Numerator: Number of pregnant women receiving 2 doses of Tetanus Toxoid Denominator: Expected pregnancies for the period
Quarterly/ Bi-annual/ Annual
DDHS/RDHS/Director FHD

GHS MONITORING AND EVALUATION PLAN 2010-2013
94
INDICATOR 2010
Baseline 2011
Target
2012 Target
2013 Target
Data sources
Measurement
Monitoring Frequency
Responsibility
Skilled delivery coverage
44.6% 50.3 55.6 60.2 Routine Service Data -DHIMS–
Percentage of deliveries conducted by a skilled provider
Numerator:
Number of
deliveries
supervised by
doctors or
nurses in the
year
Denominator:
Number of
expected
pregnancies
(estimated as
4% of the
population)
Quarterly/ Bi-annual/ Annual
DDHS/RDHS/Director FHD
% TBA deliveries
30.0% 25.0% 20.%% 15.0% Routine Service Data -DHIMS
Percentage of deliveries conducted by trained Traditional Birth Attendants.
Numerator: Number of deliveries
Quarterly/ Bi-annual/ Annual
DDHS/RDHS/Director FHD

GHS MONITORING AND EVALUATION PLAN 2010-2013
95
INDICATOR 2010
Baseline 2011
Target
2012 Target
2013 Target
Data sources
Measurement
Monitoring Frequency
Responsibility
conducted by trained traditional birth attendants in the year.
Denominator: Total deliveries (skilled deliveries + TBA deliveries.
Institutional maternal mortality ratio (per 100,000)
166 150 120 100 Routine Service Data -DHIMS
Number of maternal deaths for every 100,000 live births during the year.
Numerator:
Institutional
Maternal
deaths in a
year multiplied
by 100,000.
Denominator:
Total number
of live births in
Quarterly/ Bi-annual/ Annual
DDHS/RDHS/Director FHD

GHS MONITORING AND EVALUATION PLAN 2010-2013
96
INDICATOR 2010
Baseline 2011
Target
2012 Target
2013 Target
Data sources
Measurement
Monitoring Frequency
Responsibility
the year.
Proportion of institutional maternal deaths audited
66.2 100 100 100 Routine Service Data -DHIMS
Proportion of
maternal
deaths
audited.
Numerator: Number of maternal deaths audited during the period.
Denominator: Total number of maternal deaths recorded during the period.
Quarterly/ Bi-annual/ Annual
Proportion of still births to total deliveries
2% 1.9% 1.8% 1.5% Routine Service Data -DHIMS
Proportion of
still births out
of the total
number of
births
recorded.
Numerator: Total number of still births
Quarterly/ Bi-annual/ Annual
DDHS/RDHS/Director FHD

GHS MONITORING AND EVALUATION PLAN 2010-2013
97
INDICATOR 2010
Baseline 2011
Target
2012 Target
2013 Target
Data sources
Measurement
Monitoring Frequency
Responsibility
recorded (Facility and trained TBAs stillbirths) during the period.
Denominator:
Total number
of births (live
and still) in the
year.
PNC registrants coverage
59.6% 65% 78% 82% Routine Service Data -DHIMS
Proportion of
women
receiving at
least one
postnatal care
after delivery.
Numerator:
Number of
postnatal
registrants
making at
least one visit
Denominator:
Number of
expected
deliveries
Quarterly/ Bi-annual/ Annual
DDHS/RDHS/Director FHD

GHS MONITORING AND EVALUATION PLAN 2010-2013
98
INDICATOR 2010
Baseline 2011
Target
2012 Target
2013 Target
Data sources
Measurement
Monitoring Frequency
Responsibility
(estimated as
4% of the
population)
% of WIFA accepting modern family planning methods
34.7% 35.6% 38% 40% Routine Service Data -DHIMS
Proportion of women in the fertile age group who receive family planning services during the year.
Numerator:
Number of
women in the
fertility age-
group (15-49
years)
accepting
family
planning
services
during the
year.
Denominator:
Number of
women in the
fertility age
Quarterly/ Bi-annual/ Annual
DDHS/RDHS/Director FHD

GHS MONITORING AND EVALUATION PLAN 2010-2013
99
INDICATOR 2010
Baseline 2011
Target
2012 Target
2013 Target
Data sources
Measurement
Monitoring Frequency
Responsibility
group (WIFA).
WIFA is
estimated as
24% of the
population.
Total Couple Years of Protection (CYP)
SHORT TERM
LONG TERM
1,056,715.4
320,399
1,300,000
360,000
1,400,000
420,000
Routine Service Data -DHIMS
The total estimated number of couples protected by modern contraceptives in a year
The total number of contraceptives provided multiplied by the CYP factor
Annual DDHS/RDHS/Director FHD
Institutional infants mortality
rate
1% 1.0% 0.8% 0.8% Routine Service Data -DHIMS
Proportion of deaths under one year of
age out of the total number
live births recorded in
health
Quarterly/ Bi-annual/
Annual
DDHS/RDHS/Director FHD

GHS MONITORING AND EVALUATION PLAN 2010-2013
100
INDICATOR 2010
Baseline 2011
Target
2012 Target
2013 Target
Data sources
Measurement
Monitoring Frequency
Responsibility
facilities.
Numerator:
Number of
children under
1 year old
dying in health
facilities in the
year.
Multiplied by
1,000
Denominator: Total number live births in
the year
Institutional under five mortality rate
Routine Service Data -DHIMS
Proportion of deaths under five years of age out of the total number of live births recorded in health facilities.
Numerator:
Number of
children under
5 years old
dying in health
Quarterly/ Bi-annual/ Annual
DDHS/RDHS/Director FHD

GHS MONITORING AND EVALUATION PLAN 2010-2013
101
INDICATOR 2010
Baseline 2011
Target
2012 Target
2013 Target
Data sources
Measurement
Monitoring Frequency
Responsibility
facilities in the
year multiplied
by 1,000
Denominator: Total number of live births occurring in health facilities.
% of children immunized by age 1 -BCG
95 95 95 98 Routine Service Data -DHIMS
Proportion of
children under
one year
receiving BCG
vaccine during
the year.
Numerator:
Number of
children under
1 year old
receiving the
BCG vaccine
in the year.
Denominator:
Number of
children under
1 year old
(estimated as
Quarterly/ Bi-annual/ Annual
DDHS/RDHS/Director FHD

GHS MONITORING AND EVALUATION PLAN 2010-2013
102
INDICATOR 2010
Baseline 2011
Target
2012 Target
2013 Target
Data sources
Measurement
Monitoring Frequency
Responsibility
4% of the
population).
% of children immunized by age 1 - Penta 1
93 95 95 98 Routine Service Data –DHIMS
Proportion of
children under
one year
receiving
Penta 1
vaccine during
the year.
Numerator:
Number of
children under
1 year old
receiving the
Penta 1
vaccine in the
year.
Denominator:
Number of
children under
1 year old
(estimated as
4% of the
population).
Quarterly/ Bi-annual/ Annual
DDHS/RDHS/Director FHD
% of children immunized by
90 90 90 95 Routine Service
Proportion of
children under
Quarterly/ Bi-annual/

GHS MONITORING AND EVALUATION PLAN 2010-2013
103
INDICATOR 2010
Baseline 2011
Target
2012 Target
2013 Target
Data sources
Measurement
Monitoring Frequency
Responsibility
age 1 - Penta 3 Data -DHIMS
one year
receiving
Penta 3
vaccine during
the year.
Numerator:
Number of
children under
1 year old
receiving the
Penta 3
vaccine in the
year.
Denominator:
Number of
children under
1 year old
(estimated as
4% of the
population).
Annual
% of children immunized by age 1 – Penvar 3
90 90 90 95 Routine Service Data -DHIMS
Proportion of
children under
one year
receiving
Conjugated
pneumococcal
vaccine 3rd
Quarterly/ Bi-annual/ Annual

GHS MONITORING AND EVALUATION PLAN 2010-2013
104
INDICATOR 2010
Baseline 2011
Target
2012 Target
2013 Target
Data sources
Measurement
Monitoring Frequency
Responsibility
dose during
the year.
Numerator:
Number of
children under
1 year old
receiving the
conjugated
pneumococcal
3rd
dose
vaccine in the
year.
Denominator:
Number of
children under
1 year old
(estimated as
4% of the
population).
% of children immunized by age 1 – Rotarix 3
90 95 Routine Service Data -DHIMS
Proportion of
children under
one year
receiving
Rotarix 3
vaccine during
the year.
Quarterly/ Bi-annual/ Annual
% of children immunized by age 1 - Penta 3

GHS MONITORING AND EVALUATION PLAN 2010-2013
105
INDICATOR 2010
Baseline 2011
Target
2012 Target
2013 Target
Data sources
Measurement
Monitoring Frequency
Responsibility
Numerator:
Number of
children under
1 year old
receiving the
Rotarix 3
vaccine in the
year.
Denominator:
Number of
children under
1 year old
(estimated as
4% of the
population).
% of children immunized by age 1 -OPV1
93 95 95 98 Routine Service Data -DHIMS
Proportion of
children under
1 year
receiving Oral
polio (OPV1)
vaccine during
the year.
Numerator:
Number of
children under
1 year old
receiving the
Quarterly/ Bi-annual/ Annual
DDHS/RDHS/Director FHD

GHS MONITORING AND EVALUATION PLAN 2010-2013
106
INDICATOR 2010
Baseline 2011
Target
2012 Target
2013 Target
Data sources
Measurement
Monitoring Frequency
Responsibility
OPV 1
vaccine in the
year.
Denominator: Number of children under 1 year old (estimated as 4% of the population).
% of children immunized by age 1 -OPV 3
90 90 90 95 Routine Service Data DHIMS
Proportion of
children under
1 year
receiving Oral
polio (OPV 3)
vaccine during
the year.
Numerator:
Number of
children under
1 year old
receiving the
OPV3 vaccine
in the year.
Denominator:
Number of
children under
Quarterly/ Bi-annual/ Annual
DDHS/RDHS/Director FHD
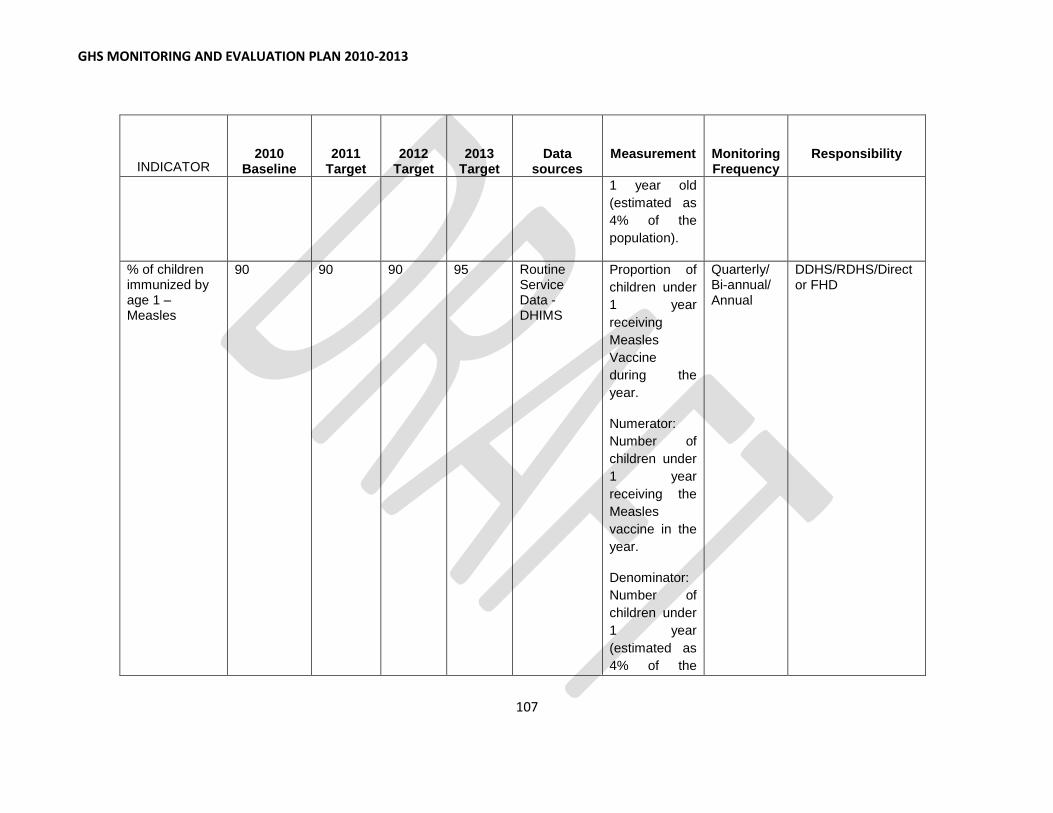
GHS MONITORING AND EVALUATION PLAN 2010-2013
107
INDICATOR 2010
Baseline 2011
Target
2012 Target
2013 Target
Data sources
Measurement
Monitoring Frequency
Responsibility
1 year old
(estimated as
4% of the
population).
% of children immunized by age 1 –Measles
90 90 90 95 Routine Service Data -DHIMS
Proportion of
children under
1 year
receiving
Measles
Vaccine
during the
year.
Numerator:
Number of
children under
1 year
receiving the
Measles
vaccine in the
year.
Denominator:
Number of
children under
1 year
(estimated as
4% of the
Quarterly/ Bi-annual/ Annual
DDHS/RDHS/Director FHD

GHS MONITORING AND EVALUATION PLAN 2010-2013
108
INDICATOR 2010
Baseline 2011
Target
2012 Target
2013 Target
Data sources
Measurement
Monitoring Frequency
Responsibility
population).
% of children immunized by age 1 -Yellow Fever
90 90 90 95 Routine Service Data -DHIMS
Proportion of
children under
1 year
receiving
Yellow Fever
Vaccine
during the
year.
Numerator:
Number of
children under
1 year
receiving the
Yellow Fever
vaccine in the
year.
Denominator:
Number of
children under
1 year
(estimated as
4% of the
population).
Quarterly/ Bi-annual/ Annual
DDHS/RDHS/Director FHD

GHS MONITORING AND EVALUATION PLAN 2010-2013
109
INDICATOR 2010
Baseline 2011
Target
2012 Target
2013 Target
Data sources
Measurement
Monitoring Frequency
Responsibility
% of children aged 6 MTHS to 59mths receiving at least one dose of Vitamin A
70% 75% 78% Routine Service Data -DHIMS
Proportion of children aged 6–59 months who received a high-dose vitamin A supplement within the last 6 months.
Numerator:
Number of
children
between 6-59
months who
receive
Vitamin A
supplementati
on in the last 6
months.
Denominator:
number of
children
between 6-59
months.
Quarterly/ Bi-annual/ Annual
DDHS/RDHS/Director FHD
% of clients (15-24 years) who accepted FP service
10% 12% 14% 15% Routine Service Data -DHIMS
Proportion of women aged 15 to 24 years who receive family
Quarterly/ Bi-annual/ Annual
DDHS/RDHS/Director FHD

GHS MONITORING AND EVALUATION PLAN 2010-2013
110
INDICATOR 2010
Baseline 2011
Target
2012 Target
2013 Target
Data sources
Measurement
Monitoring Frequency
Responsibility
planning services during the year.
Numerator:
Number of
women in the
age-group 15-
24 years)
accepting
family
planning
services
during the
year.
Denominator:
Number of
women in the
fertility age
group (WIFA).
WIFA is estimated as 24% of the population.
HO4: Intensify prevention and control of communicable

GHS MONITORING AND EVALUATION PLAN 2010-2013
111
INDICATOR 2010
Baseline 2011
Target
2012 Target
2013 Target
Data sources
Measurement
Monitoring Frequency
Responsibility
and non-communicable diseases and promote healthy lifestyles
% of OPD cases that is Hypertension.
4.0 4.2 4.5 5.0 Routine Service Data - CHIM
Proportion of Outpatient morbidity cases diagnosed as hypertension out of the total number of cases seen.
Numerator:
Number of
new outpatient
cases
diagnosed as
hypertension.
Denominator: Total number of new outpatient cases reported.
Quarterly/ Bi-annual/ Annual
Deputy Director Non-communicable Disease
% of OPD cases that is
0.8 0.9 1.0 1.2 Routine Service
Proportion of Outpatient
Quarterly/ Bi-annual/
Deputy Director Non-communicable
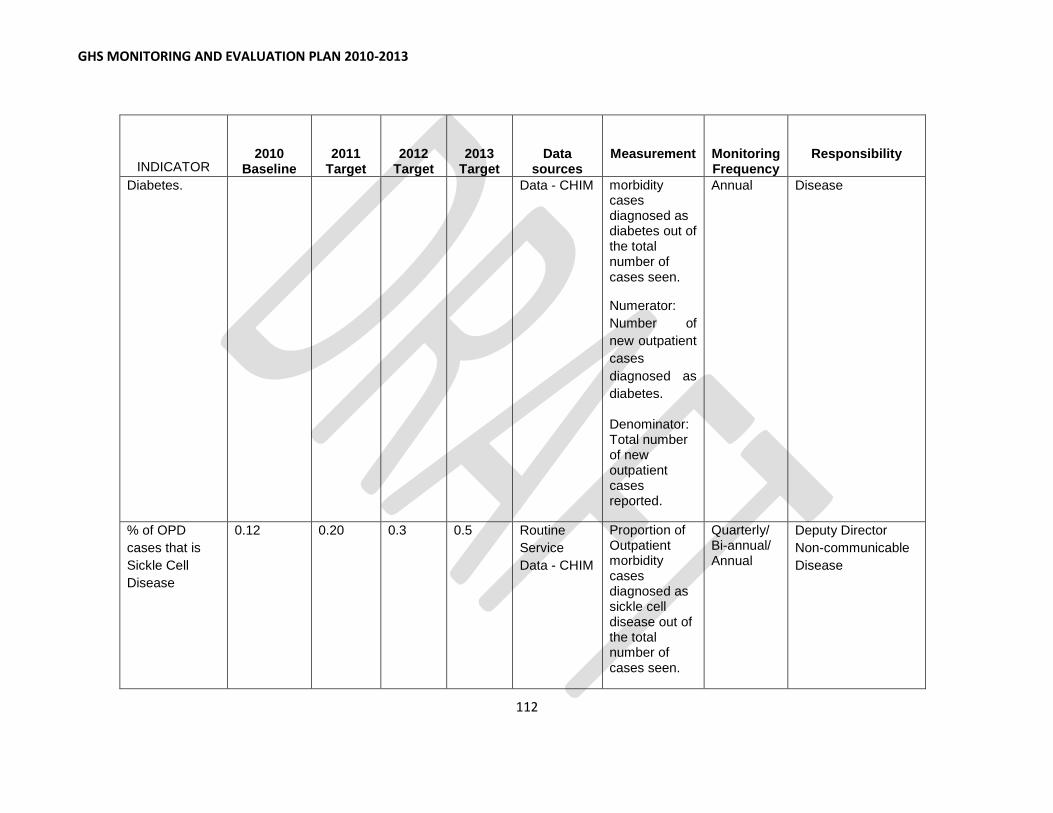
GHS MONITORING AND EVALUATION PLAN 2010-2013
112
INDICATOR 2010
Baseline 2011
Target
2012 Target
2013 Target
Data sources
Measurement
Monitoring Frequency
Responsibility
Diabetes. Data - CHIM morbidity cases diagnosed as diabetes out of the total number of cases seen.
Numerator:
Number of
new outpatient
cases
diagnosed as
diabetes.
Denominator: Total number of new outpatient cases reported.
Annual Disease
% of OPD
cases that is
Sickle Cell
Disease
0.12 0.20 0.3 0.5 Routine
Service
Data - CHIM
Proportion of Outpatient morbidity cases diagnosed as sickle cell disease out of the total number of cases seen.
Quarterly/ Bi-annual/ Annual
Deputy Director
Non-communicable
Disease

GHS MONITORING AND EVALUATION PLAN 2010-2013
113
INDICATOR 2010
Baseline 2011
Target
2012 Target
2013 Target
Data sources
Measurement
Monitoring Frequency
Responsibility
Numerator:
Number of
new outpatient
cases
diagnosed as
sickle cell
diseases.
Denominator: Total number of new outpatient cases reported.
No. of new HIV
positive cases
diagnosed
19,402 21,869 18,769
NACP
Number of
new HIV
positive cases
diagnosed in
the year
Quarterly/ Bi-annual/ Annual
Programme
Manager NACP
Number of
HIV+ cases
receiving ARV
therapy
(cumulative)
63,861 78,919
NACP
Number of
total HIV
positive cases
receiving ARV
therapy (all
cases both
new and those
already on
therapy)
Quarterly/ Bi-annual/ Annual
Programe Manager
NACP

GHS MONITORING AND EVALUATION PLAN 2010-2013
114
INDICATOR 2010
Baseline 2011
Target
2012 Target
2013 Target
Data sources
Measurement
Monitoring Frequency
Responsibility
No. of guinea
worm cases
seen
≤20
0
0
0
GWEP/PHD
Number of
Guinea Worm
cases
reported in the
year.
Quarterly/ Bi-annual/ Annual
Programme
Manager GWEP
Proportion of
guinea worm
cases
contained
100%
100%
100%
100%
GWEP/PHD
Proportion of
Guinea worm
cases that are
contained out
of the total
number of
cases seen.
Numerator:
Number of
Guinea Worm
cases
contained3.
Numerator:
Numerator:
Total number
of Guinea
Worm cases
reported.
Quarterly/ Bi-annual/ Annual
Programme
Manager GWEP
3 Contained means : Seen before worm emergence, worm fully extracted, client had no contact with water source, source of guinea worm treated with abate.(recheck)

GHS MONITORING AND EVALUATION PLAN 2010-2013
115
INDICATOR 2010
Baseline 2011
Target
2012 Target
2013 Target
Data sources
Measurement
Monitoring Frequency
Responsibility
Non Polio AFP
rate.
≥2/100,000 ≥2/100,0
00
≥2/100,
000
≥2/100,
000
Disease
Surveillance
/PHD
Number of
Acute Flaccid
Paralysis 4
Quarterly/ Bi-annual/ Annual
Director PHD
Proportion of
OPD cases that
is due
malaria(total)
35% 32.5% 30.0% 28.0% Routine
Service
Data - CHIM
Proportion of Outpatient morbidity cases diagnosed as malaria (whether laboratory confirmed or not) out of the total number of cases seen.
Numerator:
Number of
new outpatient
cases
diagnosed as
malaria. (also
includes
malaria in
pregnancy)
Denominator: Total number
Quarterly/ Bi-annual/ Annual
Programme
Manager NMCP
4 Non-Polio AFP rate is based on calculation that takes into accounts , district population, AFP cases reported, Adequacy and quality of stool specimen and sixty day
follow up.(recheck)

GHS MONITORING AND EVALUATION PLAN 2010-2013
116
INDICATOR 2010
Baseline 2011
Target
2012 Target
2013 Target
Data sources
Measurement
Monitoring Frequency
Responsibility
of new outpatient cases reported.
Proportion of
OPD cases that
is lab confirmed
malaria.
(microscopy +
RDTs)
30% 40% 45% 60% Routine
Service
Data - CHIM
Proportion of Outpatient morbidity cases confirmed as malaria (with laboratory confirmation whether by microscopy or RDT) out of the total number of cases seen.
Numerator:
Number of
new
Outpatient
cases
confirmed
(whether by
microscopy or
RDT).
Denominator: Total number
Quarterly/ Bi-annual/ Annual
Programme
Manager NMCP
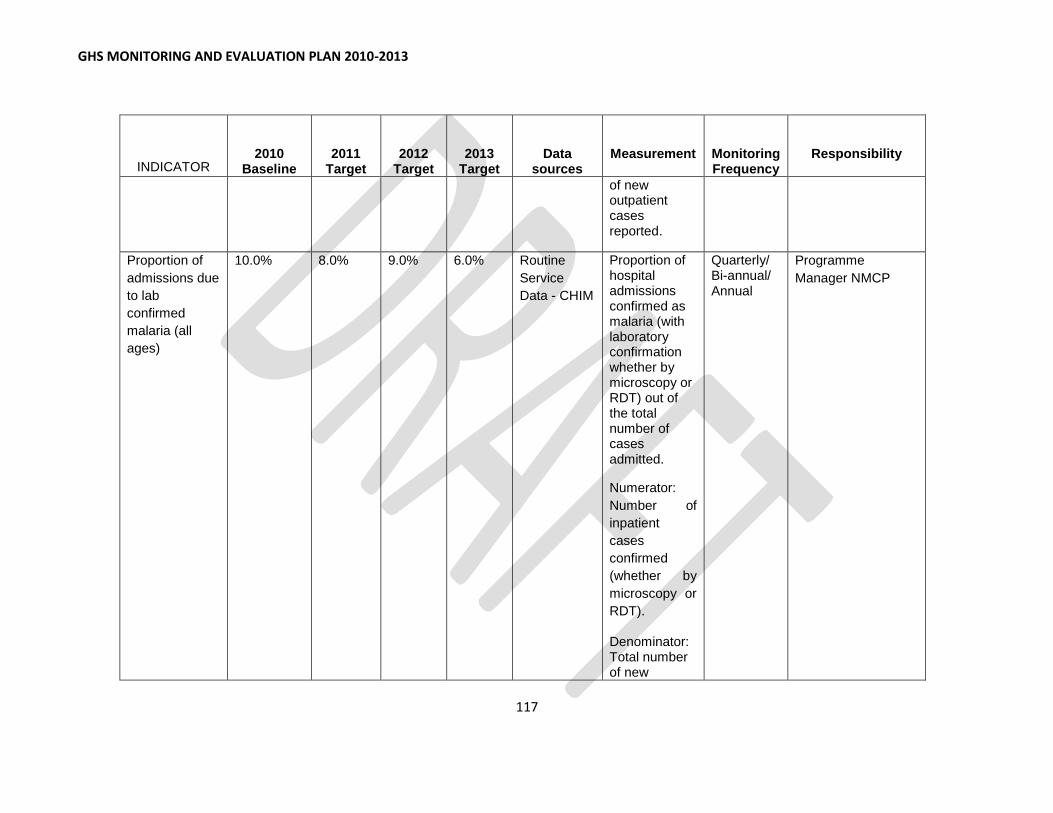
GHS MONITORING AND EVALUATION PLAN 2010-2013
117
INDICATOR 2010
Baseline 2011
Target
2012 Target
2013 Target
Data sources
Measurement
Monitoring Frequency
Responsibility
of new outpatient cases reported.
Proportion of
admissions due
to lab
confirmed
malaria (all
ages)
10.0% 8.0% 9.0% 6.0% Routine
Service
Data - CHIM
Proportion of hospital admissions confirmed as malaria (with laboratory confirmation whether by microscopy or RDT) out of the total number of cases admitted.
Numerator:
Number of
inpatient
cases
confirmed
(whether by
microscopy or
RDT).
Denominator: Total number of new
Quarterly/ Bi-annual/ Annual
Programme
Manager NMCP

GHS MONITORING AND EVALUATION PLAN 2010-2013
118
INDICATOR 2010
Baseline 2011
Target
2012 Target
2013 Target
Data sources
Measurement
Monitoring Frequency
Responsibility
admissions.
Proportion of
deaths due to
malaria (all
ages)
15.0% 12.0% 10.0% 8.0% Routine
Service
Data - CHIM
Proportion of hospital deaths due to malaria) out of the total number of deaths (all causes) recorded.
Numerator:
Number of
inpatient
deaths due to
Malaria
Denominator:
Total number
of deaths
Quarterly/ Bi-annual/ Annual
Programme
Manager NMCP
Malaria case
fatality rate
(under 5 years)
1.3% 1.2% 1.1% 1.0% Routine
Service
Data - CHIM
Proportion of
children under
five years of
age who die of
malaria out of
the total
number of
children under
five years who
admitted with
Quarterly/ Bi-annual/ Annual
Programme
Manager NMCP
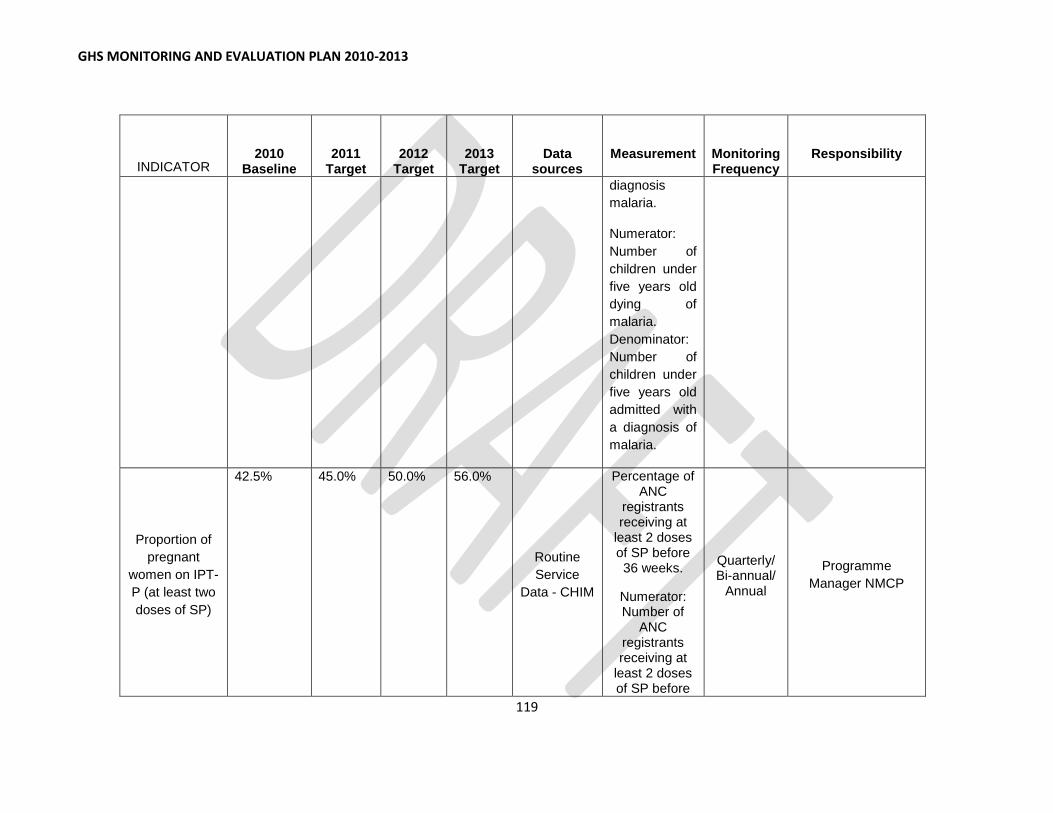
GHS MONITORING AND EVALUATION PLAN 2010-2013
119
INDICATOR 2010
Baseline 2011
Target
2012 Target
2013 Target
Data sources
Measurement
Monitoring Frequency
Responsibility
diagnosis
malaria.
Numerator:
Number of
children under
five years old
dying of
malaria.
Denominator:
Number of
children under
five years old
admitted with
a diagnosis of
malaria.
Proportion of
pregnant
women on IPT-
P (at least two
doses of SP)
42.5% 45.0% 50.0% 56.0%
Routine
Service
Data - CHIM
Percentage of ANC
registrants receiving at
least 2 doses of SP before 36 weeks.
Numerator: Number of
ANC registrants receiving at
least 2 doses of SP before
Quarterly/ Bi-annual/
Annual
Programme
Manager NMCP

GHS MONITORING AND EVALUATION PLAN 2010-2013
120
INDICATOR 2010
Baseline 2011
Target
2012 Target
2013 Target
Data sources
Measurement
Monitoring Frequency
Responsibility
36 weeks.
Denominator: Total number
of ANC registrants
Percentage of
Households
with at least
one net
Percentage of households with at least one LLITN
compared to the total
number of households
Numerator: Total number of households with at least
one net.
Denominator: Total number of Households
% of children
under 5 using
ITN
50% 65% 70% 75%
DHS
MICS
Proportion of
children under
5 years who
sleep under
ITN
Five years
Three years
Programme
Manager NMCP

GHS MONITORING AND EVALUATION PLAN 2010-2013
121
INDICATOR 2010
Baseline 2011
Target
2012 Target
2013 Target
Data sources
Measurement
Monitoring Frequency
Responsibility
Numerator:
Number of
children under
5 years old
sleeping under
ITN
Denominator:
Number of
children aged
less than 5
years
(estimated as
18.5% of
population)
TB case
notification
rate
55/100,000 58/100,0
00
62/100,
000
75/100,
000
NTP/PHD
Proportion of
total TB cases
out of 100,000
population.
Numerator:
Total number
of new and
relapse cases
notified in a
year
Quarterly/ Bi-annual/
Annual
Program Manager
NTP

GHS MONITORING AND EVALUATION PLAN 2010-2013
122
INDICATOR 2010
Baseline 2011
Target
2012 Target
2013 Target
Data sources
Measurement
Monitoring Frequency
Responsibility
Denominator:
Total
population per
100,000
TB treatment
success rate
87% 90% 90% 90%
NTP/PHD
Proportion of
Sum of cured
and completed
TB treatment.
Out of those
put on
treatment
Numerator:
Total number
of TB cases
cured and
completed
treatment
Denominator:
Total number
of patients
registered for
TB treatment.
Annual Programme
Manager NTP
HO5. :
Improve
Institutional
Care Including

GHS MONITORING AND EVALUATION PLAN 2010-2013
123
INDICATOR 2010
Baseline 2011
Target
2012 Target
2013 Target
Data sources
Measurement
Monitoring Frequency
Responsibility
Mental Health
Service
Delivery.
Hospital
Admission rate 47.9 48.9 49.9 50.8%
Routine
Service
Data - CHIM
Number of
hospital
admissions
per 1000
population per
year.
Numerator:
Total number
of hospital
admissions in
the year
multiplied by
1000.
Denominator:
Total
population.
Quarterly/ Bi-annual/
Annual Director ICD
Average length
of stay (ALOS) 3.9 3.7 3.5 3.2
Routine
Service
Data - CHIM
Average
duration of
inpatient
hospital stay
(mean number
of days from
admission to
Quarterly/ Bi-annual/
Annual Director ICD

GHS MONITORING AND EVALUATION PLAN 2010-2013
124
INDICATOR 2010
Baseline 2011
Target
2012 Target
2013 Target
Data sources
Measurement
Monitoring Frequency
Responsibility
discharge).
Numerator:
Number of
patient-days.
Denominator:
Number of
inpatient
admissions.
% Bed
Occupancy
59.8 61.5 63.2 64.8
Routine
Service
Data - CHIM
Percentage of
beds occupied
by patients in
a period.
Numerator:
Number of
patient-days
multiplied by
100.
Denominator:
Number of
beds
multiplied by
number of
days in the
period.
Quarterly/ Bi-annual/
Annual ICD

GHS MONITORING AND EVALUATION PLAN 2010-2013
125
INDICATOR 2010
Baseline 2011
Target
2012 Target
2013 Target
Data sources
Measurement
Monitoring Frequency
Responsibility
Turnover per
bed
58.8 59.6 60.4 61.1
Routine
Service
Data - CHIM
Average
number of
inpatients
admitted per
each hospital
bed in a
period.
Numerator:
Total number
of patients
admitted.
Denominator:
Number of
hospital beds.
Quarterly/ Bi-annual/
Annual ICD
Major
operations
performed
Routine
Service
Data - CHIM
The number of
major surgical
operations
performed
during a
period.
Quarterly/ Bi-annual/ Annual
ICD
Minor
operations
performed
Routine
Service
Data - CHIM
The number of
minor surgical
operations
performed
during a
Quarterly/ Bi-annual/ Annual
ICD

GHS MONITORING AND EVALUATION PLAN 2010-2013
126
INDICATOR 2010
Baseline 2011
Target
2012 Target
2013 Target
Data sources
Measurement
Monitoring Frequency
Responsibility
period.
Proportion of
Hospital beds
in
District/Region
allocated to
Mental Health
clients
Routine
Service
Data –
CHIM
Proportion of
hospital beds
allocated
specifically for
admitting
mental health
patients out of
the total
number of
beds.
Numerator:
Number of
hospital beds
allocated
specifically for
admitting
mental health
patients
Denominator:
Total bed
complement of
the hospital.
Quarterly/ Bi-annual/ Annual
ICD
Professional
mental health
staff per
Routine
Service
Proportion of
practicing
professional
Quarterly/ Bi-annual/ Annual
ICD

GHS MONITORING AND EVALUATION PLAN 2010-2013
127
INDICATOR 2010
Baseline 2011
Target
2012 Target
2013 Target
Data sources
Measurement
Monitoring Frequency
Responsibility
population ratio Data - CHIM mental health
staff
compared to
the total
population
being served.
Numerator:
Number of
practicing
professional
mental health
staff.
Denominator:
Total
population in
catchment
area being
served.

GHS MONITORING AND EVALUATION PLAN 2010-2013
128
MILESTONES
2010 2011 2012 2013
SO1: Bridge equity gaps in
access to health care and
nutrition services and ensure
sustainable financing
arrangements that protect
the poor
840 new functional
CHPS zones added
SO2: Strengthen
governance and improve
efficiency and effectiveness
in health service delivery
EmONC assessment
completed and
disseminated
50% of district hospitals
equipped with
Comprehensive EmONC
equipment
70% of district hospitals
and 50% of health
centres equipped with
C/BEmONC equipment
respectively
90% of district hospitals
and 70% of health
centres equipped with
C/BEmOC equipment
respectively
SO3: improve access to
quality maternal, neonatal,
child and adolescent health
services
Increase supervised
delivery to 50%
Pneumococcal and
rotavirus vaccines
successfully introduced
Adolescent health
services being provided
in 30 district hospitals
SO4: Intensify prevention
and control of communicable
and non-communicable
National cancer plan
developed
Universal coverage of
ITN/Ms achieved
Healthy lifestyles
integrated into basic
school and teacher
85% of children under
five years sleeping

GHS MONITORING AND EVALUATION PLAN 2010-2013
129
diseases and promote
healthy lifestyles training college curricula under bed nets
50% reduction in Yaws
prevalence achieved
SO5: Strengthen institutional
care, including mental health
service delivery
Referral policy and
guidelines developed
Community mental
health strategy
developed (and in
place?)
i Human Resource Strategic Plan – Seek reference
ii Demographic and Health Survey-2008 - projections