Embed Size (px)
Citation preview

Jean Balié, MAFAP Manager
Global Forum on Agriculture
OECD , 16 December 2013
Monitoring and Analysing Food and
Agricultural Policies (MAFAP) in Africa

1.Overview
2.Selected results
3. Vision and way forward
Outline


MAFAP System
1. Working with national partners to build evidence
a) Price incentives for key agricultural value
chains
b) Public expenditure and aid
c) Policy coherence
2. Facilitating policy dialogue, uptake and advocacy
– Regional (CAADP) and national (investment
plans, policy reforms)
3. Developing institutional capacities
- Ministries and other selected partner institutions
4. Establishing a community of practice
– National, Regional and Global

Where MAFAP works
http://www.fao.org/mafap
Burkina Faso
Kenya
Mali
Tanzania
Uganda
Ghana
Ethiopia
Malawi
Mozambique
Nigeria
Countries in the pipeline for 2014 -2019
Africa Asia
Burundi
Benin
Niger,
Rwanda
Senegal
…
Bangladesh
Cambodia
Lao PDR
Myanmar
…


Snapshot of results
for the period 2005-2010
On going updates for 2011-2012

The policy environment depressed prices received by producers
Producer prices were depressed by an average of 10 percent between 2005 and 2010, though price disincentives are declining.
Average percentage deviation of producer prices from equivalent world prices

Price incentives to Cotton in Tanzania
Government wishes to develop cotton sector
BUT
Negative price incentives
Taxation at district, regional and central level
Inefficiencies in processing
For sector to grow, policy reform and targeted investments required

Market inefficiencies further depressed prices received by producers
Average market development gap (percent)
Producer prices would improve significantly if market distortions from structural inefficiencies were eliminated. However, MAFAP results suggest these distortions are increasing.

Measuring the Market Development Gap in Ethiopia
Wheat
-60.00%
-50.00%
-40.00%
-30.00%
-20.00%
-10.00%
0.00%
10.00%
20.00%
2005 2006 2007 2008 2009 2010
Dis
incen
tive
s I
ncen
tive
s
Observed NRP at farm gate Adjusted NRP at farm gate

Declining level of public expenditure on agriculture and rural development Agriculture and rural development public expenditure as a percentage of total public expenditure
The share exceeded 10 percent over the period, but is declining over time, except in Kenya.

Shifting composition of public expenditures from rural development to agriculture-specific
Public expenditure on agriculture and rural development (Million USD)
Agriculture-specific spending increased from 39 percent to 57 percent of total expenditure on agriculture and rural development over the period analysed.

Composition – indirect ag-specific
Agricultural research
Inspection (veterinary/crops)
Storage
Tech assistance/extension/training
Infrastructure
Marketing
Composition of general support to
agriculture, 2006 - 2010

Direct support to agriculture favoured producers over consumers Average share of total direct support to agriculture targeting producers, consumers and other agents
Budgetary transfers to private agents targeted producers, while consumers were supported through a variety of trade and market policies, especially during the 2007/08 global food price crisis.

Composition – groups of
commodities
Share of PE targeting individual commodities
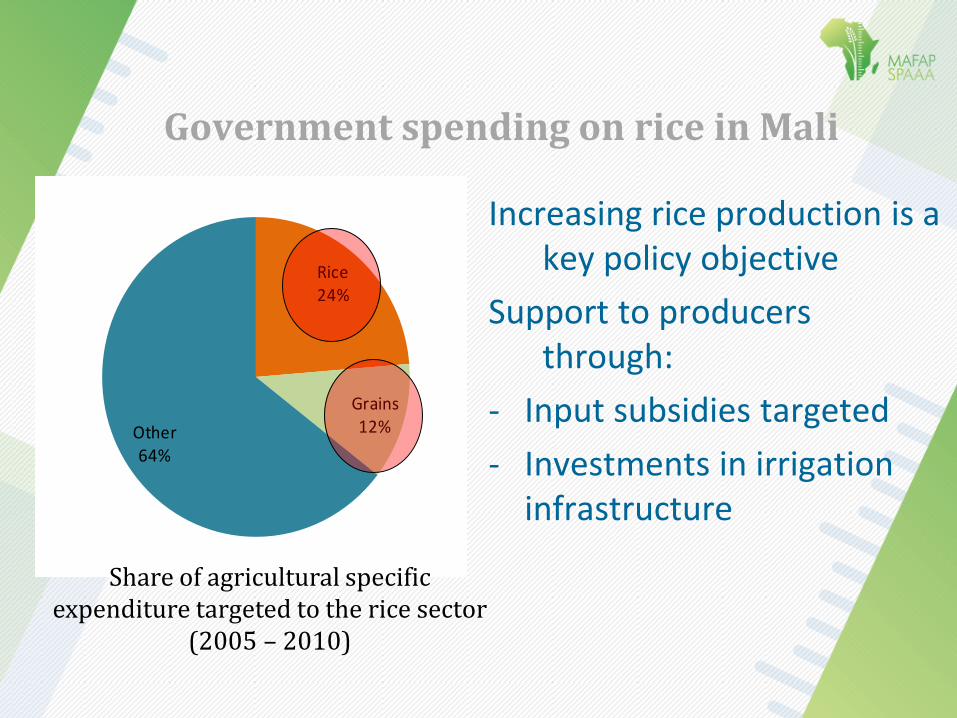
Government spending on rice in Mali
Increasing rice production is a key policy objective
Support to producers through:
- Input subsidies targeted
- Investments in irrigation infrastructure
Rice24%
Grains12%Other
64%
Share of agricultural specific expenditure targeted to the rice sector
(2005 – 2010)
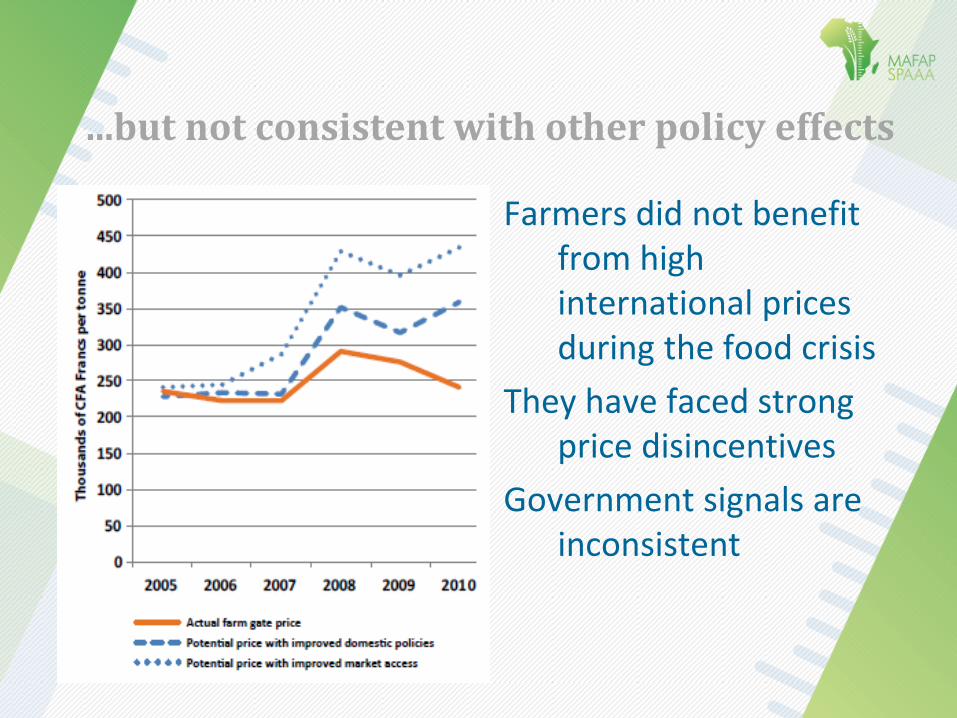
...but not consistent with other policy effects
Farmers did not benefit from high international prices during the food crisis
They have faced strong price disincentives
Government signals are inconsistent

Conclusions
Market and trade policies are not producing the expected results; producers have faced price disincentives
Value chain inefficiencies are increasing, and have not been adequately addressed through public expenditure
Short-term policy measures adopted to protect consumers in the wake of the 2007/08 global food price crisis often conflicted with long-term goals to support production growth
Despite volatile conditions faced by consumers, public expenditure targeting consumers was limited compared to expenditure targeting producers
Although research is a CAADP pillar and a stated priority for many governments, public expenditure allocated to research was low in all countries and declined in East African countries
Need to continue monitoring policies to distinguish long-term trends from crisis effects
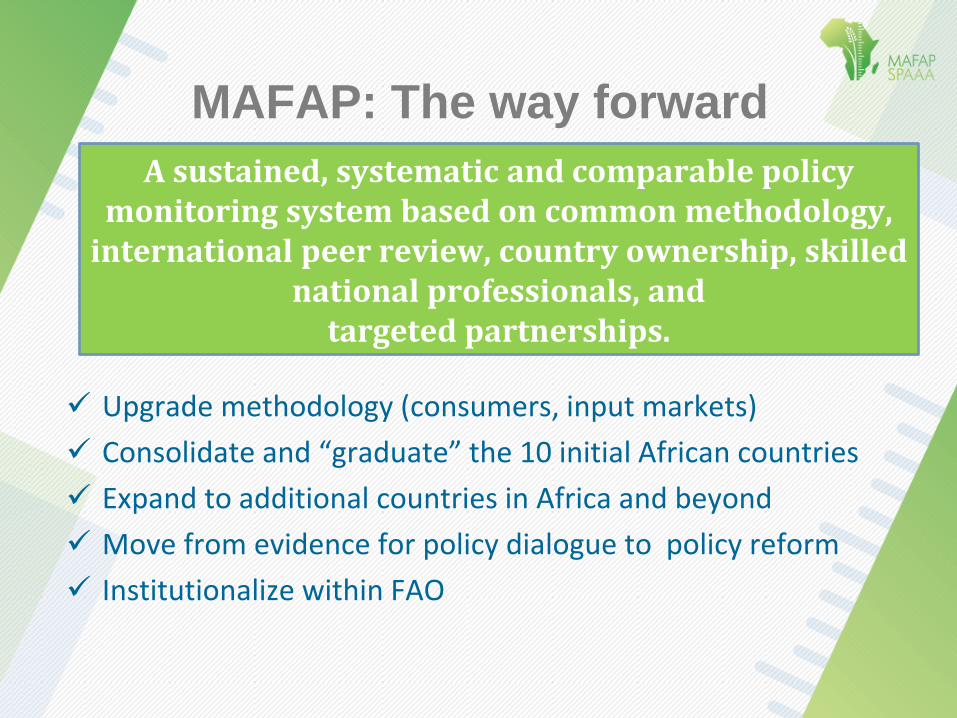
MAFAP: The way forward
A sustained, systematic and comparable policy monitoring system based on common methodology,
international peer review, country ownership, skilled national professionals, and
targeted partnerships.
Upgrade methodology (consumers, input markets)
Consolidate and “graduate” the 10 initial African countries
Expand to additional countries in Africa and beyond
Move from evidence for policy dialogue to policy reform
Institutionalize within FAO

Thank you! For more information:
www.fao.org/mafap


![Development of Agricultural Policies in Bangladesh[1] · 2019-03-11 · Agricultural Policies • Research and Development: The paradigm of agricultural research system needs to be](https://img.dokumen.tips/doc/110x75/5e818732f3e2174e900651c1/development-of-agricultural-policies-in-bangladesh1-2019-03-11-agricultural.jpg)