Embed Size (px)
Citation preview

TCEQ REGULATORY GUIDANCE Remediation Division RG-366/TRRP-33 ● Revised September 2010
TEXAS COMMISSION ON ENVIRONMENTAL QUALITY • PO BOX 13087 • AUSTIN, TX 78711-3087 T he T CEQ i s an equa l oppo r t un i t y em pl oy e r . T he agency does no t a l l ow d i sc r im i na t i on on t he bas i s o f r ac e, c o l o r , r e l i g i on , na t i ona l o r i g i n , sex , d i sab i l i t y , age, sex ual o r i ent a t i on, o r v ete r an s t a t us . I n c om p l i anc e wi t h t he Am er i c ans wi t h D i sab i l i t i es A c t , t h i s doc um en t m ay be r equest ed i n a l t er na t e f o rm at s by c ont ac t i ng t he T CEQ at 512 - 239 - 0028, f ax 512- 239 - 4488, o r 1 - 800 - RE LA Y -T X (T DD) , o r by wr i t i ng PO B ox 13087, A ust i n T X 78711 - 3087 . W e aut ho r i z e y ou t o use o r r ep r oduc e any o r i g i na l m a t e r i a l c ont a i ned i n t h i s pub l i c at i on — t hat i s , any m a t er i a l we d i d no t ob t a i n f r om o t he r sou r c es . P l ease ack nowl edge t he TCE Q as y ou r sou r c e . Pr i n t ed on r ec yc l ed pape r .
Monitored Natural Attenuation Demonstrations under TRRP
Overview of This Document Objectives: To describe the elements and development of demonstrations for monitored natural attenuation
at affected properties.
Audience: Regulated Community and Environmental Professionals
References: The Texas Risk Reduction Program (TRRP) rule, together with conforming changes to related rules, is contained in 30 TAC Chapter 350. The TRRP rule was initially published in the September 17, 1999 Texas Register (24 TexReg 7413-7944) and was amended in 2007 (effective March 19, 2007; 32 TexReg 1526-1579). Find links for the TRRP rule and preamble, Tier 1 PCL tables, and other TRRP information at: <www.tceq.state.tx.us/remediation/trrp/>. TRRP guidance documents undergo periodic revision and are subject to change. Referenced TRRP guidance documents may be in development. Links to current versions are at: <www.tceq.state.tx.us/remediation/trrp/guidance.html>.
Contact: TCEQ Remediation Division Technical Support Section – 512-239-2200, or [email protected]. For mailing addresses, refer to: <www.tceq.state.tx.us/about/directory/>.
1.0 Introduction This guidance document addresses the application of monitored natural attenuation (MNA) under the Texas Risk Reduction Program (TRRP). Specifically, this document:
• Defines natural attenuation,
• Explains how MNA can be applied under TRRP for groundwater,
• Establishes administrative and technical processes to apply MNA,
• Illustrates the technical demonstrations to be made to the TCEQ.
This guidance document does not explain how natural attenuation occurs nor does it explain how the data necessary to evaluate natural attenuation processes should be collected. Additionally, this document only addresses the application of MNA to address chemicals of concern (COCs) in groundwater. This does not imply MNA is never applicable to soils.
1.1 What is Natural Attenuation? In this guidance document, the definitions that will be used for natural attenuation and monitored natural attenuation are those provided in the TRRP rules:

Monitored Natural Attenuation Demonstrations TCEQ publication RG-366/TRRP-33
2 Revised September 2010
Natural Attenuation (NA)—The reduction in mass or concentration of a chemical of concern over time or distance from the source of a chemical of concern due to naturally occurring physical, chemical and biological processes, such as: biodegradation, dispersion, dilution, adsorption, and volatilization [§350.4(a)(56)].
Monitored Natural Attenuation (MNA)—The use of natural attenuation within the context of a carefully controlled and monitored response action to achieve protective concentration levels at the point of exposure [§350.4(a)(55)].
1.2 Lines of Evidence The demonstration that MNA is an effective remedy should be made using a lines of evidence (LOE) approach. There are three tiers of LOEs that can be used:
• Primary lines of evidence (PLOE). Relies on use of historical groundwater data that demonstrate a clear trend of stable or decreasing COC concentrations over time and with distance away from the source at appropriate monitoring or sampling points.
• Secondary lines of evidence (SLOE). Uses geochemical indicators to document certain geochemical signatures or “footprints” in the groundwater that demonstrate (indirectly) the type of natural attenuation process(es) occurring at the affected property and the destruction of COCs; or uses distance-based / time-based / biodegradation rate calculations to demonstrate attenuation.
• Other lines of evidence (OLOE). Most often consists of predictive modeling studies and other lab/field studies that demonstrate an understanding of the natural attenuation process(es) occurring at the affected property and their effectiveness in controlling protective concentration limit exceedance (PCLE) zone migration and decreasing COC concentrations.
1.3 Applying MNA Under TRRP Figure 1 is a general overview of the TRRP process. Once a release of COCs is reported to the TCEQ and TRRP is determined to be applicable, an affected property assessment must be conducted. As part of that assessment much of the data necessary to support MNA are collected. Additionally, as part of the assessment, protective concentration levels (PCLs) are established and then any PCL exceedance (PCLE) zones are identified. A PCLE zone is the volume of an environmental medium (for example, soil and groundwater) that contains COC concentrations in excess of PCLs (Figure 2). The person must then take a response action such as MNA to address the PCLE zone(s).

TCEQ publication RG-366/TRRP-33 Monitored Natural Attenuation Demonstrations
Revised September 2010 3
Figure 1. The generalized TRRP process
Figure 2. PCLE zones based on COC concentrations greater than PCL values
1.3.1 When Can MNA Be Applied as a Remedy?
With regard to MNA in groundwater, TRRP considers MNA to be one of many remedial alternatives that can be used to address groundwater PCLE zones. Like any remedial alternative, if MNA can be shown to be fully protective of human health and the environment and meet the response objectives in the time frame that is established to be reasonable for an affected property, then it can be applied as the initial and sole response, or in combination with other remedial alternatives. If MNA will not achieve the response objectives, then it cannot be used. For more detailed information on response objectives, see TCEQ guidance document Soil and Groundwater Response Objectives (RG-366/TRRP-29).
Monitored Natural Attenuation Demonstrations TCEQ publication RG-366/TRRP-33
4 Revised September 2010
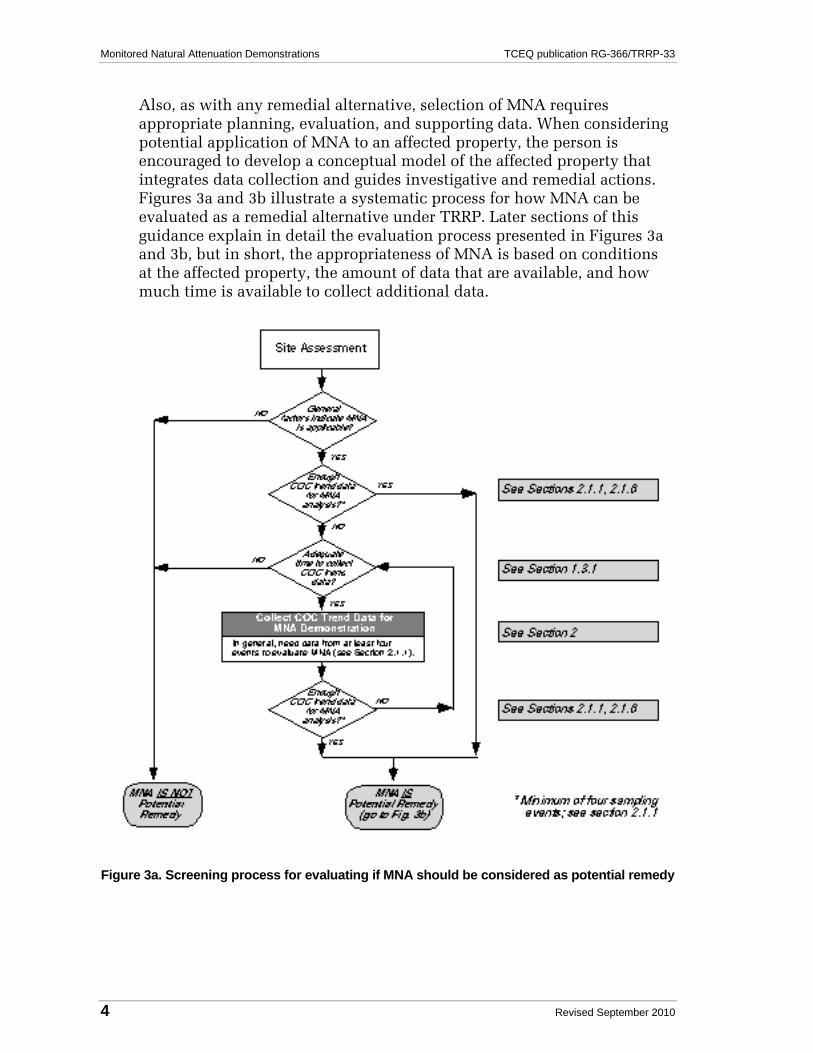
Also, as with any remedial alternative, selection of MNA requires appropriate planning, evaluation, and supporting data. When considering potential application of MNA to an affected property, the person is encouraged to develop a conceptual model of the affected property that integrates data collection and guides investigative and remedial actions. Figures 3a and 3b illustrate a systematic process for how MNA can be evaluated as a remedial alternative under TRRP. Later sections of this guidance explain in detail the evaluation process presented in Figures 3a and 3b, but in short, the appropriateness of MNA is based on conditions at the affected property, the amount of data that are available, and how much time is available to collect additional data.
Figure 3a. Screening process for evaluating if MNA should be considered as potential remedy

TCEQ publication RG-366/TRRP-33 Monitored Natural Attenuation Demonstrations
Revised September 2010 5
Figure 3a shows a screening process to evaluate if MNA should be considered as a potential remedy. First, a series of general factors, shown in Table 1, is assessed to evaluate the general appropriateness of MNA to an affected property. For example, if preliminary affected property data show that groundwater users are now being exposed to COC concentrations exceeding PCLs, then MNA alone will not be an appropriate remedy (Table 1). MNA is most appropriate where exposure potential over the remedial period is low.
Figure 3b. Process for evaluating if MNA is an appropriate remedy
Monitored Natural Attenuation Demonstrations TCEQ publication RG-366/TRRP-33
6 Revised September 2010
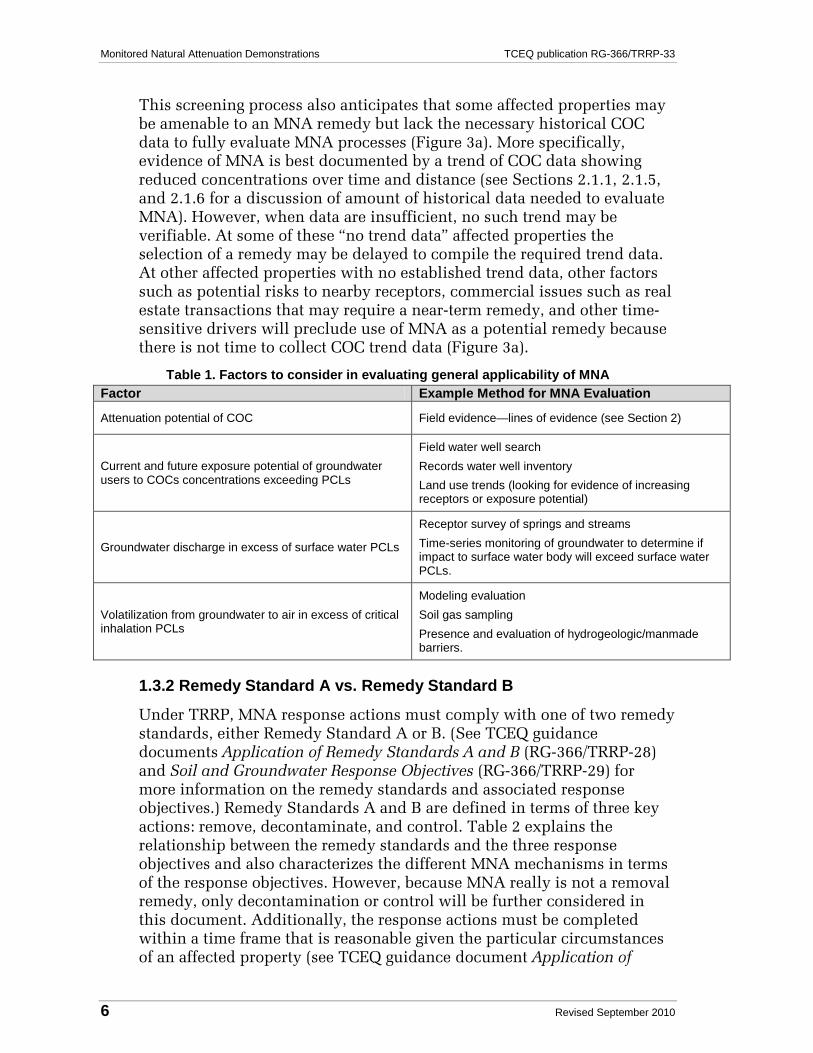
This screening process also anticipates that some affected properties may be amenable to an MNA remedy but lack the necessary historical COC data to fully evaluate MNA processes (Figure 3a). More specifically, evidence of MNA is best documented by a trend of COC data showing reduced concentrations over time and distance (see Sections 2.1.1, 2.1.5, and 2.1.6 for a discussion of amount of historical data needed to evaluate MNA). However, when data are insufficient, no such trend may be verifiable. At some of these “no trend data” affected properties the selection of a remedy may be delayed to compile the required trend data. At other affected properties with no established trend data, other factors such as potential risks to nearby receptors, commercial issues such as real estate transactions that may require a near-term remedy, and other time-sensitive drivers will preclude use of MNA as a potential remedy because there is not time to collect COC trend data (Figure 3a).
Table 1. Factors to consider in evaluating general applicability of MNA Factor Example Method for MNA Evaluation
Attenuation potential of COC Field evidence—lines of evidence (see Section 2)
Current and future exposure potential of groundwater users to COCs concentrations exceeding PCLs
Field water well search Records water well inventory Land use trends (looking for evidence of increasing receptors or exposure potential)
Groundwater discharge in excess of surface water PCLs
Receptor survey of springs and streams Time-series monitoring of groundwater to determine if impact to surface water body will exceed surface water PCLs.
Volatilization from groundwater to air in excess of critical inhalation PCLs
Modeling evaluation Soil gas sampling Presence and evaluation of hydrogeologic/manmade barriers.
1.3.2 Remedy Standard A vs. Remedy Standard B
Under TRRP, MNA response actions must comply with one of two remedy standards, either Remedy Standard A or B. (See TCEQ guidance documents Application of Remedy Standards A and B (RG-366/TRRP-28) and Soil and Groundwater Response Objectives (RG-366/TRRP-29) for more information on the remedy standards and associated response objectives.) Remedy Standards A and B are defined in terms of three key actions: remove, decontaminate, and control. Table 2 explains the relationship between the remedy standards and the three response objectives and also characterizes the different MNA mechanisms in terms of the response objectives. However, because MNA really is not a removal remedy, only decontamination or control will be further considered in this document. Additionally, the response actions must be completed within a time frame that is reasonable given the particular circumstances of an affected property (see TCEQ guidance document Application of

TCEQ publication RG-366/TRRP-33 Monitored Natural Attenuation Demonstrations
Revised September 2010 7
Remedy Standards A and B [RG-366/TRRP-28] for further information on reasonable time frame).
As indicated by Table 2, decontamination via MNA can be applied under Remedy Standards A and B. The key distinction between Remedy Standard A and B is that MNA can be applied as a control only under Remedy Standard B. The form of control applicable to a groundwater PCLE zone is a plume management zone (PMZ). Unless a PMZ is established, the groundwater PCLE zone must not be allowed to expand in size and must be decontaminated until COCs do not exceed the critical PCLs, except as otherwise influenced by the presence of a waste control unit or when technical impracticability is demonstrated. Please see the TCEQ guidance documents Application of Remedy Standards A and B (RG-366/TRRP-28) and Soil and Groundwater Response Objectives (RG-366/TRRP-29) for information on waste control units and technical impracticability. Further, a PMZ can be applied only in certain situations and must be approved as part of a response action plan (RAP). Table 3 lists the circumstances where a PMZ is potentially applicable and the role of MNA in that situation.
Table 2. Response objectives for Remedy Standards A and B
Response Objective Remedy Standard A
Remedy Standard B
Example MNA Mechanism
Remove
Applicable
—a removal remedy is the direct removal of concentrations of COCs that exceed the critical PCLs. Waste or environmental media are removed from the affected property to another location for storage, processing, or disposal in accordance with all applicable requirements.
Applicable None
Decontaminate
Applicable
—a decontamination remedy means a permanent and irreversible treatment process that results in the elimination of concentrations of COCs that exceed their respective critical PCLs. In order for a treatment process to achieve decontamination, it must be demonstrated that it “permanently and irreversibly destroys or extracts COCs in a waste or environmental medium” to levels below the critical PCL and that “any remaining residue after treatment will not pose a threat of future release of COCs” at levels greater than the critical PCLs.
Applicable Biodegradation,
Hydrolysis, Volatilization
Control
Not Applicable
—a control remedy uses physical and/or institutional controls in combination with appropriate maintenance, monitoring, and any necessary further response action to prevent the exposure of human or ecological receptors to concentrations of COCs that exceed their respective PCLs.
Applicable
Controls extent of COCs in a PMZ by
Adsorption, Advection, Dilution,
or Dispersion.
1.3.3 MNA Under Remedy Standard A
Response Action Objectives
In the context of MNA, Remedy Standard A requires COCs to be permanently decontaminated to the critical PCLs throughout the groundwater PCLE zone within a reasonable time frame. Therefore, in order for MNA to be suitable under Remedy Standard A, it must be

Monitored Natural Attenuation Demonstrations TCEQ publication RG-366/TRRP-33
8 Revised September 2010
capable of permanently reducing the COC concentrations to below the critical PCLs. If the attenuation process is not destructive and permanent (decontamination), then the response objectives of Remedy Standard A are not met. Additionally, while the response action is on-going, the groundwater PCLE zone is not allowed to expand. If MNA can meet these response objectives as the sole remedy or in combination with another remedy, then use of MNA is acceptable under Remedy Standard A. Table 4 lists the LOE typically needed to support MNA as a decontamination remedy. The SLOE may not always be required, but will commonly be needed to verify COC decay as well as to augment limited PLOE data.
Table 3. Response objectives for groundwater PCLE zones and MNA requirements
Groundwater PCLE zone status*
Response Objective: Decontaminate
Response Objective: Control (PMZ)
Key MNA Requirement Time Frame
Class 1 GWBU Required Not allowed except
via technical impracticability
PCLE zone reducing to less
than critical PCLs
Must demonstrate time frame is
reasonable given the particular
circumstances at the affected
property
Class 2 GWBU Applicable Applicable
PCLE zone reducing to less
than critical PCLs or maintain PCLE zone within PMZ
Must demonstrate time frame is
reasonable given the particular
circumstances at the affected
property
Class 3 GWBU Applicable Applicable
PCLE zone reducing to less
than critical PCLs or maintain PCLE zone within PMZ
Must demonstrate time frame is
reasonable given the particular
circumstances at the affected
property.
* See TCEQ guidance document Groundwater Classification
Implementation
(RG-366/TRRP-8)
Remedy Standard A is self-implementing. If the person chooses to self-implement, then 10 days before the response action is implemented a Self-Implementation Notice (SIN) must be submitted to the TCEQ. MNA can be self-implemented, but in the SIN the critical PCLs, exposure scenario, and remedial time frame, among other information, must be reported. The SIN will be reviewed by the TCEQ, but the person is authorized to proceed with the response action after that 10th day regardless if TCEQ has responded. If the TCEQ determines MNA does not appear to be appropriate, then the person will be either directed during or after the 10-day period to prove response objectives can be met or change the response action. The affected property assessment report (APAR) may

TCEQ publication RG-366/TRRP-33 Monitored Natural Attenuation Demonstrations
Revised September 2010 9
be submitted to the TCEQ prior to or concurrent with the SIN. However, when the APAR is not submitted prior to or concurrent with the SIN, then for MNA the person needs to include the following additional information with the SIN [§350.92(a)(9)]:
• a scale map illustrating the sampling network and the COC flow pattern;
• time series concentration data indicating COC concentrations are declining (PLOE data);
• appropriate geochemical indicator data as warranted to substantiate decontamination (SLOE data);
• the technical basis for the estimated remedial time frame and supporting degradation rate calculations (SLOE data, and OLOE data as required);
• performance measures to monitor remedial effectiveness and a proposed schedule for submission of response action effective reports (RAERs) (see Section 3.3); and contingencies to be implemented in the event the remedy is ineffective.
If the person decides not to self-implement, then MNA must be proposed within a RAP and receive approval from the TCEQ. Performance measures to monitor remedial effectiveness, a schedule for submission of RAERs, and contingencies to be implemented in the event the remedy is ineffective are included in the RAP. If upon review of the RAER the TCEQ determines that MNA is not satisfactorily progressing to attainment of the response objectives, then the TCEQ will require an alternative remedy to be implemented.
PCLE Zone Status
Under Remedy Standard A, MNA will be used only where a PCLE zone is shrinking in extent, or when used in combination with another decontamination remedy (Table 4). If the PCLE zone is either stable or expanding, then MNA is not acceptable as a sole remedy as the response objectives cannot be met.
1.3.4 MNA Under Remedy Standard B
Response Action Objectives
To achieve Remedy Standard B in the context of MNA, the soil and groundwater PCLE zones must be:
• decontaminated;
• decontaminated and controlled; or
• controlled.

Monitored Natural Attenuation Demonstrations TCEQ publication RG-366/TRRP-33
10 Revised September 2010
As specified in Table 3, the general response objectives for a groundwater PCLE zone are the restoration of the PCLE zone to critical PCLs or establishment of the PMZ. If MNA can meet these response objectives solely or in combination with another remedy in the time frame established to be reasonable for the affected property, then use of MNA is acceptable under Remedy Standard B.
However, the application of MNA to a PMZ is not always allowable by rule. When the current size of the PCLE zone is expanding such that if the expansion is unchecked with a response action the PCLE zone will grow larger than the allowable limit of the PMZ (i.e., the critical PCLs will be exceeded at the groundwater point of exposure (POE)), then MNA cannot be used as the sole response action [§350.33(f)(4)(F)(i)]. However, MNA can be used as the sole groundwater response action if the:
• groundwater PCLE zone is expanding, but MNA will prevent the PCLE zone from extending beyond the approved limits of the PMZ; or
• groundwater PCLE zone is already beyond the limits of the approved PMZ (the PCL is exceeded at the groundwater POE), but is not expanding further and the person can demonstrate MNA will reduce the PCLE zone to within the approved PMZ limits in a reasonable time frame.
Table 4 lists the LOE that typically would be needed to support MNA as a control remedy. NOTE: The LOE are different depending on whether the PCLE zone is smaller than or larger than the limits of the PMZ as well as if the PCLE zone is shrinking, stable, or expanding.
If a PMZ is approved, then attenuation monitoring points and attenuation action levels will be required to be established [§350.33(f)(4)(D)]. An attenuation monitoring point is a monitoring point established within the migration pathway of a COC that is used to verify that a critical PCL will not be exceeded at the groundwater POE. An attenuation action level is the maximum concentration of a COC that can be present in an attenuation monitoring point and not result in the critical PCL being exceeded at the groundwater POE over time. Guidance presented later in this document will discuss factors to consider when selecting the location of attenuation monitoring points.
PCLE Zone Status
Under Remedy Standard B, MNA can be used only where a PCLE zone is stable or shrinking in extent or when the PCLE zone is expanding but will not exceed the PMZ. Table 4 shows the minimum lines of evidence that are likely to be needed to demonstrate MNA for different remedy standards and different plume conditions, and shows when MNA cannot be used to meet response objectives.

TCEQ publication RG-366/TRRP-33 Monitored Natural Attenuation Demonstrations
Revised September 2010 11
Implementation
If a control is applied to any part of the affected property (see §350.4(a)(1) for definition of affected property as this term does not mean a facility or real estate tract, but the environmental media containing COCs in excess of residential assessment levels), then Remedy Standard B is the remedy standard for the whole affected property. For example, if the groundwater PCLE zone is to be decontaminated, but a cap is to be applied to the associated soil PCLE zone, then the remedy standard applied to the affected property is Remedy Standard B. Remedy Standard B is not self-implementing. A RAP must be submitted to and approved by the TCEQ before the remedy can be implemented. MNA will need to be proposed in the RAP whether it is being used for decontamination or as a control (PMZ). If the APAR has not been submitted previously, the APAR must be submitted with the RAP. The APAR is important because much of the information that is used to support the appropriateness of the MNA response action will be contained in the APAR. As part of the RAP, performance measures to monitor remedial effectiveness, a schedule for submission of RAERs, and contingencies to be implemented in the event the remedy is ineffective must be provided. If upon review of the RAER the TCEQ determines that MNA is not satisfactorily progressing to attainment of the response objectives, then the TCEQ will require an alternative remedy to be implemented. The following sections of this guidance outline the MNA demonstrations for both decontamination and PMZs that will need to be provided in the RAP.
Monitored Natural Attenuation Demonstrations TCEQ publication RG-366/TRRP-33
12 Revised September 2010
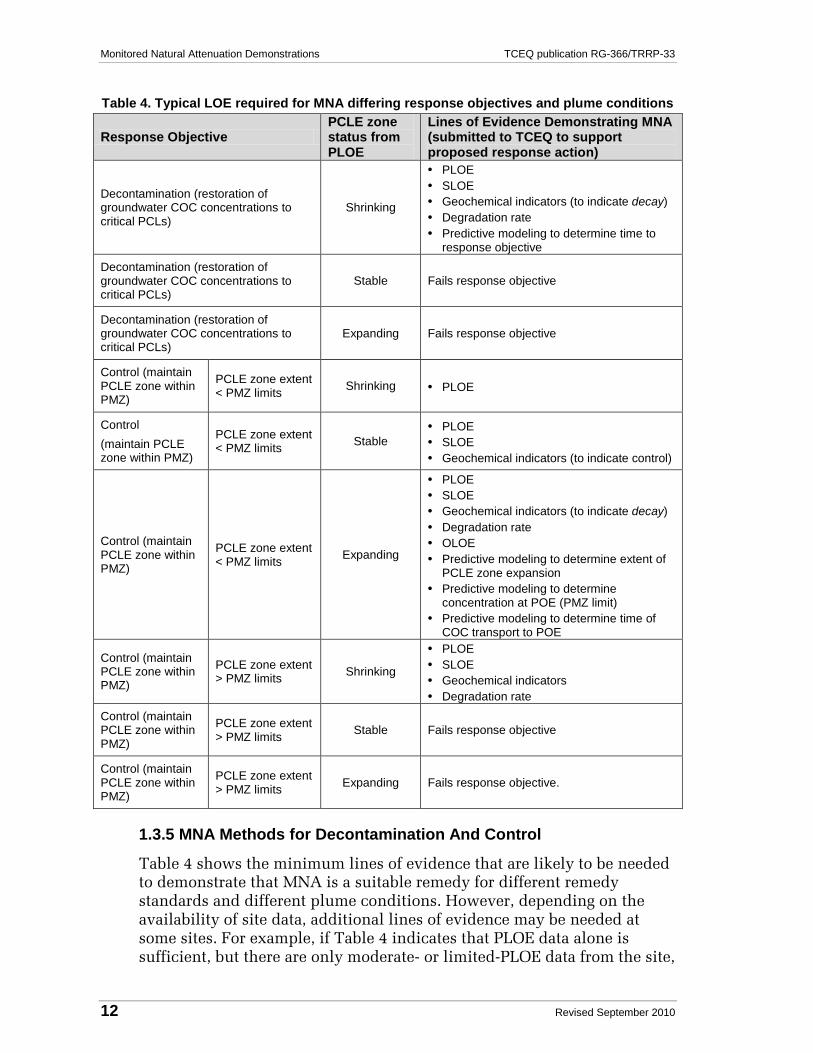
Table 4. Typical LOE required for MNA differing response objectives and plume conditions
Response Objective PCLE zone status from PLOE
Lines of Evidence Demonstrating MNA (submitted to TCEQ to support proposed response action)
Decontamination (restoration of groundwater COC concentrations to critical PCLs)
Shrinking
• PLOE • SLOE • Geochemical indicators (to indicate decay• Degradation rate
)
• Predictive modeling to determine time to response objective
Decontamination (restoration of groundwater COC concentrations to critical PCLs)
Stable Fails response objective
Decontamination (restoration of groundwater COC concentrations to critical PCLs)
Expanding Fails response objective
Control (maintain PCLE zone within PMZ)
PCLE zone extent < PMZ limits Shrinking • PLOE
Control (maintain PCLE zone within PMZ)
PCLE zone extent < PMZ limits Stable
• PLOE • SLOE • Geochemical indicators (to indicate control)
Control (maintain PCLE zone within PMZ)
PCLE zone extent < PMZ limits Expanding
• PLOE • SLOE • Geochemical indicators (to indicate decay• Degradation rate
)
• OLOE • Predictive modeling to determine extent of
PCLE zone expansion • Predictive modeling to determine
concentration at POE (PMZ limit) • Predictive modeling to determine time of
COC transport to POE
Control (maintain PCLE zone within PMZ)
PCLE zone extent > PMZ limits Shrinking
• PLOE • SLOE • Geochemical indicators • Degradation rate
Control (maintain PCLE zone within PMZ)
PCLE zone extent > PMZ limits Stable Fails response objective
Control (maintain PCLE zone within PMZ)
PCLE zone extent > PMZ limits Expanding Fails response objective.
1.3.5 MNA Methods for Decontamination And Control
Table 4 shows the minimum lines of evidence that are likely to be needed to demonstrate that MNA is a suitable remedy for different remedy standards and different plume conditions. However, depending on the availability of site data, additional lines of evidence may be needed at some sites. For example, if Table 4 indicates that PLOE data alone is sufficient, but there are only moderate- or limited-PLOE data from the site,

TCEQ publication RG-366/TRRP-33 Monitored Natural Attenuation Demonstrations
Revised September 2010 13
then additional LOE will likely be required. Table 5 shows examples of what LOEs are used for sites with different amounts/quality of PLOE data.
Table 5. Typical LOE Required for MNA Response Actions Based on Different PLOE Scenarios
Response Action; Objective
Extensive PLOE Data Moderate PLOE Data Limited PLOE Data
Remedy Standard A or
Remedy Standard B;
Decontaminate
• Sufficient and good data from primary line of evidence showing destruction of COCs (e.g., 4 or more sampling events spaced evenly over the course of one year to check influences of variations in groundwater conditions and from multiple wells down centerline of plume showing consistently decreasing PCLE zone)
• Moderate data from primary line of evidence (e.g., several wells with no trend, but overall data indicates decreasing PCLE zone)
• Secondary: geochemical indicators (compatible with destruction/permanent immobilization processes); possibly rate calculations
• Limited data from primary line of evidence (e.g., many wells with no trend; few wells or few sampling events limit ability to demonstrate decreasing PCLE zone)
• Secondary: geochemical indicators (compatible with destruction/ permanent immobilization processes), possibly rate calculations
• Other: modeling (either simple time/length calculation, analytical model, or numerical model)
Remedy Standard B;
Control
• Sufficient and good data from primary line of evidence showing control of COCs (e.g., multiple sampling events spaced evenly over the course of one year to check influences of variations in groundwater conditions and from multiple wells down centerline of plume showing consistently decreasing, or stable PCLE zone)
• Moderate data from primary line of evidence (e.g., several wells with no trend, but overall data indicates decreasing, stable, or acceptably increasing PCLE zone)
• Secondary: rate calculations
• Limited data from primary line of evidence (e.g., many wells with no trend; few wells or few sampling events limit ability to demonstrate decreasing, stable, or acceptably increasing PCLE zone;
• Secondary: geochemical indicators; possibly rate calculations
• Other: modeling study (either simple time/length calculation, analytical model, or numerical model)
Note: For decontamination, the PLOE must not show that concentrations are increasing. For control,
1.3.6 Reasonable Time Frame
the data must support the conclusion that the PCLE zone will not exceed the PMZ. At affected properties where the PLOE shows no overall trend, MNA is still a potential remedy if other lines of evidence (geochemical indicators, modeling, rate calculations, etc.) provide strong supporting evidence that MNA will control the plume. For affected properties where the PCLE zone is projected to increase but not expand beyond the PMZ, some type of modeling or other analysis besides the PLOE and SLOE will likely be needed as supporting information.
For either Remedy Standard A or B, an MNA demonstration must address the requirement that remedial goals be achieved in a reasonable time frame. This can be done by 1) comparing times required using other remedial alternatives at the same affected property under similar conditions; and/or 2) developing estimates of how long MNA will take to reach the cleanup goals (see Sections 2.3.2 and 2.5 ). TRRP guidance

Monitored Natural Attenuation Demonstrations TCEQ publication RG-366/TRRP-33
14 Revised September 2010
document Application of Remedy Standard A and B (RG-366/TRRP-28) expands on the discussion of a reasonable time frame. In order to lessen the estimated time frame required to complete the MNA, persons may consider the use of amendments such as nutrients or oxygen agents to stimulate microbial activity. However, ensure that all TCEQ approvals, registrations or permitting requirements are met for the injection action or use of injection wells.
1.4 Special Topics: Source Zones Most groundwater PCLE zones are formed under one or more of three different COC source scenarios:
1. Aqueous-phase release to subsurface
2. Leaching from source material in the vadose zone
3. Non-aqueous phase liquid (NAPL) release to the saturated zone
For the second and third source mechanisms, there often is a continuing release of COCs to groundwater from a source zone. Under Remedy Standard A and B, MNA is an appropriate remedy if natural attenuation processes are sufficient to decontaminate both the dissolved-phase PCLE zone and any source materials residing in the groundwater, including NAPLs (if the PCL is less than COC solubility). If natural attenuation processes cannot be demonstrated to decontaminate the groundwater source zone in a reasonable time frame, then MNA is not appropriate as a sole remedy. Under Remedy Standard B, MNA is an appropriate control remedy if natural attenuation processes can control the dissolved-phase PCLE zone resulting from source zones. If any NAPL is present in the groundwater, the NAPL must be managed in accordance with TCEQ guidance document Risk-Based NAPL Management (RG-366/TRRP-32).
2.0 MNA Methods MNA in TRRP is demonstrated using the lines-of-evidence approach. The most direct demonstrations for the natural attenuation remediation option are those that utilize existing historical groundwater monitoring data that, if appropriately obtained, indicate that the COC PCLE zone is stable or shrinking. This is the PLOE. Affected properties at which evidence of decontamination is needed or where the historical groundwater COC concentration monitoring data do not conclusively demonstrate control can be evaluated further by utilizing SLOE. The SLOE provide information on the current status of natural attenuation at the affected property. Such lines of evidence include PCLE zone geochemistry and determinations of natural attenuation rates. At some affected properties, more detailed information from calculations or modeling studies may be required to help predict the future behavior of a PCLE zone. Table 6 summarizes qualitatively the types of demonstration for the natural attenuation option.

TCEQ publication RG-366/TRRP-33 Monitored Natural Attenuation Demonstrations
Revised September 2010 15
Table 6. Types of Natural Attenuation Demonstrations
Level of Demonstration Line of Evidence Elements of Evidence
Primary “How has PCLE zone behaved historically?”
Historical groundwater COC monitoring
Secondary “What is occurring in PCLE zone now?”
Geochemistry Attenuation rates
Other “How will PCLE zone behave in future?”
Conservative calculations (see Section 2.4.1), predictive modeling, microcosm studies.
2.1 Data Considerations The property characteristics and the remedy standard dictate data requirements and should be considered when determining data requirements:
• Response objective to be achieved
• Proximity to POEs
• COCs
• Groundwater flow velocity and direction, including variations in groundwater conditions
• Hydrogeologic setting
Examples of how these considerations can influence different data collection matters are discussed below.
2.1.1 Amount/Quality of Data
When the groundwater PCLE zone is in close proximity to receptors, more detailed PLOE and SLOE is needed to implement natural attenuation as a response action. This is especially crucial if potential receptors, such as drinking water wells or surface water, are proximate to and downgradient of a groundwater PCLE zone. Additionally, situations where receptors do not currently exist in proximity to the PCLE zone, but are reasonably likely to develop in the future warrants gathering more PLOE and SLOE than for affected properties where the PCLE zone is remote from actual or probable receptors. For example, if an on-site groundwater PCLE zone is impinging on a property boundary, more PLOE and SLOE should be developed than if the groundwater PCLE zone is two years groundwater travel time from the edge of a PMZ that is remote from any property boundary and on-site receptors. Typically MNA studies will have PCLE zone maps from different time intervals, concentration vs. time plots from different individual wells, and concentration vs. distance plots for wells in the plume axis.
A strong PLOE can be demonstrated on the basis of a minimum of four sampling events spaced evenly over the course of a year (see TCEQ

Monitored Natural Attenuation Demonstrations TCEQ publication RG-366/TRRP-33
16 Revised September 2010
guidance document Compliance Sampling and Monitoring (RG-366/TRRP-30)) to check the effect variations in groundwater conditions may have on MNA, if the affected property is well understood. Four quarters of time series data represent the minimum sampling requirements for relatively simple affected properties, or affected properties that are well understood.
2.1.2 Monitoring Points
Regardless of the groundwater response objective or property characteristics, multiple groundwater attenuation monitoring points should be placed along the groundwater flow path to evaluate MNA. This will allow for proper measurement of COC concentrations and comparison to the attenuation action levels that will be established in the RAP for a PMZ. Moreover, multiple monitoring points along the flow path facilitate gathering data that provides PLOE and SLOE for both remedy standards. In the context of decontamination, PCLE zone shrinkage along the groundwater flow path is usually the best indicator of PCLE zone shrinkage as a whole.
2.1.3 Daughter Products
A number of organic COCs degrade into daughter products under natural conditions. For example, 1,1,1-trichloroethane (1,1,1-TCA) can chemically degrade to 1,1-dichloroethene (1,1-DCE), 1,1-dichloroethane (1,1-DCA), vinyl chloride, and chloroethane. Daughter products of COCs that are being addressed under TRRP are themselves COCs. As such, PCLs are assigned to daughter products. As discussed in Section 2.3.1, the presence of the daughter products is a SLOE that degradation of the parent COC is occurring. Table 8 lists some common daughter products.
Additionally, daughter products can also be important because in some instances they are more toxic than the parent COC. For example, vinyl chloride is more toxic than the parent 1,1,1-TCA. Therefore, for both of the reasons mentioned, concentrations of the original (parent) COCs and daughter products must be monitored. The TCEQ exercises reasonableness in determining how far to carry the evaluation of daughter products. For example, if the maximum possible concentration of the parent COC is stable or declining and less than the PCL of the daughter product, and the maximum possible concentration of the daughter product does not exceed its PCL, then further concern of the daughter product may be deferred because if all of the parent COC were transformed to the daughter product, the daughter product PCL could not be exceeded. However, all daughter products must be considered.
Daughter products should not be allowed to cause groundwater to become affected beyond the PCLE zone or PMZ, as applicable. The spatial distribution of daughter products may need to be presented as part of the demonstration of acceptable PCLE zone and PMZ behavior.

TCEQ publication RG-366/TRRP-33 Monitored Natural Attenuation Demonstrations
Revised September 2010 17
2.1.4 Geochemistry / Modeling
When implementing decontamination or a PMZ, groundwater geochemistry data should be collected as necessary as PLOE and SLOE of COC decontamination. The types of geochemical analyses should be tailored to the COCs being addressed by natural attenuation. For example, for chlorinated hydrocarbons it may be necessary to collect data for potential competing electron acceptors (dissolved oxygen, nitrate, sulfate), indirect indicators of competing electron acceptors (ferrous iron and methane), potential fermentation substrates (Total Organic Carbon), chlorides, alkalinity and dechlorination end products, such as ethane and ethene.
A PMZ will require groundwater monitoring to ensure that the PCLE zone does not grow beyond what the PMZ allows. Therefore, other lines of evidence, specifically groundwater computer modeling or conservative calculations (see Section 2.4.1), may be needed to predict PCLE zone behavior. To develop an acceptable groundwater model to act as other evidence for natural attenuation, sufficient data should be gathered to calibrate the groundwater model. When computer modeling is used as other evidence to support a PMZ, model calibration and sensitivity analysis should be documented in the RAP.
2.1.5 Field Measurements
In summary, the following data should be derived from field measurements for most MNA demonstrations:
• Hydraulic conductivity data from slug tests, pump tests, or other aquifer tests;
• Groundwater flow maps based on data from at least four monitoring wells;
• Fraction organic carbon (foc) measurements of clean groundwater-bearing unit material (not needed for affected properties with only inorganic COCs);
• COC measurements from at least four wells which are appropriately located;
• Daughter products measurements, if present, at the affected property.
2.1.6 Level of Information
In general, more information (for example, more wells, more samples, more lines of evidence) could be required for MNA demonstrations at affected properties with these conditions:
• Karst groundwater-bearing units;
• Fractured rock groundwater-bearing units;
• Class 1 groundwater-bearing units
• Complex, multi-layered hydrogeology;
Monitored Natural Attenuation Demonstrations TCEQ publication RG-366/TRRP-33
18 Revised September 2010
• COC concentrations much greater than PCLs;
• COCs that yield daughter products of concern;
• Affected properties with persistent COCs at high concentrations;
• NAPLs;
• Receptors near PCLE zone boundaries; and
• Affected properties with hydrogeologic conditions that change over time.
In general, less information (for example, fewer wells, fewer samples, fewer lines of evidence) could be required for MNA demonstrations at affected properties with these conditions:
• Single layer unconsolidated groundwater-bearing units;
• Class 3 groundwater-bearing units;
• Affected properties with only BTEX (benzene, toluene, ethylbenzene, and xylenes) COCs;
• Affected properties with COC concentrations near PCLs;
• COCs that do not yield daughter products of concern;
• No free-phase NAPLs;
• No receptors near PCLE zone boundaries; and
• Affected properties with hydrogeologic conditions that do not appear to change over time.
In all cases, the data must be sufficient to demonstrate that MNA will serve as an effective remedy at an affected property.
2.2 How to Analyze and Present the Primary Line of Evidence
Conceptual Model
Each MNA demonstration should have a discussion of the conceptual model of the affected property with a review of the source mechanisms, key fate and transport processes that can contribute to natural attenuation, and the ultimate fate of COCs in the subsurface. Other key factors include:
1. Potential receptors
2. Groundwater flow paths
3. Sources that discharge COCs to groundwater
4. Natural attenuation processes that decontaminate or control the migration of COCs in groundwater
5. Transformations of COCs into other COCs through natural processes, such as reductive dechlorination

TCEQ publication RG-366/TRRP-33 Monitored Natural Attenuation Demonstrations
Revised September 2010 19
Maps and Graphs
Maps and graphs are useful in analyzing and presenting primary evidence of natural attenuation. Graphical comparisons of PCLE zone size over time will show if the PCLE zone is shrinking, stable, or expanding. These graphical comparisons can be of the PCLE zone as a whole over time. The gross PCLE zone outline for sequential monitoring events can be compared to determine PCLE zone behavior. For decontamination, COC mass estimates over time may be graphically analyzed and presented to demonstrate COC destruction. Graphs of COC concentrations along groundwater flow paths can be compared for sequential monitoring events. This will often show whether the PCLE zone is shrinking, stable or expanding. Plots of single well concentrations versus time are useful in determining whether PCLE zones are stable or shrinking. Under a control response action, a number of plots of concentrations vs. time from individual wells may be useful in determining whether a PCLE zone that has been expanding within a PMZ has now stabilized.
In summary, key graphics that should be included at a minimum in MNA demonstration for affected properties with data over time are:
• A sufficient number of historic PCLE zone maps vs. time that represent the overall dynamic of the plume (Figure 4).
• A sufficient number of concentration vs. time plots for individual monitoring wells (for at least two wells from the source and leading edge along the centerline of the plume over the entire sampling record) that represent the overall dynamic of the plume (Figure 5).
• Concentration vs. distance plot for wells (along the centerline of the PCLE zone) (Figure 6).
Figure 4. Example of historic PCLE zone maps over time

Monitored Natural Attenuation Demonstrations TCEQ publication RG-366/TRRP-33
20 Revised September 2010
Figure 5. Example of concentration vs. time graphs
Optional graphics include mass estimates for the dissolved phase COCs within the PCLE zone vs. time plots
Statistics
There are a number of statistical methods that can be used as primary evidence. Statistical methods are most compelling when used in conjunction with graphics (see TCEQ guidance document Compliance Sampling and Monitoring [RG-366/TRRP-30]). Some statistical methods, such as Mann-Kendall, are useful for discerning trends that may not be apparent graphically. An example Mann-Kendall analysis for a single well is provided in TCEQ guidance document Compliance Sampling and Monitoring (RG-366/TRRP-30). Other statistical data such as the confidence factor and the coefficient of variation can be used to determine PCLE zone trends (for example, see the Air Force MAROS system; see 4.0 Key Reference Documents on page 38).
Other statistical methods, such as linear regression and Sen’s Test (see 4.0 Key Reference Documents on page 38), are accepted statistical methods for evaluating PCLE zone trends as part of the PLOE.

TCEQ publication RG-366/TRRP-33 Monitored Natural Attenuation Demonstrations
Revised September 2010 21
Figure 6. Example of concentration vs. distance plots
2.3 How to Analyze and Present Data for Secondary Line of Evidence
Proper analysis and presentation of data that provides a SLOE demonstration that MNA will be an effective remedy is essential. This section discusses the SLOE that are commonly used to support MNA evaluations and provides guidance for how to present the demonstration in order to substantiate MNA as a remedy to the TCEQ.
2.3.1 Show Destruction with Geochemical “Footprints”
For some affected properties, groundwater geochemical indicator data should be evaluated and displayed in the MNA demonstration to show that COC decontamination is occurring. Where decontamination is occurring, a pattern or “footprint” to the geochemical indicator data will commonly be present that is in relation to the location of the PCLE zone. For example, there will often be a pattern or “footprint” of depressed dissolved oxygen concentrations in the groundwater that coincides with the BTEX PCLE zones that is indicative of aerobic microbial degradation of the BTEX. Several protocols discuss the collection and interpretation of geochemical indicators (see 4.0 Key Reference Documents on page 38), and Table 7 provides recommended analytical methods.

Monitored Natural Attenuation Demonstrations TCEQ publication RG-366/TRRP-33
22 Revised September 2010
Table 7. Recommended Analytical Protocols for Natural Attenuation Geochemical Indicators
Analyte Method Comments
Dissolved Oxygen1
EPA-360.1 ASTM D 888-92 (
• Instrumental probe methods Precision: ±0.05 mg/L Test Method B)
Redox Potential (Eh)1 ASTM D 1498-93
• Instrumental probe method • Measurement performed contemporaneous with analysis of
dissolved oxygen
Nitrate in Field Portable Colorimeter
• Requires ~100 mL water • Remove colloids/turbidity: pass sample through 2-µm filter • Calibrate and operate instrument in accordance with manufacturer’s
instructions
Nitrate in Laboratory
EPA353.2,EPA9200 (Colorimetry)
• Remove turbidity: pass sample through 2-µm filter • Refrigerate: to 4ºC for analysis within 24 hours • Acidify: 2 mL/L H2SO
Nitrate in Laboratory
ASTM D 4327 (Ion Chromatography)
• Remove turbidity: pass sample through 2-µm filter • Refrigerate: to 4ºC for analysis within 24 hours • Acidify: 2 mL/L H2
Sulfate in Field
SO
Portable Colorimeter
• Requires ~100 mL water • Remove colloids/turbidity: pass sample through 2-µm filter • Calibrate and operate instrument in accordance with manufacturer’s
instructions
Sulfate in Laboratory
EPA 375.4, EPA 9038, ASTM D 516 (Turbidimetry)
• Remove turbidity: pass sample through 2-µm filter • Refrigerate: 4ºC for analysis within 24 hours
Sulfate in Laboratory EPA 9036 (Colorimetry) • Remove turbidity: pass sample through 2-µm filter
• Refrigerate: 4ºC for analysis within 24 hours
Sulfate in Laboratory
EPA 9056 (Ion Chomatography)
• Remove turbidity: pass sample through 2-µm filter • Refrigerate: 4ºC for analysis within 24 hours
Ferrous Iron in Field Portable Colorimeter
• Requires ~100 mL water • Do not filter sample • Calibrate and operate instrument in accordance with manufacturer’s
instructions
Methane, ethane, ethene
Kampbell et al., 1989 and 1998 or SW381 Modified
• Kampbell and Vandegrift (1998) Analysis of dissolved methane, ethane, and ethene in ground water by a standard gas chromatographic technique: J. Chromatogr. Sci..
• Kampbell, D.H. Wilson, J.T., and Vandegrift, S.A., 1989. Dissolved oxygen and methane in water by a GC headspace equilibrium technique: Int. J. Environ. Analy. Chem., 36:249-257.
Shallow well depth
NOTE: Well Depth Sample Collection Considerations
Down-Hole Probe & Direct-Reading Meter
• Analyze prior to purging of monitoring well • Decontaminate probe carefully
Intermediate well depth
Flow-Through Cell & Direct-Reading Meter
• Analyze purge water • Use peristaltic pump (if depth to water is shallow enough to avoid excessive degassing of volatile
constituents). • Use flow-through cell; maintain flow across probe • Prevent bubbling in cell.
Deep well depth
Flow-Through Cell & Direct-Reading Meter
• Analyze purge water • Use bailer with slow immersion; minimize disturbance to water column to prevent aeration • Drain bailer from bottom with tube into flow-through cell; maintain flow across probe.

TCEQ publication RG-366/TRRP-33 Monitored Natural Attenuation Demonstrations
Revised September 2010 23
Note that in Table 7 the sample collection method varies according to a qualitative well depth of shallow, medium, or deep. This is related to the feasibility of sample collection as a function of well depth and there is no intent to provide specific definitions of these depths.
Table 8. Examples of Geochemical Indicators of COC Destruction for Common Organic COCs
COC (PCLE Zones) Geochemical Indicators of Groundwater COC Degradation
Supplemental Geochemical Indicators of Groundwater COC Degradation
BTEX or Other Fuel Hydrocarbon (but not
MTBE/oxygenates)
• Dissolved oxygen (DO) depletion • Nitrate (NO3
-
• Ferrous Iron (Fe) depletion
2+
• Sulfate (SO) enrichment
42-
• Methane enrichment ) depletion
• Manganese (Mn2+
• CO) enrichment
2
• Alkalinity enrichment
Perchloroethene (PCE)
• Anaerobic conditions (low DO, low redox potential, methane enrichment)
• Trichloroethene (TCE) enrichment* and cis
• Vinyl chloride (VC) enrichment* -1,2-dichloroethene (DCE) enrichment*
• Anaerobic conditions • Chloride enrichment (only observable at
some affected properties) • trans• Ethene enrichment
1,2-dichloroethene enrichment
• Ethane enrichment • Alkalinity
Trichloroethene (TCE )
• Anaerobic conditions (low DO, low redox potential, methane enrichment)
• cis• Vinyl chloride (VC) enrichment*
-1,2-dichloroethene (DCE) enrichment*
• Anaerobic conditions • Chloride enrichment (only observable at
some affected properties) • trans• Ethene enrichment
1,2-dichloroethene enrichment
• Ethane enrichment • Alkalinity
cis-1,2-chloroethene (cis-DCE )
• Anaerobic conditions (low DO, low redox potential, methane enrichment)
• Vinyl chloride enrichment*
• Anaerobic conditions • Chloride enrichment (only observable at
some affected properties) • Aerobic conditions (in some cases) • Alkalinity
Vinyl Chloride (VC) • Enrichment of ethene, ethane
• Aerobic conditions or anaerobic conditions
• Chloride enrichment (only observable at some affected properties)
• Alkalinity
1,1,1-Trichloroethane (1,1,1-TCA)
• 1,1-DCA enrichment* • 1,1-DCE enrichment (hydrolysis product)
• Vinyl chloride (VC) enrichment • Chloride enrichment (only observable at
some affected properties) • Ethane enrichment • Alkalinity
1,2-Dichloroethane (1,2-DCA)
• Ethene enrichment (anaerobic dihaloelimination product)
• Ethane enrichment (aerobic and anaerobic biodegradation product)
• Chloride enrichment (only observable at some affected properties)
• Alkalinity
Carbon Tetrachloride • Anaerobic conditions (low DO, low redox
potential, methane enrichment) • Trichoromethane (chloroform)
enrichment*
• Chloride enrichment (only observable at some affected properties)
• Dichloromethane (methylene chloride) enrichment
• Chloromethane enrichment • Alkalinity.
* This is potentially a daughter product if this COC was not part of the source materials in the original release.

Monitored Natural Attenuation Demonstrations TCEQ publication RG-366/TRRP-33
24 Revised September 2010
Table 8 provides a brief summary of key geochemical indicators for common types of COCs and affected properties. Chief geochemical indicators are the ones expected at most affected properties with each particular COC that is undergoing natural attenuation processes. Supplemental geochemical indicators are less commonly used (non-routine), or are not observed as prominently as the chief indicators, or are more difficult to interpret. Note this list is not meant to be inclusive, but only provides a summary of more prominent geochemical indicators. Geochemical indicator data are commonly presented in maps (Figure 7.) and/or graphs (Figure 8).
Figure 7. Example of geochemical footprint map
Figure 8. Example of geochemical footprints plot

TCEQ publication RG-366/TRRP-33 Monitored Natural Attenuation Demonstrations
Revised September 2010 25
Note that some COCs (1,2-DCA, DCE, VC) can biodegrade in either anaerobic or aerobic conditions, and therefore indicators of these conditions could be used to support the conclusions that geochemical conditions are appropriate for destruction.
2.3.2 Rate Calculations
An additional SLOE for the demonstration of natural attenuation is the determination of the rate of degradation of COCs measured within the PCLE zone. COC attenuation rate calculations comprise two different methods, each of which is capable of producing quantitative data that can demonstrate the progress of, and provide support for, the natural attenuation remedial option. Additionally, the COC attenuation rate is required information in cases when predictive modeling is used to estimate the time necessary to meet remedial goals. The methods entail: 1) COC concentrations versus time, and 2) COC concentrations versus distance. However, each method of rate calculation is applicable only to a specific condition of groundwater PCLE zone dynamics as described below.
Caution is advised in the use of these methods as they are not strictly applicable to families of COCs which undergo sequential reactions that produce decay products (daughters) of a precursor (parent) COC, such as occurs with some chlorinated solvents.
COC Concentration vs. Time Attenuation Rate Constant
The documentation of the reduction of COCs in shrinking PCLE zones is established previously as the PLOE. The rate of COC degradation occurring within the PCLE zone is determined using the concentration versus time relationship. Rate calculations are needed only to support the case where the PLOE is not sufficient to determine if MNA will work. In the case of a shrinking PCLE zone, the rate of COC attenuation is greater than the rate of COC added to the PCLE zone. The time rate of COC attenuation has been observed to follow a first-order decay relationship:
( ) ( )tki
timeeCtC −= [2.1]
where,
C(t) = concentration (such as mg/L) as a function of time, t (such as years)
Ci = concentration at t = 0 (such as mg/L or ug/L)
t = time (in units such as years; the units will determine the units of ktime)
ktime = first order attenuation rate constant (such as per year)
Graphically, the regression method requires log COC concentration to be plotted against time for each monitoring well. A first-order COC attenuation will plot as a straight line. The slope of the regressed line

Monitored Natural Attenuation Demonstrations TCEQ publication RG-366/TRRP-33
26 Revised September 2010
(ktime) gives the decay rate constant, the y-intercept gives the initial concentration (Ci) (Figure 9).
For late-time PCLE zone data which have reached asymptotic concentrations, or when there is a need to confirm a long-term asymptotic concentration, the following equation can be employed:
( ) ( ) ( )a
tkai CeCCtC time +⋅−= − [2.2]
where,
Ca = asymptotic concentration
In summary, concentration vs. time rate constants:
• Can be used to show attenuation is occurring.
• Can be used to predict how long COCs will persist in the subsurface.
• Can be used for evaluating if MNA can achieve remediation goals in a reasonable time frame (see Section 2.5).
• Cannot be used as a biodegradation rate in a fate and transport model.
Figure 9. Concentration vs. time rate constant calculation

TCEQ publication RG-366/TRRP-33 Monitored Natural Attenuation Demonstrations
Revised September 2010 27
COC Concentration vs. Distance Attenuation Rate Constant
When the PLOE indicates the constant COC concentrations of a stable PCLE zone (i.e., COC concentrations which remain constant over time in each monitoring well) a different type of attenuation rate can be determined using the concentration vs. distance relationship (Buscheck and Alcantar, 1995). Again, rate calculations are needed only to support the case where the PLOE is not sufficient to determine if MNA will work. In a stable PCLE zone, the rate of attenuation is equal to the rate of dissolved- phase COC mass loading to the groundwater-bearing unit from the source. The COC source influx rate is controlled by a COC’s effective solubility and the flow rate of groundwater through the source area. In the following relation, residence time, t, is described in terms of the groundwater seepage velocity (also called pore water velocity or linear velocity), v (L/T) and distance traveled, x (L):
vxt = [2.3]
where,
x = distance over which pore water moves from the source, x (ft)
v = pore water velocity (groundwater seepage velocity), v (ft/yr)
The first-order attenuation rate equation can be rewritten for concentration as a function of distance:
( ) ( )vxkdisteCxC −
= 0 [2.4]
where,
C(x) = concentration as a function of distance, x (feet)
C0 = concentration at x = 0 (mg/L or ug/L)
kdist = first-order attenuation rate constant (year-1)
A minimum of three monitoring wells placed along the groundwater flow direction is necessary for this method. Data are plotted as log COC concentration vs. distance. For multiple sampling event data, the plotted concentrations are the average concentration over time for each well. The slope of the line is k/v (L
-1), the reciprocal of the attenuation distance. The attenuation rate constant, kdist (T
-1), is obtained by multiplying the slope (k/v) by the groundwater velocity, v (L/T). The kdist/v term also can be useful for selecting downgradient monitoring well locations whose placement must be a function of travel time.
In summary, concentration vs. distance constants:
• Can be used to show attenuation is occurring.

Monitored Natural Attenuation Demonstrations TCEQ publication RG-366/TRRP-33
28 Revised September 2010
• Can be used for predicting concentrations along any point of the center line of the plume or at some point beyond the current monitoring system (Figure 10).
Figure 10. Concentration vs. distance rate constant calculation
• Cannot be used to estimate how long (how many years) the PCLE zone will persist in the subsurface.
• Cannot be used as a biodegradation rate in a fate and transport model.

TCEQ publication RG-366/TRRP-33 Monitored Natural Attenuation Demonstrations
Revised September 2010 29
COC Biodegradation Rate Constants
The last type of rate constant is a biodegradation rate constant. It represents how quickly groundwater COCs are decontaminated by biodegradation alone (no effects of dispersion or retardation). They can be calculated using concentration vs. distance data and simple modeling relationships (Buscheck and Alcantar, 1995) by comparing COC concentrations to no- or low-biodegradable tracers (Rifai and Newell, 2001), or by calibrating a groundwater model to groundwater COC concentration vs. distance data (see Section 2.4.1). A biodegradation rate constant:
• Can be used to show attenuation is occurring.
• Can be used in a fate and transport model for predicting concentrations along any point of the center line of the plume or at some point beyond the current monitoring system.
• Cannot be used to estimate how long (how many years) the PCLE zone will persist in the subsurface.
2.4 Other Lines of Evidence When the PLOE and SLOE are insufficient to definitively demonstrate the adequacy of MNA as a response action, OLOE will need to be evaluated unless the MNA is voluntarily dropped from further consideration. This section discusses examples of OLOE that can be considered.
2.4.1 Demonstrate MNA Processes with Modeling
Groundwater models are typically used to support the conclusions drawn from an analysis of the PLOE and in some cases the SLOE (Figure 3b) that:
• Attenuation is occurring;
• The PCLE zone is either shrinking, stable, or will not expand beyond the PMZ;
and can provide the:
• Estimated time of COC transport to the point of exposure;
• Estimated concentration(s) of COC at the point of exposure.
Groundwater modeling includes 1) conservative calculations; 2) natural attenuation factor (NAF) calculations (see TCEQ guidance document Application of Tier 1 and 2 NAF Models [RG-366/TRRP-26]); and 3) the use of computer fate and transport models.
To help demonstrate that attenuation is occurring, conservative calculations or NAF calculations can be applied. One type of conservative calculation is to compare a theoretical PCLE zone length to the actual length of the PCLE zone. If the theoretical PCLE zone length is significantly longer than the actual length, then attenuation processes

Monitored Natural Attenuation Demonstrations TCEQ publication RG-366/TRRP-33
30 Revised September 2010
(dispersion, sorption, and/or degradation) are shown to be active at the affected property (Figure 11).
NAF calculations based on a groundwater model (the lateral transport Domenico solution) are described more fully in TCEQ guidance document Application of Tier 1 and 2 NAF Models (RG-366/TRRP-26). The resulting NAF can be used to demonstrate that natural attenuation processes reduce COC concentrations after they leave the source zone. Alternatively, biodegradation rate constants can be calculated by calibrating a fate-and-transport model against concentration vs. distance data to yield a biodegradation rate constant. If a model with a decaying source is used, a concentration vs. time rate constant can also be determined. Reporting rate constants in an MNA demonstration support the conclusion that attenuation is occurring.
Figure 11. Example of a conservative calculation
Computer modeling requires an additional level of sophistication compared to NAF calculations or hand calculations. One approach for applying either analytical or numerical computer models in MNA demonstrations is to:
1. Select a model. In general, one should use the simplest model that simulates the key natural attenuation processes that are occurring. In many cases, a simple analytical model can serve as a cost-effective

TCEQ publication RG-366/TRRP-33 Monitored Natural Attenuation Demonstrations
Revised September 2010 31
approach for incorporating modeling into MNA demonstration as long as conservative assumptions are used to account for processes that are not incorporated into the model. The use of complicated numerical models should be reserved for more complex affected properties.
2. Collect and enter input parameters. In some cases field data will be required (e.g., hydraulic conductivity, hydraulic gradient, fraction organic carbon, COC data, source dimensions, release data). Partition coefficients are obtained from the TRRP rule (Figures: 30 TAC §350.73(e), and 30 TAC §350.73(e)(1)(A)–(C), or from site-specific data (see TCEQ guidance document Toxicity Factors and Chemical/Physical Properties (RG-366/TRRP-19). In other cases, rules of thumb or literature values are used for parameter estimation (for example, dispersivity, bulk density, porosity, rate constants [§350.75(f)].
3. Calibrate the model to affected property data. The calibration parameters will vary for different models, but typically first order rate constants, dispersivities, or the source data are used to calibrate fate and transport models.
4. After the model is calibrated, the simulation time is increased by some time frame, such as 100 years. The resulting PCLE zone prediction is compared to the calibrated PCLE zone to see if the model indicates that the PCLE zone is expanding or stable (if a constant-source model is used), or the PCLE zone is expanding, stable, or shrinking (if a decaying source model is used).
5. A sensitivity analysis is performed where several of the key parameters in the model are adjusted (e.g., increased by 50% and then decreased by 50%) to determine if the prediction of PCLE zone trend in Step 4 is consistent even if key input data are changed.
6. After long-term monitoring starts, model verification is performed using the long-term monitoring data. If the verification shows that the actual PCLE zone is significantly longer or has higher concentrations than the PCLE zone predicted by the model, then the model work should be revised to update and correct the model. If the verification shows that the actual PCLE zone is significantly shorter or has lower concentration than the PCLE zone predicted by the model, then this should be noted in any submittals, but does not mean the modeling work has to be revised.
In summary, computer fate and transport models can be applied in the following ways:
• A constant-source model can show that natural attenuation processes control the PCLE zone if the modeled PCLE zone is stable over time, or does not expand beyond the PMZ.
• A decaying-source model can show that natural attenuation processes: 1) decontaminate the PCLE zone if the modeled PCLE zone shrinks over time; 2) control the PCLE zone if the modeled PCLE zone

Monitored Natural Attenuation Demonstrations TCEQ publication RG-366/TRRP-33
32 Revised September 2010
is stable, shrinks, or does not expand beyond the PMZ; or 3) achieve remediation goals in a reasonable time frame.
Other types of models include source lifetime models that show that the source materials are being attenuated for the purpose of decontamination or for evaluating remediation time frames. Modeling studies are more important for affected properties with little or no historical record of COC concentrations, and may be critical for evaluating if expanding PCLE zones will meet PMZ requirements [§350.33(f)(4)(F)(i)].
2.4.2 Other Evidence: Microcosm and Molecular Bioassay Studies
Other lines of evidence include microcosm studies. Although these types of studies were done more frequently in the past, many MNA protocols now recommend that microcosm studies be performed only under special circumstances. Microcosm studies are generally not required to demonstrate biodegradation or abiotic degradation under TRRP. However, microcosm studies may provide useful site-specific evidence of biodegradation or abiotic degradation where literature indicates that a COC is persistent, or little or no degradation data are available. Other technologies are now emerging where molecular approaches are used to define beneficial bacteria for MNA processes.
2.5 Methods For Demonstrating Compliance with the Proposed or Approved Reasonable Time Frame
The general process for establishing and proposing a reasonable time frame for remediation for TCEQ approval is discussed in the TCEQ guidance document Applications of Remedy Standards A and B (RG-366/TRRP-28). However, the person is required to also demonstrate that the proposed remedial alternative will complete the remediation within that time frame proposed as being reasonable. This section discusses methods that can be employed to estimate the remedial time frame of MNA in order to determine if the proposed remedial time frame can be met with the use of MNA.
2.5.1 Empirical Data
The simplest approach, and probably the most accurate if data are available, is to calculate a concentration versus time rate constant (see discussion under Section 2.3.2) and then use the rate constant to determine the time when concentrations reach the required response objective goal (PCL or attenuation action level). To perform this calculation, the concentration versus time rate constant (ktime) is determined from a plot of the natural log of COC concentration versus time (Figure 12).

TCEQ publication RG-366/TRRP-33 Monitored Natural Attenuation Demonstrations
Revised September 2010 33
time
i
goal
kC
C
t
−= ln [2.5]
where:
Cgoal = response objective goal (concentration units such as mg/L) as a function of time, t (in units such as years)
Ci = concentration at t = 0 (such as mg/L)
ktime = time-based first order attenuation rate constant (such as per year)
t = time to reach response objective goal (such as years)
This calculation should not be performed with the concentration vs. distance (kdist) rate constant.
Figure 12. Example of remediation time frame calculation

Monitored Natural Attenuation Demonstrations TCEQ publication RG-366/TRRP-33
34 Revised September 2010
2.5.2 Source Lifetime Models
Selected fate and transport models have simple source decay terms that can be used to evaluate PCLE zone lifetime questions. See “Source Lifetime Tools” on page 41 for a list of tools to help with these questions.
3.0 Evaluating the Effectiveness of MNA after Remedy Selection
After MNA is selected as a remedy, monitoring is required to determine when the PCLs for the selected response objective are achieved. These monitoring results are reported in a RAER. When the remedy is complete, a Response Action Completion Report (RACR) is submitted (see Figure 1).
3.1 Requirements for Decontamination To evaluate the effectiveness of MNA as a method to decontaminate COCs, a routine monitoring program should be established. In most cases, the routine monitoring will focus on the change in COCs over time as they trend toward the required PCLs. This routine monitoring might not require the sampling of all the monitoring wells or all the COCs at a particular location, but uses the most important wells/COCs to ensure that a correct “glide path” is being maintained to achieve the PCLs.
3.2 Requirements for Control Remedy Standard B allows the establishment of a PMZ for Class 2 and 3 groundwater-bearing units (see TCEQ guidance document Groundwater Classification (RG-366/TRRP-8)) in which specific requirements for monitoring the attenuation of a groundwater PCLE zone must be met. Monitoring requirements for the MNA remediation option are intended to:
• Ensure compliance with PMZ requirements,
• Document actual progress of remediation,
• Compare progress of remediation in relation to the predicted schedule for meeting the remedial objective, and
• Trigger contingency plans upon detection of unauthorized PCLE zone migration
Integral to the establishment of the PMZ is 1) the establishment of attenuation action levels, and 2) the locations of the attenuation monitoring points.
3.2.1 Establishing Attenuation Action Levels
TRRP defines the attenuation action level (AAL) as the “… maximum concentration of a chemical of concern which can be present at an attenuation monitoring point and not exceed the applicable critical protective

TCEQ publication RG-366/TRRP-33 Monitored Natural Attenuation Demonstrations
Revised September 2010 35
concentration level at the points of exposure over time” [§350.4(a)(4)]. Two potential methods for establishing AALs are presented below.
Method One.
Method One is a graphical technique based on an analysis of empirical data obtained from groundwater monitoring events that indicate the status of the groundwater PCLE zone dynamics (PCLE zone is expanding, stable, or shrinking). COC concentrations are plotted against distance (x) from the source to the groundwater POE using monitoring data. A horizontal line is drawn across the graph that is equivalent to the critical PCL value at the POE. A first-order curve is fit from a point near the source zone (after accounting for natural variability) to the POE (see Figure 13). The concentrations represented by this line at several key locations on the x-axis with wells (see Section 3.2.2) are calculated and represent AALs. The data used to develop the curves should be selected so that the method accounts for routine variations in the data due to seasonal effects or sampling variability, such as by 1) using the upper range of historical data to construct the AAL first order line; or 2) accounting for some level of exceedances; or 3) using a moving average over the long-term monitoring data in each well; or 4) some other method.
Figure 13 Development of attenuation action levels (AALs)

Monitored Natural Attenuation Demonstrations TCEQ publication RG-366/TRRP-33
36 Revised September 2010
Method Two
Method Two utilizes the application of an analytic model, such as the groundwater contaminant fate and transport Natural Attenuation Factor (NAF) model of Domenico (1987) (described in TCEQ guidance document Application of Tier 1 and 2 NAF Models (RG-366/TRRP-26), or its equivalent. AALs are developed using the NAF transport equation to back-calculate the maximum concentration of a COC from the POE at each attenuation monitoring point located at a known distance (x) from the source in the downgradient direction. In this method, the maximum AAL is determined by back-calculating from a POE which has been assigned a presumed concentration equal to the critical PCL. The result is maximum AALs at locations in the groundwater PCLE zone allowed by the model that do not result in exceeding the applicable critical groundwater PCL at the designated groundwater POE (see TCEQ guidance document Human Health Points of Exposure (RG-366/TRRP-21). Again, the modeling approach should account for seasonal effects and natural variability (see Method One, above). In addition to developing AALs for groundwater, in order to meet the requirements for Remedy Standard B, affected soils that will cause COC concentrations in Class 2 groundwater to increase cannot be left unaddressed [§350.33(a)(2)]. This requirement may cap the AAL for the groundwater source area at a concentration that is less than the maximum level derived from a NAF model.
Application of AALs
As empirical COC data becomes available from periodic PMZ monitoring events in accordance with the schedule approved in the RAP, COC concentrations from each attenuation monitoring point should be compared to its AAL. Every exceedance should be immediately evaluated for potential cause to determine if the PCLE zone is expanding, or if the COC concentrations are just oscillating in response to short-term hydrogeologic fluxes (recharge events, water table fluctuations, etc.). Sufficient monitoring should be completed in as timely a manner as possible to make this determination. Consistent exceedances of AALs should prompt an “… active response action to meet the response objectives … ” [§350.33(f)(4)(D)] and an immediate reevaluation of the PCLE zone.
3.2.2 Determining Locations of Attenuation Monitoring Points
An attenuation monitoring point (AMP) is defined as a “… location within the migration pathway of a chemical of concern which is used to verify that the critical PCL will not be exceeded at the points of exposure” [§350.4(a)(5)].
In a PMZ, monitoring groundwater PCLE zone attenuation will typically require a minimum of four AMPs within the PCLE zone AND along its axis. Three AMPs that are properly located within a PCLE zone ensure that first-order curves can be fit to the data. Ideally, the internal AMPs should be distributed purposefully within the PCLE zone. One AMP should be

TCEQ publication RG-366/TRRP-33 Monitored Natural Attenuation Demonstrations
Revised September 2010 37
located at or very near to the source; another AMP should be located close to, but within, the downgradient edge of the associated PCLE zone; and at least one other AMP should be positioned in the PCLE zone between the first two. The fourth AMP is required to be located within the PCLE zone, but upgradient of the groundwater source area.
A plume management zone is defined as “the area of the groundwater protective concentration level exceedance zone at the time of response action plan submittal, plus any additional area allowed in accordance with §350.33(f)(4) … .” So, in terms of distance, the PMZ is the length of the original groundwater PCLE zone plus an additional distance x which is dependent upon a number of factors. For Class 2 groundwater x cannot exceed 500 feet in any situation. The distance x determines the location of the alternate groundwater POE. A separate TCEQ guidance document Human Health Points of Exposure (RG-366/TRRP-21) provides the details for determining the alternate location of the groundwater POE associated with a PMZ at an affected property. Thus, a minimum of two additional groundwater-monitoring locations should typically be established beyond those discussed in the preceding paragraph. An AMP should be established approximately midway between the downgradient boundary of the groundwater PCLE zone, determined at the time of RAP submittal, and the alternate location of the groundwater POE. This monitoring point will be used to verify the precision of the groundwater model in determining COC concentrations as the groundwater PCLE zone expands. Specifically, the AAL for this monitoring point must not be exceeded. And finally, a groundwater monitoring point should be placed at or near the alternate groundwater POE to demonstrate that the groundwater PCLs are not exceeded as the groundwater leaves the PMZ. However, if COC concentrations in the AMP located nearest to and upgradient of the alternate POE location remain less than critical PCLs, the installation of a well at the alternate POE location may be unwarranted.
All AMPs must be located on or very near the PCLE zone axis in the direction of the prevailing groundwater gradient. Additional AMPs may be required for larger or complex (commingled) PCLE zones.
3.3 Monitoring Considerations A monitoring plan to evaluate remedial effectiveness of the MNA response action should include the following components:
• Periodic collection and laboratory analysis for concentrations of selected key COCs and degradation products in source area (it may not be necessary to monitor all COCs) along the center line of the PCLE zone to the leading edge or branches, if applicable, and along the boundary of the PCLE.
• In the instance of decontamination, the monitoring will continue until the critical PCLs are achieved. In the instance of control, the monitoring will continue until the PMZ response objectives are met

Monitored Natural Attenuation Demonstrations TCEQ publication RG-366/TRRP-33
38 Revised September 2010
and the hydrogeologic dynamics are demonstrated to be such that the PCLE zone will be permanently contained within the PMZ [§350.33(i)(3)]. See TCEQ guidance document Compliance Sampling and Monitoring (RG-366/TRRP-30) for recommendations on sampling frequency and duration.
• Other data such as groundwater gradient maps, PCLE zone maps, and COC concentration versus time graphs may be required. Other elements of the monitoring program may include periodic monitoring of appropriate indicators for the MNA parameters. At most affected properties, long-term monitoring of geochemical indicator parameters (such as dissolved oxygen, methane, etc.) is not needed if COCs are measured. The long-term monitoring program should focus on trends in the COC concentrations, rather than continued monitoring of geochemical conditions.
The monitoring results should be evaluated as they become available to verify the effectiveness of the MNA. Monitoring results will be submitted to the TCEQ in a RAER in accordance with the set schedule to document the remedial progress. If the person determines MNA is not effective in achieving the response objectives, then the person should initiate re-assessment of the MNA remedial strategy and propose or proceed with a revised remedy in lieu of awaiting direction from the TCEQ.
3.4 Completion of the Remedial Phase For a decontamination remedy for groundwater under Remedy Standards A or B, the remedial phase is terminated when MNA has reduced COC concentrations such that the PCLs are met within the groundwater. For control remedies (i.e., PMZ) under Remedy Standard B, the remedial phase is completed when MNA is controlling the COCs such that all performance requirements for the PMZ are met. Following completion of the remedial phase, the project would then transition into the post-response action care phase for the PMZ. Please see TCEQ guidance document Compliance Monitoring (RG-366/TRRP-30) for criteria necessary to demonstrate remedial objectives have been met such that the remedial and post-response action care phases can be terminated.
4.0 Key Reference Documents MNA as a remediation technology has been of interest to the regulatory and regulated community. As a result, there are numerous resources that can be accessed to learn about natural attenuation and its implementation for remediation. Here we list protocols and guidance documents as well as other selected natural attenuation resources including textbooks and models.
Implementation of remediation by MNA should conform to approaches outlined in the TRRP rules and associated TRRP guidance documents

TCEQ publication RG-366/TRRP-33 Monitored Natural Attenuation Demonstrations
Revised September 2010 39
rather than any non-TRRP guidance documents. The resources listed below are provided for informational purposes only.
Protocols and Guidance
Federal Agencies
Environmental Protection Agency
Use of Monitored Natural Attenuation at Superfund, RCRA Corrective Action, and Underground Storage Tank Sites, Final OSWER Directive. OSWER Directive Number 9200.4-17P. EPA Office of Solid Waste and Emergency Response, Washington, DC; <www.epa.gov/oust/directiv/d9200417.pdf>
Technical Protocol for Evaluating Natural Attenuation of Chlorinated Solvents in Ground Water. T.H. Wiedemeier, M.A. Swanson, D.E. Moutoux, E.K. Gordon, J.T. Wilson, B.H. Wilson, D.H. Kampbell, P.E. Haas, R. N. Miller, J.E. Hansen, and F.H. Chapelle. EPA/600/R-98/128. EPA Office of Research and Development, Washington, DC <www.epa.gov/correctiveaction/resource/guidance/rem_eval/protocol.pdf>
Draft EPA Region 4 Suggested Practices for Evaluation of a Site for Natural Attenuation (Biological Degradation) of Chlorinated Solvents (Version 3.1). <www.epa.gov/Region4/waste/ots/protoexp.pdf>
Department of Energy
Technical Guidance for the Long-Term Monitoring of Natural Attenuation Remedies at Department of Energy Sites. Office of Environmental Restoration. <www.directives.doe.gov/pdfs/doe/doetext/neword/450/g4501-9.html>
Decision-Making Framework Guide for the Evaluation and Selection of Monitored Natural Attenuation Remedies at Department of Energy Sites. <www.sandia.gov/eesector/gs/gc/snap.html>
U.S. Air Force
Technical Protocol for Implementing Intrinsic Remediation with Long-Term Monitoring for Natural Attenuation of Fuel Contamination in Groundwater. T.H. Wiedemeier, J.T. Wilson, D.H. Kampbell, R.N. Miller, and J.E. Hansen. Air Force Center for Environmental Excellence, San Antonio, TX. <www.afcee.af.mil/shared/media/document/AFD-071211-039.pdf>
Technical Protocol for Evaluating Natural Attenuation of Chlorinated Solvents in Ground Water. T.H. Wiedemeier, M.A. Swanson, D.E. Moutoux, E.K. Gordon, J.T. Wilson, B.H. Wilson, D.H. Kampbell, J.E. Hansen, P.E. Haas, and F.H. Chapelle. Air Force Center for Environmental Excellence, San Antonio, TX. <www.afcee.af.mil/shared/media/document/AFD-071210-020.pdf>
U.S. Navy
Technical Guidelines for Evaluating Monitored Natural Attenuation of Petroleum Hydrocarbons and Chlorinated Solvents at Naval and Marine Corps Facilities. T.H. Wiedemeier and F.H. Chapelle. <https://portal.navfac.navy.mil/portal/page/portal/navfac/navfac_ww_pp/navfac_nfesc_pp/environmental/erb/wg-artt/mna1198.pdf>

Monitored Natural Attenuation Demonstrations TCEQ publication RG-366/TRRP-33
40 Revised September 2010
National Research Council
Natural Attenuation for Ground Water Remediation. Committee on Intrinsic Remediation, Water Science and Technology Board, Board on Radioactive Waste Management, Commission on Geosciences, Environment and Resources. National Academy Press, Washington, DC. <www.nap.edu/catalog.php?record_id=9792>
Science Advisory Board
Monitored Natural Attenuation: US EPA Research Program – An EPA Science Advisory Board Review. Science Advisory Board Natural Attenuation Subcommittee. EPA-SAB-EEC-01-004. Science Advisory Board, EPA, Washington, DC. <www.clu-in.org/download/remed/eec01004.pdf>
State Agencies
Minnesota Pollution Control Agency
Draft Guidelines–Natural Attenuation of Chlorinated Solvents in Ground Water. Minnesota Pollution Control Agency, Site Response Section, St. Paul, MN. <www.pca.state.mn.us/publications/c-s4-05.pdf>
New Jersey
New Jersey Administrative Code 7:26E—Technical Requirements for Site Remediation, and Classification Exception Areas: Final Guidance 4-17-1995. <www.state.nj.us/dep/srp/dl/ceaguid2.pdf>
Wisconsin
Interim Guidance on Natural Attenuation for Petroleum Releases. PUBL-RR-614. Wisconsin Department of Natural Resources, Bureau of Remediation and Redevelopment. <www.dnr.state.wi.us/org/aw/rr/archives/pubs/RR614.pdf>
Private Sector/Industry
Chevron
Protocol for Monitoring Intrinsic Bioremediation in Groundwater. T. Buscheck and K. O'Reilly. Chevron Research and Technology Co.; Health, Environment and Safety Group.
Protocol for Monitoring Natural Attenuation of Chlorinated Solvents in Groundwater.
Professional and Industry Associations
T. Buscheck and K. O'Reilly. Chevron Research and Technology Co.; Health, Environment and Safety Group.
American Society for Testing and Materials
Standard Guide for Remediation of Ground Water by Natural Attenuation at Petroleum Release Sites. ASTM Committee E-50. ASTM E 1943. American Society of Testing and Materials, West Conshohocken, PA. <www.astm.org/BOOKSTORE/COMPS/8.htm>

TCEQ publication RG-366/TRRP-33 Monitored Natural Attenuation Demonstrations
Revised September 2010 41
American Petroleum Institute
Evaluation of Sampling and Analytical Methods for Measuring Indicators of Intrinsic Bioremediation, Bulletin 5. American Petroleum Institute, Health and Environmental Sciences Department. API Publishing Services, Washington, DC. <www.api.org/ehs/groundwater/upload/05_Bull.pdf>
ITRC (Interstate Technology Regulatory Cooperation) and RTDF (Remediation Technologies Development Forum)
Natural Attenuation of Chlorinated Solvents in Ground Water: Principles and Practices. <www.itrcweb.org/Documents/ISB-3.pdf>
Web Pages Monitored Natural Attenuation. US Environmental Protection Agency.
<www.epa.gov/OUST/oswermna/> (accessed October 29, 2008) or <www.epa.gov/OUST/cat/mna.htm> (accessed October 29, 2008).
Issues Associated with Natural Attenuation. US Environmental Protection Agency. <www.epa.gov/OUST/rbdm/issues.htm> (accessed October 29, 2008).
Tools and Models MNA Toolbox. US Department of Energy.
<www.sandia.gov/eesector/gs/gc/na/mnahome.html> (accessed October 29, 2008).
Monitoring and Remediation Optimization System (MAROS) Software User’s Guide. Aziz, J.J., C.J. Newell, H.S. Rifai, M.Ling, and J.R. Gonzales. Air Force Center for Environmental Excellence, Brooks AFB, Texas, March 2006. <www.gsi-net.com/software/maros_dl/MAROSManual_v2_2.pdf> (accessed October 29, 2008).
BIOSCREEN Natural Attenuation Decision Support System Software and User's Manual (Version 1.3. C.J. Newell, R.K. McLeod, and J.R. Gonzales. EPA/600/R-96/087. <www.epa.gov/ada/download/models/bioscrn.pdf> (accessed October 29, 2008).
BIOCHLOR Natural Attenuation Decision Support System. Aziz, C.E., C.J. Newell, J.R. Gonzales, P.E. Haas, T.P. Clement, and Y. Sun. EPA/600/R-00/008. <www.epa.gov/ada/download/models/biochlor10.pdf> (accessed October 29, 2008).
BIOPLUME III Natural Attenuation Decision Support System. Rifai, H.S., C.J. Newell, J.R. Gonzales, S. Dendrou, L. Kennedy, and J. Wilson. EPA/600/R-98/010. <www.epa.gov/ada/csmos/models/bioplume3.html> (accessed October 29, 2008).
RT3D—A Modular Computer Code for Simulating Reactive Multi-Species Transport in 3-Dimensional Groundwater Aquifers. Clement, T.P. Research Report PNNL-SA-28967. Battelle Pacific Northwest National Laboratory. <bioprocess.pnl.gov/rt3d.htm> (accessed October 29, 2008).
Source Lifetime Tools BIOSCREEN Natural Attenuation Decision Support System Software and User's Manual
(Version 1.3. C.J. Newell, R.K. McLeod, and J.R. Gonzales. EPA/600/R-96/087. <www.epa.gov/ada/download/models/bioscrn.pdf> (accessed October 29, 2008).
BIOCHLOR Natural Attenuation Decision Support System. Aziz, C.E., C.J. Newell, J.R. Gonzales, P.E. Haas, T.P. Clement, and Y. Sun. EPA/600/R-00/008. <www.epa.gov/ada/download/models/biochlor10.pdf> (accessed October 29, 2008).

Monitored Natural Attenuation Demonstrations TCEQ publication RG-366/TRRP-33
42 Revised September 2010
Books Natural Attenuation of Fuels and Chlorinated Solvents in the Subsurface. T.H.
Wiedemeier, H.S. Rifai, C.J. Newell, and J.T. Wilson. Wiley and Sons, Inc.. <www.wiley.com/WileyCDA/WileyTitle/productCd-0471197491.html>.
Natural Attenuation: CERCLA and the Future of Environmental Cleanup. P.V. Brady, M.V. Brady, and D.J. Borns. Lewis Publishers, New York City. ISBN: 1566703026. September 1997, 245 pp.