Embed Size (px)
Citation preview

Expert Systems With Applications 169 (2021) 114470
Available online 11 December 20200957-4174/© 2020 The Authors. Published by Elsevier Ltd. This is an open access article under the CC BY-NC-ND license(http://creativecommons.org/licenses/by-nc-nd/4.0/).
Money laundering and terrorism financing detection using neural networks and an abnormality indicator
Jose-de-Jesús Rocha-Salazar a,*, María-Jesús Segovia-Vargas b, María-del-Mar Camacho- Minano c
a Faculty of Statistical Studies, Complutense University of Madrid, Madrid Spain b Financial & Actuarial Economics & Statistics Department, Faculty of Economics and Business Administration, Complutense University of Madrid, Madrid, Spain c Accounting and Finance Department, Faculty of Economics and Business Administration, Complutense University of Madrid, Madrid, Spain
A R T I C L E I N F O
Keywords: Money laundering Financing of terrorism Unsupervised learning Detection Machine Learning
A B S T R A C T
This study proposes a comprehensive model that helps improve self-comparisons and group-comparisons for customers to detect suspicious transactions related to money laundering (ML) and terrorism financing (FT) in financial systems. The self-comparison is improved by establishing a more comprehensive know your customer (KYC) policy, adding non-transactional characteristics to obtain a set of variables that can be classified into four categories: inherent, product, transactional, and geographic. The group-comparison involving the clustering process is improved by using an innovative transaction abnormality indicator, based on the variance of the variables. To illustrate the way this methodology works, random samples were extracted from the data ware-house of an important financial institution in Mexico. To train the algorithms, 26,751 and 3527 transactions and their features, involving natural and legal persons, respectively, were selected randomly from January 2020. To measure the prediction accuracy, test sets of 1000 and 600 transactions were selected randomly for natural and legal persons, respectively, from February 2020. The proposed model manages to decrease the proportion of false positives and increase accuracy when compared to the rule-based system. On reducing the false positive rate, the company’s costs for investigating suspicious customers also decrease significantly.
1. Introduction
Money laundering is the processing of income gained from criminal activity to hide its illegal origin (Seymour, 2008; Williams, 2009; Sobreira Leite, Bessa Albuquerque, & Rogerio Pinheiro, 2019; Teichmann, 2020). Terrorism financing is any form of financial action, support, or mediation that provides financial support for the activities of terrorist groups (Raphaeli, 2010; Romaniuk, 2014; Teichmann, 2019). These types of crime have generated great interest internationally because of their im-plications for economies and financial institutions worldwide. The main problem is that money laundering weakens the integrity of financial sys-tems, leads to a loss of control over a country’s economic policies, distorts the economy, causes instability in investments, and results in lower tax revenue for the government (Aluko & Bagheri, 2012; Chen et al., 2018).
Terrorism financing, for its part, has a particularly strong impact on small economies. For instance, the GDP of Israel falls in response to terrorist threats. Investment also falls because the owners of capital
decide to move their assets to safer countries (Sandler & Enders, 2008). The tourism, international trade, and financial sectors can be affected as well (Chen & Siems, 2004; Enders & Sandler, 2008; Enders, Sandler, & Parise, 1992; Nitsch & Schumacher, 2004).
The aforementioned negative effects have led international institutions to implement measures and standards to prevent and combat money laundering and terrorism financing in financial systems. An example of this is FATF (The Financial Action Task Force). FATF sets the standards for the effective implementation of legal, regulatory, and operational measures to combat money laundering, terrorism financing and other threats to the integrity of the international financial system. Member countries and financial institutions, for their part, have implemented the 40 recom-mendations made by the FATF in its standards and have developed stra-tegies to detect these crimes. They have also agreed to relax domestic bank secrecy provisions when financial investigations have an international aspect.
Traditional methodologies to detect money laundering and terrorism
* Corresponding author. E-mail addresses: [email protected] (J.-d.-J. Rocha-Salazar), [email protected] (M.-J. Segovia-Vargas), [email protected] (M.-d.-M. Camacho-
Minano).
Contents lists available at ScienceDirect
Expert Systems With Applications
journal homepage: www.elsevier.com/locate/eswa
https://doi.org/10.1016/j.eswa.2020.114470 Received 7 August 2020; Received in revised form 17 November 2020; Accepted 5 December 2020

Expert Systems With Applications 169 (2021) 114470
2
financing involve computer database checks, surveillance, mail/trash covers, subpoenas, interviews with associates, search warrants and sub-ject interviews. Many of these techniques are manual, which makes them inefficient and resource intensive. Additionally, financial institutions have developed systems to detect suspicious transactions based on fixed rules subject to certain thresholds. This approach has the disadvantage of generating a high proportion of false positives since the system cannot dynamically adjust the rule based on behavioral changes in criminals (Chandraeva, Amarasinghe, De Silva, Aponso, & Krishnarajah, 2020; Moustafa, Abd El-Megied, Sobh, & Shafea, 2015).
In recent years, the emergence of data warehouses, the improved per-formance of computers and the development of software packages have led to artificial intelligence techniques being used to overcome the deficiencies in the traditional methods for the detection of money laundering and terrorism financing (Watkins et al., 2010). Some of these techniques are based on the fundamental principle that any transaction that does not comply with the normal behavior of a customer or similar group is anomalous (Raza & Haider, 2011). Bearing all of this in mind, the first objective of this article is to propose a new indicator of abnormality for transactions. This uses the variance of the variables to filter the clusters obtained from four types of neural network. The proposed indicator will refine the detection task, improving on the group-comparison already present in the clustering process. The second objective of the article is to improve self-comparison by adding non-transactional characteristics to obtain a set of variables that can be classified into four categories: inherent, product, transactional and geographic. The inclusion of these new vari-ables will improve the individual behavioral analysis since the KYC (Know Your Customer) policy suggested by FATF will be implemented more comprehensively.
The methodology is applied to the alert systems of an important financial institution in Mexico. Mexico is an appropriate country for testing the working of methodologies to detect suspicious activities due to its large flow of illegal resources. According to reports from the group of experts at Global Financial Integrity, Mexico is the third-largest exporter of illegal resources after India and Russia, these making up an average of 5.4% of its GDP (Integrity, 2015). Most of these illegal resources come from drug trafficking, extortion, corruption, and tax evasion (Force, 2018b).
After the introduction, this paper is structured as follows. Section 2 describes the previous work related to the model proposed in this article. Section 3 discusses the typologies of real money laundering and terrorism financing cases and the methodology for their processing. Section 4 pre-sents the computational algorithm used by the institution’s systems to generate alerts. Section 5 describes the main results of the proposed model and compares these to the results of the previous one. Finally, Section 6 concludes and discusses further research.
2. Literature review and contribution
Money laundering detection started in the 1970 s with financial in-stitutions reporting transactions to the government (Soltani, Nguyen, Yang, Faghani, Yagoub, & An, 2016). Since then, most of the techniques used in automated banking systems have established rules with certain thresholds. These techniques are labor intensive and unable to detect money laundering when transactions are below the defined thresholds. If the thresholds are too low, they may also result in a high proportion of false positives (Yang & Wei, 2010).
Some authors have tried to overcome the deficiencies in these rule- based methods by developing sequence matching and Bayesian models to detect money laundering. For example, in Liu, Zhang, and Zeng (2008) the authors use a computational approach to classify transactions as sus-picious or normal. The data they use include transaction time, account number, transaction direction and transaction amount. The innovative contribution of this study is comparing each transaction with its historical trend and with peer groups. One disadvantage of this approach is that the detection task rests entirely on the nature of the transaction, omitting other important typologies related to money laundering. In Khan, Larik, Rajput,
and Haider (2013) the authors develop a Bayesian network using the rules listed in the Government of Pakistan’s Anti-Money Laundering Regula-tions, including the total credit amount, total debit amount, difference between the credit and debit amount and frequency of credit and debit transactions. They define normal behavior based on a training set created from the customer’s past transactions. The normal pattern established is then compared with the behavior of the test set to identify suspicious ac-tivities. This proposal is again based only on transaction features and does not include a group comparison.
Within machine learning, some studies examine the use of supervised learning in the detection of money laundering. For example, in Tang and Yin (2005) the authors propose a support vector machine model for the classification of behavior as usual or unusual based on profile features such as the transaction amount, transaction frequencies, business cycle, alter-nation of business types, change of co-operating partners, etc. In Heidar-inia, Harounabadi, and Sadeghzadeh (2014) the authors perform network training using a fuzzy system that can determine the riskiness of user behavior. The training of the model is based on the standard deviation of the account, free zones, interval between transactions, operations of less than the permitted threshold, transfers out of and into the account and the account type (whether it is risky or not). In Savagea, Wangb, Chouc, and Zhanga (2016) the authors implement a system that uses network analysis and supervised learning to detect suspicious groups of customers in financial transactions. They use two types of transaction: large cash de-posits and international fund transfers. They establish networks with parties and transaction edges where both of these have attributes, including the name and address of the parties involved, total amount transferred, etc. In Alvarez-Jareno, Badal-Valero, and Pavía (2017) the authors use supervised algorithms such as logistic regression, decision trees, neural networks and random forests to detect the largest number of fraudulent companies, reducing, as far as possible, the number of false positives for companies operating correctly. For the analysis, they use the amounts of commercial transactions and the number of transactions. Finally, in Zhang and Trubey (2018) the authors use transaction data from a U.S. financial institution and supervised learning algorithms such as decision tree, random forest, support vector machine, and artificial neural network to detect money laundering patterns in a set of alerts. They use ten explanatory variables to build models based on transaction activities over a period. In more recent articles, Martínez-Sanchez and Cruz-García (2020) use historical data and tree regression to predict the risk of exposure to money laundering. They take the customer’s status (level of risk) as the dependent variable, and use the legal entity, origin, economic activity, seniority and contracted product variables as predictors. Jullum, Løland, and Bang Huseby (2020) use XGBoost and training sets of historical data that can be classified into three types: normal legal transactions, those flagged as suspicious by an internal alert system and potential money laundering cases reported to the authorities. They predict whether a new transaction should be reported considering sender/receiver information, their earlier behavior and their transaction history.
These supervised methods are not suitable for most financial in-stitutions because they require ground-truth data. Usually, the number of verified ML and FT cases is small compared to the number of non-verified cases. Additionally, most financial institutions do not have sufficiently detailed information from their respective intelligence units due to privacy policies. This makes it difficult to construct a labeled dataset and apply supervised algorithms. Under these circumstances, unsupervised algo-rithms are more suitable. If, despite this, a decision is made to use super-vised algorithms, under-sampling and over-sampling techniques, as well as balanced training and test sets, may be used to improve model perfor-mance1 (Wei, Li, Cao, Ou, & Chen, 2012).
1 In Li, Yen, Lu, and Wang (2012) it can be observed how a balance of the sample was needed to perform the data mining detection task due to the number of non-fraudulent accounts being >30 times the number of fraudulent ones.
J.-d.-J. Rocha-Salazar et al.

Expert Systems With Applications 169 (2021) 114470
3
Within unsupervised algorithms, clustering is the most frequently used methodology. In Liu, Qian, Mao, and Zhu (2011) the authors pro-pose the use of a core decision tree and clustering algorithms to detect money laundering using key attributes such as transaction time, sender, receiver, frequency and transaction amount. In Cao and Do (2012) the authors use the attributes of bank transfer transactions and CLOPE al-gorithms for clustering to detect money laundering in Vietnam’s banking industry. They use variables such as amount sent, amount received, number sent, number received, relationship between what is sent and what is received and the absolute value of the difference be-tween the amounts sent and received. In Drezewski, Sepielak, and Fili-pkowski (2014) the authors analyze financial flows in order to detect money-laundering processes. They examine the clustering of money transfers that fulfill the specified characteristics and then mine for frequent sets and sequences in the clusters found.
These techniques take advantage of the group comparison performed through the clustering process. This means that the transaction behavior of one customer is compared with that of other customers with similar characteristics. This peer-group comparison is crucial for the detection of money laundering because one transaction may be unusual given the history of a customer but normal given the common movements of the group with similar characteristics (Jun, 2006). Other studies such as Deng, Roshan Joseph, Sudjianto, and Jeff Wu (2009) and Gao (2009) propose a more comprehensive model, incorporating not just the peer- group comparison through the clustering process but also self- comparison through variables that reflect the historical transaction behavior of the customer. The combination of these two comparisons is also seen in Liu and Zhang (2010), who propose a method that finds unusual clustering from time series of the transactions for each account. They deploy the thresholds calculated through samples using all trans-actions in peer-group accounts.
Despite the adequacy of these algorithms for the detection of money laundering when there is a lack of labeled data, efforts have been entirely focused on detecting this crime by analyzing the features of transactions alone. When there are insufficient variables in the analysis to obtain a complete picture of the customer’s profile, false suspicious activities may be identified in the clustering process.
Little has been done to explore alternatives to the transaction vari-ables. For example, in Wang and Yang (2007) the authors use variables such as economic activity, business size, location and type of financial product managed to assess money laundering risk using a decision tree. In Fronzetti Colladon and Remondi (2016) the authors use social network analysis to detect money laundering in medium-large factoring companies in Italy. They assess the risk profiles of customers involved in the factoring business using information from economic activity net-works and geographical area networks, in addition to common trans-action data such as the amount of the operation.
In Kannan and Somasundaram (2017) the authors use an autoregressive-based outlier algorithm to reduce computational complexity in the detection of money laundering activities. They incorporate variables including customer and business type, account ownership and transaction features.
As for terrorism financing, this topic was added to the FATF rec-ommendations on October 1, 2001, immediately after the 9–11 attacks in America, triggering strict regulations aimed at preventing terrorism financing in each country. Despite this heavy regulation, the literature review highlighted the shortage of work on the use of artificial intelli-gence to detect the movements of money in financial institutions destined for terrorism financing. One of the works indirectly related to financial systems is that by Koschade (2006) where the author imple-ments a social network analysis for the Jemaah Islamiyah cell to un-derstand its communication patterns and structure and predict the likely outcomes of terrorist cells. In Ozgul, Erdem, and Bowerman (2009) the authors identify cohesive clusters of generalized events. They use this to match known terrorist groups to these clusters and then finally predict which known terrorist group is the perpetuator of an unsolved crime.
They use datasets of terrorist events in a province of Turkey where un-solved and solved crimes are grouped together. In Gohar, Wasi, and Usman (2014) the authors propose four classification techniques to detect terrorist groups, using as attributes the month, city, country, weapon type, attack type, target and group name. They applied the models to open data sourced from the National Consortium for the Study of Terrorism and Responses to Terrorism of the University of Maryland in USA. In Saidi, Trabelsi, and Ghazela (2018) the authors use clustering techniques to detect cyber terrorist groups, using attributes such as identification, date of birth, marital status, religion, social background, position in the organization, role in terrorist incidents, teacher and ar-rest dates. They used the network data in the John Jay ARTIS Trans-national Terrorism Database, which identify the connections between individuals in certain attack networks and their roles in given terrorist organizations.
Since 2001, FATF has established international standards aimed at preventing the crimes of both money laundering and financing terrorism. According to Maitland, Kim-Kwang, and Lin (2011), these crimes should not be treated as separate events since they increasingly converge and share many typologies, techniques, and trends for obtaining and manipulating resources in financial systems to create terror or launder money. An example of this has been observed in in-ternational criminal groups that are no longer dedicated only to money laundering but also provide logistical and other support to terrorists, foreign intelligence services, and foreign governments, all with interests that strongly conflict with those of U.S. national security (Maitland et al., 2011; Teichmann, 2019).
From the above, the following gaps can be identified in the field of machine learning methodologies to detect suspicious transactions related to money laundering and terrorism financing:
a. The inclusion of non-transactional variables has not been suffi-ciently explored. This omits important typologies appearing in FATF reports, such as type of customer, customer segment, common address, whether the customer has operations with the government, age, source of income, nationality, state of residence, state of operation, corruption rate, crime incidence rate, geographical zones related to criminal car-tels, whether the person is politically exposed, length of relationship with the institution, channel, etc.
b. The customer’s self-comparison has been limited to the historical behavior of transaction variables such as frequency and amount, excluding variables such as those mentioned in the previous point that can improve the individual behavioral analysis. FATF recommendation 10 establishes the importance of implementing the “know your customer” (KYC) policy to effectively identify transactions related to money laundering or terrorism financing. This approach is based on the idea that by knowing the customer well a financial institution can identify risk indicators, meaning that in turn it can take steps to mitigate these and reduce money laundering and terrorism financing vulnera-bilities (Force, 2013b). If only transaction features are considered, it is impossible to obtain a complete picture of the customer’s profile.
c. The group comparison has been restricted to that found naturally through the clustering process. Alternatively, we can find grouping using a few similar categorical features to detect suspicious activities, leaving out elements such as the variance of the variables involved in the dataset despite the fact that such elements can identify signs of atypical behavior.
d. To the best of our knowledge, there is nothing in the literature regarding the specific use of machine learning algorithms to track terrorism financing in financial institutions.
With this in mind, we propose a comprehensive model to detect money laundering and terrorism financing that includes the following contributions:
a) It includes additional non-transactional customer, product and geographic variables that were absent from previous studies,
J.-d.-J. Rocha-Salazar et al.

Expert Systems With Applications 169 (2021) 114470
4
allowing for a more complete KYC policy and an improvement on the individual comparison.
b) It introduces an indicator of abnormality based on the variance of the variables to improve the group comparison already present in the clustering process. The interesting feature of this indicator is that its parameters will update themselves based on the criminals’ behavior.
c) It illustrates how detecting terrorism resources in financial in-stitutions can be carried out using machine learning techniques.
3. Variables and methodology
3.1. Typologies involved in the crimes of money laundering and terrorism financing
These are the methods, techniques, characteristics, and trends pre-sent in ML and FT around the world. The typologies suggested in this study for inclusion come from those described in FATF reports, scientific articles and the financial intelligence units (FIU) of each country. For this study, the typologies produced by the regulatory authority of Mexico will be of special relevance since the analysis is developed in the context of that country. A brief explanation of the trends and typologies is given below.
3.1.1. Type of customer Legal entities are more likely to be involved in money laundering
operations and for greater amounts since private companies can use tax evasion as a method to launder money (Secretariat of Finance and Public Credit, 20162; Spreutels & Grijseels, 2000). In contrast, most customers involved in the crime of terrorism financing are individuals, civilians with their own sources of funding, from relatives or terrorist organiza-tions (FATF, 2008b).
The presence of corruption makes legal entities riskier than natural persons when it comes to money laundering and terrorism financing. Legal entities can use fictitious associations to launder money from crime and use these resources for terrorist activities (Force, 2012; Guardian, 2016; Jancsics, 2018).
3.1.2. Customer Segment Customer segments are groups of individuals who share similar
characteristics. Corruption accompanied by laundering through ficti-tious associations is behavior normally associated with politicians, heads of state and dictators (Obermaier & Obermayer, 2016). Corrupt politicians and government officials also use fictitious companies in their own countries to facilitate illegal transactions (Jancsics, 2017). Therefore, customer segments in financial institutions associated with government bodies are considered risky in relation to money laun-dering. As for terrorism, religion is an important factor to consider. The ideas and ideologies in religious doctrine may encourage people to commit terrorist activities (Pratt, 2010). Thus, customer segments cor-responding to religious groups are risky in relation to terrorism.
3.1.3. Politically exposed people Politically exposed people can attempt to launder money from illegal
bribes and other income directly related to corruption. They can also be involved in embezzlement or the direct theft of assets from political parties and unions, as well as tax fraud. In certain cases, politically exposed people may be directly involved in other types of illegal ac-tivity, such as organized crime or drug trafficking (Force, 2004). Various case studies have found that politically exposed persons can use their privileged position to carry out activities related to terrorism financing
(Force, 2013c). The same studies also mention that politically exposed people are more likely to be involved in corruption and link this behavior to money laundering and terrorism activities.
3.1.4. Economic activity The Secretariat of Finance and Public Credit (2016) document
mentions that economic activity is an important variable to consider in risk assessment models in terms of exposure to ML and FT. It provides a list of vulnerable economic activities identified in the cases dealt with by the FIU, such as car purchases, handling of credit cards with an average amount of between 5000 and 10,000 USD, buying and selling properties, etc. The Force (2012) report establishes that the area of economic ac-tivity associated with the transaction can indicate a money laundering risk. This report considers risky activities to be those related to the extraction of natural resources, public procurement, the national de-fense industry, healthcare, large infrastructure projects and in some cases the privatization of public institutions or companies. In addition, activities such as charitable organizations, business ownership, criminal activities, government positions, drug trafficking, the financial sector and cash messengers can be directly related to terrorism financing ac-cording to the Force (2008b) report.
3.1.5. Relationship duration In its recommendations, FATF stresses how important it is for
financial institutions to implement a “Know Your Customer” Policy (Force, 2017). It argues that a strong KYC policy could reduce money laundering and terrorism financing vulnerabilities. Based on this policy, it is natural to think that customers with longer financial relationships with an institution will be better known to it and, thus, less risky.
3.1.6. Age The age of individuals and the time since incorporation of legal en-
tities are variables constantly mentioned in the Secretariat of Finance and Public Credit (2016) document. Here it mentions that young low- profile shareholders and recently created companies (less than 5 years old) are frequently observed in cases of confirmed money laundering. According to Force (2015), 3 out of every 4 individuals who traveled to the conflict zones of Syria and Iraq in 2014 were aged between 20 and 30 years old. Another study mentions that the average age of the Ben-galis was 24.4 (Lee, 2011). The Bengalis were a group of individuals who shared many similar characteristics with the terrorists described in the literature on this topic. Therefore, it is natural to think that individuals between 20 and 30 years of age are more likely to be involved in terrorism. Regarding corruption, in Torgler and Valev (2006) the au-thors show that the older people are, the lower their tolerance of cor-ruption. The study was carried out by age group, 18–26, 27–35, 36–44, 45–53, 54–62 and 63–71. Groups 18–26, 27–35 show greater tolerance of corruption. This supports the idea that individuals between 20 and 30 years of age are risky in relation to money laundering and terrorism financing.
3.1.7. Source of income This indicator is related to the economic activity of the customer.
Thus, a source of income from a risky economic activity (of those listed above) will be a money laundering risk. According to Force (2015) the financial requirements to maintain a terrorist network are generally high. The most common sources of income include money from the legal employment of members, donations from private companies, legitimate business enterprises and government sponsorship, along with criminal acts such as financial fraud, bank robbery and smuggling. Therefore, any source of income related to the above is considered risky with regard to terrorism financing.
3.1.8. Nationality According to some FATF reports, the nationalities considered to be
risky in relation to money laundering are those of countries identified as
2 The Secretariat of Finance and Public Credit published in 2016 the First National Risk Assessment through the Financial Intelligence Unit in Mexico. This report shows the methods, techniques, and typologies identified in confirmed cases of money laundering and financing of terrorism.
J.-d.-J. Rocha-Salazar et al.

Expert Systems With Applications 169 (2021) 114470
5
having low taxation regimes, those designated by FATF as non-cooperating or with significant deficiencies in the implementation of a preventive regime, and others with high levels of crime, the presence of organized crime or a high prevalence of corruption. With regard to terrorism financing, some of the main terrorist organizations now blacklisted in the United States are Islamic State, Boko Haram, Al Shebab, Al Qaeda, Haqqani Network, Hamas, Hezbollah, Forces Revolutionary Arms of Colombia, National Liberation Army, Party of the Workers of Kurdistan and Fatah Al Sham Front (Ex Nusra Front). Any nationality linked to these terrorist groups is considered risky.
3.1.9. Product Type The Force (2013a) and Force (2014) reports provide some examples of
the characteristics of banking products and sub-products that may increase the risk of ML/FT:
Retail banking: high volume of transactions, high-value transactions, wide diversity of services. Asset management: confidentiality, difficulty in identifying the beneficial owner, use of off-shore vehicles, complexity of products, multiplicity of jurisdictions. Investment banking: transfer of assets between parties, exchange for cash or other assets, access to global markets. Correspondent banking: high-value transactions, limited informa-tion regarding the sender and source of the funds, lack of information on the actual owner of the counterpart/correspondent intermediary. The report by the Wolfsberg Group (2006) identifies the following as services that potentially represent a greater risk: International correspondent banking services International private banking services Services that involve cash or the purchase or delivery of precious metals Some additional attributes of products and sub-products that are considered relevant are: Possibility of cancellation, refund or advance payment. Accessibility through remote channels (e.g., websites). Allow transactions with precious stones or metals, fine jewelry or watches. Allow ATM withdrawals. Allow the transfer of funds
3.1.10. Transaction Type The Secretariat of Finance and Public Credit (2016) report mentions
international transfers, checks, cash withdrawals, and the purchase and sale of foreign currency as the most common type of operation in money laundering cases dealt with by the FIU. The Force (2012) report also con-firms these operations as the most common in money laundering cases when corruption is present. The Force (2015) document mentions inter-national transfers of funds and movements of cash as being those most used by terrorist groups.
3.1.11. Monetary instrument Money launderers “place” illegal funds using a variety of techniques,
including depositing cash in bank accounts and using cash to buy high- value assets, such as land, property and luxury items (Buchanan, 2004). Cash is the most frequently used monetary instrument in criminal activities and corruption because it provides anonymity and avoids any auditing of transactions (Secretariat of Finance and Public Credit, 2016). Due to this, it is considered the riskiest monetary instrument. Electronic transfers are considered a medium risk because, despite the high volume of operations, they are not anonymous and are easily traceable. Documents are consid-ered low-risk monetary instruments. As for terrorism, cash is the most common monetary instrument transferred from one terrorist group to another. Virtual currencies such as bitcoin have also attracted the attention of several criminal groups and may pose a risk in relation to FT. This technology allows the anonymous transfer of funds internationally (Force,
2015; Frick, 2019; Ibrahim, 2019).
3.1.12. Currency For many years the US dollar has been the currency most commonly
used in international trade due to its high acceptance and convertibility. It is estimated that more than half of all US dollar bills and coins circulate outside the United States. That is why it is natural to think that the US dollar would be the most used currency in illegal transactions (Gopinath & Stein, 2018). In addition, the euro appears to be heavily used in illegal operations due to its common use in the market. The US dollar and euro are also found to be the most widely used foreign currencies in cases of money laundering analyzed in countries such as Mexico (Secretariat of Finance and Public Credit, 2016).
As for terrorism, the Force (2013d) report mentions that the currencies most used by criminal groups linked to terrorism are the euro, dollar and Russian ruble. Also, terrorist organizations use various means of financing to boost their campaigns and recruit members. For example, in an open source investigation, an ISIL (Islamic State of Iraq and Levante) propa-ganda website was used to request bitcoin donations. Bitcoin technology prevents the identification of the owner of bitcoin addresses. In Israel it was found that, through the support of third parties, terrorist organizations made payments to people arrested in the country. These payments amounted to tens of thousands of ILS (Israeli New Shekel) and were a reward received by individuals and their families for committing terrorist acts and continuing to promote the activities of the terrorist organization (Force, 2018a).
3.1.13. Channels Some distribution channels have characteristics that expose the entity
to a greater risk of ML and FT. These characteristics are non-face-to-face registration, operation through third parties, user anonymity, fast trans-actions, limited human intervention, a high number of transactions and international presence. Criminals have demonstrated adaptability and opportunism in finding new channels to launder the proceeds from their illegal activities and to finance terrorism. As the internet increasingly be-comes a worldwide phenomenon, commercial websites and internet pay-ment systems are potentially subject to a wide range of risks and vulnerabilities that can be exploited by criminal organizations and terrorist groups, as mentioned in the Force (2008a) document.
3.1.14. Geographic zone Although many financial institutions may have detected risk areas
based on their historical information, other related typologies can be observed. For example, the impact of terrorist events may be greater for countries with larger populations because there are more people to intimidate (Sandler & Enders, 2008). In addition, several features can make a specific geographic zone more vulnerable to money laundering and terrorism financing. Some of these features are the corruption prevalence rate, crime incidence rate, marginalization index, Gini index, access and use of financial services, peace index and the average number of active cartels or criminal groups.
3.1.15. Other typologies Other variables with important typologies related to ML and FT
include: whether the customer shares a physical address with another customer, amount of transactions, frequency of operations, volatility in the amount and number of transactions, asset turnover, whether legal persons have a common representative, whether customers have operations with the government and whether the relationship between companies makes economic sense.
J.-d.-J. Rocha-Salazar et al.

Expert Systems With Applications 169 (2021) 114470
6
3.2. Methodology
The shortage of information on historical money laundering and terrorism financing cases means that it is appropriate to treat them as latent variables3. As explained in section 2, unsupervised algorithms are the most suitable models to process the typologies related to the latent crimes of ML and FT.
In this research, the proposed methodology involves three phases, as shown in Fig. 1:
In Phase I, risk metrics are assigned to the variables following the fuzzy logic and typologies described in Section 2. Then in phase II, four unsupervised algorithms are used to form risk clusters. Finally, in phase III the riskiest cluster identified by the algorithm with the best perfor-mance will be filtered using an indicator of abnormality based on the variance of the variables. A more detailed explanation of these phases is given below.
3.2.1. Phase I—assigning risk metrics using fuzzy logic and typologies Fuzzy logic is applied to the process of defining risk metrics to deal
with the uncertainty that could arise when knowledge in the chain of reasoning is missing, more detailed typologies are not identified, or data is incomplete or inaccurate.
The process is the following: First, compliance officers, crime analysts, and fraud detection com-
mittees assign a risk metric rv ∈ N to a certain value v˝ of the variable x. For example, the “type of currency” variable can take the values USD dollar, Mexican peso, Chinese yuan, euro, etc., and can vary from one customer to another. The risk metric for each of these values is deter-mined according to the typologies described in Section 3.2. So, the riskier the currency, the higher the assigned risk metric.
Then, the same panel of experts decides the level of uncertainty α ∈N for each risk metric. Thus, the risk metric for each value of the vari-able x will be given by the fuzzy rule in the interval [rv − α, rv + α]. The fuzzy rule will be generated by the continuous uniform distribution with mean “rv” and variance α2
3 . The value α models the uncertainty present in the variable. The
above fuzzy rule, in canonical form following Zadeh (1983), is expressed as follows:
cf=Δ If var(x)rv∕= 0 then rx
v ∈ [rv − α, rv + α] where var(x)rv is the
variance of x with the risk metric rv assigned and rxv is the risk with
uncertainty assigned to each value of x. When fuzzy logic is applied, a range of probable values for the risk
metric are obtained.
3.2.2. Phase II—unsupervised clustering and quality Once the risk metrics have been assigned a level of uncertainty, strict
competitive learning, self-organizing-map, C-means and neural gas are used for the clustering process. These are unsupervised algorithms commonly used in a neural network approach (Du, 2010),
A brief explanation of these algorithms is the following, Strict Competitive Learning: This is a two-layer neural network that
finds the centroids ck of the clusters, minimizing the Euclidean distance between these centroids and the input vectors yp.
Self-Organizing-Map: This algorithm calculates the Euclidean distance between the neuron k and the input vector yp finding the winning neuron w by the nearest-neighbor rule. When the winning neuron is found, all neurons are updated using the Kohonen learning rule.
C-Means: This neural network finds the centroids ck of the clusters, minimizing the average distance between the input vectors yp and the centroids.
Neural Gas: This algorithm uses neighborhood ranking to find the centroids ck. It calculates the Euclidean distance between the input vectors yp and the centroids to find the neighborhood rank. Each neuron is updated according to its rank, which can range from 0 to K − 1.
Where p = 1,2, ...,m and k = 1, 2, ..., K; m is the number of obser-vations and K the number of clusters.
Internal validation is used to select the clustering technique that performs best. The compactness and separation of the clusters in each technique will be assessed. Compactness measures how closely the input vectors yp are grouped in the cluster and separation measures how distant (far away) the clusters are from each other. In the literature re-view, several techniques were identified that can be used to evaluate these attributes simultaneously, such as the Calinski-Harabasz index (CH), I Index (I), Dunns Indices (D), SilhoutTe Index (S) and Davis- Bouldin Index (DB) (Hassani & Seidl, 2017). For the purposes of this study, the CH index will be used due to its high level of interpretability. The structure is the following:
CH =
∑id2(ck, g)
/(K − 1)
∑i∑
y∈Cid2(ck, y)
/(m − K)
(1)
where D is the input dataset, m is the number of points in D, g is the center of the whole dataset D, K is the number of clusters, ck is the center of cluster Ck and d is the distance between two points. The numerator expresses the degree of separation and the denominator the level of compactness. The higher the index, the greater the quality of the clus-tering technique.
3.2.3. Phase III—implementation of an abnormality indicator to filter the riskiest cluster
After performing the clustering process and identifying the riskiest cluster, an indicator of abnormality is applied. The purpose of this in-dicator is to detect any abnormal behavior that signals the presence of crime. According to Berliner (1955), crime is a form of social deviation that can include mental abnormality. In financial institutions, the detection of abnormal financial behavior is based on two types of comparisons, self-comparison and peer-group comparison (Tianqing, 2006). Self-comparison consists of comparing the behavior of a certain individual with their own history to identify any unusual behavior. In contrast, peer group comparison consists of comparing the behavior of one individual with that of a similar group. Self-comparison can be performed by including the standard deviation of the amounts and op-erations in a certain period. This can then be improved by considering a comprehensive set of variables that can provide a complete picture of the customers profile. In addition, when clustering techniques are used, the peer-group comparison is performed naturally during the clustering process since this identifies distance-based outliers, which are in-dividuals who lie farther from their cluster. An issue with these tech-niques is that they do not identify atypical customer behavior that could however be recognized through examining atypical movements in the characteristics of transactions over a certain time period or in a partic-ular economic environment, geographic zone or group. For example, in Mexico the currencies most used by customers are the Mexican peso, the US dollar because of its proximity to the United States and the Euro because of the size of the European economy. If some individuals were to suddenly perform transactions in Russian rubles or Chinese yuans, the common pattern would break and the chances of these transactions being suspicious would increase. In this case, the variance of the cur-rency variable would increase in the period under analysis and become a relevant variable in the detection of crime. To give another example, the common pattern over a period could be the use of debit and credit products by individuals. The sudden use of a dollar account could trigger an alert, and the product variable would become relevant because of the variance.
With this in mind, an indicator of abnormality that assigns weights in accordance with the variances of the variables is proposed and this will
3 Treating money laundering and terrorism financing as latent variables does not mean that they do not exist, but rather that the number of confirmed cases of these crimes is very small compared to the total.
J.-d.-J. Rocha-Salazar et al.
Expert Systems With Applications 169 (2021) 114470
7
be used to further filter the results from the riskiest cluster4. The construction of the indicator of abnormality is as follows, Let x1, x2,⋯, xn be n variables with the risk metrics and uncertainty
already assigned for m observations. When applying principal compo-nent analysis, a set of ncomponents ordered from highest to lowest variance is generated, that is,
Z = {z1, z2,⋯zn/var(z1) > var(z2) > ⋯ > var(zn)} (2)
The resulting components will be a linear combination of the original variables, that is,
z1 = a1,1x1 + a1,2x2 + ⋯ + a1,nxnz2 = a2,1x1 + a2,2x2 + ⋯ + a2,nxnzn = an,1x1 + an,2x2 + ⋯ + an,nxn
(3)
The coefficient vector ai = (ai,1, ai,2,⋯, ai,n) is the eigenvector of the variance–covariance matrix that maximizes the variance of component zi and whose module is equal to 1. Each component will have a variance equal to the eigenvalue associated with its own load vector, that is, var(zi) = λi.
From the total components generated, only those whose proportion of cumulative variance is at least π are selected. That is,
Sq =
{
z1,z2,⋯zq/
var(z1)>var(z2)>⋯>var(zq)
and∑q
i=1var(zi)∑n
i=1var(zi)≥π
}
(4)
The number of components selected is expected to be less than the total number, q<n.
The property that emerges from the spectral decomposition will be used to construct the indicator of abnormality. That is, the square of the charges of the eigenvector ai associated with the xj represents the contribution of the variance of zi to the variance of xj, that is,
var(xj)=
∑n
i=1
(ai,j
)2λi (5)
When considering some of the terms in the expression above, let us
say q terms, the sum is called communality, which shows the amount of variance accounted for by the q selected components. With these com-munalities it is possible to construct an indicator for a certain observa-tion p as is seen in the following expression,
IRp =xp,1
[∑qi=1λi
(ai,1
)2]+ xp,2
[∑qi=1λi
(ai,2
)2]+ ...+ xp,n
[∑qi=1λi
(ai,n
)2]
∑qi=1λi
(6)
Rewriting the above equation,
IRp =λ1∑n
j=1
(a1,j
)2xp,j + λ2∑n
j=1
(a2,j
)2xp,j + ...+ λq∑n
j=1
(aq,j
)2xp,j∑q
i=1λi(7)
It can be seen that the variables are weighted using their commu-nalities and the total variance of the selected components. Thus, the more representative the cumulative variance of the components, the greater the communalities of the original variables. This means that variables with large variances will reflect large communalities in the indicator.
The latter can also be seen in the decomposition of the variance of the components, as shown below,
var(zi) = λi =∑n
j=1
(ai,j
)2var(xj)+∑n
r=1
∑n
j=1, j∕=r
ai,rai,jcov(xr, xj
)(8)
Thus, an indicator of abnormality can be constructed for each p observation in the dataset and this contains weights that reflect the variances of the original variables. These weights will update themselves according to the atypicality and fluctuations of the variables in the period under analysis. The greater the variance of the variables, the greater the atypical behavior. Similar logic is used in financial markets where risk is associated with the variance in the value of a portfolio (Engle, 2004). It is important to note that the square of the loadings of the eigenvectors produces weights that allow us to better differentiate the effects of abnormality of the variables and therefore reduce ambi-guity in the results. Another advantage is that by selecting q compo-nents, the information on the original variables is represented through a smaller number of variables in the abnormality indicator. This is helpful when a large number of variables are considered in the analysis.
Fig. 1. Methodology diagram. Source: Own elaboration.
4 A similar filtering process is suggested by the authors in Larik and Haider (2011) but with an anomaly index based only on distances and transaction features.
J.-d.-J. Rocha-Salazar et al.

Expert Systems With Applications 169 (2021) 114470
8
The indicator of abnormality is used for money laundering and terrorism financing. It can be seen that because the norm of the eigen-vectors is equal to 1, the squares of the eigenvector loadings are on a scale from 0 to 1, thus if the metrics are assigned in the interval [0,100] the indicator of abnormality will be between 0 and 100.
4. Data processing
The idea behind the proposed methodology is to track ML and FT at the transactional level, daily and in real time. This methodology is currently run in an important financial institution in Mexico with mil-lions of daily transactions. To illustrate how this methodology works, random samples were extracted from the data warehouse of this Mexican institution. To train the algorithms, 26,751 and 3527 trans-actions, with their associated features, were selected randomly from January 2020 for natural and legal persons, respectively. To measure the prediction accuracy, test sets of 1000 and 600 transactions were selected randomly from February 2020 for natural and legal persons, respec-tively. The samples of 1000 and 600 were the first transactions after the final transaction in the training sets.
The detection system works by connecting the code in Python and the data warehouse. It pulls the information from the data warehouse into the Python environment and develops the following algorithm. Table 1
In the country being analyzed, payment periods are biweekly (15 days approximately), made in the middle and at the end of the month. A month (43,200 min approximately) is considered the optimal period to train the algorithm and capture some anomalous behavior by customers since it includes two biweekly periods in which natural and legal persons are responsible for important cash inflows and outflows using different
financial means. Table 2 shows the attributes/variables of customers’ transactions
extracted from the data warehouse to feed the model. These attributes are considered according to the variables and typologies described in Section 3.1.
15 days is the minimum time needed to guarantee that the trans-actional variables include amounts and operations that take place at least once biweekly.
Tables 3 and 4 show some descriptive statistics on the risk metrics assigned to the training and test samples. For this analysis, the compli-ance experts assigned final metrics of between 0 and 100, to obtain a score in the same interval.
4.1. Geographical risk index
The state of operation and residency metrics were assigned according to a risk index constructed using Mexican indicators such as the cor-ruption rate, Gini index, peace index, criminality rate, access and use of financial services and the average number of active cartels.
The prevalence of corruption rate expresses the number of in-dividuals involved in an act of corruption per 100,000 inhabitants and has been generated by the National Institute of Statistics and Geography (NISG) since 2013. The crime incidence rate expresses the number of crimes that have occurred among people aged 18 or over per 100,000 inhabitants and it has also been generated by the NISG since 2010. The marginalization index expresses the intensity of marginalization considering various socio-economic indicators and it has been generated by the National Population Council since 1990. The Gini index expresses the level of economic inequality in society and has been calculated by the National Council for the Evaluation of Social Development Policy
Table 1 The algorithm in the system.
1. Take the transactional analysis (transaction of interest) and identify the time at which it was performed
2. Determine whether the person is legal or natural to focus on that group of customers
3. Read all transactions made in the last 43,200 min (one month) starting from the transaction of interest
4. Assign the risk metrics using fuzzy logic and the typologies explained in section 2
5. Run Principal Component Analysis through a centered SVD of the covariance matrix
5.1 Detect the components that account for at least 80% of the variance 5.2 Extract the variance of the selected components and their associated eigenvectors 5.3 Determine the communalities and the weights of the variables in the indicator of abnormality
6. Identify the time of the transactional analysis (transaction of interest)
7. Cluster the transactions, including the transaction of interest, made in the last 43,200 min (one month) starting from the time of this transaction, using the aforementioned neural network techniques
8. Take the transactional analysis again 9. If the analyzed transaction is in the riskiest cluster
9.1 Then, apply the indicator of abnormality
9.1.1 If the value of the indicator of abnormality is >66.66
9.1.1.1 Then, classify it as risky and trigger an alert 9.1.1.2 Otherwise, classify it as not risky and do not trigger an alert
9.2 Otherwise, classify the transaction as not risky and do not trigger an alert
10. Take the next transaction to be analyzed
Source: Compiled by the author.
J.-d.-J. Rocha-Salazar et al.

Expert Systems With Applications 169 (2021) 114470
9
(NCESDP) since 2010. The statistics on the use of and access to financial services have been generated by the National Banking and Securities Commission (NBSC) since December 2009. Access refers to the pene-tration of the financial system in terms of the infrastructure available to offer financial services and products, that is, to the points of contact between the institutions (access channels) and the population, from a supply perspective. Use refers to the purchase or contracting, by the population, of one or more financial products or services, as well as to the frequency with which these are used. This refers to the demand for financial services, which, in turn, reflects the behavior and needs of the population. The peace index is an indicator that reflects the measure of peace in a given region. It has been calculated in recent years by the Institute for Economics and Peace (IEP). The average number of active cartels is calculated on the basis of the number of active cartels in each six-year period generated by the Attorney General’s Office through the
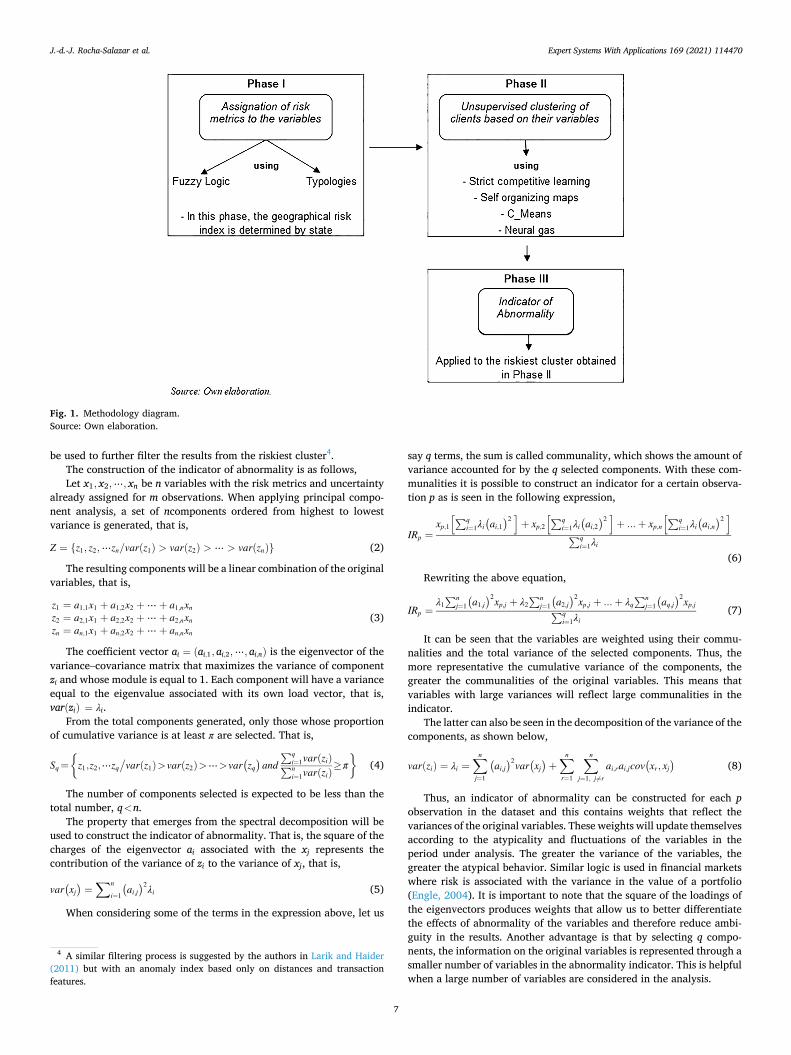
Law on Transparency and Access to Information. It has been generated since the six-year period beginning in 1976. These indicators are used to estimate a state risk index for Money Laundering and Terrorism Financing. It is based on the hypothesis that a higher value of these indicators results in a greater risk of exposure to ML/FT crimes5. Fig. 2 shows the heat map of the estimated geographical risk index by state in Mexico.
5. Results
The traditional method used by the financial institution to detect ML and FT consists of a system of rules involving certain thresholds. For each transaction, the system produces a score between 0 and 100 to evaluate the risk of the customer. The risk thresholds used by the financial institution are from 0 to 33.33 for low risk, from 33.33 to 66.66 for medium risk and from 66.66 upward for high risk. If the customers receive a score of 66.66 or higher for their transaction, they are classi-fied as risky and suspicious and their case is sent to the Financial In-telligence Unit (FIU). The FIU then oversees the conducting of a more rigorous investigation. The model proposed in this article is adapted to the institution’s own risk scale, following the same logic to ensure it is comparable. The value of 66.66 has been retained as the abnormality threshold. This is possible due to the high detection precision registered in the total population of transactions. The accuracy of this threshold is constantly monitored to detect possible changes over time.
To extend the comparison, the thresholds of 50 and 75 are estab-lished in addition to the official threshold of 66.66. Customers were separated into two groups of people with similar characteristics: natural and legal persons. Test sets incorporated 129 and 241 cases from the year 2019 that had already been confirmed as money laundering and that involved natural and legal persons, respectively. The confirmed cases are mainly related to acts of corruption, tax evasion, phantom companies and counterfeiting.
Regarding terrorism, no cases have been reported in Mexico. No international terrorist group has expressed interest in attacking national or foreign interests. The risk of terrorism financing remains latent and is based on the fact that Mexico, due to its geographical position, could be used as a logistical, operational or financial platform to attack the United States. As a result, the test sets for the models being used to detect terrorism financing did not contain any real cases. Instead, they included 27 and 25 cases, involving natural and legal persons, respectively, already confirmed as being linked to organized crime and cartels, collected between 2015 and 2019. The cases related to organized crime and cartels were used as a proxy for terrorism financing based on the strong similarities and relationships that may exist between them (Shelley & Picarelli, 2005; Hausken & Gupta, 2015; Monteleone, 2016).
Table 5 shows the CH index for the different clustering algorithms. It can be observed that, for the selected samples, the algorithm with the best clustering quality based on compactness and separation is C-Means. Thus, the C-Means algorithm is used for the clustering process.
The following tables show the confusion matrix for the different scenarios:
Table 6 shows that for the detection of money laundering by natural persons, the proposed model produces far fewer false positives than the current model for all three thresholds. The same pattern is observed for legal persons in Table 7.
Tables 8 and 9 show that the proposed model produces far fewer false positives than the current model for the threshold of 50. For the rest of the thresholds, the two models perform similarly. It is interesting to note that the algorithms begin to identify criminal cases up to the threshold of 50. This reflects the fact that the algorithms are designed using terrorism
Table 2 Key Variables of the Integral Model.
Variable Description
Client Type of Client Refers to legal or natural person Age Age of the client at the moment of the transaction Source of Income Main source of income. This can be salary, commissions,
income from sales, etc. Nationality Nationality of the client Sense of Operativity Indicates whether the salary/income from sales matches
the operations of the client Operations with the
government Indicates whether the transaction is related to the government
Common Address Refers to whether the client has an address shared with another one
Time of Relationship Years of financial relationship with the institution Client Segment The financial segment in which the client belongs Politically Exposed
Person Refers to whether the client is politically exposed or not
Economic Activity Economic Activity of the client at the moment of the transaction
Suspicious Activity Report
Indicates whether the client has appeared in the suspicious activity report in the last month
Product or Service Type of Product Product related to the client’s transaction Type of Subproduct Subproduct related to the client’s transaction
Transactions Type of Transaction Type of operation performed by the client Currency Currency used in the operation Monetary Instrument Monetary instrument used in the transaction Channel Channel through which the transaction was made Volatility of Amount Standard deviation of the amount involved in the client’s
transactions in the last 15 days Volatility of Operations Standard deviation of the operations made by the client
in the last 15 days Sum of Sending The total amount of money sent in the last 15 days in
Mexican pesos Sum of Receiving The total amount of money received in the last 15 days in
Mexican pesos Num. of Sending The total number of transactions sent in the last 15 days Num. of Receiving The total number of transactions received in the last
15 days R-S Sum number received-Sum number sent (number of
transactions) A-A Amount of transaction-average of transaction amounts in
the last 15 days
Geographic Zones State of Residency State where the client lived at the moment of the
transaction State of Operation State where the client performed the transaction Municipality of
Residency Municipality where the client lived at the moment of the transaction
Municipality of Operation
Municipality where the client performed the transaction
Country of Residency Country where the client lives at the moment of the transaction
Source: Compiled by the authors.
5 Because some series were not generated in the same periods or there was no information for 2020, series decomposition techniques and forecasts with ARIMAS and SARIMAS were implemented (Boot, Feibes, & Lisman, 1967).
J.-d.-J. Rocha-Salazar et al.

Expert Systems With Applications 169 (2021) 114470
10
financing typologies and trends that are partially related to those of organized crime and cartels. It also shows that the risk of terrorism financing in Mexico is low. Despite this, the comparison at the threshold of 50 shows how the proposed model could produce a smaller number of false positives through detecting real cases of terrorism financing.
With the confusion matrixes, it is possible to calculate measures that allow us to compare the models more accurately. These measures are the error rate (ERR) and accuracy (ACC) rate. The error rate is calculated as the number of incorrect predictions divided by the total number of ob-servations and expresses how badly the model predicts cases of money laundering and terrorism financing. The best error rate is 0 and the worst is 1. The accuracy rate is calculated as the total number of correct pre-dictions divided by the total number of observations and expresses how well the model predicts true cases of money laundering and terrorism financing. The closer ACC is to 1, the more accurate is the model. When the test set is unbalanced, as in this study, a model that simply predicts that every testing data point is in the majority class would seem to have a high accuracy rate. To avoid this, a balanced accuracy (BACC) measure is used. Balanced accuracy is calculated as the average of the true pos-itive and negative rates (Wei & Dunbrack, 2013). Thus, the measure 1- BACC is the balanced error rate (BERR).
Tables 10 and 11 show the balanced error rate and accuracy rate for the detection of money laundering in natural and legal persons. In
general terms, the proposed model is more accurate than the current model for both types of person, except for the threshold of 75 in legal persons. The error rate is also lower in the proposed model than in the current model for both types of person, except for the threshold of 75 in legal persons.
Tables 12 and 13 show the balanced error and accuracy rates for the detection of terrorism financing by natural and legal persons. In general terms, the proposed model has the best performance for the threshold of 50 based on both the error rate and accuracy rate. It is possible that, when the algorithm starts to be fed with real cases of terrorism financing, the difference will be more significant in other thresholds.
The results show that including additional non-transactional vari-ables and filtering by the indicator of abnormality leads to a lower number of false positives compared to the rule system used by the institution.
It is important to note that natural persons represent around 98% of the total number of customers in any financial institution, including the institution in this article. Additionally, there are many more cases of suspected ML than suspected FT, and these require significant human capital, time and financial resources to conduct in-depth investigations. Thus, most of the efforts to detect these crimes are focused on cases involving natural persons and related to ML. The proposed model significantly reduces the number of false positives for natural persons
Table 3 Descriptive statistics on the key variables for the training set.
Variable Natural Persons ML Legal Persons ML Natural Persons FT Legal Persons FT
µ σ µ σ µ σ µ σ Client N = 26,751 N = 3,527 N = 26,751 N = 3,527 Age 48.86 21.38 47.44 21.35 24.65 13.12 20.49 11.63 Source of Income 36.89 19.50 42.06 22.47 20.59 11.83 18.72 12.21 Nationality 34.89 39.66 18.05 25.40 22.73 20.31 8.20 13.32 Sense of Operativity 34.43 28.40 29.67 26.60 16.34 13.78 14.10 12.76 Operations with the government 20.90 23.17 17.78 20.19 9.53 9.74 14.53 11.81 Common Address 32.97 29.20 21.78 23.85 17.63 16.10 15.02 12.38 Time of Relationship 44.66 36.31 23.75 16.76 27.65 18.65 10.98 8.90 Client Segment 40.92 24.61 41.84 22.52 16.04 12.99 17.76 12.79 Politically Exposed Person 25.69 33.71 17.24 24.24 13.03 17.29 13.70 12.48 Economic Activity 40.20 25.77 46.66 29.23 21.88 14.20 21.48 15.40 Suspicious Activity Report 29.41 22.93 31.48 23.02 14.72 11.37 15.83 11.27
Product or Service
Type of Product 36.83 19.81 33.43 16.09 20.55 12.00 14.18 8.47 Type of Subproduct 24.96 23.75 32.80 32.42 12.66 12.52 14.96 15.76
Transactions
Type of Transaction 20.87 24.82 18.73 25.89 16.93 15.19 9.34 12.84 Currency 40.03 24.69 35.87 21.41 20.10 13.13 13.98 9.79 Monetary Instrument 41.66 26.00 43.41 25.73 24.83 14.16 19.53 13.29 Channel 39.98 22.73 39.87 20.15 16.45 11.84 19.68 10.76 Volatility of Amount 44.65 19.96 53.93 26.12 21.06 12.46 26.68 16.06 Volatility of Operations 46.96 20.22 40.01 19.58 22.49 12.43 18.31 12.33 Sum of amounts sent 30.60 21.24 33.33 19.97 15.57 10.53 17.16 9.98 Sum of amounts received 31.31 22.00 33.76 20.16 15.92 10.77 17.33 10.10 Num. transactions sent 34.81 24.59 30.81 23.88 18.84 12.19 16.78 12.01 Num. transactions received 32.34 23.28 31.74 23.46 17.62 11.70 17.34 11.74 R-S 32.92 19.79 31.05 19.22 16.96 10.02 16.07 9.75 A-A 38.36 21.19 37.98 20.35 18.77 9.78 18.56 9.30
Geographic Zones
State of Residency 33.97 23.04 37.27 23.07 14.36 11.84 22.20 13.69 State of Operation 42.11 22.66 51.29 24.98 16.94 12.23 29.04 15.83 Municipality of Residency 40.35 36.74 32.43 35.12 18.69 16.58 18.27 18.47 Municipality of Operation 48.82 36.37 52.26 36.25 21.99 17.48 28.37 19.02 Country of Residency 22.79 31.07 16.42 22.93 10.70 16.29 13.30 11.75
Source: Compiled by the authors. “µ” and “σ” are the mean and the standard deviation of the sample, respectively. “N” is the number of observations.
J.-d.-J. Rocha-Salazar et al.

Expert Systems With Applications 169 (2021) 114470
11
involved in ML and therefore the cost for the financial institution also decreases considerably. The methodology proposed has some advan-tages over the traditional methods and previous models. First, it allows cases of money laundering and terrorism financing to be detected at the right moment in the transaction, preventing illegal resources from being further integrated into the financial system. Second, financial in-stitutions can add as many variables and typologies as they desire. Thus, principal component analysis will express the information from the original variables in a smaller number of components, optimizing computational work. Third, although the test set requires some cases to validate the accuracy of the methodology, the training set does not. This allows the methodology to be replicated by financial institutions that do not have an adequate sample of real cases due to privacy policies and restrictions. Finally, the rarity or scarcity of actual cases of money laundering and terrorism financing does not represent a problem for the proposed methodology since the process of training and constructing the abnormality indicator is based on unsupervised techniques.
6. Conclusions
In this article, a new methodology has been proposed that considers the typologies that have been described in FATF reports but that had not been included in previous studies, improving the self-comparison. It also proposes an indicator of abnormality based on the variance of the
variables and this enhances the group comparison in the clustering process. The results show a significant reduction in the number of false positives and greater accuracy compared to the previous rule-based method.
Currently, the proposed model involves financial institutions analyzing cases using a threshold of 66.66, the same threshold used by the institution over the last 20 years under the previous method. The most significant benefits of the proposed model are the reduction in costs, human capital and research time due to the improvement in the prediction rate.
Given the satisfactory results of this study, financial institutions are recommended to use all or some elements of this research to optimize the cost of crime detection by considerably reducing the number of false positives. Institutions are also recommended to be careful in relation to the limitations of this methodology. One of these is the extensive amount of information required on customer transactions. This information is often unavailable due to privacy policies or because the institution does not have a good data structure or data cleansing methodology. Another limitation of this methodology is the absence of confirmed cases of terrorism financing. This prevents us from seeing how the model would perform if it were applied in a country with real cases.
Future research is aimed at applying the model in European and Middle Eastern countries to analyze whether the proposed methodology performs as well in detecting real cases of terrorism financing as it does
Table 4 Descriptive statistics on the key variables for the test set.
Variable Natural Persons ML Legal Persons ML Natural Persons FT Legal Persons FT
µ σ µ σ µ σ µ σ Client N = 1,000 N = 600 N = 1,000 N = 600 Age 77.16 29.34 81.83 25.78 41.44 17.60 40.48 14.96 Source of Income 75.33 30.25 71.74 28.97 42.54 17.05 35.03 16.28 Nationality 53.75 43.98 64.03 42.93 32.28 22.55 32.29 22.43 Sense of Operativity 74.65 33.25 68.88 32.89 37.42 17.45 34.22 17.44 Operations with the government 40.33 29.99 46.28 29.45 27.73 22.64 37.20 21.95 Common Address 19.10 21.61 19.30 21.59 11.82 16.23 16.13 16.73 Time of Relationship 73.25 36.29 58.62 39.07 42.34 18.69 29.32 20.59 Client Segment 66.62 28.24 69.37 27.13 30.23 16.14 34.81 17.43 Politically Exposed Person 62.90 43.13 62.71 43.25 32.09 22.11 36.89 22.18 Economic Activity 68.85 33.37 76.00 28.60 38.33 19.02 37.52 15.95 Suspicious Activity Report 33.38 21.93 30.31 20.93 16.51 10.96 16.06 11.54
Product or Service
Type of Product 39.32 17.45 38.22 16.33 22.38 10.90 16.70 9.04 Type of Subproduct 63.59 33.83 61.72 33.27 34.36 19.45 29.40 17.74
Transactions
Type of Transaction 54.11 45.01 68.99 39.39 31.91 24.35 34.79 20.56 Currency 63.38 29.89 74.09 25.96 33.97 17.42 34.83 14.69 Monetary Instrument 73.67 29.87 72.74 35.91 42.13 16.13 36.22 19.42 Channel 59.42 29.43 62.05 24.94 27.05 16.21 32.26 15.46 Volatility of Amount 38.34 17.09 46.12 24.54 17.26 11.77 22.01 15.59 Volatility of Operations 46.90 22.84 44.14 19.74 22.02 14.63 20.53 13.09 Sum of amount sent 27.54 17.58 24.69 17.68 15.00 10.77 13.21 11.21 Sum of amount received 30.76 19.01 33.49 21.35 16.60 11.26 17.85 11.80 Num. transactions sent 28.17 27.85 37.19 31.35 17.10 17.79 22.43 20.40 Num. transactions received 29.17 27.14 35.98 20.84 17.44 16.73 20.18 11.68 R-S 37.18 23.45 32.34 19.90 19.89 13.90 17.82 11.70 A-A 37.12 18.21 29.41 19.88 18.25 9.85 15.46 11.11
Geographic Zones
State of Residency 55.73 28.41 50.06 31.71 31.63 19.91 33.62 22.30 State of Operation 32.46 17.77 36.97 21.09 12.43 10.62 20.64 14.56 Municipality of Residency 56.15 40.05 71.72 31.11 30.17 21.89 42.60 18.70 Municipality of Operation 33.73 33.76 49.84 38.09 16.32 19.04 28.70 21.91 Country of Residency 65.11 42.63 54.20 44.08 36.01 24.72 35.07 25.03
Source: Compiled by the authors. “µ” and “σ” are the mean and the standard deviation of the sample, respectively. “N” is the number of observations.
J.-d.-J. Rocha-Salazar et al.

Expert Systems With Applications 169 (2021) 114470
12
Fig. 2. Heat map of geographical risk index by state. Source: Compiled by the author. The geographic coordinates were plotted using QS software. The zones in red represent the areas of highest risk and those in blue the areas of lowest risk.
Table 5 CH index for the clustering process.
CH Natural Persons ML Legal Persons ML Natural Persons FT Legal Persons FT
Strict Competitive Learning 1.367 1.3077 1.4382 1.2621 C-Means 3.4075 3.0816 3.4423 2.9202 SOM 2.6586 2.6359 2.7645 2.6674 Neural Gas 1.1197 1.1817 1.2044 1.1867
Source: Compiled by author.
Table 6 Confusion matrix for natural persons in ML detection.
Proposed Methodology Current Methodology
Threshold > 50 Threshold > 50 Predicted Predicted S U S U
Real S 106 0 Real S 117 12 U 156 738 U 509 362
Threshold >=66.66 Threshold >=66.66
Predicted Predicted S U S U
Real S 106 0 Real S 111 18 U 32 862 U 465 406
Threshold >=75 Threshold >=75
Predicted Predicted S U S U
Real S 55 51 Real S 111 18 U 16 878 U 403 468
Source: Compiled by author. “S” means suspicious and “U” means unsuspicious.
J.-d.-J. Rocha-Salazar et al.

Expert Systems With Applications 169 (2021) 114470
13
Table 7 Confusion matrix for legal persons in ML detection.
Proposed Methodology Current Methodology
Threshold > 50 Threshold > 50 Predicted Predicted S U S U
Real S 240 0 Real S 240 0 U 118 242 U 146 214
Threshold >=66.66 Threshold >=66.66
Predicted Predicted S U S U
Real S 240 0 Real S 240 0 U 49 311 U 121 239
Threshold >=75 Threshold >=75
Predicted Predicted S U S U
Real S 196 44 Real S 240 0 U 45 315 U 86 274
Source: Compiled by author. “S” means suspicious and “U” means unsuspicious.
Table 8 Confusion matrix for natural persons in FT detection.
Proposed Methodology Current Methodology
Threshold > 50 Threshold > 50 Predicted Predicted S U S U
Real S 22 5 Real S 26 1 U 11 962 U 286 687
Threshold >=66.66 Threshold >=66.66
Predicted Predicted S U S U
Real S 0 27 Real S 0 27 U 0 973 U 0 973
Threshold >=75 Threshold >=75
Predicted Predicted S U S U
Real S 0 27 Real S 0 27 U 0 973 U 0 973
Source: Compiled by author. “S” means suspicious and “U” means unsuspicious.
Table 9 Confusion Matrix for legal persons in FT detection.
Proposed Methodology Current Methodology
Threshold > 50 Threshold > 50 Predicted Predicted S U S U
Real S 19 6 Real S 21 4 U 6 569 U 114 461
Threshold >=66.66 Threshold >=66.66
Predicted Predicted S U S U
Real S 0 25 Real S 0 25 U 0 575 U 0 575
Threshold >=75 Threshold >=75 Predicted Predicted S U S U
Real S 0 25 Real S 0 25 U 0 575 U 0 575
Source: Compiled by author. “S” means suspicious and “U” means unsuspicious.
J.-d.-J. Rocha-Salazar et al.

Expert Systems With Applications 169 (2021) 114470
14
in detecting proxy cases (organized crime/cartels). The addition of the cryptocurrency variable would be an improvement in the model. Also, a similar methodology to detect financial resources destined or origi-nating from human trafficking could be applied. Currently Mexico does not fully comply with the minimum standards to eliminate human trafficking but it is making efforts to do so. This makes financial in-stitutions vulnerable to the flow of resources from this crime. When developing the methodology for the detection of human trafficking, its comparison with the algorithm proposed in this article for money laundering and terrorism financing would complement this line of research.
CRediT authorship contribution statement
Jose Jesús Rocha Salazar: Writing - original draft, Formal analysis, Conceptualization, Methodology, Software. María Jesús Segovia-Var-gas: Project administration, Writing - review & editing, Validation, Funding acquisition. María del Mar Camacho-Minano: Visualization, Writing - review & editing, Validation, Resources.
Declaration of Competing Interest
The authors declare that they have no known competing financial interests or personal relationships that could have appeared to influence the work reported in this paper.
Acknowledgements
This research was supported by a grant from the Santander-UCM research project, call 2019, with reference PR87/19-22586.
Appendix A. Supplementary data
Supplementary data to this article can be found online at https://doi. org/10.1016/j.eswa.2020.114470.
References
Aluko, A., & Bagheri, M. (2012). Journal of Money Laundering Control, 15(4), 442–457. Alvarez-Jareno, J. A., Badal-Valero, E., & Pavía, J. M. (2017). Using machine learning for
financial fraud detection in the accounts of companies investigated for money laundering. Working Papers 2017/07, Economics Department, Universitat Jaume I, Castellon (Spain).
Berliner, A. K. (1955). Journal of Criminal Law and Criminology, 46(1). Boot, J. C. G., Feibes, W., & Lisman, J. H. C. (1967). Journal of the Royal Statistical Society,
16(1), 65–75. Buchanan, B. (2004). Money laundering—a global obstacle. Research in International
Business and Finance, 18(1), 115-127. Cao, D. K., & Do, P. (2012). Lecture Notes in Computer Science, 7197, 207–2016. Chandraeva, L. S., Amarasinghe, T. M., De Silva, M., Aponso, A. C., & Krishnarajah, N.
(2020). Fourth international congress on information and communication technology, advances in intelligent systems and computing, 1041, 385–396.
Chen, A. H., & Siems, T. F. (2004). European Journal of Political Economy, 20(2), 349–366. Chen, Z., Van Khoa, L. D., Teoh, E. N., Nazir, A., Kandasamy, E., & Sim, K. (2018).
Knowledge Information Systems, 57, 245–285. Deng, X., Roshan Joseph, V., Sudjianto, A., Jeff, Wu, & C. F.. (2009). Journal of the
American Statistical Association, 104(487), 969–981. Drezewski, R., Sepielak, J., & Filipkowski, W. (2014). Information Sciences, 295, 18–32. Du, K. L. (2010). Clustering: A neural network approach. Neural Networks, 23(1), 89–107. Enders, W., & Sandler, T. (2008). Terrorism, 14(1), 49–58. Enders, W., Sandler, T., & Parise, G. F. (1992). Kyklos, International Review for Social
Sciences, 45(4), 531–554. Engle, R. (2004). American Economic Review, 94(3), 405–420. Financial Action Task Force (2004). Annual Report. Financial Action Task Force (2008a). Money laundering and terrorist financing
vulnerabilities of commercial websites and internet payment systems. Financial Action Task Force (2008b). Terrorist financing. Financial Action Task Force (2008b). Terrorist financing. Financial Action Task Force (2013a). Annual report. Financial Action Task Force (2013b). Anti-money laundering and terrorist financing
measures and financial inclusion. Financial Action Task Force (2013c). Guidance politically exposed persons. Financial Action Task Force (2013d). Money laundering and terrorist financing related to
counterfeiting of currency.
Table 10 Balanced accuracy and error rate for the detection of money laundering in natural persons.
Proposed Methodology Current Methodology
Threshold > 50 Threshold > 50 BERR 0.088 BERR 0.339 BACC 0.912 BACC 0.661
Threshold >=66.66 Threshold >=66.66 BERR 0.018 BERR 0.359 BACC 0.982 BACC 0.663
Threshold >=75 Threshold >=75 BERR 0.250 BERR 0.302 BACC 0.750 BACC 0.698
Source: Compiled by author.
Table 11 Balanced accuracy and error rate for the detection of money laundering in legal persons.
Proposed Methodology Current Methodology
Threshold > 50 Threshold > 50 BERR 0.164 BERR 0.203 BACC 0.836 BACC 0.797
Threshold >=66.66 Threshold >=66.66 BERR 0.069 BERR 0.169 BACC 0.931 BACC 0.831
Threshold >=75 Threshold >=75 BERR 0.155 BERR 0.120 BACC 0.845 BACC 0.880
Source: Compiled by author.
Table 12 Balanced accuracy and error rate for the detection of financing of terrorism in natural persons.
Proposed Methodology Current Methodology
Threshold > 50 Threshold > 50 BERR 0.099 BERR 0.166 BACC 0.901 BACC 0.834
Threshold >=66.66 Threshold >=66.66 BERR 0.5 BERR 0.5 BACC 0.5 BACC 0.5
Threshold >=75 Threshold >=75 BERR 0.5 BERR 0.5 BACC 0.5 BACC 0.5
Source: Compiled by author.
Table 13 Balanced accuracy and error rate for the detection of financing of terrorism in legal persons.
Proposed Methodology Current Methodology
Threshold > 50 Threshold > 50 BERR 0.126 BERR 0.180 BACC 0.874 BACC 0.820
Threshold >=66.66 Threshold >=66.66 BERR 0.5 BERR 0.5 BACC 0.5 BACC 0.5
Threshold >=75 Threshold >=75 BERR 0.5 BERR 0.5 BACC 0.5 BACC 0.5
Source: Compiled by author.
J.-d.-J. Rocha-Salazar et al.

Expert Systems With Applications 169 (2021) 114470
15
Financial Action Task Force (2014). Guidance for a risk-based approach. Financial Action Task Force (2015). Emerging terrorist financing risks. Financial Action Task Force (2017). Guidance anti-money laundering and terrorist
financing measures and financial inclusion. Financial Action Task Force (2018a). Financing of recruitment for terrorist purposes. Financial Action Task Force (2018b). Anti-money laundering and anti-terrorist financing
measures, Mexico. Frick, T. A. (2019). ERA Forum, 20, 99–112. Fronzetti Colladon, F., & Remondi, E. (2016). Using social network analysis to prevent
money laundering. Expert Systems with Applications, 67, 49–58. Gao, Z. (2009). International Conference on Management and Service Science, 2009, 1–4. Global Financial Integrity (2015). Illicit financial flows: the most damaging economic
condition facing the developing world. Gohar, F., Wasi, H., & Usman, Q. (2014). Terrorist group prediction using data
classification. Proceedings of the International Conference on Artificial Intelligence and Pattern Recognition, (AIPR2014), at Asia Pacific University of Technology and Innovation (APU), Kuala Lumpur, Malaysia.
Gopinath, G., & Stein, J. C. (2018). Banking, trade, and the making of a dominant currency. The National Bureau of Economic Research NBER, Working Paper No. 24485.
Hassani, M., & Seidl, T. (2017). Vietnam Journal of Computer Science, 4, 171–183. Hausken, K., & Gupta, D. K. (2015). International Journal of Contemporary Sociology, 52
(2), 141–166. Heidarinia, N., Harounabadi, A., & Sadeghzadeh, M. (2014). International Journal of
Computer Applications, 97(22), 35–39. Ibrahim, S. A. (2019). Stratagem, 2(1). Jancsics, D. (2017). Public Integrity, 19(1), 4–21. Jancsics, D. (2018). Shell companies and government corruption. Global Encyclopedia of
Public Administration, Public Policy, and Governance. Jun, T. (2006). Lecture Notes in Computer Science, 3917, 58–65. Jullum, M., Løland, A., & Bang Huseby, R. (2020). Journal of Money Laundering Control,
23(1), 173–186. Kannan, S., & Somasundaram, K. (2017). Journal of Money Laundering Control, 20(2). Khan, S. N., Larik, A. S., Rajput, Q., & Haider, S. (2013). International Journal of
Computers and Applications, 35(4), 181–187. Koschade, S. (2006). Studies in Conflict and Terrorism, 29(6), 559–575. Larik, A. S., & Haider, S. (2011). Clustering based anomalous transaction reporting.
Procedia Computer Science, 3, 606–610. Lee, A. (2011). World Politics, 63, 203–245. Li, S. H., Yen, D. C., Lu, W. H., & Wang, C. (2012). Computers in Human Behavior, 28,
1002–1013. Liu, R., Qian, X., Mao, S., & Zhu, S. (2011). Research on anti-money laundering based on
core decision tree algorithm. In 2011 Chinese Control and Decision Conference (CCDC) Mianyang (pp. 4322–4325).
Liu, X., & Zhang, P. (2010). International Conference on Multimedia Communications, 2010, 210–213.
Liu, X., Zhang, P., & Zeng, D. (2008). Sequence matching for suspicious activity detection in anti-money laundering. Intelligence and Security Informatics 5075.
Maitland, A. S., Kim-Kwang, I., & Lin, C. (2011). Journal of Money Laundering Control, 15 (1), 85–111.
Martínez-Sanchez, J. F., & Cruz-García, S. (2020). A risk management approach through regression trees (data mining). Journal of Money Laundering Control, 23(2), 427–439.
Monteleone, C. (2016). Global Change, Peace and Security, 28(1), 35–53. Moustafa, T., Abd El-Megied, M., Sobh, T., & Shafea, K. (2015). Anti money laundering
using a two-phase system. Journal of Money Laundering Control, 18(3), 304–329. Nitsch, V., & Schumacher, D. (2004). European Journal of Political Economy, 20(2),
23–433.
Obermaier, F., & Obermayer, B. (2016). Los papeles de Panama. El club mundial de los evasores de impuesto. Barcelona: Península 463.
Ozgul, F., Erdem, Z., & Bowerman, C. (2009). Pacific-Asia Workshop on Intelligence and Security Informatics, 25–30.
Pratt, D. (2010). Terrorism and Political Violence, 22(3), 438–456. Raphaeli, N. (2010). Terrorism and Political Violence, 15(4), 59–82. Raza, S., & Haider, S. (2011). Procedia Computer Science, 3, 987–991. Romaniuk, P. (2014). The RUSI Journal, 159(2), 6–17. Saidi, F., Trabelsi, Z., & Ghazela, H. B. (2018). A novel approach for terrorist sub-
communities detection based on constrained evidential clustering. In 12th International Conference on Research Challenges in Information Science (RCIS) (pp. 1–8).
Sandler, T., & Enders, W. (2008). Economic consequences of terrorism in developed and developing countries. Terrorism, Economic Development, and Political Openness, Cambridge University Press.
Savagea, D., Wangb, Q., Chouc, P., Zhanga, & Yub, X. (2016). Detection of money laundering groups using supervised learning in networks. Computer Science, Social and Information Networks. arXiv:1608.00708.
Secretariat of Finance and Public Credit (2016). First National Risk Assessment. Seymour, B. (2008). Global money laundering. Journal of Applied Security Research, 3
(3–4), 373–387. Shelley, L. I., & Picarelli, J. T. (2005). Trends in Organized Crime, 9, 52–67. Sobreira Leite, G., Bessa Albuquerque, A., & Rogerio Pinheiro, P. (2019). Applied Sciences,
9(22), 4800. Soltani, R., Nguyen, U. T., Yang, Y., Faghani, M., Yagoub, A., & An, A. (2016). A new
algorithm for money laundering detection based on structural similarity. In IEEE 7th annual ubiquitous computing, electronics and mobile communication conference (UEMCON) (pp. 1–7).
Spreutels, J., & Grijseels, C. (2000). 10 EC Tax Review, 10(1), 3–12. Tang, J., & Yin, J. (2005). International conference on machine learning and cybernetics, 6,
3453–3457. Teichmann, F. (2020). Recent trends in money laundering. Crime, Law and Social Change,
73, 237–247. Teichmann, F. (2019). Recent trends in money laundering and terrorism financing.
Journal of Financial Regulation and Compliance. The Guardian. (2016). The Panama papers: how the world’s rich and famous hide their
money offshore. Tianqing, Z. (2006). An outlier detection model based on cross datasets comparison for
financial surveillance. In 2006 IEEE Asia-Pacific conference on services computing (APSCC’06).
Torgler, B., & Valev, N.T. (2006). Corruption and age. Journal of Bioeconomics, 8, 133–145.
Wang, S., & Yang, J. (2007). A money laundering risk evaluation method based on decision tree. In 2007 international conference on machine learning and cybernetics (Vol. 1, pp. 283–286).
Watkins, R. C., Reynolds, K. M., Demara, R., Georgiopoulos, M., Gonzalez, A., & Eaglin, R. (2010). Police Practice and Research: An International Journal, 4(2), 163–178.
Wei, Q., & Dunbrack, R. L., Jr. (2013). PLoS ONE, 8(7). Wei, W., Li, J., Cao, L., Ou, Y., & Chen, J. (2012). World Wide Web, 16, 449–475. Williams, P. (2009). Money laundering. South African Journal of International Affairs, 5
(1), 71–96. Wolfsberg Group. (2006). Guidance on a risk based approach for managing money
laundering risks. Yang, S., & Wei, L. (2010). Journal of Economic Policy Reform, 13(2), 159–178. Zadeh, L. A. (1983). Fuzzy Sets and Systems, 11(1–3), 199–227. Zhang, Y., & Trubey, P. (2018). Computational Economics, 54, 1043–1063.
J.-d.-J. Rocha-Salazar et al.


![Anti-Money laundering & Counter Financing of Terrorism ...OF TERRORISM compliance officer [ ] The Certified Anti-Money Laundering & Counter Financing of Terrorism Compliance Officer](https://img.dokumen.tips/doc/110x75/5f6be6a1bd1e71188621e243/anti-money-laundering-counter-financing-of-terrorism-of-terrorism-compliance.jpg)
![MONEY LAUNDERING & THE FINANCING OF TERRORISM … · MONEY LAUNDERING & THE FINANCING OF TERRORISM GUIDELINES FOR FINANCIAL INSTITUTIONS Update [ISSUED 21 March 2012] Director of](https://img.dokumen.tips/doc/110x75/5f8a139157e51e04580b174b/money-laundering-the-financing-of-terrorism-money-laundering-the-financing.jpg)